Abstract
A novel porous polymer–inorganic hybrid biocomposite with various functional groups (hide substance/chitosan/hydroxyapatite) has been synthesized in simple, economic, and scalable process utilizing leather industry solid waste and seafood industry waste composed with hydroxyapatite. Physicochemical characterization of the material reveals formation of composites with homogenous distribution of the constituents in the material matrix. The composite is hard and porous (with 0.1632 cm3/g slit-shaped mesopores and micropores) having particle sizes 40–80 μm and a Brunauer–Emmett–Teller surface area of 55.54 m2/g. The material is polycrystalline in nature with a fair amount of amorphous substance and less hydrophilic in character than constituent polymers. The dye removal efficiency of the material has been tested with two model dyes, namely, methylene blue (MB) (cationic/basic dye) and sunset yellow (SY) (anionic/acid dye). Optimum adsorptions of 3.8 mg MB (pH 12, RT ≈ 27 °C) and 168 mg of SY (pH 3, RT ≈ 27 °C) have been found per gram of the composite material. Langmuir isotherm and pseudo second order rate models have been found to be the best-fit models to explain the equilibrium isotherm and kinetics of the adsorption process for both the dyes. However, higher and faster adsorption of SY in comparison with MB indicated higher binding efficiency of the material toward the acidic dye. Desorption of dyes from the dye-adsorbed material was studied using a suitable eluent of appropriate pH and recycling for five times showed without loss of efficiency. The prepared composite showed very high dye removal efficiency toward four different commercially used dyes (496 mg/g of Orange-NR, 477 mg/g of Red-VLN, 488 mg/g of Blue-113 dye, and 274 mg/g of Green-PbS dye) from their individual and cocktail solutions. It was also efficient to decolorize dye-bearing tannery exhaust bath. Hence, waste materials generated during industrial processes could be efficiently used for the decontamination of colored wastewater produced by various industries.
1. Introduction
Pollution is a vital issue associated with rapid industrialization, urbanization, and rise in the living standard of civilization. Generation of waste and release of toxic materials are the consequences of ongoing unmanaged developments. Therefore, intelligent efforts are mandatory to prevent environmental deterioration through innovative sustainable avenues.1,2 The leather processing industry has a worldwide negative image because of its pollution potential.3 Processing of every 1000 kg of hide generates ∼750–800 kg of solid waste, most of which are collagenous materials.4 On the other hand, seafood industries generate a substantial amount of crustacean waste, where chitinous material is the prime constituent.5 To avoid serious pollution hazards, both of these wastes are required to be utilized properly. Collagen is composed of triple helical polypeptide chains; each of the chains contains amino, carboxyl, and other hydrophilic and hydrophobic functionalities. Chitosan (Cs) is the most (>75%) deacetylated form of chitin. Presence of amine group and primary and secondary hydroxyl groups makes this biopolymer highly reactive. Hence, both of these highly functional materials are capable to form chemical adducts with various chemicals and biochemicals in several ways, such as forming co-ordinate and covalent bonds, ionic interactions, hydrogen bonding, hydrophobic interactions, and so forth. Moreover, both of these materials are biocompatible, as well as biodegradable and inexpensively available in abundant quantities. Therefore, a suitable, inexpensive biocomposite material having multiple functionalities could be developed for sustainable multipurpose applications by manipulating their physical forms and/or chemical functionalities.
Colored wastewater released by various industries, namely, textile, pharmaceutical, food processing, tannery and various chemical industries, has also been considered to be a fatal hazard to the environment. Most of these dyes used by industries are of synthetic origin and are usually stable and difficult to remove by conventional water treatment processes, for example, flocculation, coagulation, chemical precipitation, membrane separation, chemical and biological oxidation, phyto-extraction, ion-exchange, and so forth. Adsorption in this context has been established as the most efficient, eco-friendly, simple, flexible, and cost-effective technique for the treatment of dye-bearing wastewater.3−10 In this context, a sustainable adsorbent should be efficient, reusable, inexpensive, abundantly available, biocompatible, and biodegradable. However, though activated charcoal has been the most applied adsorbent, high capital investment and processing cost have prompted an increased research interest toward the development of relatively cheaper and effective alternatives to activated charcoal.3 Recently, various approaches have been considered, which include application of natural materials, biosorbents, and waste materials resulting from industries and agriculture. Cs and collagenous material both have significant potential to be an effective adsorbent.4−6,11−14 However, low mechanical strength of these soft polymeric materials could be the prime disadvantage for their large-scale water treatment applications. Hence, it is essential to improve their mechanical properties without sacrificing their adsorption efficiency and biocompatibility.5
Some of the recent studies indicated that hydroxyapatite (HAp) could be effectively used as an adsorbent for the removal of various toxicants from water.15,16 It is an inorganic biocompatible material, extensively used for hard tissue (bone) regeneration, and could be prepared by simple inexpensive techniques. However, low stability and significant pressure drop during filtration because of its low particle size limit its application in field studies. Hence, it is expected that combination of HAp with hide substance (Hs) and Cs should compensate for the drawback of individual materials and may develop a sustainable adsorbent for large-scale application. In practical sense, waste generated by some industries could be effectively employed for the treatment of toxic effluents generated by other industries.1,5−7,11−14
In the present study, we have synthesized and characterized a novel biocompatible bio-inorganic composite material (Hs–Cs–HAp) using Hs from tannery collagenous solid waste, Cs from seafood industry waste, and HAp by a simple, green, and economical process and further examined its efficiency, physicochemical adsorption characteristics, and reusability toward the removal of two different model dyes, namely, methylene blue (MB) (cationic/basic dye) and sunset yellow (SY) (anionic/acid dye). Additionally, to evaluate its practical application potential, we have tested its efficiency toward the removal of four different commercial dyes (primarily used in leather and textile industries) from their synthetic waste liquor and a dye-bearing tannery wastewater collected from a local leather processing unit.
2. Results and Discussion
2.1. General Characterization
The chemical characteristics of the synthesized polymer–inorganic biocomposite have been evaluated from the solid-state (SS) NMR and Fourier transform infrared (FTIR) spectra. The 13C and 15N SSNMR spectra of the composites along with native polymers are presented in Figures S1 and S2. Signals of carbons related to all the constituted amino acids of Hs17 and saccharide framework of Cs18 were distinctly visible in the spectra of the composite materials. Similar observations were also noticed in the 15N-SSNMR spectra. However, the observed broadening of the nitrogen signals in the Hs–Cs–HAp as compared to the native polymers resulted from the alteration of the intra polymeric H-bonds and the formation of new interpolymeric H-bonds during the composite formation. In addition, the 31P signal of PO43– (δ = 2.53 ppm) of HAp only appeared in the SS 31P NMR spectrum of the composite (Figure S3), which supported the existence of both the native polymer in their molecular form in the composite along with HAp. The FTIR spectra of the composite along with the native polymeric components and HAp are presented in Figure S4. Hs is mainly composed of collagen along with some minor proteins, and the Cs is 2-amino polysaccharide. Hence, both of the polymers contain plenty of primary and secondary amine and hydroxyl groups, which are reflected as strong and broad merging peaks at the 3000–3700 cm–1 region of their FTIR spectra. The C–H stretching signals of both the organic polymers have appeared in the region 2850–3000 cm–1. Characteristics amide-I (C=O stretching) and amide-II (C–N stretching and N–H bending) of proteinaceous Hs have appeared at 1660 and 1550 cm–1, and the corresponding Amide-III signal was observed at ±1235 cm–1. The C=O stretching vibration of acetylated group of some (∼20%) of amine units of Cs have appeared at 1637 cm–1, and the characteristic saccharide signals of Cs have appeared in the 1050–1150 cm–1 region. In the spectra of composite material, the highly intense and broad peaks at 1000–1050 cm–1 have appeared because of the stretching of the PO43– signals of HAp; alongside the corresponding bending of the PO43– signals have appeared at 565 and 605 cm–1 as appeared in the individual FTIR spectra of HAp. However, the peak of CO32– (mild amount of CaCO3 formed during the formation of HAp) and bending vibration of adsorbed water at 1643 cm–1 of native HAp are not separately distinguishable in the spectra of composite because of merging with other peaks of the polymers.19 The distinguished features of the spectral pattern of the composite have appeared in the 1500–1700 cm–1 region. The amide-I signals of Hs shifted toward lower frequency and the amide-II signal shifted toward higher frequency, consequently both of them merged with the C=O signals of acetylated amine signals of Cs to form a single broad merging peak at 1650 cm–1. Such shifting of peaks together with variation in relative signals intensities took place due to complex intercomponent interaction between the polar head groups such as −COOH, −OH, −NH2 of the constituent polymers through the hydrogen bond in conjunction with the chelating interaction with Ca2+ and PO43– of the inorganic HAp.
In the X-ray powder diffraction patterns of composite (Figure 1), the presence of strong sharp signal centered at 2θ: 32° (30°–35°), medium intensity signal at 26° and other minor signals at 2θ: 40, 46.6, 49.5, and 53.1° are the characteristics of HAp corresponding reflections at (211), (002), (310), (222), (213), and (004) planes.20−22 Related d-spacing of crystal lattices are specified in Figure 1. However, broad nature of the most of these reflections indicated that HAp in the composite was poorly crystallized. Other crystalline phase appeared at 2θ: 20° (100 plane of Cs), which was found to be significantly weak in the synthesized material compared to the native Cs indicating that the ordered chain alignment of the native Cs has been considerably disrupted through the inter polymeric interaction, making the HAp to form a new material matrix.
Figure 1.
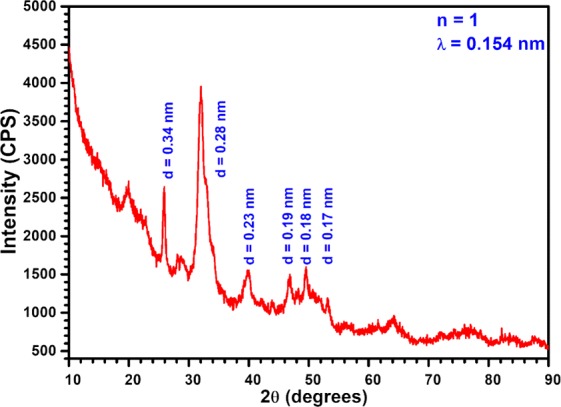
XRD of the composite (Hs–Cs–HAp).
The X-ray photoelectron spectroscopy (XPS) spectra of the composite (Hs–Cs–HAp) and the native HAp are presented in Figures S5 and S6, respectively. The results of the XPS survey scan reveal the elemental composition of each material; Ca, P, and O of native HAp, whereas C, N, O, Ca, and P, are the constituents of the derived composite. However, high resolution scan for each element reveals the insight of the material properties as well as surface functionalities of each solid. The Ca 2p peak of HAp was appeared at ∼342–352 eV as a doublet. The corresponding splitting of the Ca 2p peak (Ca p3/2, 346.2 eV; Ca p1/2, 349.6 eV) with 3.5 eV energy separation resulted due to spin–orbit coupling, indicating typical +2 oxidation state of Ca.19 This peak appeared identically in case of Hs–Cs–HAp, indicating similar chemical environment of Ca in both the solids. Similar observation was also observed for both the samples in the case of P 2p signals of phosphorous representing the P–O bond of PO43– of HAp. The P 2p signals in both samples appeared as a doublet 133.3 eV (P 2p3/2) and 134.2 eV (P 2p1/2) due to the spin–orbit interaction, and peaks were separated by usual 0.9 eV. The de-convoluted O 1s spectrum of the HAp indicates that oxygen is present in the native HAp in two different chemical environments. The main peak centered at ∼530 eV has appeared due to the presence of −OH group of HAp, whereas a tiny peak centered at ∼532.3 eV is attributed to the O–P and O–Ca bond. The O–H bond of bound moisture (if any) also appeared at the same place.19 However, the nature of O 1s XPS spectrum of the Hs–Cs–HAp is markedly different than the same of the native HAp. The main broad peak centered at ∼530 eV attributed to the combined peaks of hydroxyl (−OH) group of Hs, Cs, HAp, and oxygen of different carbonyl, carboxylic, and ether groups (C=O, O–C=O, O–C–O), O–P, and O–Ca bonds. Other tiny peaks at lower binding energies [BE(s)] are resulted due to the presence of some differently positioned biopolymeric oxygenated functionalities.19 C 1s spectrum of Hs–Cs–HAp represents the characteristics features of the constituent polymers. Peak centered at 285.5 eV represents the C–C/H bond of the polymeric backbones. Fitted peak centered at 289 eV represents C–O/N bonds of the polymeric functional groups. The signals of carbons of carboxylic and amide functionalities of the constituent polymers are observed at 290.8 eV.19,23 However, in spite of the absence of carbon in the chemical compositions in native HAp, a very tiny peak of carbon appeared in the XPS scan of native HAp, which was due to the formation of minute amount of CaCO3 during formation of HAp.19 N 1s XPS spectrum also represents the characteristics signals of the polymer matrix. Small peak at BE 395.9 eV represents primary and secondary nonprotonated amine group of the polymer constituents, whereas main peak centered at 399.7 eV attributed to the nitrogen of amide group and cationic (protonated) amines functionalities.
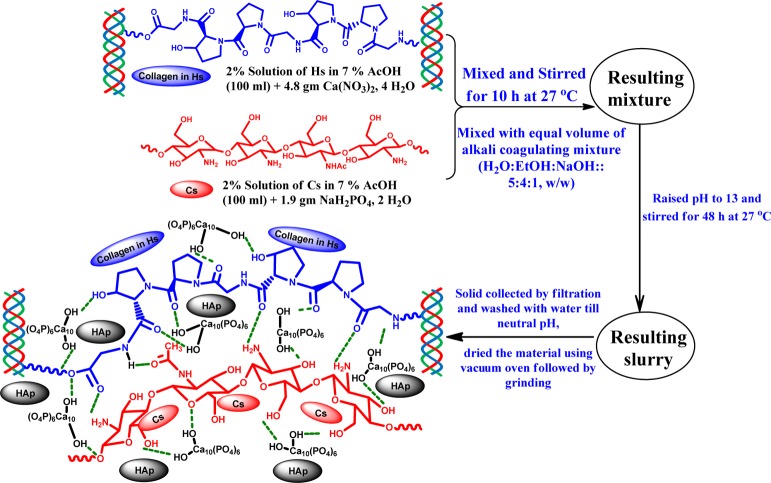
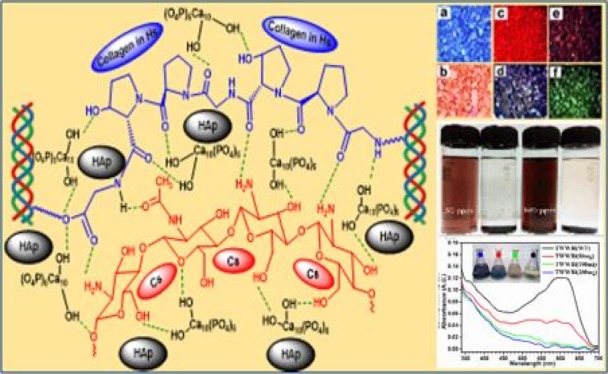
Surface morphology and microstructural analysis of the composite were analyzed by optical (low resolution) and scanning electron microscopy techniques (Figure 2a,b). The results indicated that the material was typically hard polymeric in nature, and the particle size varied within 40–80 μm; the surface of the particles was rough and possessed a fair amount of porosity. No separate either polymeric or inorganic aggregates were observed throughout the composite, indicating homogenous dispersion of each component within the material matrix. The related energy-dispersive X-ray spectrometry (EDXS) analysis (Figure S7) indicated the presence of C, N, O, P, Na, and Ca as expected from the composition of each constituent. Related elemental mapping has indicated homogenous distributions of all the elements confirming uniform distribution of the material components throughout the composites. To observe the material characteristics beyond the general morphology, high-resolution transmission electron microscopy (HRTEM) analysis of the material surface was performed. A typical rodlike crystalline aggregate (Figure 2c) constituting mainly Ca, P, O, and Na (EDXS spectra presented in Figure S8) was widely distributed throughout the composites (noticed at 100 nm magnification level). These were actually distributed crystalline HAp structures in and around the polymeric network.24,25 The selected area electron diffraction (SAED) pattern (Figure 2d) of this crystalline structure revealed typical polycrystalline nature of these aggregates.25,26 Different orientation patterns of the HAp crystal network responsible for polycrystallinity of the material, which were clearly visible at 10 nm magnification level (Figure 2e). Further magnification at 5 nm level, unit cells of HAps crystalline structures became distinctly visible (Figure 2f).27,28 The synthesis of the Hs–Cs–HAp and the intercomponent interaction within the material matrix are presented schematically in Figure 3.
Figure 2.
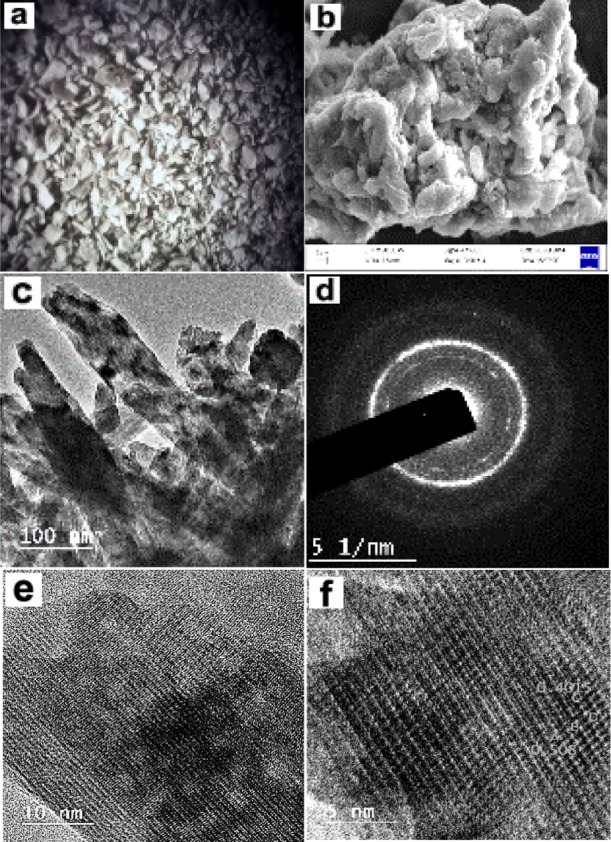
(a) Optical (LR), (b) SEM and (c) HRTEM images at 100 nm scale, (d) SAED pattern, (e) 10 nm scale, and (f) 5 nm scale of the composite material.
Figure 3.
Schematic presentation of synthesis of Hs–Cs–HAp and intermolecular interaction within the composite.
The Brunauer–Emmett–Teller (BET) N2 adsorption/desorption isotherm provided information about the effective surface area of the material along with prevailing porous networks of the material. Nature of the N2 adsorption/desorption curves resulted from the experimentation (Figure 4a) resembled with type-IV BET isotherm with H3 hysteresis loop, indicating the presence of mesopores in the composites having slitlike pore structures.27 However, the presence of micropores (pore diameter <2 nm) in the material was not detected. The BET surface area of the material was found to be 55.54 mm2/g, and av. total pore volume was found to be 0.1632 cm3/g and av. pore diameter of 11.75 nm [derived from the desorption batch of Barrett–Joyner–Halenda (BJH) isotherm; presented in the inset of Figure 4a]. As this N2-based BET method is not able to analyze the presence of macropores (pore diameter >50 nm) in the material, and the Hg infusion study was done to analyze the macroporous structure of the materials. The results (Figure 4b) indicate that apart from the mesopores material also possess a fair amount of pores in 0–130 μm size range.
Figure 4.
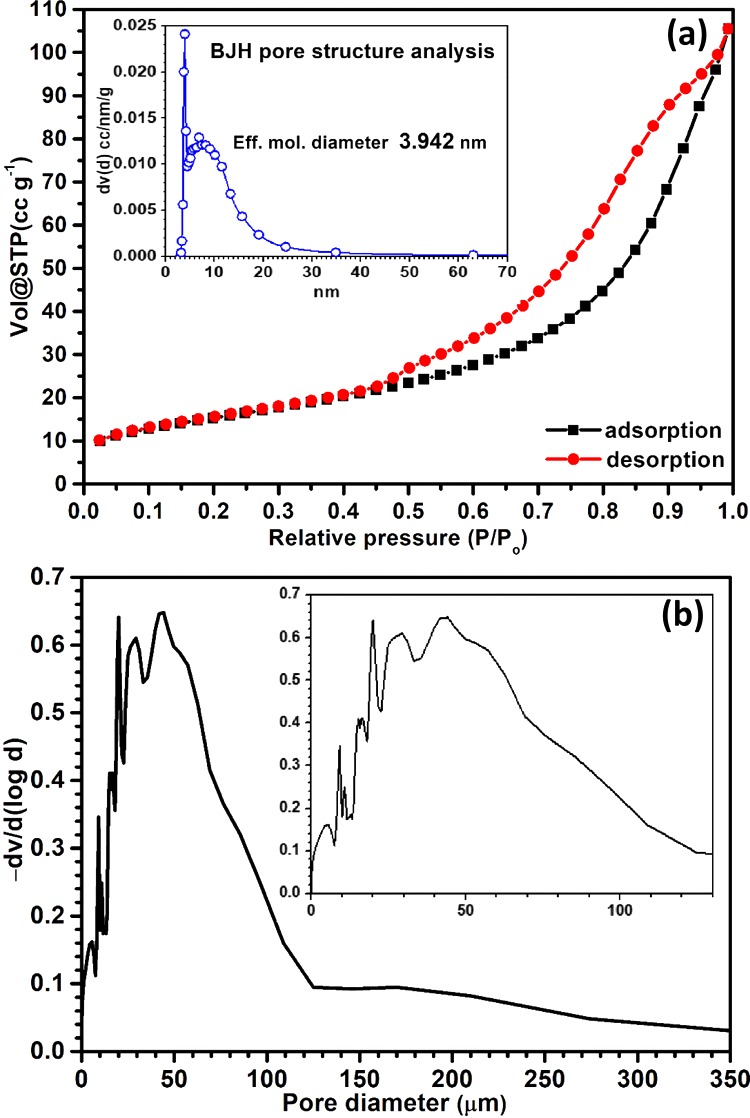
(a) N2 adsorption/desorption isotherm and BJH pore structure analysis (inset), (b) mercury porosity meter analysis.
Thermogravimetric analysis (TGA) of the composite along with native polymers is presented in Figure 5. Initial weight (wt) loss for all the samples from RT to 150 °C was due to evaporation of bound water as both the constituent polymers are hydrophilic in nature. Considerably low wt loss (only 15%) of the composite with respect to native polymers (Hs: 33%; Cs: 24%) indicates that developed composites were far less hydrophilic in nature due to incorporation of inorganic component. The second and most rapid wt loss of the native polymers started at 260 °C for Hs and 275 °C for Cs; these stages continued up to 320 °C for Hs and 380 °C for Cs. Wt loss at that stage (Hs: 34%; Cs: 36%) was due to protein structure denaturation and gelatinization followed by the first stage of degradation.22,29,30 Release of H2O, NH3, CO, CO2, and CH3COOH followed by decomposition of pyranose structure took place in the case of Cs.31,32 The third and final wt loss of native polymers was observed at 315–450 °C for Hs and 380–600 °C for Cs; wt loss at that stage (Hs: 33%; Cs: 40%) of the polymers was attributed to complete destruction of the organic frame work. Release of different cyclo-peptides, pyrroles, indoles, pyrimidines, nitriles and anhydrides, and so forth from the collagenous materials of Hs was reported.22,29,30 Considerable amount of CH4 release apart from different pyrazines, pyridines, pyrroles, and furan were also detected at the final stage of Cs degradation.31,32 In case of composite (Hs–Cs–HAp), after the initial loss of wt due to release of adsorbed water, major wt loss was noted in the temperature range 260–315 °C (stage-II, 13%, sharp), followed by 315–500 °C (stage-III, 23%). Wt losses at these stages were due to denaturation followed by decomposition and combustion of the organic portions. Interestingly, considerable slow wt loss of the composite at stage-III clearly indicated the formation of strong inorganic–polymeric network (matrix), which hindered the thermal decomposition of the polymeric component. Above 500 °C, only 9% (very slow) loss of wt was observed up to 700 °C, and this might be attributed to the combustion of the remaining organic materials along with decomposition of the carbonate generated during HAp formation by the interaction with air. Above 700 °C, the wt of the material remained constant. The residual wt (40%) belonged to the inorganic part of the composite.
Figure 5.
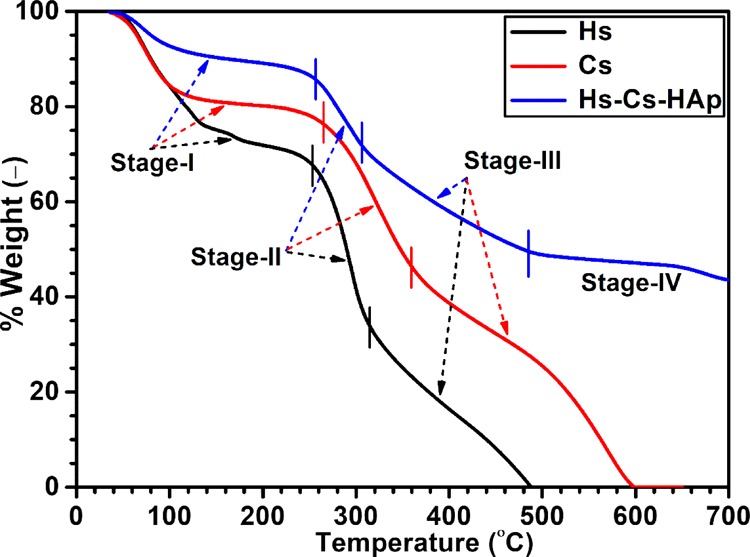
TGA results of composite along with native polymers.
2.2. Adsorption with Model Dyes (MB and SY)
2.2.1. Effect of pH and Temperature
Effects of the initial pH (2–13) and temperature on the adsorption of the model dyes MB and SY from aqueous solution by the Hs–Cs–HAp composites were investigated, and the results are presented in Figure S9. Maximum adsorption of MB at pH 12.0 and minimum in acidic pH was observed, whereas SY showed maximum adsorption at pH 3.0, and its adsorption of SY decreased rapidly with increasing pH: eventually, it showed almost zero adsorption at basic pH. As the ionic interaction was one of the prime mechanisms (impact of hydrogen bonding and electron dispersion in π-cloud might also influence the adsorption process depending upon the chemical nature and structure of the dye molecules) of dye adsorption by the native polymers comprising the composite Hs–Cs–HAp (hydrogen bonding and electron dispersion in π-cloud might also influence the process depending upon the chemical nature and structure of the dye molecules), the resulted pH effect on MB and SY adsorption was also expected. The Hs−Cs−HAp primarily consists of collagenous Hs and Cs; both are cationic polymers, and hence, they acquire highly positive surface charge at the acidic pH (due to spontaneous protonation) and marginally negative charge at the basic pH (due to binding of OH–). Therefore, the cationic dye MB became adsorbed by the material at the basic pH, and the anionic SY dye adsorbed much at the acidic pH. It was found that the composite was quite stable in a wide pH range and hence favorably applicable to wastewater treatment.
Effect of temperature on the dye adsorption process has been reported also in Figure S9. The results indicated that maximum adsorption of both the dyes occurred at 27 ± 2 °C. Thus, at pH 12, 27 °C, and pH 3, 27 °C, were found optimum adsorption conditions for MB and SY, respectively, for Hs–Cs–HAp; further adsorption experiments were done at the above optimum conditions.
2.2.2. Equilibrium Isotherm
The adsorption isotherm provides information about the nature of adsorbate–adsorbent interaction at equilibrium. This information is essential for the large-scale application of the process. The experimental adsorption data of the dyes, MB and SY, were fitted to the linear forms of Langmuir and Freundlich isotherms6−8 (eqs 1 and 2) and are illustrated in Figure S10. Corresponding nonlinear curve fitting of experimental data of each isotherm plots and related general experimental equilibrium isotherm data are presented in Figure 6a,b along with isotherm constants and correlation coefficient value (inset) for each dyes.
| 1 |
| 2 |
where Ce represents the equilibrium dye concentration in the solution (mg/L), qe is the dye adsorbed (mg/g) by the adsorbent at equilibrium, aL and KL are the Langmuir constants; KF is the Freundlich constant, and 1/n is the heterogenity factor. Therefore, a plot of Ce/qe against Ce will give a straight line with a slope aL/KL and intercept 1/KL, where 1/slope, that is, (KL/aL) represents the monolayer saturation capacity (Qmax).
Figure 6.
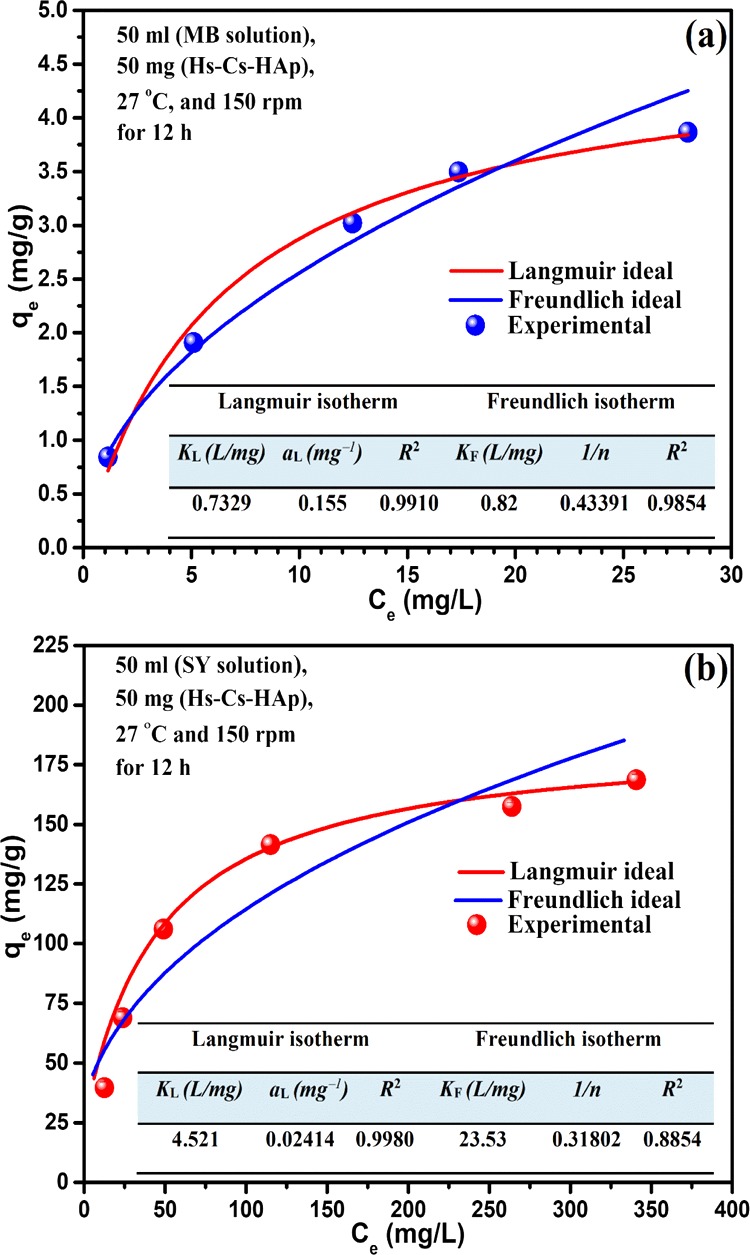
General and predicted Langmuir and Freundlich isotherm plots of (a) (a) Hs−Cs−HAp−MB and (b) Hs–Cs–HAp–SY adsorption systems.
The Langmuir isotherm model gave a better fit (correlation coefficient, R2 > 0.99) to the experimental data in comparison with the Freundlich isotherm model for the adsorption of both the dyes (MB and SY). Additionally, the dependence of dimension less separation factor (RL) [RL = 1/(1 + aLC0)] with the range of concentration studied (MB: 5–30 mg/L, SY: 50–500 mg/L) was calculated using the Langmuir constant (aL) values, which was found to be 0 > RL ≫ 1 (Figure S11) for both the dyes, indicating the process to be favorable and irreversible in nature.5,6 The Langmuir model of isotherm was almost ideally followed by both the dyes, and hence, they formed monolayer on the composite (Hs–Cs–HAp) surface occurred by forming a monolayer by direct interaction with the uniformly distributed energetically equivalent specific adsorption sites (chemisorption) on the adsorbent surface. The theoretical monolayer saturation capacities (Qmax) derived from the Langmuir plot were found to be 4.7 and 187.3 mg/g, respectively, for MB and SY, which were closely similar to the corresponding experimental values, 3.9 and 168.7 mg/g. However, compared to Hs–Cs–HAp, native HAp shows ∼60% less adsorption of MB and ∼95% less adsorption of SY in similar experimental conditions in three different concentration ranges (Figure S12).
2.2.3. Effect of Contact Time and Kinetics
The time of contact between the adsorbate and the adsorbent is a vital information to evaluate their related properties. The effects of contact time on the MB and SY adsorption process by the Hs–Cs–HAp are presented in Figure S13. Results revealed that for both the dyes, the adsorption process was initially fast for abundant availability of the adsorbate and the binding sites; then, it slowed down to reach the equilibrium. Rate of adsorption of SY was faster than that of MB. In the case of MB, 3.5 h was required to attain ∼97% adsorption, which was only 75 min for SY. Final equilibrium times for MB and SY were 6 and 3.5 h, respectively. Apart from compositional features, functional groups distribution, and surface characteristics of the material, intraparticle diffusion of adsorbate through the porous network of the adsorbent also plays a significant role in the adsorption process. To elucidate complex adsorbent–adsorbate interaction, the experimental kinetics data of the present system were analyzed with two different conventional kinetics rate models. Pseudo-first order (eq 3), a simple kinetic analysis of adsorption, and in addition pseudo-second order rate model (eq 4) were used for analyses.
| 3 |
| 4 |
where “qe” and “qt” denote the adsorption of the adsorbate (mg/g) by the adsorbent at equilibrium and at time “t”, respectively; “k1” and “k2” are the pseudo-first order and pseudo-second order rate constants, respectively. Related results are presented in Figure S14, which revealed that the pseudo-second order rate model is the better suited model (high correlation coefficient) to explain the adsorption process of the dyes. This was further authenticated with experimental kinetic data and corresponding nonlinear curve fitting of the two different rate models for the dyes (Figure 7). The derived rate constants obtained from the two rate models are presented at Table 1. However, in case of porous adsorbent, rate is not confined to the surface adsorption only, diffusion of adsorbate through the porous polymeric network to bind the internal binding sites of the adsorbent had also a significant role in the binding mechanism. Hence, apart from conventional rate models, the intra-particle diffusion model5,6,33 (eq 5) also tried to understand the rate-controlling mechanism of the present adsorption system.
| 5 |
In this model, kd is the intrinsic rate constant, C0, is the initial concentration, “D” is the diffusion coefficient, and “t” is the adsorbate–adsorbent contact time. It is clear from the plot (Figure 8) that the adsorption process was a two-step process and hence not restricted to surface adsorption only. Intraparticle diffusion also acted after the surface adsorption, before the system reached the equilibrium in both cases. Parameters related to rate equation plot of the kinetic date are presented in Table 1.
Figure 7.
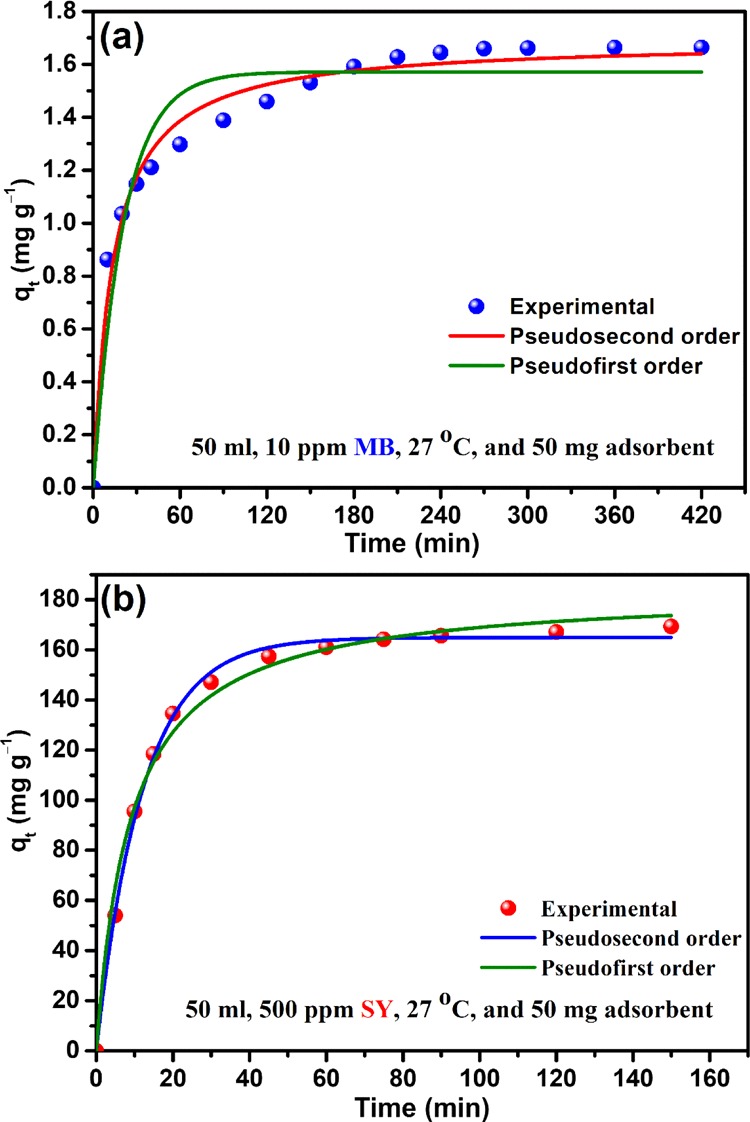
Experimental kinetic data along with nonlinear fitting curved of the two conventional rate models (a) Hs–Cs–HAp–MB and (b) Hs–Cs–HAp–SY adsorption systems.
Table 1. Adsorption Kinetics Parameters.
| kinetics | MB | SY |
|---|---|---|
| First Order | ||
| k1 (L/min) | 0.0438 | 0.0336 |
| qe,cal (mg/g) | 1.24 | 79.84 |
| Second Order | ||
| k2 (g/mg/min) | 0.364 | 0.0008 |
| qe,cal (mg/g) | 1.70 | 181.80 |
| Intraparticle Diffusion | ||
| kd (mg/g/min0.5) | 0.063 | 5.27 |
Figure 8.
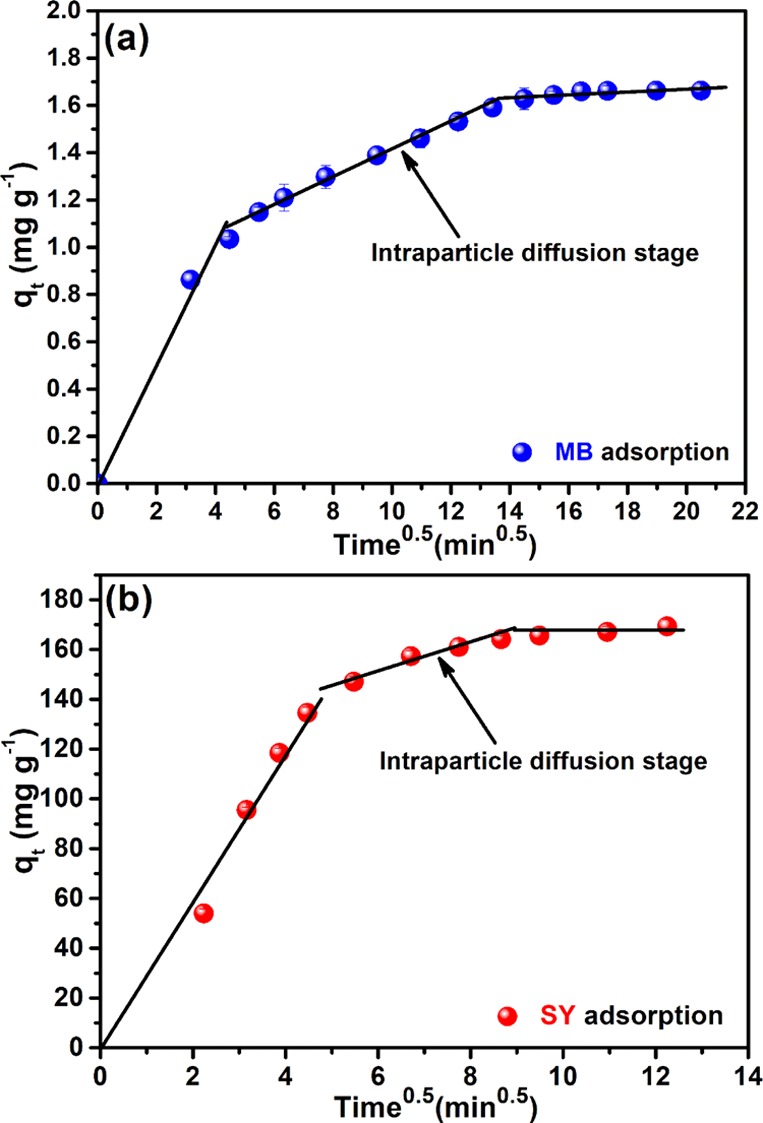
Intraparticle diffusion plot (a) Hs–Cs–HAp–MB and (b) Hs–Cs–HAp–SY adsorption systems.
Because multiple rate controlling mechanisms were involved in the process, and hence, to determine the rate limiting steps of this adsorption system, kinetic data were further fitted to the Boyd plot (eq 6).
| 6 |
where Bt is the mathematical function of “F” and “F” = (qt/qe) represents the fraction of the adsorbate adsorbed at a particular time. The average poor linear fits of the data for both the dyes did not pass through the origin (Figure S15), indicating that surface adsorption was the rate controlling step of the present adsorption system.34−37
2.2.4. Mechanism of Adsorption
It is clear from the FTIR (Figure S4) and XPS (Figures S5 and S6) analysis that the composite surface is facilitated with multiple functional groups. In fact, constituent of the composite is highly rich with primary and secondary organic hydroxyl groups (Hs and Cs), inorganic hydroxyl groups (HAp), Primary and secondary ammines (Hs and Cs), carboxylic acid (Hs and Cs), amides (Hs and Cs), and PO43– groups (HAp). Because of high density of the hydroxyl and amine groups, both of the constituting polymers are highly polycationic in nature (iso-electric point above pH 8.0).38−40 Hence, both the polymers acquired sharp +ve surface charge in acidic pH due to instant protonation of these groups. However, both the polymers have tendency to acquire mild −ve charge at highly basic pH due to adsorption of OH–. This highly polycationic in nature aids it to attract (due to electrostatic interaction) acid dyes (SY) more sharply at acidic pH than basic dyes (MB) at basic pH. Hence, rate and extent of adsorption of acid dyes by this composite are higher than those of basic dyes. After initial electrostatic force of attraction, hydrogen bonding interaction between polar head groups of dye molecules and composite plays a vital role to bind the dye with the composite.6,13,16 However, minimal adsorption of MB and SY (Figure S12) by native HAp may be explained by the lack of availability of the functional groups.
2.3. Desorption and Regeneration Studies
Desorption of dye from the loaded material was tried either by water of different pH or by varied compositions of ethanol/water mixture. Mixture of ethanol (95%) and water [75% (v/v)] was found to be the most suitable eluent to desorb entire adsorbed MB from the loaded material in 7 h. Water at pH 12.0 was found to regenerate the composite from the SY-loaded material within 30 min of treatment. In both cases, the regenerated Hs–Cs–HAp material did not show any deterioration of adsorption efficacy up to five adsorption/desorption cycles (Figure 9). Moreover, there was no loss of adsorbent (during material recovery) noticed after each adsorption/desorption cycle in case of both the dyes, indicating that composite is very much stable under wide pH operating conditions.
Figure 9.
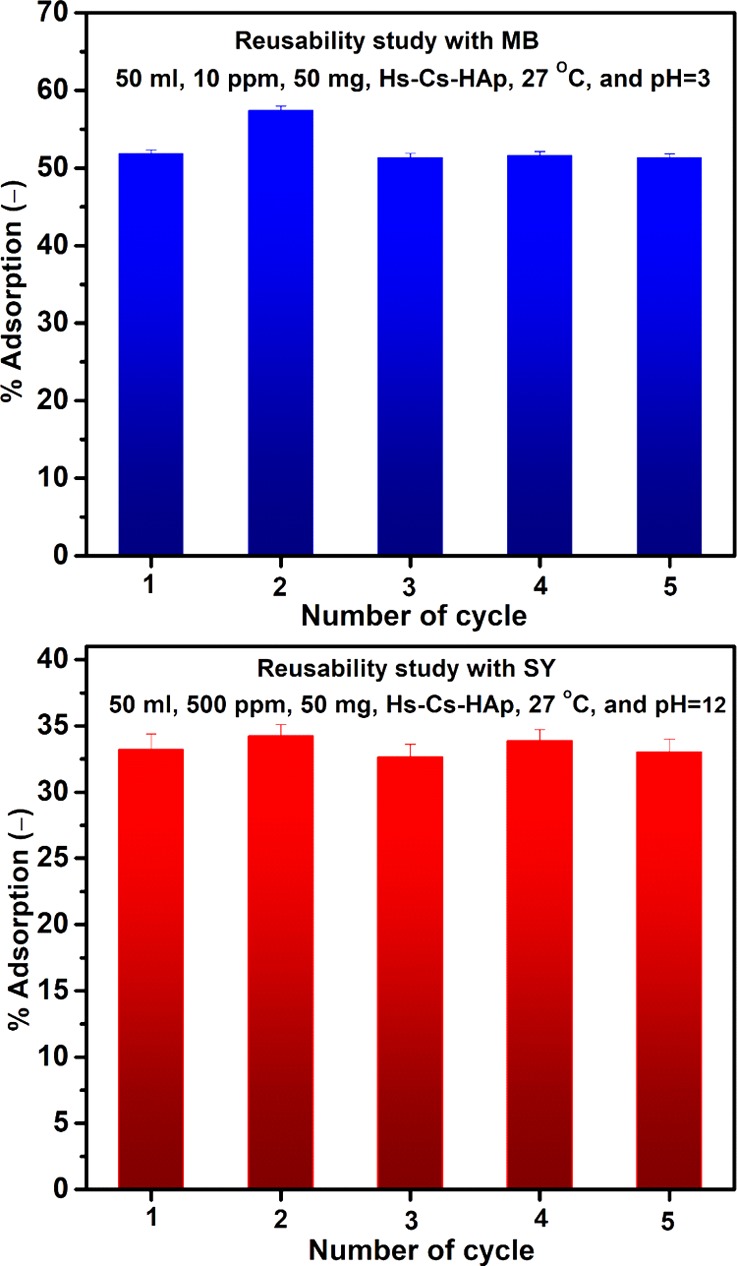
Recyclability of Hs–Cs–HAp with MB and SY adsorption.
2.4. Removal of Commercial Dyes and Treatment Tannery Wastewater
Evaluation of efficiency of the studied composite toward the removal of four different commercial dyes from aqueous solution at their optimum application condition indicated very high dye removal efficiency toward all the four dyes (Figure 10a–d). The material was able to adsorb maximum 496 mg/g of Orange-NR, 488 mg/g of Blue-113, 477 mg/g Red-VLN, and 274 mg/g of Green-PBS dyes from their individual solutions, and in most of the cases, maximum adsorption was accomplished within first 5–6 h except for 500 ppm solution of Orange-NR and Red-VLN dyes. The system took ∼20–22 h to reach equilibrium in both cases. Photographs of all the dye-adsorbed Hs–Cs–HAp are presented in Figure 11a–f.
Figure 10.
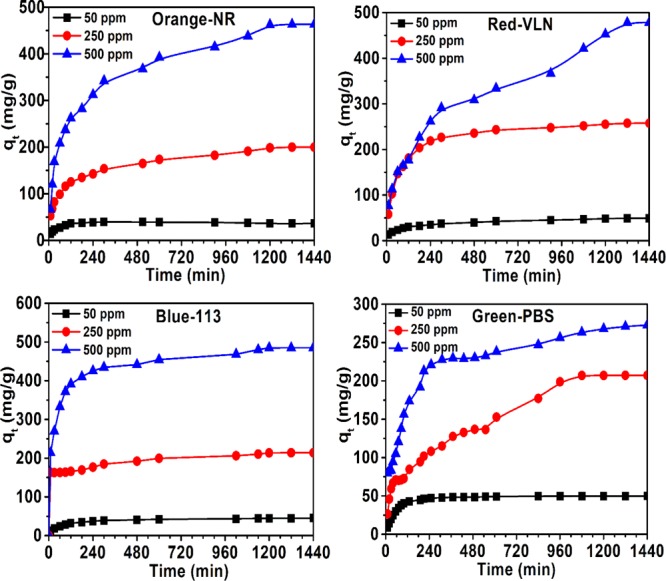
Adsorption of Orange-NR, Red-VLN, Blue-113, and Green-PBS by Hs–Cs–HAp.
Figure 11.
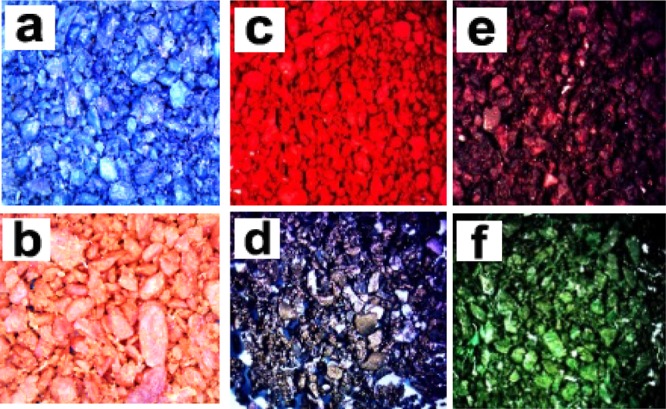
Optical microscopic photograph of (a) MB, (b) SY, (c) Orange-NR, (d) Red-VLN, (e) Blue-113, and (f) Green-PBS adsorbed Hs–Cs–HAp.
The wastewater often contains mixture of multiple dyes; thus, it was essential to evaluate the performance of the adsorbent material to treat multiple-dye containing solutions. Our investigation with the cocktail dye solution demonstrated (Figure 12a) that only 50 mg material was decolorized up to 100 ppm (50 mL) of the cocktail dye solution effectively. Similar results were also observed when the material was employed in a higher quantity (Figure 12b). The only advantage was that the rate of decolorization was faster with a higher adsorbent–adsorbate ratio. From 150 ppm onward, the material was unable to decolorize the solution completely, where the system attained equilibrium within 300 min. Maximum 97.5% removal of dye from 150 ppm solution was achieved with 200 mg of the material. However, the colored effluent released by the industry expected to be contaminated with various other kinds of organic and inorganic contaminants, which might interfered the dye adsorption process. Therefore, it was necessary to evaluate the performance of the material toward the real industrial effluent. During this study, 100 mL of dye-containing tannery effluent was treated with different amounts (50–200 mg) of the composite material without altering the physicochemical condition (pH = 3.6, temp = 27 °C) of the effluent. It was evident from the outcome that the 100 mg of composite was enough to decolorize the entire 100 mL of the colored tannery effluent completely within 180 min of the treatment (Figure 13). These studies clearly indicated that the present composite was highly efficient for the treatment of multicomponent complex, dye-bearing industrial effluent.
Figure 12.
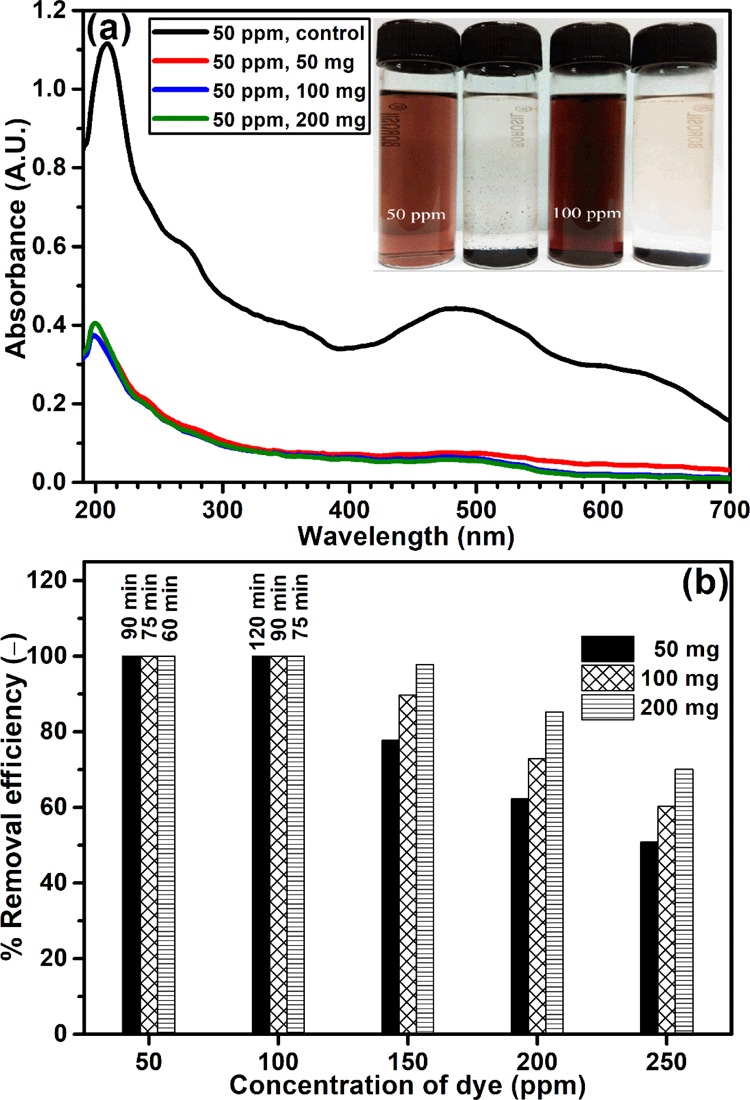
Adsorption of cocktail dye solution by Hs–Cs–HAp: (a) UV-spectrum and (b) efficiency.
Figure 13.
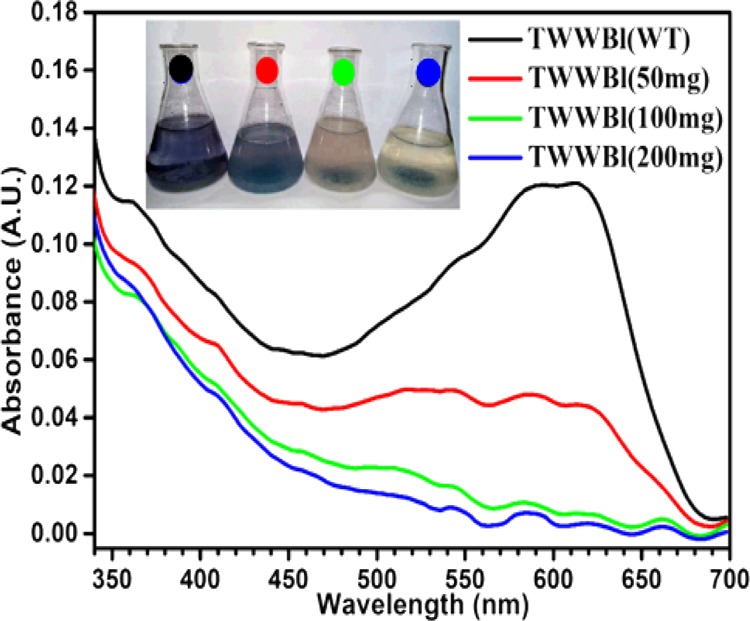
Treatment of tannery wastewater.
3. Conclusions
In the present article, we report a simple economic and scalable synthesis of a low-cost novel biopolymer–inorganic porous composite (Hs–Cs–HAp) having multiple functional groups utilizing material from waste origin via a simple method. The synthesized composite is rough, hard, and less hydrophilic in nature compared to the native polymers and is ideal for use as an adsorbent material. The composite material is able to remove model dye MB (3.8 mg/g) and SY (168 mg/g) successfully, and it has higher affinity toward acid dyes because of its polycationic nature. Equilibrium isotherm and kinetic model analyses proposed that the adsorption of dyes by this material is a chemisorption process (ionic interaction followed by H-bonding) via monolayer formation through the interaction of the dye molecules with the active site of the material, and the rate of the process is controlled by the pseudo-second order kinetic model. Adsorbed dye can be desorbed easily with simple change in pH, and the composite material can be recycled at least five more times without any loss of its efficacy. The material is not only able to remove efficiently four commercial dyes from their individual and cocktail solutions but also able to decolorize dye-bearing leather processing wastewater effectively. Hence, this material has enormous potential for the large-scale dye-bearing wastewater treatment application. Therefore, in present research, some industrial wastes can be successfully converted into a biocomposite, which subsequently effectively employed to reduce water pollution generated by other sources.
4. Materials and Experimentals
4.1. Chemicals and Reagents
Hs used in this study was prepared in our laboratory by a traditional procedure. Medium-molecular weight Cs isolated from crab shell was procured from Sigma-Aldrich, and all other used chemicals were of analytical grade, purchased from E. Merck, India. Commercial dyes were procured from our in-house tanning unit, and the dye-bearing tannery wastewater was collected from a local leather processing unit (Weblec India).
4.2. Synthesis of Adsorbent
Degassed individual solution (2% w/v ) of Cs and Hs in 7% (v/v) AcOH containing 4.8 g Ca(NO3)2·4H2O and 1.9 g NaH2PO4·2H2O respectively were mixed together so that the Ca/P ratio in the blend remained at ∼1.6:1. Mixture was stirred for 10 h at room temperature (RT ≈ 27 °C) and was slowly decanted to a similar volume of alkali-coagulating mixture (NaOH/EtOH/H2O ≡ 1:4:5; w/w) under vigorous stirring for 15 min. The pH of the mixture was then maintained at 13 by adding NaOH, and stirring was continued for 48 h. Generated suspended solid was collected by centrifugation at 10 000 rpm and washed with deionized water until neutral pH was obtained. The collected material was then vacuum-dried at 105 °C till constant weight: the dried material was pulverized using an agate mortar pestle followed by sieving to collect fine particles. The resulted composite was then kept in a desiccator for use. The native HAp was synthesized in a similar fashion without the presence of Hs and Cs.
4.3. Characterization of the Hs–Cs–HAp Composite
The material properties of the developed composite have been evaluated by several techniques. The FTIR spectra of the material along with native polymers have been recorded with a Shimadzu FTIR 8300 spectrophotometer in KBr pellets at room temperature. SSNMR data of each material were acquired using Bruker DSX 300, NMR Spectrometer following the combined techniques of proton dipolar decoupling, magic angle spinning, and cross polarization. XPS spectra of the samples were recorded using an Omicron energy analyzer equipped with monochromatic X-ray sources. TGA of the samples was measured under a nitrogen atmosphere with a TFAQ50 V 6.1 Build 181 instrument. X-ray diffraction (XRD) pattern of the composite was acquired using a Seifert C 3000 instrument with the operating conditions, −40 kV and 30 mA with a Cu/Ni radiation at λ = 1.5406. BET surface area and total pore volume of the material were obtained by measuring their nitrogen adsorption isotherm at 77 K in a surface area and porosity analyzer (Quantachrome Autosorb automated gas sorption system). Morphology of the composite was recorded using a Novax zoom stereo microscope by Euromex Microscopen B.V. Holland, and the surface micro-/nanostructure of the material was characterized using an FEI Quanta 200F scanning electron microscopy (SEM) instrument and TEM analysis was carried out using a Jeol JEM 2100 microscope. Details of sample preparation and data acquisition particularly related to each material characterization process discussed here has been mentioned in Supporting Information.
4.4. Adsorption Experiment with Model Dyes
All the dye adsorption studies during this investigation were performed using the batch technique in 100 mL Erlenmeyer flasks with 50 mL of the dye solution using 50 mg of composite under constant shaking (150 rpm) in a temperature-controlled shaker. In the entire adsorption experimentation, at the end of desired incubation period (24 h; which was expected to be far beyond the time to reach equilibrium found from separate experimentations), the adsorbent was then separated by centrifugation at 5000 rpm, and the dye concentration in the supernatant was measured by a Sican UV–vis spectrophotometer using standard curves of the respective dyes at the particular experimental conditions. Each data point during entire investigation was collected from individual containers and average of three replicating experiments. Optimization of pH was carried out at an ambient temperature of ∼27 °C with 10 ppm MB and 100 ppm SY solution varying the pH of the experimental solutions from 1.0 to 12.0 (adjusted with dilute H2SO4 and NaOH solutions). To determine the optimum temperature of the process, experimentations were performed in the range 10–40 °C with the same initial concentration of each dye keeping fixed pH and time (24 h). For determination of equilibrium adsorption isotherms, varied concentrations of the dyes (5–40 ppm; MB and 50–400 ppm: SY) were added to a constant amount of the adsorbent, keeping other conditions fixed (optimum pH and temp for 24 h). The kinetics adsorption process was observed up to 24 h with 10 ppm MB and 500 ppm SY solution by analyzing the adsorption data at different predetermine time intervals by fixing other parameters at optimum. During entire adsorption studies, percentage of removal (R %) and amount of dye adsorbed at equilibrium (qe, mg/g) and at specific time (qt, mg/g) were calculated from the following equations.
where C0 (mg/L) is the initial concentration of dye; Ct and Ce are the concentrations (mg/L) of the dye at any specific time (t) and at equilibrium, respectively.
4.5. Regeneration and Recycling Studies
After completion of the dye adsorption experiment, the dye-loaded composite material was collected by filtration and washed thoroughly with distilled water, and the desorption of the dyes from the loaded composites was carried out either by water or water–ethanol mixture at specific pH. After desorption, the composites were separated by filtration and washed with de-ionized water for three times. After drying, the recovered composites were subjected again to adsorption/desorption cycle, which was conducted for five times in each case.
4.6. Performance Evaluation with Commercial Dyes and Tannery Wastewater
Performance of the material toward the removal of the four different commercial dyes (Orange-NR, Red-VLN, Blue-113, and Green-PBS) generally used for leather dyeing purposes has been evaluated with 50 mg of the material and 50 mL of each dye solution in three different concentrations (50, 250, and 500 ppm). Experimental conditions were simulated similarly in which they were used for leather dying purposes (∼27 °C and pH 3.0), and the adsorption process was observed spectrophotometrically in specific time intervals till the systems attained equilibrium for each case.
To assess the performance of the material in the presence of multiple dye conditions, equal weight mixtures (thoroughly mixed) of all the four commercial dyes used in the above-described experiments were considered. The adsorption studies were done with 50, 100, and 200 mg of the adsorbent material and 50 mL of cocktail dye solutions of various concentrations (50, 100, 150, 200, and 250 ppm) at ∼27 °C, pH 3.0 (optimum application condition of all the constituent dyes) in 150 rpm mixing condition. The other experimental conditions were the same, as described above for the single dye component.
To evaluate the efficiency of the material toward the treatment of real colored wastewater, samples of dye exhaust bath were collected from the local tannery after the leather dying process, and then, it was centrifuged at 5000 rpm to remove any suspended particles, and the supernatant was collected for further use. Three sets of centrifuged colored wastewater samples (pH = 3.6) each of 100 mL wastewater samples in each were shaken at 150 rpm at RT (∼27 °C) with 50, 100, and 200 mg of the Hs–Cs–HAp, respectively, without modifying its physicochemical conditions. Efficiency of the treatments was then evaluated by UV–visible spectrophotometry after 12 h.
Acknowledgments
The authors are sincerely thank CSIR for funding, Dr. Ashim K. Chakraborty of CSIR-CGRI, Dr. Raja Ram Bal of CSIR-IIP, Dr. Ram Janay Choudhary of UGC-DAE, Indore Centre for instrumental supports, and Prof. S. P. Moulik (Emeritus), Jadavpur University, for his valuable comments during preparation of manuscript. A.B.M. is grateful to the Indian National Academy of Engineering and CSIR-CGCRI for INAE Distinguished Professorship. A.G. would like to acknowledge CSIR for his fellowship.
Supporting Information Available
The Supporting Information is available free of charge on the ACS Publications website at DOI: 10.1021/acsomega.8b00650.
Details methods of characterization of the samples; SS 13C, 15N, 31P NMR, FTIR spectra, XPS spectra, SEM EDXS spectra with elemental mapping, and TEM EDXS analysis of the samples; effect of pH and temperature over the adsorption process; linear plot of Langmuir and Freundlich isotherm; plot of RL values (separation factor) of Langmuir isotherm; comparison of adsorption of MB and SY by composites and HAp; kinetic plots and rate order model plot (linearized form); and Boyd plot of kinetic data (PDF)
Author Present Address
# Institute of Fundamental Sciences, Massey University, Palmerston North 4442, New Zealand.
The authors declare no competing financial interest.
Notes
CSIR-CLRI communication No. A/2018/RCC/CSIR-CLRI/1282
Supplementary Material
References
- Ayangbenro A.; Babalola O. A New Strategy for Heavy Metal Polluted Environments: A Review of Microbial Biosorbents. Int. J. Environ. Res. Public Health 2017, 14, 94. 10.3390/ijerph14010094. [DOI] [PMC free article] [PubMed] [Google Scholar]
- Bharathi K. S.; Ramesh S. T. Removal of dyes using agricultural waste as low-cost adsorbents: a review. Appl. Water Sci. 2013, 3, 773–790. 10.1007/s13201-013-0117-y. [DOI] [Google Scholar]
- Chatterjee S.; De R.; Gupta A. Activated charcoal mediated purification of Yellow Sodium Sulphate: a green process to utilize a hazardous by-product of the leather chemical industry. RSC Adv. 2016, 6, 53651–53656. 10.1039/c6ra01271j. [DOI] [Google Scholar]
- Ramamurthy G.; Ramalingam B.; Katheem M. F.; Sastry T. P.; Inbasekaran S.; Thanveer V.; Jayaramachandran S.; Das S. K.; Mandal A. B. Total Elimination of Polluting Chrome Shavings, Chrome, and Dye Exhaust Liquors of Tannery by a Method Using Keratin Hydrolysate. ACS Sustainable Chem. Eng. 2015, 3, 1348–1358. 10.1021/acssuschemeng.5b00071. [DOI] [Google Scholar]
- Chatterjee S.; Chatterjee S.; Chatterjee B. P.; Das A. R.; Guha A. K. Adsorption of a model anionic dye, eosin Y, from aqueous solution by chitosan hydrobeads. J. Colloid Interface Sci. 2005, 288, 30–35. 10.1016/j.jcis.2005.02.055. [DOI] [PubMed] [Google Scholar]
- Chatterjee S.; Chatterjee S.; Chatterjee B. P.; Guha A. K. Adsorptive removal of congo red, a carcinogenic textile dye by chitosan hydrobeads: Binding mechanism, equilibrium and kinetics. Colloids Surf., A 2007, 299, 146–152. 10.1016/j.colsurfa.2006.11.036. [DOI] [Google Scholar]
- Piccin J. S.; Feris L. A.; Cooper M.; Gutterres M. Dye Adsorption by Leather Waste: Mechanism Diffusion, Nature Studies, and Thermodynamic Data. J. Chem. Eng. Data 2013, 58, 873–882. 10.1021/je301076n. [DOI] [Google Scholar]
- Cheng C.; Li S.; Zhao J.; Li X.; Liu Z.; Ma L.; Zhang X.; Sun S.; Zhao C. Biomimetic assembly of polydopamine-layer on graphene: Mechanisms, versatile 2D and 3D architectures and pollutant disposal. Chem. Eng. J. 2013, 228, 468–481. 10.1016/j.cej.2013.05.019. [DOI] [Google Scholar]
- Nie C.; Peng Z.; Yang Y.; Cheng C.; Ma L.; Zhao C. Kevlar based nanofibrous particles as robust, effective and recyclable absorbents for water purification. J. Hazard. Mater. 2016, 318, 255–265. 10.1016/j.jhazmat.2016.06.061. [DOI] [PubMed] [Google Scholar]
- Nie C.; Yang Y.; Peng Z.; Cheng C.; Ma L.; Zhao C. Aramid nanofiber as an emerging nanofibrous modifier to enhance ultrafiltration and biological performances of polymeric membranes. J. Membr. Sci. 2017, 528, 251–263. 10.1016/j.memsci.2016.12.070. [DOI] [Google Scholar]
- Kyzas G.; Bikiaris D. Recent Modifications of Chitosan for Adsorption Applications: A Critical and Systematic Review. Mar. Drugs 2015, 13, 312–337. 10.3390/md13010312. [DOI] [PMC free article] [PubMed] [Google Scholar]
- Piccin J. S.; Gomes C. S.; Feris L. A.; Gutterres M. Kinetics and isotherms of leather dye adsorption by tannery solid waste. Chem. Eng. J. 2012, 183, 30–38. 10.1016/j.cej.2011.12.013. [DOI] [Google Scholar]
- Ramalingam B.; Khan M. M. R.; Mondal B.; Mandal A. B.; Das S. K. Facile Synthesis of Silver Nanoparticles Decorated Magnetic-Chitosan Microsphere for Efficient Removal of Dyes and Microbial Contaminants. ACS Sustainable Chem. Eng. 2015, 3, 2291–2302. 10.1021/acssuschemeng.5b00577. [DOI] [Google Scholar]
- Sankar M. U.; Aigal S.; Maliyekkal S. M.; Chaudhary A.; Anshup; Kumar A. A.; Chaudhari K.; Pradeep T. Biopolymer-reinforced synthetic granular nanocomposites for affordable point-of-use water purification. Proc. Natl. Acad. Sci. U.S.A. 2013, 110, 8459–8464. 10.1073/pnas.1220222110. [DOI] [PMC free article] [PubMed] [Google Scholar]
- Allam K.; Bouari A. E.; Belhorma B.; Bih L. Removal of Methylene Blue from Water Using Hydroxyapatite Submitted to Microwave Irradiation. J. Water Resour. Prot. 2016, 08, 358. 10.4236/jwarp.2016.83030. [DOI] [Google Scholar]
- Shi C.; Lv C.; Wu L.; Hou X. Porous chitosan/hydroxyapatite composite membrane for dyes static and dynamic removal from aqueous solution. J. Hazard. Mater. 2017, 338, 241–249. 10.1016/j.jhazmat.2017.05.022. [DOI] [PubMed] [Google Scholar]
- Weber F.; Böhme J.; Scheidt H. A.; Gründer W.; Rammelt S.; Hacker M.; Schulz-Siegmund M.; Huster D. 31P and 13C solid-state NMR spectroscopy to study collagen synthesis and biomineralization in polymer-based bone implants. NMR Biomed. 2012, 25, 464–475. 10.1002/nbm.1649. [DOI] [PubMed] [Google Scholar]
- Heux L.; Brugnerotto J.; Desbrières J.; Versali M.-F.; Rinaudo M. Solid State NMR for Determination of Degree of Acetylation of Chitin and Chitosan. Biomacromolecules 2000, 1, 746–751. 10.1021/bm000070y. [DOI] [PubMed] [Google Scholar]
- Sheikh L.; Tripathy S.; Nayar S. Biomimetic matrix mediated room temperature synthesis and characterization of nano-hydroxyapatite towards targeted drug delivery. RSC Adv. 2016, 6, 62556–62571. 10.1039/c6ra06759j. [DOI] [Google Scholar]
- Lei Y.; Chen W.; Lu B.; Ke Q.-F.; Guo Y.-P. Bioinspired fabrication and lead adsorption property of nano-hydroxyapatite/chitosan porous materials. RSC Adv. 2015, 5, 98783–98795. 10.1039/c5ra17569k. [DOI] [Google Scholar]
- Huang Z.; Feng Q.; Yu B.; Li S. Biomimetic properties of an injectable chitosan/nano-hydroxyapatite/collagen composite. Mater. Sci. Eng., C 2011, 31, 683–687. 10.1016/j.msec.2010.12.014. [DOI] [Google Scholar]
- Su W.; Ma X.; Sun X.; Li X. Physicochemical characterisation and thermal decomposition of synthetic collagen based nanocomposites in comparison with natural bone. Adv. Appl. Ceram. 2016, 115, 29–35. 10.1179/1743676115y.0000000050. [DOI] [Google Scholar]
- Chang M. C.; Tanaka J. XPS study for the microstructure development of hydroxyapatite-collagen nanocomposites cross-linked using glutaraldehyde. Biomaterials 2002, 23, 3879–3885. 10.1016/s0142-9612(02)00133-3. [DOI] [PubMed] [Google Scholar]
- Manjubala I.; Scheler S.; Bössert J.; Jandt K. D. Mineralisation of chitosan scaffolds with nano-apatite formation by double diffusion technique. Acta Biomater. 2006, 2, 75–84. 10.1016/j.actbio.2005.09.007. [DOI] [PubMed] [Google Scholar]
- Guan J.; Yang J.; Dai J.; Qin Y.; Wang Y.; Guo Y.; Ke Q.; Zhang C. Bioinspired nanostructured hydroxyapatite/collagen three-dimensional porous scaffolds for bone tissue engineering. RSC Adv. 2015, 5, 36175–36184. 10.1039/c5ra01487e. [DOI] [Google Scholar]
- Suvorova E. I.; Buffat P. A. Electron diffraction from micro- and nanoparticles of hydroxyapatite. J. Microsc. 1999, 196, 46–58. 10.1046/j.1365-2818.1999.00608.x. [DOI] [PubMed] [Google Scholar]
- Wen X.; Shao C.-T.; Chen W.; Lei Y.; Ke Q.-F.; Guo Y.-P. Mesoporous carbonated hydroxyapatite/chitosan porous materials for removal of Pb(ii) ions under flow conditions. RSC Adv. 2016, 6, 113940–113950. 10.1039/c6ra20448a. [DOI] [Google Scholar]
- Biggemann D.; da Silva M. H. P.; Rossi A. M.; Ramirez A. J. High-Resolution Transmission Electron Microscopy Study of Nanostructured Hydroxyapatite. Microsc. Microanal. 2008, 14, 433–438. 10.1017/s1431927608080744. [DOI] [PubMed] [Google Scholar]
- Adamiano A.; Fabbri D.; Falini G.; Belcastro M. G. A complementary approach using analytical pyrolysis to evaluate collagen degradation and mineral fossilization in archaeological bones: The Case Study of Vicenne-Campochiaro necropolis (Italy). J. Anal. Appl. Pyrolysis 2013, 100, 173–180. 10.1016/j.jaap.2012.12.014. [DOI] [Google Scholar]
- Figueiredo M.; Fernando A.; Martins G.; Freitas J.; Judas F.; Figueiredo H. Effect of the calcination temperature on the composition and microstructure of hydroxyapatite derived from human and animal bone. Ceram. Int. 2010, 36, 2383–2393. 10.1016/j.ceramint.2010.07.016. [DOI] [Google Scholar]
- Zawadzki J.; Kaczmarek H. Thermal treatment of chitosan in various conditions. Carbohydr. Polym. 2010, 80, 394–400. 10.1016/j.carbpol.2009.11.037. [DOI] [Google Scholar]
- Zeng L.; Qin C.; Wang L.; Li W. Volatile compounds formed from the pyrolysis of chitosan. Carbohydr. Polym. 2011, 83, 1553–1557. 10.1016/j.carbpol.2010.10.007. [DOI] [Google Scholar]
- Annadurai G.; Juang R.; Lee D. Use of cellulose-based wastes for adsorption of dyes from aqueous solutions. J. Hazard. Mater. 2002, 92, 263–274. 10.1016/s0304-3894(02)00017-1. [DOI] [PubMed] [Google Scholar]
- Kumar P. S.; Ramalingam S.; Kirupha S. D.; Murugesan A.; Vidhyadevi T.; Sivanesan S. Adsorption behavior of nickel(II) onto cashew nut shell: Equilibrium, thermodynamics, kinetics, mechanism and process design. Chem. Eng. J. 2011, 167, 122–131. 10.1016/j.cej.2010.12.010. [DOI] [Google Scholar]
- Nethaji S.; Sivasamy A.; Mandal A. B. Adsorption isotherms, kinetics and mechanism for the adsorption of cationic and anionic dyes onto carbonaceous particles prepared from Juglans regia shell biomass. Int. J. Environ. Sci. Technol. 2013, 10, 231–242. 10.1007/s13762-012-0112-0. [DOI] [Google Scholar]
- Ahmad M. A.; Ahmad Puad N. A.; Bello O. S. Kinetic, equilibrium and thermodynamic studies of synthetic dye removal using pomegranate peel activated carbon prepared by microwave-induced KOH activation. Water Resour. Ind. 2014, 6, 18–35. 10.1016/j.wri.2014.06.002. [DOI] [Google Scholar]
- Elkady M.; El-Aassar M.; Hassan H. Adsorption Profile of Basic Dye onto Novel Fabricated Carboxylated Functionalized Co-Polymer Nanofibers. Polymers 2016, 8, 177. 10.3390/polym8050177. [DOI] [PMC free article] [PubMed] [Google Scholar]
- Andrade A. L.; Ferreira J. M. F.; Domingues R. Z. Zeta potential measurement in bioactive collagen. Mater. Res. 2004, 7, 631–634. 10.1590/s1516-14392004000400018. [DOI] [Google Scholar]
- Highberger J. H. The Isoelectric Point of Collagen. J. Am. Chem. Soc. 1939, 61, 2302–2303. 10.1021/ja01878a010. [DOI] [Google Scholar]
- Tsai T.-N.; Yen H.-J.; Chen C.-c.; Chen Y.-c.; Young Y.-a.; Cheng K.-m.; Young J.-j.; Hong P.-d. Novel protein-loaded chondroitin sulfate-N-[(2-hydroxy-3-trimethylammonium)propyl]chitosan nanoparticles with reverse zeta potential: preparation, characterization, and ex vivo assessment. J. Mater. Chem. B 2015, 3, 8729–8737. 10.1039/c5tb01517k. [DOI] [PubMed] [Google Scholar]
Associated Data
This section collects any data citations, data availability statements, or supplementary materials included in this article.


