Abstract
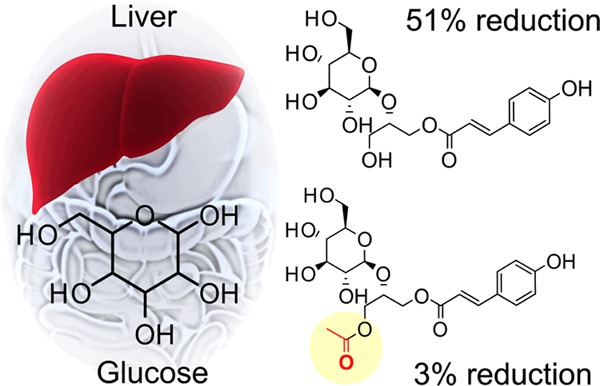
An activity-guided fractionation approach revealed several phenylpropanoid glycerol glucosides isolated from the bulbs of Lilium longiflorum Thunb. (Easter lily) with gluconeogenesis inhibitory activities. The strongest activity was observed for (2S)-1-O-p-coumaroyl-2-O-β-d-glucopyranosylglycerol (3), (2S)-1-O-caffeoyl-2-O-β-d-glucopyranosylglycerol (1), and (2R)-1-O-β-d-glucopyranosyl-2-O-p-coumaroylglycerol (2) with inhibitions of 51.2, 39.2, and 36.8%, respectively. The p-coumaroyl-based (3) and its acetylated derivative (5) exhibited differential inhibition activity (51.2% as compared to 3.6%), suggesting that natural acetylation decreases the hypoglycemic activity of these compounds. Direct structure–activity analysis of phenylpropanoid glycerol glucosides indicated that the hydroxylation pattern of the hydroxy cinnamic acid moiety and acetylation were responsible for the differences in activity. This is the first report of phenylpropanoid glycerol glucosides as a phytochemical class of hepatic glucose production inhibitors.
Introduction
Type II diabetes is one of the leading causes of death in the United States.1 According to recent estimates, over 30 million Americans have diabetes and 84 million are estimated to be prediabetic. In 2014, the World Health Organization estimated that 422 million adults worldwide had diabetes.2 The global prevalence of diabetes has been steadily rising, and in the United States the disease is forecast to affect more than 54.9 million Americans by 2030, resulting in an economic burden exceeding $622 billion.3 To counter the increasing incidence of type II diabetes, effective and targeted treatments are needed.
Targeting the prediabetic stages of type II diabetes offers an attractive approach to confront this global epidemic. In healthy people, insulin is produced by the pancreas, eliciting a commensurate decrease in glucose production in the liver to maintain blood glucose homeostasis. In diabetics, this process is disrupted, causing a chronic hyperglycemic state resulting in vascular dysfunction and organ-specific damage.4 Preceding the development of type II diabetes, a metabolic syndrome characterized by increased hepatic gluconeogenesis is frequently observed.5 The liver is the main producer of glucose that is released into circulation through gluconeogenesis and glycogenolysis. Postprandial insulin directly inhibits glycogenolysis and increases glycogen synthesis by modulating the activities of hepatic phosphoenolpyruvate carboxylase and glucose 6-phosphatase, two key enzymes that regulate pyruvate metabolism and glucose secretion.4 Identifying new therapies targeting these pathways offers an approach to delay, or potentially prevent, the onset of type II diabetes.
Well known agents successfully targeting hepatic gluconeogenesis, such as metformin, the most widely prescribed type II diabetes drug, have motivated significant interest in identifying new hepatic glucose inhibitors.6 Other drugs, such as glucokinase activators, which treat the prediabetic stages, have had inconsistent success.7 Natural products offer promise as potential hepatic gluconeogenesis inhibitors because their structural diversity is often the basis for their specific pharmacological activity. Accordingly, natural products may well contribute to a pipeline for the discovery of new small-molecule-based treatments.8
Food-derived natural products offer a wealth of compounds that could be effective hepatic gluconeogenesis inhibitors. In a contemporary study, polyphenols from a green tea extract were shown to suppress hepatic glucose enzyme production.5 In another recent work, chlorogenic acids extracted from chicory were also shown to suppress hepatic glucose production.9 The bulbs of the Easter lily, Lilium longiflorum Thunb., are widely used in Asian cooking and in traditional medicinal treatments. In China and Japan, the bulbs are added to culinary dishes and are also prescribed to treat inflammation, suppress coughing fits, and induce wound healing.10,11 Studies have identified a variety of steroidal glycosides and polyphenols within the Lilium genus, which may be the basis for their broad use in traditional medicine applications.12 In a previous study, crude bulb extracts of Easter lily were effective in improving glucose metabolism in oral glucose tolerance tests performed on type II diabetic murine models, although the compounds responsible for the activity were not identified.13 Moreover, some extracts prepared from Easter lily bulbs provided hepatoprotective activity, lowering blood glucose levels in murine models with impaired glucose tolerance and improving liver function in type II diabetic mice. These results indicate steroidal glycosides present in the extracts played a role in the observed hepatoprotective effects; however, the compounds responsible for the hypocholesterolemic and hypoglycemic effects have yet to be identified.13
The studies conducted in this report were designed to identify and evaluate other natural products in Easter lily having the potential to delay the onset of metabolic syndrome by inhibiting hepatic gluconeogenesis. Here, this work reports the antigluconeogenic properties of Easter lily bulb extracts by employing an activity-guided fractionation approach modeled on a cellular hepatic glucose assay to examine the inhibitory activity of the fractionated extracts. The objectives were to: (1) isolate compounds from the bulb extracts and identify structures through a combination of preparative chromatography, liquid chromatography–mass spectrometry (LC–MS), and NMR; (2) determine the antigluconeogenic activity of the pure compounds; and (3) further investigate this activity by examining their structure–activity relationship.
Materials and Methods
Plant Material
L. longiflorum (cultivar 7-4) bulbs were cultivated following the methods reported in Munafo et al. 2010.14 Mature L. longiflorum bulbs (∼60 bulbs) were harvested, separated, and frozen in liquid nitrogen prior to being lyophilized with a Virtis advantage freeze dryer (SP Industries, Warminster, PA) and stored at −80 °C for subsequent analysis.
Chemicals
All solvents, acetonitrile, 1-butanol, dimethylsulfoxide (DMSO), ethyl acetate, ethanol, formic acid, methanol, pentanes, and tetrahydrofuran were purchased from Thermo Fisher Scientific Inc. (Fairlawn, NJ). Methanol-d4 (0.3% v/v TMS) was sourced from Millipore-Sigma (St. Louis, MO). A purification system (Millipore, Bedford, MA) was employed to obtain deionized (DI) water (18 MΩ cm), in-house.
Isolation and Identification of Compounds
Sequential Solvent Extraction of Lyophilized L. longiflorum Bulbs
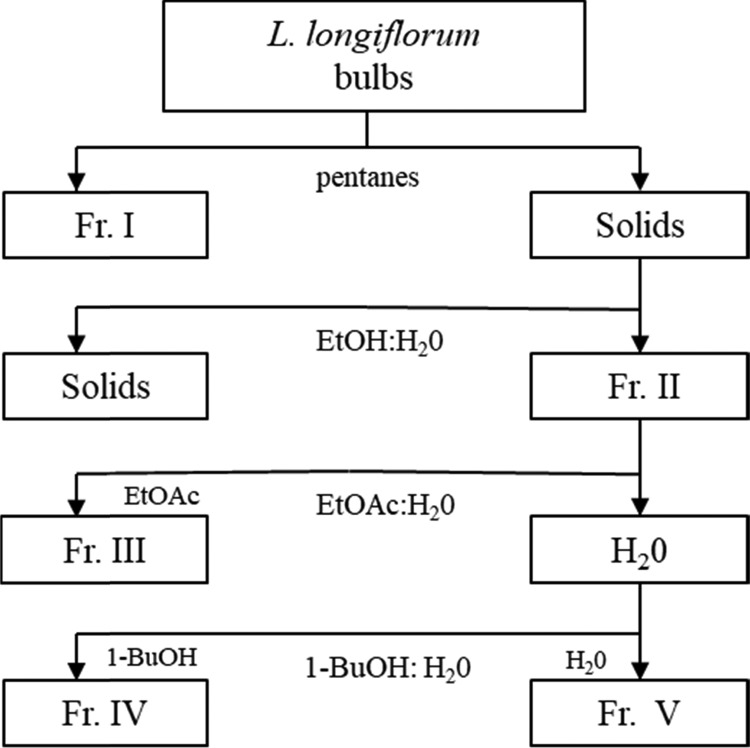
Lyophilized lily bulbs (100 g) were ground to a fine powder using a standard laboratory mill (IKA Labortechnik, Staufen, Germany), after which the bulbs were extracted with pentanes (3 × 100 mL) while being shaken on a wrist action shaker (Burrell Scientific, Pittsburg, PA) for 30 min at room temperature. The solutions were centrifuged for 10 min at 710 G on a Sorvall RC-3C Plus centrifuge (Thermo Fisher Scientific, Fairlawn, NJ). Next, the materials were combined and evaporated under reduced pressure (1.0 × 10⁻³ bar) at 30 °C with a Laborota 4003 rotary evaporator (Heidolph Brinkman LLC, Elk Grove Village, IL), resulting in Fraction I. The pellet was placed in the fume hood overnight to remove excess solvent, and the resulting dried residue was mixed with ethanol and deionized water (70:30, v/v; 2 × 150 mL) on an autoshaker for 45 min. Then, the solution was centrifuged for 10 min at 710 G, followed by vacuum filtration with Whatman 114 qualitative filter paper (Whatman International, Maidstone, U.K.). The supernatant was then removed and evaporated under reduced pressure to be lyophilized twice, resulting in Fraction II. After which the additional powder (12.7 g) was combined with deionized water (100 mL), the solution extracted with ethyl acetate (5 × 100 mL), and the organic phases combined. These were placed under reduced pressure to be evaporated, dissolved in deionized water (25 mL), and lyophilized twice, producing Fraction III. After that, using 1-butanol, the aqueous phase was extracted (5 × 100 mL), followed by evaporation under reduced pressure and two lyophilizations, leading to Fraction IV. For the final fraction, the aqueous phase was evaporated under reduced pressure, and the residue was dissolved in deionized water (25 mL) prior to two rounds of lyophilization, producing Fraction V (Figure 1). The yields from each fraction were as follows: I (0.57 g), II (13.7 g), III (0.77 g), IV (8.96 g), and V (2.42 g). All fractions were stored at −80 °C for later use in fractionation, bioassay, and chemical analysis.
Figure 1.
L. longiflorum sequential solvent fractionation procedure. Abbrev: EtOH; ethanol, EtOAc; ethyl acetate, 1-BuOH; 1-butanol.
Subfractionation of Fraction III
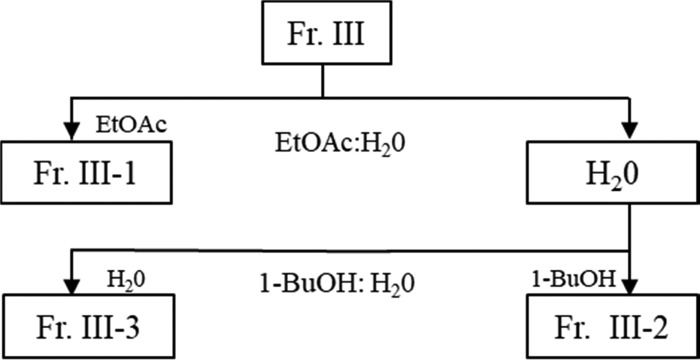
Fraction III showed significant activity in hepatic cellular assays and was further investigated. The above procedure was repeated multiple times to produce enough of Fraction III for further fractionation. Fraction III (5.0 g) was dissolved in deionized water (275 mL), the solution extracted with ethyl acetate (2 × 200 mL), the organic phases combined and evaporated under reduced pressure, then dissolved in deionized water (25 mL), and lyophilized twice, producing Fraction III-1 (0.6 g). The remaining aqueous phase was extracted with 1-butanol (2 × 200 mL), evaporated under reduced pressure, and twice lyophilized, producing Fraction III-2 (3.8 g). Lastly, the aqueous phase was evaporated under reduced pressure, and the residue was dissolved in DI water (25 mL), and lyophilized twice, yielding Fraction III-3 (0.3 g) (Figure 2).
Figure 2.
Solvent fractionation procedure of Fraction III. Abbrev: EtOAc; ethyl acetate, 1-BuOH; 1-butanol.
Preparative Reverse-Phase High-Performance Liquid Chromatography (RP-HPLC)
Implementing a modified procedure reported in Munafo et al. 2015, compounds 1–9 were purified to homogeneity from the pooled subfractions III-1 and III-2 (III-1/2).12 Fraction (III-1/2) was fractionated by semipreparative RP-HPLC on a 10 μm Luna C18 column (250 mm × 21.2 mm i.d.) (Phenomenex, Torrance, CA). This was done using an LC-6AD liquid chromatograph (Shimadzu Scientific Instruments Inc., Columbia, MD) connected to a UV−vis detector and a 2 mL injection loop. The mobile phases were (A) 0.1% formic acid in DI water and (B) 0.1% formic acid in acetonitrile. The flow rate was set to 20 mL/min, the column temperature was 23 ± 2 °C, and UV detection was recorded at 210 nm. Fraction (III-1/2) (100 mg) was dissolved in a mixture of mobile phase A and mobile phase B (90:10, v/v; 2 mL) and filtered through a 0.45 μm PTFE syringe filter prior to injection (injection volume; 1 mL). The extract was fractionated using a linear gradient of 5–24.4% B for 35 min and then ramped to 90% B over 5 min, with a hold at 90% B for an additional 5 min. The solvent mixture was reset to 5% B for 10 min before subsequent injections. Fractions containing the compounds of interest were collected, and the separation was repeated. After multiple purifications, the fractions were analyzed by LC–MS and individually pooled. The solvent was evaporated under reduced pressure (30 °C; 1.0 × 10⁻³ bar) and lyophilized, yielding 1 (5.2 mg), 2 (2.1 mg), 3 (29.6 mg), 4 (5.2 mg), 5 (30.3 mg), 6 (5.7 mg), 7 (5.4 mg), 8 (7.2 mg), and 9 (6.9 mg) as yellow amorphous powders with >98% purity as determined by LC–MS and NMR.
Compound 1: (2S)-1-O-caffeoyl-2-O-β-d-glucopyranosylglycerol (regaloside K). One-dimensional (1D) and two-dimensional (2D) NMR data were consistent with 1H NMR and 13C NMR reported in the literature.15
Compound 2: (2R)-1-O-β-d-glucopyranosyl-2-O-p-coumaroylglycerol (regaloside H). 1D and 2D NMR data were consistent with 1H NMR and 13C NMR reported in the literature.16
Compound 3: (2S)-1-O-p-coumaroyl-2-O-β-d-glucopyranosylglycerol (regaloside D). 1D and 2D NMR data were consistent with 1H NMR and 13C NMR reported in the literature.17
Compound 4: (2S)-1-O-caffeoyl-2-O-β-d-glucopyranosyl-3-O-acetylglycerol (regaloside E). 1D and 2D NMR data were consistent with 1H NMR and 13C NMR reported in the literature.17
Compound 5: (2S)-1-O-p-coumaroyl-2-O-β-d-glucopyranosyl-3-O-acetylglycerol (regaloside B). 1D and 2D NMR data were consistent with 1H NMR and 13C NMR reported in the literature.18
Compound 6: (2S)-1-O-p-coumaroylglycerol. 1D and 2D NMR data were consistent with 1H NMR and 13C NMR reported in the literature.17
Compound 7: (2)-hydroxy-3-O-p-coumaroyl-1,2-propanedicarboxylic acid. 1D and 2D NMR data were consistent with 1H NMR and 13C NMR reported in the literature.19
Compound 8: 3,6′-diferuloylsucrose. 1D and 2D NMR data were consistent with 1H NMR and 13C NMR reported in the literature.20
Compound 9: 4-acetyl-3,6′-diferuloylsucrose. 1D and 2D NMR data were consistent with 1H NMR and 13C NMR reported in the literature.20
Liquid Chromatography–Mass Spectrometry (LC–MS)
LC–MS analyses were performed with an Agilent 1260 series HPLC system interfaced to a 6410 triple-quadrupole LC–MS mass-selective detector with an API-ESI ionization source (Agilent Technologies Inc., Santa Clara, CA). The system was equipped with an autosampler, a BIN Pump SL binary pump, a TCC SL thermostated column compartment, and a DAD-SL diode array detector. Chromatographic separations were made on a 5 μm Prodigy C18 column (250 mm × 4.6 mm i.d.) (Phenomenex, Torrance, CA) at a flow rate of 1.0 mL/min, the column temperature was set to 23 ± 2 °C, and an injection volume was of 10 μL. The binary mobile phase consisted of (A) 0.1% formic acid in DI water and (B) 0.1% formic acid in acetonitrile. Separations were affected using a linear gradient of 15–34.6% B for 28 min and, then, ramped to 95% B over 5 min with a hold at 95% B for 5 min. The system was reset to 15% B for 10 min before each sample injection. The column temperature was set at 25 °C and operated at a 1.0 mL/min flow rate. All samples were dissolved in a mixture of mobile phase A and mobile phase B (90:10, v/v) and filtered through a 0.45 μm PTFE syringe filter prior to injection (injection volume 10 μL). Data acquisition and analysis were performed using Mass Hunter Workstation Data Acquisition, Qualitative Analysis, and Quantitative Analysis software. LC–MS analysis was performed in both negative- and positive-ion modes with ionization parameters set at capillary voltage, 3.5 kV; nebulizer pressure, 35 psi; drying gas flow, 13.0 mL/min; drying gas temperature, 350 °C; and mass scan range, m/z 100–2000.
Nuclear Magnetic Resonance Spectroscopy (NMR)
1D 1H NMR and 13C NMR spectra were acquired on an AMX-400 spectrometer (Bruker, Rheinstetten, Germany). 2D heteronuclear multiple-bond correlation, heteronuclear single-quantum coherence, and H–H correlation spectroscopy (H–H COSY) spectra were acquired on a 500 MHz spectrometer (Bruker, Rheinstetten, Germany). Samples for NMR analysis were dissolved in methanol-d4, and chemical shifts were calculated as δ values with reference to tetramethylsilane (TMS).
Cell Culture
To determine the efficacy of these compounds as gluconeogenesis inhibitors, the rat hepatoma cell line H4IIE (CRL-1600) (ATCC, Manassas, VA) was examined because these cells maintain physiological regulation of gluconeogenesis in vitro in response to hormones. Cell passage was performed every 3–4 days, and cells were cultured in a high-glucose Dulbecco’s modified Eagle medium (DMEM) containing 10% fetal bovine serum (Life Science Technologies, Carlsbad, CA) with 1% penicillin–streptomycin (Fisher Scientific, Pittsburg, PA) at 5% CO2 and 37 °C. Next, cells were subcultured in 24-well plates and, once confluence was reached, were cultured on an induction medium consisting of glucose-free DMEM supplemented with 20 mM sodium lactate and 2 mM sodium pyruvate. To induce gluconeogenesis, cells were treated with 0.5 μL of dexamethasone and 10 mM 8-CTP-cAMP (Dex-cAMP). After 8 h, 10 nM insulin was applied to suppress glucose production.
In Vitro Assay for Glucose Production Inhibition
The production of glucose was measured by sampling 50 μL of cell culture medium from the vehicle (negative control, 0.1% DMSO), the glucose-inducing control (Dex-cAMP)(DC), positive control (Dex-cAMP with 10 nM insulin)(Ins), and treatment levels (Dex-cAMP with 50 μg/mL fractions or 10 μM of a single compound 1–9). The conversion of glucose to gluconolactone and hydrogen peroxide was measured at an absorption of 530 nm and an emission of 590 nm following the instructions of the Amplex red glucose/glucose oxidase kit (Life Technologies, Carlsbad, CA) on a fluorescence microplate reader (BioTek Synergy HA, Sunnyvale, CA). All cellular results are expressed as the percent of the induced control.
Statistical Analysis
To establish the activity of fractions, subfractions, and pure compounds in the examined cell line, a one-way analysis of variance followed by a Tukey HSD (α = 0.05) was conducted on JMP Pro 14 (SAS Institute Inc., Cary, NC). The data was presented as mean ± SEM. P-values of <0.05 were considered statistically significant.
Results and Discussion
Activity-Guided Fractionation and Suppression of Cellular Glucose Production
Sequential solvent extracts (Fr. I–V) of lyophilized L. longiflorum bulbs were examined for their suppression of glucose production in the H4IIE rat hepatoma cell line. The negative control (Dex-cAMP) was considered the maximum glucose production at 100%, while the positive control (Dex-cAMP + insulin 10 μm) showed only 20% glucose production in comparison. The bulb fractions (I–V) were tested at a concentration of 50 μg/mL with Fr. III glucose production suppressed by 25% (p < 0.05) (Figure 3). The remaining fractions (I, II, IV, and V) did not show significant gluconeogenesis suppression relative to the control. Fraction III was further separated by liquid–liquid solvent partitioning. Of the three subsequent fractions, III-1 and III-2 showed the strongest suppression of glucose production at 56 and 64%, respectively. These two fractions were pooled and subjected to successive preparative RP-HPLC, yielding compounds 1–9.
Figure 3.
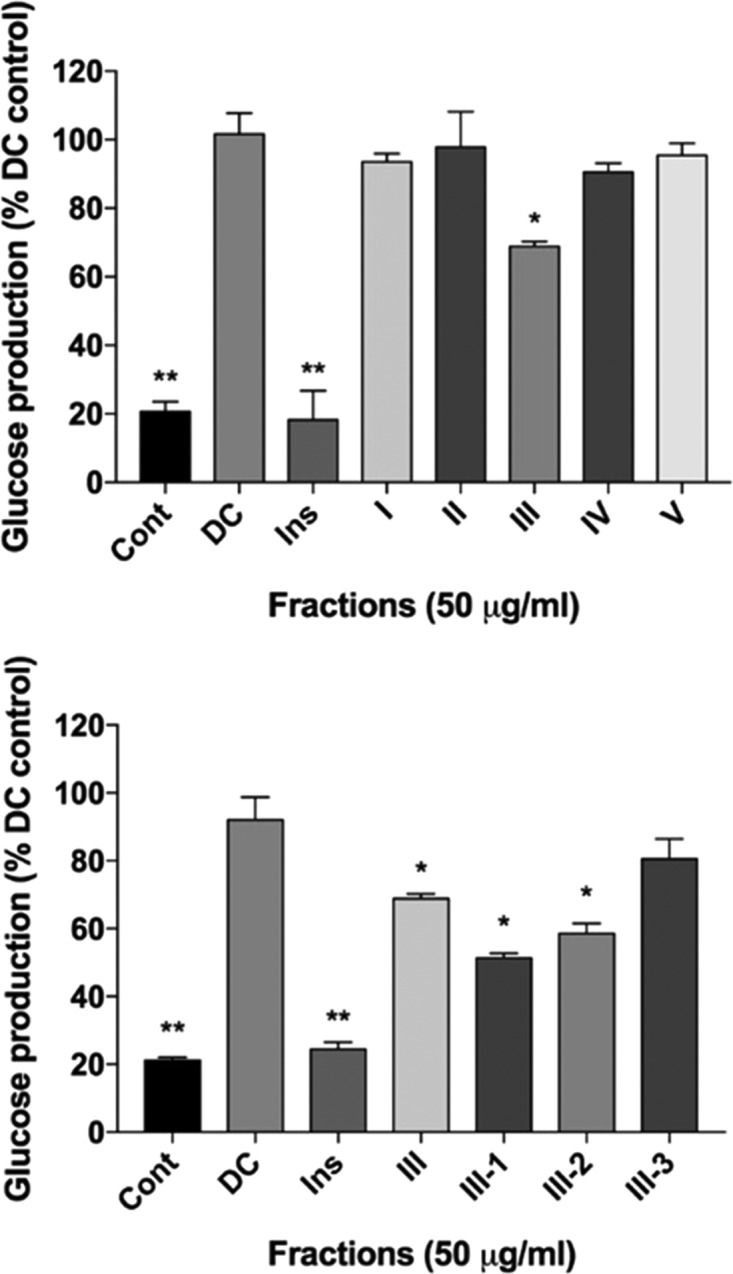
Activity of L. longiflorum fractions on H4IIE rat hepatoma glucose production expressed as the percent of the induced control. Mean glucose suppression ± SEM. Abbrev: Cont (Neg. control), DC (Dex-cAMP), Ins (Dex-cAMP + insulin).
Isolation and Identification of Compounds 1–9 from L. longiflorum Bulbs
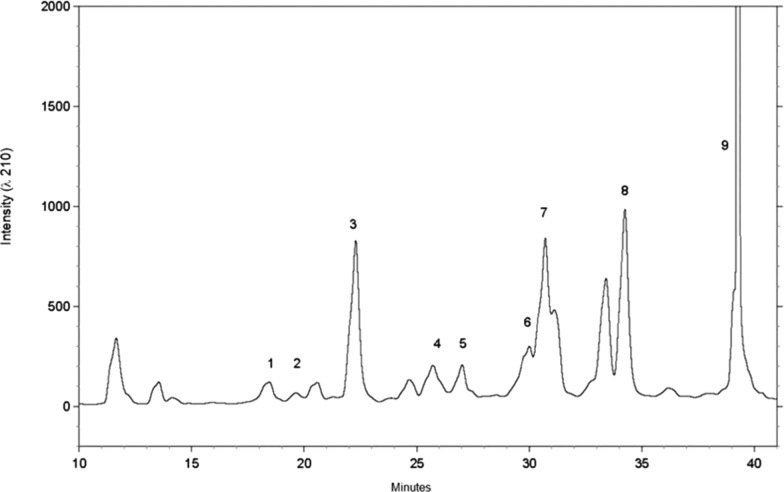
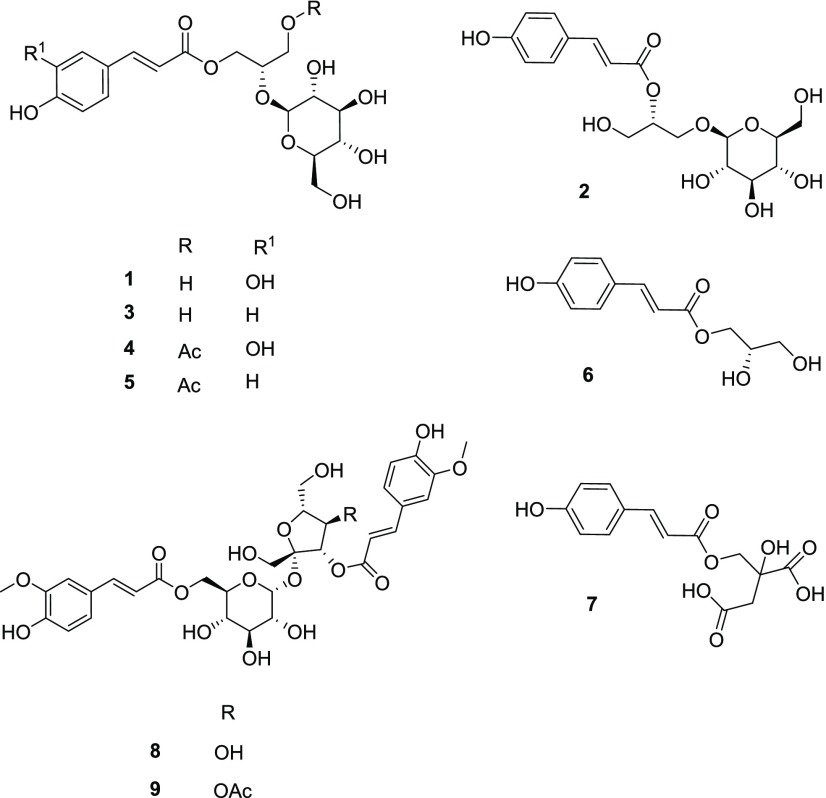
Subfractions III-1 and III-2 were pooled together (III-1/2) and fractionated by semipreparative RP-HPLC (Figure 4), yielding compounds 1–9 (Figure 5). All structures were determined through 1D 1H and 2D NMR.15,20 Low levels of saponins were also present in the fractions, although they were not explored further in this work.21
Figure 4.
Semipreparative RP-HPLC chromatogram (at 210 nm) of 1–9 purified from L. longiflorum Fraction (III-1/2).
Figure 5.
Structures of compounds 1–9 identified in L. longiflorum.
The first five compounds identified were phenylpropanoid glycerol glucosides, previously reported from the bulbs of L. longiflorum.(12,17) Compound 1 was confirmed to be (2S)-1-O-caffeoyl-2-O-β-d-glucopyranosylglycerol. The structure consisted of a glucosylated glycerol backbone and caffeoyl moiety. Using ESI––MS, a base peak was observed at m/z 415 (100, [M – H]−), consistent with MW 416 (see the Supporting Information for MS spectra of 1–9). Compound 2, (2R)-1-O-β-d-glucopyranosyl-2-O-p-coumaroylglycerol, consisted of glucose connected at the C1 of the glycerin backbone and an acyl group at C2 to connect the p-coumaroyl. For compound 2, a base ion peak was observed at m/z 399 (100, [M – H]−), consistent with MW 400. Compound 3, (2S)-1-O-p-coumaroyl-2-O-β-d-glucopyranosylglycerol, is an isomer of 2 differing only by the glycerol linkage, in that C2 350 connects to the glucose and C1 to the acyl group. Similar to 2, a base peak was observed at m/z 399 (100, [M – H]−). The p-coumaroyl 3 was the most predominant phenylpropanoid glycerol glucoside found in the L. longiflorum bulb.12 Both compounds 4, (2S)-1-O-caffeoyl-2-O-β-d-glucopyranosyl-3-O-acetylglycerol, and 5, (2S)-1-O-p-coumaroyl-2-O-β-d-glucopyranosyl-3-O-acetylglycerol, were acetylated with the only difference being the caffeoyl and coumaroyl groups, respectively. Compound 4 showed a base peak at m/z 457 (100, [M – H]−), consistent with MW 458. Both caffeoyl compound 1 and its acetylated derivative 4 were reported to have the highest concentrations in the leaf and flower tissues, respectively.12 For compound 5, a base peak was observed at m/z 441 (100, [M – H]−), consistent with MW 442. The acetylated compounds 4 and 5 had the overall highest concentrations in the L. longiflorum buds. Compound 6, (2S)-1-O-p-coumaroylglycerol, was identified in the fresh bulbs of L. longiflorum and is a phenolic monoacylated glycerol.17 This compound showed an ion at m/z 237 (100, [M – H]−), consistent with MW 238. Compound 7, (2)-hydroxy-3-O-p-coumaroyl-1,2-propanedicarboxylic acid, has been previously reported in L. longiflorum.(19) The compound is a p-coumaroyl ester of dihydroxydicarboxylic acid. Compound 7 showed ions at 309 (100, [M – H]−) and 163 (32, [M – 146]), consistent with MW 310. Both compound 8, 3,6′-diferuloylsucrose, and compound 9, 4-acetyl-3,6′-diferuloylsucrose, were previously identified in the bulb flesh of Lilium pardalinum, Lilium auratum, and L. longiflorum.(17,20) Their structures consist of sucrose esters with decorating feruloyl moieties on the C3 of the fructose and C6′ of the glucose. They differed in that compound 9 is acetylated at C4 of the fructose moiety. For compound 8, a base peak was observed at m/z 693 (100, [M – H]−), consistent with MW 694, and compound 9 had a base ion at m/z 735 (100, [M – H]−), consistent with MW 736.
Evaluation of Purified Compounds 1–9
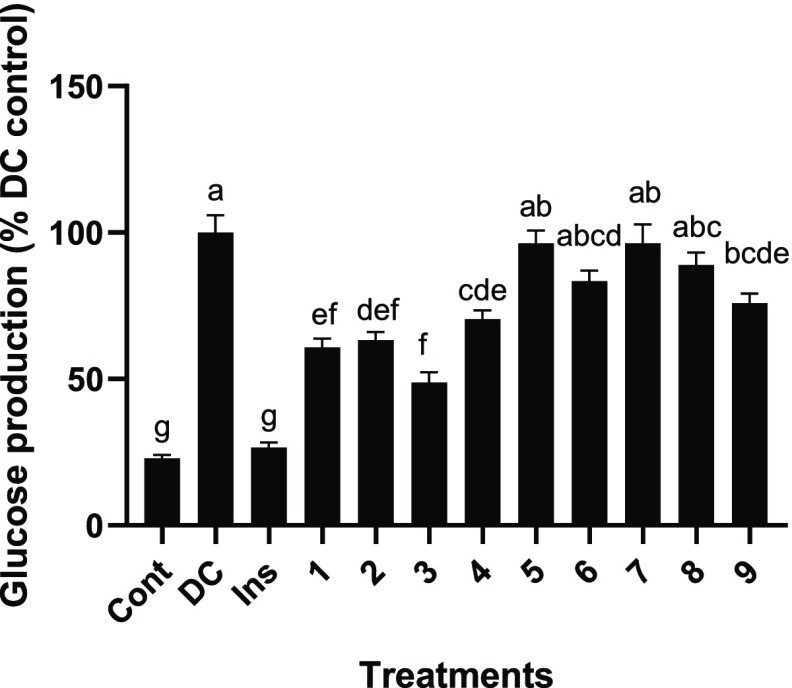
The effects of the compounds (1–9) were tested for inhibitive activity at 10 μM using cellular hepatic assays (Figure 6). Of the nine compounds examined, compounds 1–3 were effective at reducing glucose production by 39.2, 36.8, and 51.2%, respectively; however, there was no statistically significant distinction between their activity. The next compound examined, compound 4, an acetylated derivative of compound 1, reduced glucose production by 32.0% but was not significantly different from its nonacetylated counterpart compound 1.
Figure 6.
Effect of compounds 1–9 on H4IIE rat hepatoma glucose production expressed as the percent of the induced control. Mean glucose suppression ± SEM. Abbrev: Cont (Neg. control), DC (Dex-cAMP), Ins (Dex-cAMP + insulin). Each number corresponds to that compound.
Comparatively, other compounds were found to be ineffective inhibitors, with compound 5 showing only a 3.6% decrease in glucose production. Comparing compounds 3 and 5 suggests natural acetylation reduces antigluconeogenic activity (Figure 7). Both compounds 6 (phenolic monoacylated glycerol) and 7 were weak inhibitors, reducing glucose production by 16.5 and 3.6%, respectively. Furthermore, compounds 8 and 9 (sucrose esters) showed mild suppression of glucose production by 11.0 and 24.0%, respectively. Compounds 6–9 were statistically identical, yet 8 and 9 possessed a glucoside group decorated with additional fructose and ferulic acid groups, while compounds 6 and 7 did not. The key compositional difference between compounds 8 and 9 was an acetyl moiety, which is particularly interesting since the acetyl moiety in compounds 3 and 5 strongly controlled the inhibitory activity, yet there was no statistical difference in activity between compounds 8 and 9. Notably, there was no significant difference between compounds 5−9 and the control. As a result, the acetyl impacts the inhibitory activity and is dependent upon its location on the compound.
Figure 7.
Structural diagram of compounds 3 and 5 depicts how natural acetylation of 3 reduces activity.
The class of compounds identified here as 1–5, phenylpropanoid glycerol glucosides, have been reported throughout the Easter lily tissues and are commonly named regalosides. These compounds are acylated glycerol glucosides often containing p-coumaric, ferulic, or caffeic acids. Regalosides have a glucosylated glycerol backbone esterified at the C1 or C2 carbon, with either an S configuration at the 2-position, (2S)-regalosides being the most prevalent, or an R configuration, (2R)-regalosides being less common. Regalosides have been reported to show bioactivity, such as in the extracts of L. casablanca flower buds that contained regaloside 1 (an isomer of compound 5) which suppressed UVA-induced alterations in human dermal fibroblast morphology.22 In the current study system, the glucoside may act as a vehicle, engaging the molecule in gluconeogenesis, while additional groups may become subsequently engaged to establish inhibitory activity. However, to date, the bioactivity of regalosides as hepatic gluconeogenesis inhibitors has not been reported.
Comparing the inhibitory activity of these structurally similar compounds reveals that the location of decorating moiety groups, more so than their presence, significantly impacts the strength of their activity. Compounds 1–3 differ by their caffeoyl and coumaroyl groups, and glucoside linkages, suggesting that the number of −OH moieties located on the phenolic group is crucial to differential activity. Cinnamoyl glucosides have not been examined in this cell line, and so the role of the hydroxy groups is not completely established. The premise of location over the presence of groups in determining activity is emphasized when considering the glucoside group. Compounds 6 and 7 have no glucoside group and showed only weak activity, while compounds 1, 3, and 8 all have a glucoside group, but compound 8 was shown to be a weak inhibitor, while 1 and 3 were strong. The importance of the glucoside group is also emphasized by comparing these results with previous reports investigating the inhibitory activity of 3-caffeoylquinic acid and its major groups.5 In this previous work, both 3-caffeoylquinic acid and its major tail caffeoyl group showed similar inhibitory activity, 45% at 3.5 μg/mL and 50% at 5.4 μg/mL, while the isolated quinic acid group did not. This finding suggests that the inhibitory activity may originate in the caffeoyl group, consistent with our results from compound 1, that showed a 39.2 % reduction in activity. Still, we report a nominally enhanced activity in compound 3 by exchanging the caffeoyl group for a coumaroyl group. Based on these previous results, the isolated coumaroyl group, compound 6, should show similar inhibitory activity to compound 3. However, compound 6 showed a diminished inhibitory activity of only 16.5%, compared to compound 3, which showed 51.2%. This result implies that there is a strong reliance on the entire structure, which is distinctly different from previous reports.5
In summary, following activity-guided fractionation, a new class of compounds was identified as candidate hepatic glucose production inhibitors in L. longiflorum. Investigating the inhibitory activity of the five identified phenylpropanoid glycerol glucosides and structurally similar compounds reveals a strong dependence of activity on the moiety number and location. In hepatic glucose inhibitory assays, glucose production was suppressed by more than 50%, at concentrations of 10 μg/mL. This report is the first of phenylpropanoid glycerol glucosides as natural product hepatic glucose production inhibitors. The results of this study present a new class of natural dietary products that may be further investigated for their potential to control metabolic syndrome and potentially delay the subsequent onset of type II diabetes.
Acknowledgments
This work was supported by the USDA National Institute of Food and Agriculture Hatch Project #1016031.
Supporting Information Available
The Supporting Information is available free of charge on the ACS Publications website at DOI: 10.1021/acsomega.9b00751.
Mass spectra of each of the nine compounds identified from the bulbs of L. longiflorum. ESI––MS mass spectra of compounds 1 (Figure S1), 2 (Figure S2), 3 (Figure S3), 4 (Figure S4), 5 (Figure S5), 6 (Figure S6), 7 (Figure S7), 8 (Figure S8), and 9 (Figure S9) identified from the bulbs of L. longiflorum (PDF)
The authors declare no competing financial interest.
Supplementary Material
References
- Estimates of Diabetes and its Burden in the United States; Centers for Disease Control and Prevention. National Diabetes Statistics Report. US Department of Health and Human Services, 2017.
- Global Report on Diabetes: World Health Organization; World Health Organization, 2016.
- Rowley W. R.; Bezold C.; Arikan Y.; Byrne E.; Krohe S. Diabetes 2030: Insights from yesterday, today, and future trends. Popul. Health Manage. 2017, 20, 6–12. 10.1089/pop.2015.0181. [DOI] [PMC free article] [PubMed] [Google Scholar]
- Rines A. K.; Sharabi K.; Tavares C. D.; Puigserver P. Targeting hepatic glucose metabolism in the treatment of type 2 diabetes. Nat. Rev. Drug Discovery 2016, 15, 786. 10.1038/nrd.2016.151. [DOI] [PMC free article] [PubMed] [Google Scholar]
- Jackson K. M. P.; Rathinasabapathy T.; Esposito D.; Komarnytsky S. Structural constraints and importance of caffeic acid moiety for anti-hyperglycemic effects of caffeoylquinic acids from chicory. Mol. Nutr. Food Res. 2017, 61, 1601118 10.1002/mnfr.201601118. [DOI] [PubMed] [Google Scholar]
- Foretz M.; Guigas B.; Bertrand L.; Pollak M.; Viollet B. Metformin: From Mechanisms of Action to Therapies. Cell Metab. 2014, 20, 953–966. 10.1016/j.cmet.2014.09.018. [DOI] [PubMed] [Google Scholar]
- Scheen A. J. New hope for glucokinase activators in type 2 diabetes?. Lancet Diabetes Endocrinol. 2018, 6, 591–593. 10.1016/S2213-8587(18)30133-5. [DOI] [PubMed] [Google Scholar]
- Grisoni F.; Merk D.; Consonni V.; Hiss J. A.; Tagliabue S. G.; Todeschini R.; Schneider G. Scaffold hopping from natural products to synthetic mimetics by holistic molecular similarity. Commun. Chem. 2018, 1, 44–53. 10.1038/s42004-018-0043-x. [DOI] [Google Scholar]
- Welch C.; Zhen J.; Bassène E.; Raskin I.; Simon J. E.; Wu Q. Bioactive polyphenols in kinkéliba tea (Combretum micranthum) and their glucose-lowering activities. J. Food Drug Anal. 2018, 26, 487–496. 10.1016/j.jfda.2017.05.009. [DOI] [PMC free article] [PubMed] [Google Scholar]
- Esposito D.; Munafo J. P.; Lucibello T.; Baldeon M.; Komarnytsky S.; Gianfagna T. J. Steroidal glycosides from the bulbs of Easter lily (Lilium longiflorum Thunb.) promote dermal fibroblast migration in vitro. J. Ethnopharmacol. 2013, 148, 433–440. 10.1016/j.jep.2013.04.032. [DOI] [PubMed] [Google Scholar]
- Chiang N.; Ho C. T.; Munafo J. P. Identification of key aroma compounds in raw and roasted lily bulbs (Bai He). Flavour Fragrance J. 2018, 33, 294–302. 10.1002/ffj.3446. [DOI] [Google Scholar]
- Munafo J. P.; Gianfagna T. J. Quantitative Analysis of Phenylpropanoid Glycerol Glucosides in Different Organs of Easter Lily (Lilium longiflorum Thunb.). J. Agric. Food Chem. 2015, 63, 4836–4842. 10.1021/acs.jafc.5b00893. [DOI] [PubMed] [Google Scholar]
- Tang W. P.; Munafo J. P.; Palatini K.; Esposito D.; Huang M. T.; Komarnytsky S.; Ho C. T.; Gianfagna T. J. Hepatoprotective Activity of Easter Lily (Lilium longiflorum Thunb.) Bulb Extracts. J. Agric. Food Chem. 2015, 63, 9722–9728. 10.1021/acs.jafc.5b04078. [DOI] [PubMed] [Google Scholar]
- Munafo J. P.; Ramanathan A.; Jimenez L. S.; Gianfagna T. J. Isolation and Structural Determination of Steroidal Glycosides from the Bulbs of Easter Lily (Lilium longiflorum Thunb.). J. Agric. Food Chem. 2010, 58, 8806–8813. 10.1021/jf101410d. [DOI] [PubMed] [Google Scholar]
- Sashida Y.; Ori K.; Mimaki Y. Studies on the Chemical Constituents of the Bulbs of Lilium mackliniae. Chem. Pharm. Bull. 1991, 39, 2362–2368. 10.1248/cpb.39.2362. [DOI] [Google Scholar]
- Mimaki Y.; Sashida Y.; Shimomura H. Lipid and steroidal constituents of Lilium auratum var. Platyphyllum and L. tenuifolium. Phytochemistry 1989, 28, 3453–3458. 10.1016/0031-9422(89)80363-2. [DOI] [Google Scholar]
- Shimomura H.; Sashida Y.; Mimaki Y. New Phenolic Glycerol Glucosides, Regaloside D, E, and F from the Bulbs of Lilium Species. Jpn. J. Pharmacogn. 1989, 43, 64–70. [Google Scholar]
- Shimomura H.; Sashida Y.; Mimaki Y.; Iida N. Regaloside A and B, acylated glycerol glucosides from Lilium regale. Phytochemistry 1988, 27, 451–454. 10.1016/0031-9422(88)83118-2. [DOI] [Google Scholar]
- Sang Tai C.; Uemoto S.; Shoyama Y.; Nishioka I. Biologically active phenolics from Lilium longiflorum. Phytochemistry 1981, 20, 2565–2568. 10.1016/0031-9422(81)83095-6. [DOI] [Google Scholar]
- Shoyama Y.; Hatano K.; Nishioka I.; Yamagishi T. Phenolic glycosides from Lilium longiflorum. Phytochemistry 1987, 26, 2965–2968. 10.1016/S0031-9422(00)84572-0. [DOI] [Google Scholar]
- Mimaki Y.; Nakamura O.; Sashida Y.; Satomi Y.; Nishino A.; Nishino H. Steroidal saponins from the bulbs of Lilium longiflorum and their antitumour-promoter activity. Phytochemistry 1994, 37, 227–232. 10.1016/0031-9422(94)85030-5. [DOI] [PubMed] [Google Scholar]
- Yamaba H.; Haba M.; Kunita M.; Sakaida T.; Tanaka H.; Yashiro Y.; Nakata S. Morphological change of skin fibroblasts induced by UV Irradiation is involved in photoaging. Exp. Dermatol. 2016, 25, 45–51. 10.1111/exd.13084. [DOI] [PubMed] [Google Scholar]
Associated Data
This section collects any data citations, data availability statements, or supplementary materials included in this article.


