Abstract
A carbon quantum dot-based carbon paste electrode was fabricated and used for the determination of adrenaline (AD) at the nanomolar level. This fabricated electrode exhibited tremendous electrocatalytic activity for the oxidation of adrenaline in supporting electrolyte (PBS of pH 7.4). Scan rate variation studies with the modified electrode revealed that the overall electrode process was controlled by a diffusion process. A lower detection limit of 6 nM was achieved by chronoamperometry. Interference by biological molecules such as serotonin (5-HT) and ascorbic acid (AA) in the electrochemical oxidation of AD on the fabricated electrode was tested. It was observed that with the modified electrode, the selective determination of AD was possible. Further, with the fabricated electrode, simultaneous analysis of AA, AD, and 5-HT was performed, and it was observed that the overlapped peaks of these analytes on the naked electrode were well resolved into three peaks on the modified electrode. Along with decent sensitivity and selectivity, the electrode also showed higher stability and antifouling nature. The real-time application of the projected scheme was proven by employing the said electrode for adrenaline in adrenaline bitartrate injections.
1. Introduction
Adrenaline (AD) is a significant hormone that has a profound effect on neurotransmission. AD also acts as a moderator for transmission of nerve pulses to various organs.1−3 AD is administered for the treatment of certain ailing conditions like emphysema, bronchitis, bronchial asthma, eye disease, glaucoma, and other allergic conditions.4−6 Research on AD has importance in the fields of life sciences and medicine; therefore, a fast, simple, and accurate method for detecting and quantifying AD in physiological pH conditions is of grander interest. As AD is an electrochemically active biomolecule, an electrochemical method will be advantageous for its quantitative determination.7−10 In an electrochemical method, the oxidized product adsorbs strongly on the electrode surface, thus blocking its surface.11,12 In its natural state, AD exists with other chemical species such as AA or 5-HT, which are oxidized at almost similar potential values.13−16
Devices based on electrochemical detection have been well established for many years. The development of modified carbon-based electrodes, gold electrodes, and platinum electrodes in the past decades has resulted in enormous progress in electroanalytical chemistry.17−20 Recent literature reports have claimed that some fabricated electrodes for AD determination has been designed. Mainly, the electrochemical detection of AD was done using carbon-based electrodes like carbon paste electrodes,21−23 glassy carbon electrodes,24−27 and carbon nanotube-modified electrodes.28,29 In most of the cases, the electropolymerization techniques were employed for the fabrication of modified electrodes. To some extent, gold electrodes have also been used for the detection of adrenaline, normally modified with self-assembled monolayers (SAMs) of different compounds.30 There are reports on the use of electrodes modified with carbon nanotubes that could be useful in the detection of AD.31,32
Carbon quantum dots are carbon-based materials with a particle size less than 10 nm, which have captured great interest among scientists in recent years.33 Since they have excellent photoluminescence properties, high surface area, and low cost, CQDs have become a model material for various studies. Carbon quantum dots have been used in different fields including bioimaging, nanomedicine, photocatalysis, electrocatalysis, biosensing, and chemical sensing.34−39
Our lab has already reported the preparation and characterization of carbon quantum dots from styrene, and their applications in angiogenic studies and cell labeling studies were discussed in detail.40 In this paper, we are interested in the fabrication of a CQDs/CPE and its applicability toward the simultaneous analysis of AD, AA, and 5-HT in PBS (pH 7.4).
2. Results and Discussion
2.1. Electrochemical Characterizations
The electrochemical performance of a bare CPE (BCPE) besides the CQDs/CPE was studied using cyclic voltammetry using K3[Fe(CN)6] as a redox probe. The cyclic voltammograms of the different electrodes are shown in Figure 1 and were documented in 1 mM K3[Fe(CN)6] solution in a supporting electrolyte, 0.1 M KCl, at a scan rate of 50 mV/s. A couple of distinct redox peaks was detected with peak separation (ΔEp) of 66 mV for the BCPE (curve a); however, the ΔEp shown by the CQDs/CPE (curve b) was ∼61 mV. On the CQDs/CPE, the peak potential had moved to a slightly more positive value; also, the redox peak current had increased significantly when compared to that of the BCPE. This enhanced electrochemical performance could be due to the increased electrical conductivity of the CQDs existing on the electrode surface.
Figure 1.

Cyclic voltammograms of the bare CPE (curve a) and CQDs/CPE (curve b) in 1 mM K3Fe(CN)6 and 0.1 M KCl with a scan rate of 50 mV/s.
2.2. Electrochemical Performance of CQDs/CPE toward AD
Electrochemical analysis of adrenaline in physiological conditions was carried out by cyclic voltammetry. Figure 2 depicts cyclic voltammograms of 1 μM AD in PBS (pH 7.4) as the supporting electrolyte on the BCPE (curve a) and CQDs/CPE (curve b) with a 50 mV/s scan rate. It was observed that on the BCPE (curve a), AD exhibited a couple of redox peaks. An oxidation peak current of 4.7 μA was observed at a potential (Epa) of 0.129 V, and a peak current of 2.3 μA corresponding to the reduction process of AD was also observed at a potential (Epc) of −0.319 V. The quasi-reversible nature of AD on the BCPE was observed with high peak separation (442 mV). However, the anodic-to-cathodic peak separation of AD was reduced to 132 mV on the CQDs/CPE (curve b). On the CQDs/CPE, a negative shift in anodic peak potential (0.073 V) and a considerable positive shift in cathodic potential (−0.059 V) were also observed. When compared with the BCPE, an appreciable enhancement in both anodic (Ipa = 26.8 μA) and cathodic peak currents (Ipc = −20.81 μA) was observed on the CQDs/CPE. These results revealed that in physiological conditions, the CQDs/CPE catalyzes the electrochemical reaction of AD. This property may be attributed to the interaction between the cationic AD with the negatively charged layer of the CQDs/CPE.
Figure 2.
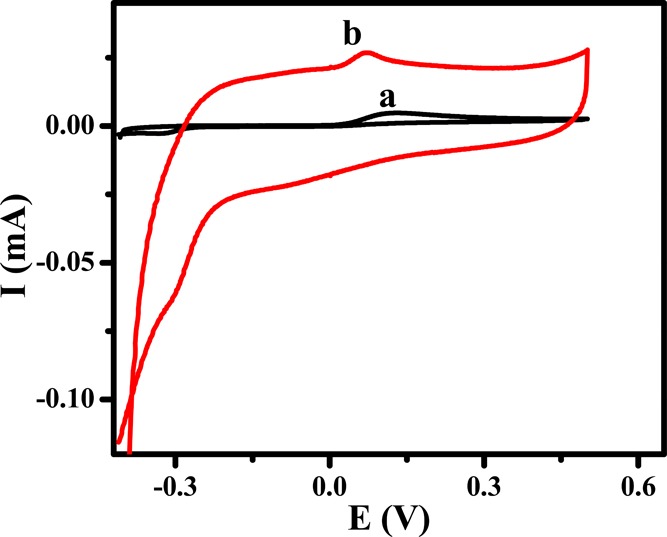
Cyclic voltammograms of 1 μM adrenaline on the BCPE (curve a) and CQDs/CPE (curve b) in 0.1 M PBS of pH 7.4.
2.3. Influence of Scan Rate on the Electrochemical Process of AD with CQDs/CPE
In order to get an idea about the diffusion and electron transfer coefficients, the cyclic voltammograms of 1 μM AD in pH 7.4 PBS (0.1 M) with different scan rates were plotted. On the CQDs/CPE, a linear increase in redox peak currents with a positive shift in peak potential was observed (Figure S1a). A similar trend was maintained by the bare CPE (Figure S2a). The graph of the square root of scan rate (ν) against oxidation peak current (Ipa) reveals the existence of a linear relationship between the peak current and the square root of scan rate (Figures S1b and S2b) with a correlation coefficient of 0.999 for both the CQDs/CPE and bare CPE. These observations suggest that the electrochemical process on the electrodes was controlled by diffusion. By using the Randles–Sevcik equation,
| 1 |
the diffusion coefficients for both the CQDs/CPE and BCPE were calculated to be 0.64 and 0.28 cm2 s–1, respectively. Further studies revealed that a good linear relationship exists between Epa and log ν (Figures S1c and S2c) with correlation coefficients of 0.997 and 0.996 for the CQDs/CPE and BCPE, respectively. From the above plot and from the equation
| 2 |
α was determined to be 0.43 for the CQDs/CPE and 0.35 for the BCPE.
2.4. Influence of Solution pH and Concentration of AD
The influence of solution pH on the peak potential (Epa) and peak current reaction of 1 μM AD on the CQDs/CPE in 0.1 M PBS (pH 7.4) was investigated. When the pH was varied from 9.4 to 5.4, the oxidation peak shifted toward more positive values (Figure S3a inset). Through the plot of the anodic peak of AD against pH (Figure S3a), the slope was obtained to be 65 mV, which was closer to the value of 59 mV for a two-electron transfer. The above result suggests that the forfeiting the electrons were conveyed by the loss of an equal number of protons. This means that an equivalent number of protons take part in the reactions. Similarly, from Figure S3b, it was clear that the peak of AD increased with increasing pH until it reached ∼7.4, and it also decreased when the pH was further increased. The better sensitivity and shape of the voltammogram of the peak suggested that pH 7.4 was suitable for further analysis.
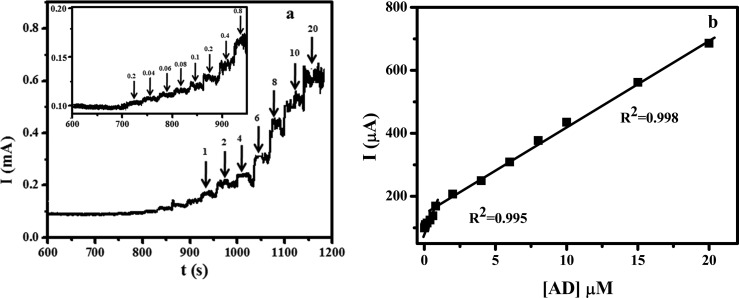
The effect of an increase in concentration on the electrochemical process of AD was determined using cyclic voltammetry. The peak current corresponding to AD oxidation was found to be increased with increasing concentration of AD (Figure S4). During the addition, a small shift in peak potential was also experienced. Further, in order to calculate the detection limit of the fabricated electrode, chronoamperometric experiments were performed. Figure 3a shows the chronoamperometric response of AD with different concentrations (0.02 to 20 μM) at 0.129 V. The plot of peak current against concentration of AD is depicted in Figure 3b. The obtained graph exhibited two linearity; one from 0.02 to 0.8 μM and the other from 0.8 to 20 μM. From the graph, the detection limit of the fabricated electrode toward AD was calculated to be 6 nm. Performance of the fabricated electrode was further compared with the reported electrode for the detection of AD (Table 1).
Figure 3.
(a) Chronoamperometric determination of AD with different concentrations with a time interval of 30 s. (b) Plot of concentration of AD vs current.
Table 1. Comparison of CQDs/CPE with Reported Methods.
| electrode | detection limit (μM) | linear range (μM) | method | reference |
|---|---|---|---|---|
| poly(1-methylpyrrole)-modified glassy carbon electrode | 0.168 | 0.75–200 | SWV | (4) |
| penicillamine self-assembled gold electrode | 0.1 | 10–200 and 50–1 | CV | (41) |
| l-glutamic acid-functionalized graphene nanocomposite-modified glassy carbon electrode | 0.03 | 0.1–1000 | DPV | (42) |
| carbon-paste electrode (CPE) modified with iron(II) phthalocyanine | 0.5 | 1–300 | DPV | (22) |
| multiwalled carbon nanotube-modified carbon paste electrode | 0.029 | 100–10 and 10–0.5 | DPV | (43) |
| CQDs/CPE | 0.006 | 0.02–0.8 and 0.8–20 | CA | this work |
2.5. Electrochemical Studies of 5-HT on CQDs/CPE
Figure 4 shows the cyclic voltammograms of 1 μM 5-HT on the BCPE and CQDs/CPE in 0.1 M phosphate buffer solution (pH 7.4). On the BCPE, 5-HT underwent electrochemical oxidation at 0.272 V with a peak of 1.94 μA. Compared with the BCPE, the CQDs/CPE showed high background current with the increase in the anodic peak of 5-HT. A distinct oxidation peak with a current of 43.05 μA appeared at 0.259 V.
Figure 4.
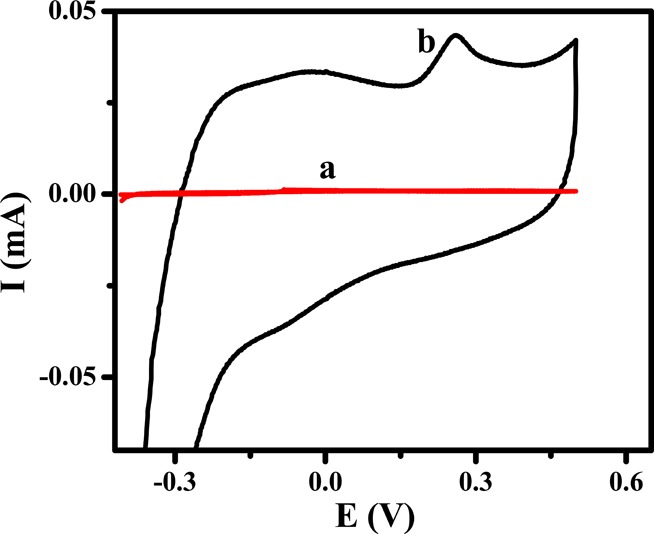
Cyclic voltammograms of 1 μM serotonin in PBS of pH 7.4 on the BCPE (curve a) and CQDs/CPE (curve b) with a scan rate of 50 mV/s.
2.6. Kinetics Studies
The influence of scan rate with the CQDs/CPE (Figure S5a) and BCPE (Figure S6a) on the potential of 5-HT in PBS (pH 7.4) was studied. On the BCPE surface, when the scan rate was varied from 50 to 150 mV/s, the oxidation current of 5-HT amplified considerably. It should also be noted from the above CVs that the oxidation peak of 5-HT moved to less positive values on both the BCPE and CQDs/CPE during the increase in scan rate, which signifies that a kinetics limitation is in existence between the active sites of the electrodes and 5-HT. Further, the increase in scan rate leads to an increase in the redox peak current due to the fact that in short-scale experiments, the reactant molecules will not have sufficient time for completion of the catalytic reaction. Diffusion and electron-transfer coefficients of 5-HT on the CQDs/CPE and BCPE were calculated by plotting Ip versus ν1/2 (Figures S5and S6b) and Ep versus log ν (Figures S5c and S6c). From eqs 1 and 2, D and α were calculated to be 0.97 cm2 s–1 and 0.5 for the fabricated CPE and 0.043 cm2 s–1 and 0.45 for the BCPE, respectively.
2.7. Role of pH and Concentration of 5-HT
The effect of pH on the electrochemical oxidation of 5-HT on the CQDs/CPE was studied by using cyclic voltammetry. Figure S7a (inset) shows the CV achieved for 10 μM 5-HT in PBS of different pH values varying from 5.4 to 9.4 on the CQDs/CPE. Here, yet again, a similar kind of shift in potential toward the negative side was experienced for the pH range from 5.4 to 9.4. From the figure, it was clear that the solution pH greatly influenced the electrochemical oxidation nature of 5-HT. Further, the graph of Epa versus pH (Figure S7a) was plotted, and the slope of the plot was found to be 64 mV. Here, we could arrive at a conclusion that this reaction involved the same number of electrons and protons as it comes very near to the standard reaction value of 59 mV/pH for a reaction that has the same number of protons and electrons. The plot of solution pH versus Ipa is depicted in Figure S7b. The peak current of 5-HT in PBS was higher at a pH of 5.4, it gradually decreased at pH 6.4, it attained the maximum at pH 7.4, and it further decreased from pH 7.4 to 9.4. Even though the peak current was comparable at both pH 5.4 and 7.4, the nature of the peak was good at pH 7.4, which is also the physiological pH.
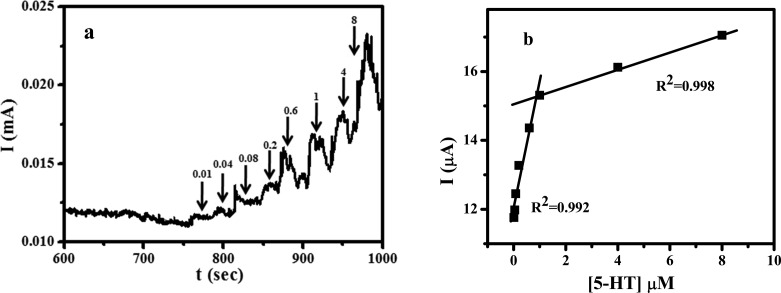
Figure S8 shows the CV on the CQDs/CPE with various concentrations of 5-HT in pH 7.4 PBS. It was clear that the current due to electrochemical oxidation of 5-HT increased with the increase in concentration of 5-HT. The detection limit and linearity range of the CQDs/CPE toward the oxidation of 5-HT were calculated by chronoamperometry (Figure 5a). From the calibration plot (Figure 5b), a lowest detection limit of 0.004 μM was achieved for 5-HT on the CQDs/CPE. The plot of concentration versus oxidation current exhibited a wider calibration graph with two linear ranges, one with a range of 0.01 to 1 μM (lower) and the other of 1 to 8 μM (higher). All these results revealed the capability of the fabricated electrode to act as an electrochemical sensor for both adrenaline and serotonin.
Figure 5.
(a) Chronoamperometric determination of 5-HT in PBS of pH 7.4 with different concentrations with a time interval of 30 s. (b) Plot of concentration of 5-HT vs current.
2.8. Electrochemical Behavior of AA on CQDs/CPE
The electrochemical oxidation of 1 μM AA in a solution of 0.1 M PBS of pH 7.4 with a 50 mV s–1 sweep rate on the BCPE (curve a) and CQDs/CPE (curve b) is shown in Figure 6. From the CV, it was observed that the oxidation peak of AA on the BCPE occurred at 0.268 V. It was also observed that on the CQDs/CPE, the oxidation peak current of AA increased considerably with a shift in potential toward the negative side. The increase in anodic current with a negative shift of −0.139 V suggests that the CQDs/CPE has a good catalytic effect on the oxidation process of AA. These observations suggested that the electron transfer of AA on the surface of the BCPE proceeded through slow electron-transfer kinetics. On the other hand, the CQDs/CPE surface catalyzed the oxidation process; hence, electron transfer advanced through fast kinetics.
Figure 6.

Cyclic voltammograms of 1 μM ascorbic acid in PBS of pH 7.4 on the BCPE (curve a) and CQDs/CPE (curve b) in 0.1 M PBS with a 50 mV/s scan rate.
Further, the scan rate’s effect on the AA oxidation with the CQDs/CPE and BCPE (Figures S9a and S10a) was studied by varying the scan rate in PBS (pH 7.4). While increasing the sweep rate, the oxidation peak of AA on both the bare and the fabricated electrodes also increased linearly. From the sweep rate studies, D and α for the BCPE were calculated to be 0.11 cm2 s–1 and 0.37, and for CQDs/CPE, they were 0.90 cm2 s–1 and 0.42, respectively (Figures S9b,c and S10b,c).
2.9. Effect of Solution pH and Concentration of AA
The influence of solution pH on the electrochemical oxidation of AA was studied from the range of 5.4 to 8.4 on the CQDs/CPE. A maximum peak current was observed for the solution with pH 7.4; a further increase in pH leads to a decrease in peak current (Figure S11b). This was due to the fact that AA in solutions with a pH value higher than 5.4 exists in the anionic form and this will electrostatically interact with the negative charge on the CQDs. The plot of oxidation peak potential against the pH range was also recorded (Figure S11a). A negative shift in peak potential of AA with an increase in pH is a solid proof for the participation of protons in the reaction. Consequently, as we received the highest current with good sensitivity for pH 7.4 solution, this condition was further selected as an optimum pH for further electrochemical reactions.
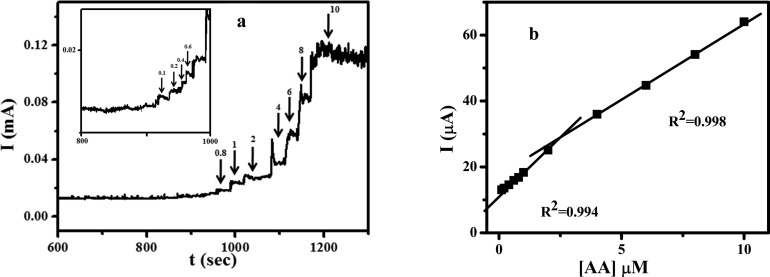
Figure S12 shows the CV of electrochemical oxidation of AA with various concentrations on the CQDs/CPE in PBS of pH 7.4. It was clear from the CV that the concentration of AA exhibits a direct relationship with the anodic peak current of AA. The detection limit and linearity range of the CQDs/CPE toward the oxidation of AA were calculated by chronoamperometry (Figure 7a). The peak current against concentration of AA was plotted (Figure 7b). The plot exhibits two linearities, one for the lower concentration (0.1 to 2 μM) and the other for the higher concentration range (2 to 10 μM). From the plot using the lower linearity, the detection limit of the fabricated electrode toward the AA was calculated to be 0.06 μM.
Figure 7.
(a) Chronoamperometric determination of AA with different concentrations with a time interval of 30 s. (b) Plot of concentration of AA vs current.
2.10. Simultaneous Analysis of AD, 5-HT, and AA
In biological samples, as compared to 5-HT and AA, AD is present in low concentrations; thus, on the bare electrodes, overlapped voltammograms due to the closeness in their oxidation potentials were observed. Cyclic voltammograms recorded with both the bare CPE and CQDs/CPE for a ternary solution of 1 μM AD, 0.1 mM AA, and 0.1 mM 5-HT in pH 7.4 PBS are shown in Figure 8a. It was evident from the figure that the ternary mixture on the CPE surface gave a broad peak at ∼0.198 V (curve a). Meanwhile, on the CQDs/CPE, three well-separated peaks corresponding to the oxidation of AA, AD, and 5-HT appeared at −0.140, 0.057, and 0.236 V, respectively. The peak-to-peak separation values achieved with the fabricated electrode are large enough to identify them simultaneously.
Figure 8.
(a) Cyclic voltammograms and (b) differential pulse voltammograms of 0.1 mM AA and 0.1 mM 5-HT in the presence of different concentrations of AD (from 0.2 to 70 μM) on the CQDs/CPE in pH 7.4 PBS.
The interference of AA and 5-HT in the analysis of AD with the modified electrode was performed by cyclic voltammetry in pH 7.4 PBS with varying concentrations of AD in the presence of other moieties of unvarying concentration. Furthermore, the differential pulse voltammogram was also recorded with the CQDs/CPE in 0.1 M PBS of pH 7.4 with 0.1 mM AA, 0.1 mM 5-HT, and AD with different concentrations (Figure 8b). From the figure, it is clear that the peak current corresponding to AD oxidation increased linearly with the increase in its concentration but the peak potential remains the same in the presence of AA and 5-HT. Simultaneously, it was also observed that the peak potentials remain unaltered with any enhancement in the peak current for the other two species. Similarly, the increase in concentration of the other two species also did not interfere with the oxidation current and potential of the former.
2.11. Mechanism of Sensing
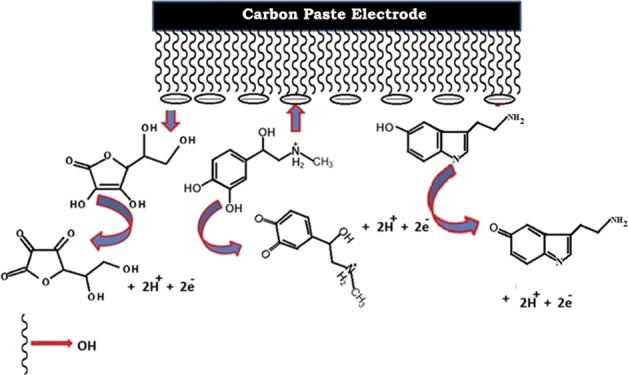
The CQDs were functionalized with hydroxyl groups; hence, the surface of the modified electrode has negative charges. AD in solution exists in its cationic form, and therefore, it would be attracted electrostatically toward the negatively charged electrode surface and hence produce a higher redox current. Conversely, AA exists in its anionic form, and thus it would be repelled by the electrode surface. Hence, the AA oxidation peak moved to a large negative value on the modified electrode (Scheme 1). This could be the reason for the separation of AA and AD on the CQDs/CPE.
Scheme 1. Oxidation of AA, AD, and 5-HT on CQDs/CPE.
2.12. Real-Sample Analysis
In order to validate the real-time application of the CQDs/CPE, the concentration of AD present in real samples, that is, an injection sample of AD bitartrate (1 mg/mL), was determined. Varying concentrations of AD by a standard addition method was plotted against corresponding current. From this calibration plot, an acceptable percentage recovery in the range of 99.4–103.0% was achieved with the fabricated electrode. These results revealed the potential of the fabricated electrode to become a promising candidate for the analysis of AD in AD injections (Table 2).
Table 2. Detection of AD from Adrenaline Bitartrate Injection Using CQDs/CPE.
| samples | added (μg mL–1) | found (μg mL–1) | RSD (%) | recovery rate (%) |
|---|---|---|---|---|
| 1 | 1 | 1.03 | 1.07 | 103 |
| 2 | 3 | 3.05 | 0.51 | 101.6 |
| 3 | 5 | 4.97 | 0.88 | 99.4 |
2.13. Reusability and Stability of the CQDs/CPE
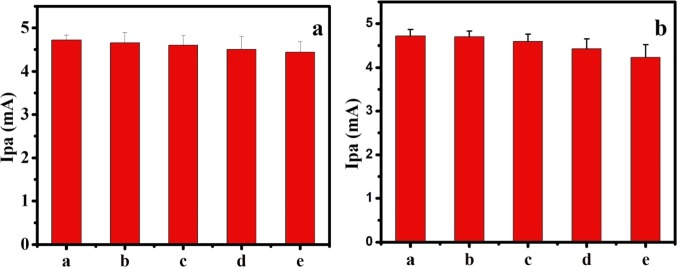
To facilitate the reusability, the fabricated electrode was employed, recording repetitive CV of AD in 0.1 M PBS of pH 7.4. Even after 20 successive potential scans, the modified electrode was able to produce 94.2% of the initial oxidation and 95.1% of the initial reduction currents of AD (Figure 9a), suggesting the reusability of the fabricated electrode. Further, the long-term stability of the developed electrode was analyzed, storing the CQDs/CPE at room temperature in 0.1 M PBS and measuring the electrochemical signals every 4 days of storage under the same conditions. On the 15th day, CVs were recorded for the electrochemical oxidation of AD with the CQDs/CPE, and it was found that the modified electrode was able to reproduce 90% of the initial response (Figure 9b). These results are sufficient to claim the merit of reusability and stability of the CQDs/CPE toward the electrochemical determination of AD.
Figure 9.
(a) Stability of the CQDs/CPE by comparison of Ip at different times: (a) 1, (b) 4, (c) 8, (d) 12, and (e) 16 days. (b) Reusability of the CQDs/CPE by comparison of Ip at different cycles (a) 1, (b) 5, (c) 10, (d) 15, and (e) 20 cycles.
3. Conclusions
The capability of the fabricated CQDs/CPE for the electrochemical oxidation of AD in 0.1 M PBS was analyzed. The sweep rate studies with the CQDs/CPE revealed that the electrode process was controlled by the diffusion process. When compared with the bare CPE, the CQDs/CPE possessed larger surface area and higher electron transfer and diffusion coefficients. The pH of the electrolyte (PBS) has also a crucial role in the electrochemical oxidation of AD on the CQDs/CPE. A well-oriented CV with higher sensitivity was observed for the PBS of pH 7.4. Moreover, the overlapped voltammograms of AA, 5-HT, and AD with the bare CPE was well resolved into three separate peaks with the fabricated electrode. The ability of the CQDs/CPE to simultaneously determine these analytes was further confirmed by DPV. The performance of the fabricated electrode was highly reproducible and repeatable. The real-time application of the constructed electrode was verified by introducing it for the determination of concentration of AD present in the injection sample of adrenaline bitartate with a recovery value of 99.4–103.0%. The selectivity studies with the CQDs/CPE confirmed that even 1000-fold concentrations of AA and 5-HT were not interfering in the oxidation of AD.
4. Materials and Methods
4.1. Reagents and Chemicals
A fresh adrenaline (Tokyo Chemical Industry Company, Japan) solution was prepared in 0.1 M perchloric acid, a serotonin (Tokyo Chemical Industry Company, Japan) solution in sodium hydroxide, and ascorbic acid (Riedel-de Haën chemicals) solutions in double distilled water. The supporting electrolyte used was 0.1 M PBS and was prepared by mixing Na2HPO4 and NaH2PO4. In all the experiments, the pH was maintained at 7.4.
4.2. Apparatus
A VSP potentiostat/galvanostat (Biologic Science Instruments) was used for performing all the experiments. The electrode system contained the CQDs/CPE and BCPE as the working electrode (3.0 mm in diameter), saturated calomel as the reference electrode (SCE), and a platinum wire as the counter electrode.
4.3. Synthesis of CQDs and Fabrication of CQDs/CPE
Carbon quantum dots (CQDs) were prepared as described earlier.25 Briefly, carbon soot was mixed with NaOH (pH 7.4), stirred using a magnetic stirrer for 30 min, and centrifuged at 900 rpm for 25 min, followed by multiple steps of sonication and centrifugation. The resultant solution was filtered. The characterized CQDs were further used for the fabrication of the modified electrode.
A homogeneous carbon paste electrode was prepared by grinding 70% graphite powder in 30% silicone oil. The carbon paste was packed into the cavity of a homemade electrode, and using weighing paper, it was smoothed out. The CQDs/CPE was prepared by drop-casting 20 μL of CQDs on the electrode surface and dried for 20 min.
4.4. Electrochemical Measurements
For the oxidation of 1 μM AD, cyclic voltammetry (CV) was used with a potential range of −0.4 to 0.5 V. Chronoamperometry (CA) was performed with a potential of 1.2 V for 20 min for the calculation of the detection limit and linearity range. The separation and selectivity studies were conducted using differential pulse voltammetry (DPV) in the potential range from −0.25 to 0.3 V. In all the cases, 0.1 M PBS of pH 7.4 was used as a supporting electrolyte.
Acknowledgments
S.S.S. would like to acknowledge KCSTE, Kerala, India, and R.B.R. would like to acknowledge the Department of Science and Technology (DST), Govt. of India, for the financial help.
Supporting Information Available
The Supporting Information is available free of charge on the ACS Publications website at DOI: 10.1021/acsomega.9b00230.
Cyclic voltammograms of oxidation of 1 μM adrenaline in PBS of pH 7.4 at various scan rates (50 to 150 mV/s) on the CQDs/CPE, plot of Ip vs ν1/2, plot of Ep vs log ν; cyclic voltammograms of oxidation of 1 μM adrenaline in PBS of pH 7.4 at various scan rates (80 to 150 mV/s) on the BCPE, plot of Ip vs ν1/2, plot of Ep vs log ν and plot of Epa vs pH (inset); oxidation peak of 1 μM AD in PBS of different pH values with a scan rate of 50 mV/s, plot of Ipa vs pH; cyclic voltammograms of AD with different concentrations (0.1 to 8 μM) on the CQDs/CPE in pH 7.4 PBS and cyclic voltammograms of oxidation of 1 μM serotonin in PBS of pH 7.4 with various scan rates (50 to 150 mV/s) on the CQDs/CPE, plot of Ip vs ν1/2, plot of Ep vs log ν; cyclic voltammograms of oxidation of adrenaline (10–6 M) at various scan rates (60 to 150 mV/s) on the CPE, plot of Ip vs ν1/2, plot of Ep vs log ν and plot of Epa vs pH (inset); electrochemical oxidation peaks of 10 μM 5-HT in PBS with pH varying from 5.4 to 9.4, plot of Ipa vs pH; cyclic voltammograms of 5-HTof different concentrations (1 to 100 μM) in pH 7.4 PBS on the CQDs/CPE with a scan rate of 50 mV/s and cyclic voltammograms of oxidation of ascorbic acid (10–6 M) at various scan rates (50 to 150 mV/s) on the CQDs/CPE, plot of Ip vs ν1/2, plot of Ep vs log ν; cyclic voltammograms of oxidation of ascorbic acid (10–6 M) at various scan rates (50 to 100 mV/s) on the BCPE, plot of Ip vs ν1/2, plot of Ep vs log ν, plot of Epa vs pH, and plot of Ipa vs pH; and cyclic voltammograms of different concentrations of AA (5 to 100 μM) on the CQDs/CPE in pH 7.4 PBS (PDF)
The authors declare no competing financial interest.
Supplementary Material
References
- Ren W.; Luo H.; Li N. Electrochemical Behavior of epinephrine at a glassy carbon electrode modified by electrodeposited films of caffeic acid. Sensors 2006, 6, 80–89. 10.3390/s6020080. [DOI] [Google Scholar]
- Crispino M.; Crispino E.. 2015Brain. In: Olivetti L. (eds) Atlas of Imaging Anatomy; Springer: doi: 10.1007/978-3-319-10750-9. [DOI] [Google Scholar]
- Francis M.; David R. The cutaneous sensory system. Neurosci. Biobehav. Rev. 2010, 34, 148–159. 10.1016/jneubiorev.2009.08.004. [DOI] [PubMed] [Google Scholar]
- Izaoumen N.; Bouchta D.; Zeji H.; El Kaoutit M.; Temsamani K. R. The Electrochemical Behavior of Neurotransmitters at a poly (Pyrrole– β–Cyclodextrin) modified glassy carbon electrode. Anal. Lett. 2007, 38, 1869–1885. 10.1080/00032710500230855. [DOI] [Google Scholar]
- Aslanoglu M.; Kutluay A.; Karabulut S.; Abbasoglu S. Voltammetric determination of adrenaline using a poly(1-methylpyrrole) modified glassy carbon electrode. J. Chin. Chem. Soc. 2008, 55, 794–800. 10.1002/jccs.200800119. [DOI] [Google Scholar]
- Lundberg U. Methods and applications of stress research. Technol. Health Care 1995, 3, 3–9. 10.3233/THC-1995-3102. [DOI] [PubMed] [Google Scholar]
- Ghica M. E.; Brett C. M. A. Simple and efficient epinephrine sensor based on carbon nanotube modified carbon film electrodes. Anal. Lett. 2013, 46, 1379–1393. 10.1080/00032719.2012.762584. [DOI] [Google Scholar]
- Li Y.; Xu J.; Sun C. Chemical sensors and biosensors for the detection of melamine. RSC Adv. 2015, 5, 1125–1147. 10.1039/C4RA13080D. [DOI] [Google Scholar]
- Pedero M.; Campuzano S.; Pingarrón J. M. Electroanalytical sensors and devices for multiplexed detection of Foodborne pathogen microorganisms. Sensors 2009, 9, 5503–5520. 10.3390/s90705503. [DOI] [PMC free article] [PubMed] [Google Scholar]
- Ni F.; Wang Y.; Zhang D.; Gao F.; Li M. Electrochemical oxidation of epinephrine and uric acid at a layered double hydroxide film modified glassy Carbon electrode and its application. Electroanalysis 2010, 22, 1130–1135. 10.1002/elan.200900530. [DOI] [Google Scholar]
- Orts J. M.; Feliu J. M.; Aldaz A. Voltammetric study of the electrochemical behaviour of glycolic acid solutions in sulphuric acid on platinum single-crystal electrodes with basal orientations. J. Electroanal. Chem. 1992, 323, 303–318. 10.1016/0022-0728(92)80018-Y. [DOI] [Google Scholar]
- Schlereth D. D.; Katz E.; Schmidt H.-L. Surface-modified gold electrodes for electrocatalytic oxidation of NADH based on the immobilization of phenoxazine and phenothiazine derivatives on self-assembled monolayers. Electroanalysis 1995, 7, 46–54. 10.1002/elan.1140070105. [DOI] [Google Scholar]
- Jusys Z.; Behm R. J. Adsorption and oxidation of formaldehyde on a polycrystalline Pt film electrode: An in situ IR spectroscopy search for adsorbed reaction intermediates. Beilstein J Nanotechnol. 2014, 5, 747–759. 10.3762/bjnano.5.87. [DOI] [PMC free article] [PubMed] [Google Scholar]
- Liu H.; Zhao G.; Wen L.; Ye B. Simultaneous voltammetric Determination of epinephrine and serotonin at a p-tetra-butyl calix [6] arene-L-histidine chemically modified electrode. J.Anal.Chem. 2006, 61, 1104–1107. 10.1134/S1061934806110116. [DOI] [Google Scholar]
- Wang C.; Yuan R.; Chai Y.; Chen S.; Hu F.; Zhang M. Simultaneous determination of ascorbic acid, dopamine, uric acid and tryptophan on gold nanoparticles/overoxidized-polyimidazole composite modified glassy carbon Electrode. Analytica chimica acta. 2012, 741, 15–20. 10.1016/j.aca.2012.06.045. [DOI] [PubMed] [Google Scholar]
- Mphuthi N. G.; Adekunle A. S.; Ebenso E. E. Electrocatalytic oxidation of epinephrine and norepinephrine at metal oxide doped phthalocyanine/MWCNT composite sensor. Sci. Rep. 2016, 6, 1–20. 10.1038/srep26938. [DOI] [PMC free article] [PubMed] [Google Scholar]
- Shereema R. M.; Nambiar S. R.; Shankar S. S.; Rao T. P. CeO2–MWCNT nanocomposite based electrochemical sensor for acetaldehyde. Anal. Methods 2015, 7, 4912–4918. 10.1039/C5AY00747J. [DOI] [Google Scholar]
- Shankar S. S.; Swamy B. E. K.; Chandrashekar B. N. Electrochemical selective determination of dopamine at TX-100 modified carbon paste electrode: A voltammetric study. J. Mol. Liq. 2012, 168, 80–86. 10.1016/j.molliq.2012.01.012. [DOI] [Google Scholar]
- Bonfil Y.; Brand M.; Kirowa-Eisner E. Determination of sub-μgl–1 concentrations of copper by anodic stripping voltammetry at the gold electrode. Anal. Chim. Acta 1999, 387, 85–95. 10.1016/S0003-2670(99)00066-5. [DOI] [Google Scholar]
- Zejli H.; de Cisneros J. L. H.-H.; Naranjo-Rodriguez I.; Temsamani K. R. Stripping voltammetry of silver ions at polythiophene-modified platinum electrodes. Talanta 2007, 71, 1594–8. 10.1016/j.talanta.2006.07.052. [DOI] [PubMed] [Google Scholar]
- Ensafi A. A.; Taei M.; Khayamian T. Simultaneous determination of ascorbic acid, epinephrine, and uric acid by differential pulse voltammetry using poly(p-xylenolsulfonephthalein) modified glassy carbon electrode. Colloids Surf., B 2010, 79, 480–487. 10.1016/j.colsurfb.2010.05.017. [DOI] [PubMed] [Google Scholar]
- Shahrokhian S.; Ghalkhani M.; Amini M. K. Application of carbon-paste electrode modified with iron phthalocyanine for voltammetric determination of epinephrine in the presence of ascorbic acid and uric acid. Sens. Actuators, B 2009, 137, 669–675. 10.1016/j.snb.2009.01.022. [DOI] [Google Scholar]
- Hadi M. M.; Hadi B. simultaneous voltammetric determination of norepinephrine and acetaminophen at the surface of a modified carbon nanotube paste electrode. Int. J. Electrochem. Sci. 2011, 6, 6503–6513. [Google Scholar]
- Akhgar M. R.; Beitollahi H.; Salari M.; Karimi-Maleh H.; Zamani H. Fabrication of a sensor for simultaneous determination of norepinephrine, acetaminophen and tryptophan using a modified carbon nanotube paste electrode. Anal. Methods 2012, 4, 259–264. 10.1039/C1AY05503H. [DOI] [Google Scholar]
- Shankar S. S.; Swamy K. Detection of epinephrine in presence of serotonin and ascorbic acid by ttab modified carbon paste electrode: A voltammetric study. Int. J. Electrochem. Sci. 2014, 9, 1321–1339. [Google Scholar]
- Luo L.; Li F.; Zhu L.; Ding Y.; Zhang Z.; Deng D.; Lu B. Simultaneous determination of epinephrine and uric acid at ordered mesoporous carbon modified glassy carbon electrode. Anal.Methods 2012, 4, 2417–2422. 10.1039/C2AY25168J. [DOI] [Google Scholar]
- Lavanya N.; Fazio E.; Neri F.; Bonavita A.; Leonardi S. G.; Neri G.; Sekar C. Simultaneous electrochemical determination of epinephrine and uric acid in the presence of ascorbic acid using SnO 2 /graphene nanocomposite modified glassy carbon electrode. Sensors and Actuators B 2015, 221, 1412–1422. 10.1016/j.snb.2015.08.020. [DOI] [Google Scholar]
- Moraes F. C.; Golinelli D. L. C.; Mascaro L. H.; Machado S. A. S. Determination of epinephrine in urine using multi-walled carbon nanotube modified with cobalt phthalocyanine in a paraffin composite electrode. Sens. Actuators, B 2010, 148, 492–497. 10.1016/j.snb.2010.05.005. [DOI] [Google Scholar]
- Ou L. B.; Liu Y. N.; Wang J.; Zhang L. Enhanced voltammetric detection of epinephrine at a carbon nanotube/Nafion composite electrode in the presence of ascorbic acid. J. Nanosci. Nanotechnol. 2009, 9, 6614–6619. 10.1166/jnn.2009.1471. [DOI] [PubMed] [Google Scholar]
- Sun Y.-X.; Wang S.-F.; Zhang X.-H.; Huang Y.-F. Simultaneous determination of epinephrine and ascorbic acid at the electrochemical sensor of triazole SAM modified gold electrode. Sens. Actuat. B 2006, 113, 156–161. 10.1016/j.snb.2005.02.042. [DOI] [Google Scholar]
- Valentini F.; Palleschi G.; Lopez Morales E.; Orlanducci S.; Tamburri E.; Terranova M. L. Functionalized single-walled carbon nanotubes modified microsensors for the selective response of epinephrine in presence of ascorbic acid. Electroanalysis 2007, 19, 859–869. 10.1002/elan.200603788. [DOI] [Google Scholar]
- Wang G.; Liu X.; Yu B.; Luo G. Electrocatalytic response of norepinephrine at a β-cyclodextrin incorporated carbon nanotube modified electrode. J. Electroanal. Chem. 2004, 567, 227–231. 10.1016/j.jelechem.2003.12.029. [DOI] [Google Scholar]
- Xu X.; Ray R.; Gu Y.; Ploehn H. J.; Gearheart L.; Raker K.; Scrivens W. A. Electrophoretic analysis and purification of fluorescent single-walled carbon nanotube fragments. J. Am. Chem. Soc. 2004, 126, 12736–12737. 10.1021/ja040082h. [DOI] [PubMed] [Google Scholar]
- Guo Y.; Wang Z.; Shao H.; Jiang X. Hydrothermal synthesis of highly fluorescent carbon nanoparticles from sodium citrate and their use for the detection of mercury ions. Carbon 2013, 52, 583–589. 10.1016/j.carbon.2012.10.028. [DOI] [Google Scholar]
- Tao H.; Yang K.; Ma Z.; Wan J.; Zhang Y.; Kang Z.; Liu Z. In vivo nir fluorescence imaging, biodistribution, and toxicology of photoluminescent carbon dots produced from carbon nanotubes and graphite. Small 2012, 8, 281–290. 10.1002/smll.201101706. [DOI] [PubMed] [Google Scholar]
- Kumar A. S.; Ye T.; Takami T.; Yu B.-C.; Flatt A. K.; Tour J. M.; Weiss P. S. Reversible photo-switching of single azobenzene molecules in controlled nanoscale environments. Nano Lett. 2008, 8, 1644–1648. 10.1021/nl080323+. [DOI] [PubMed] [Google Scholar]
- Morozan A.; Jaouen F. Metal organic frameworks for electrochemical applications. Energy Environ. Sci. 2012, 5, 9269–9290. 10.1039/C2EE22989G. [DOI] [Google Scholar]
- Ding C.; Zhu A.; Tian Y. Functional surface engineering of c-dots for fluorescent biosensing and in vivo bioimaging. Acc. Chem. Res. 2014, 47, 20–30. 10.1021/ar400023s. [DOI] [PubMed] [Google Scholar]
- Esteves da Silva J. C.; Goncalves H. M. R. Analytical and bioanalytical applications of carbon dots. TrAC, Trends Anal. Chem. 2011, 30, 1327–1336. 10.1016/j.trac.2011.04.009. [DOI] [Google Scholar]
- Shereema R. M.; Sruthi T. V.; Sameer Kumar V. B.; Rao T. P.; Sharath Shankar S. Angiogenic profiling of synthesized carbon quantum dots. Biochemistry 2015, 54, 6352–6356. 10.1021/acs.biochem.5b00781. [DOI] [PubMed] [Google Scholar]
- Wang L.; Bai J.; Huang P.; Wang H.; Zhang L.; Zhao Y. Electrochemical behavior and determination of epinephrine at a penicillamine self-assembled gold electrode. Int. J. Electrochem. Sci. 2006, 1, 238–249. [Google Scholar]
- Kang H.; Jin Y.; Han Q. Electrochemical detection of epinephrine using an l-glutamic acid functionalized graphene modified electrode. Anal. Lett. 2014, 47, 1552–1563. 10.1080/00032719.2013.876541. [DOI] [Google Scholar]
- Thomas T.; Mascarenhas R. J.; Martis P.; Mekhalif Z.; Kumara Swamy B. E. Multi-walled carbon nanotube modified carbon paste electrode as an electrochemical sensor for the determination of epinephrine in the presence of ascorbic acid and uric acid. Mater. Sci. Eng., C 2013, 33, 3294–3302. 10.1016/j.msec.2013.04.010. [DOI] [PubMed] [Google Scholar]
Associated Data
This section collects any data citations, data availability statements, or supplementary materials included in this article.


