Abstract
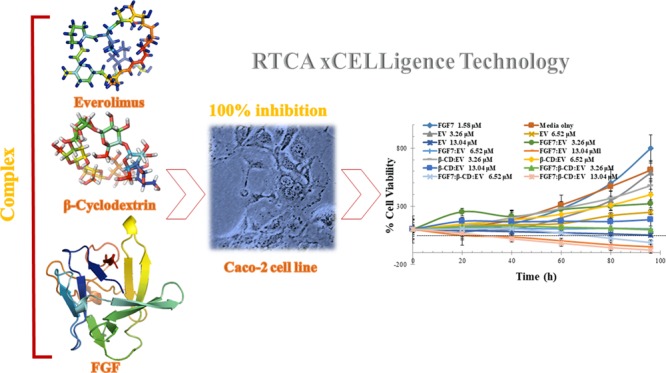
Several studies have shown that the mammalian target of rapamycin (mTOR) inhibitor; everolimus (EV) improves patient survival in several types of cancer. However, the meaningful efficacy of EV as a single agent for the treatment of colorectal cancer (CRC) has failed to be proven in multiple clinical trials. Combination therapy is one of the options that could increase the efficacy and decrease the toxicity of the anticancer therapy. This study revealed that the β-cyclodextrin (β-CD):FGF7 complex has the potential to improve the antiproliferative effect of EV by preventing FGF receptor activation and by enhancing EV cellular uptake and intracellular retention. Molecular docking techniques were used to investigate the possible interaction between EV, β-CD, and FGF7. Molecular docking insights revealed that β-CD and EV are capable to form a stable inclusion complex with FGF at the molecular level. The aqueous solubility of the inclusion complex was increased (3.1 ± 0.23 μM) when compared to the aqueous solubility of pure EV (1.7 ± 0.16 μM). In addition, the in vitro cytotoxic activity of a FGF7:β-CD:EV complex on Caco-2 cell line was investigated using real-time xCELLigence technology. The FGF7:β-CD:EV complex has induced apoptosis of Caco-2 cells and shown higher cytotoxic activity than the parent drug EV. With the multitargets effect of β-CD:FGF7 and EV, the antiproliferative effect of EV was remarkably improved as the IC50 value of EV was reduced from 9.65 ± 1.42 to 1.87 ± 0.33 μM when compared to FGF7:β-CD:EV complex activity. In conclusion, the findings advance the understanding of the biological combinational effects of the β-CD:FGF7 complex and EV as an effective treatment to combat CRC.
Introduction
The inhibition of mTOR-signaling pathway is considered a key element in the anticancer therapy of various tumors.1 Previously, we reported that PEGylated rapamycin in the form of micelles exhibited a high in vitro cytotoxicity activity in human gastric adenocarcinoma cell lines.2 Several observations have suggested that EV could be effective against CRC and carcinomatosis.3 However, the meaningful efficacy of EV as a single agent for the treatment of CRC has failed to be proven in multiple clinical trials.4,5 It is important to note that stomatitis because of the mTOR-inhibitors therapy occurs soon after the treatment starts. According to the National Cancer Institute, stomatitis, mouth ulceration, and lip ulceration are the most common serious adverse events (SAE) associated with the EV treatment with an incidence of 44%.6 The combining effect of several strategies along with the chemotherapy for different-level tumor targeting is a promising therapeutic technique to combat the disease and to reduce associated SAE.7 Because cancer cell membrane acts as a barrier for most anticancer agents, achieving both targeting and stealth features for selective and effective tumor drug delivery is always a challenge. However, various multitargeting approaches have the potential to overcome this challenge. Several studies have reported that the tumor-selective accumulation of antitumor agents is achievable through the use of targeting molecules such as ligands, antibodies, nucleic acids, or peptides by improving recognition, permeability, and internalization of anticancer drugs by the target tissues.8
Inhibiting circulating angiogenic factors such as the vascular endothelial growth factor (VEGF) and fibroblast growth factor (FGF) leads to decrease cell survival, migration, and proliferation in cancer cells.9 In particular, increased levels of FGF are detectable in patients with colorectal cancer, which could relate to the density of the tumor and recurrence after resection.10 The signaling molecule keratinocyte growth factor (KGF), also known as FGF7, binds to fibroblast growth factor receptor 2b (FGFR2b) and involves in the tumor growth and tissue repair with epithelial-cell specificity.11 Currently, FGF7 is being used for its protective ability to epithelial cells to prevent chemoradiotherapy-associated stomatitis.12 The protein kinase B, also known as Akt pathway, has been shown to be activated by FGF7. Observations have revealed that the FGF7 activation of the Akt pathway, along to its protective ability from cell apoptosis in the majority of epithelial cells, could also induce differentiation and/or cell cycle arrest in certain cell types. Therefore, it can be postulated that the balance between different signaling cascades of FGF7 leads to various and even opposite roles of this growth factor on cell growth.13,14 In most normal and cancerous colonic mucosa samples, FGF7 and its receptor were detected with an overexpression of the receptor observed in the tumor cells.15 According to the Human Protein Atlas (HPA) database, FGFR2b is expressed throughout the gastrointestinal tract with an overexpression in Caco-2 cells.16 On the other hand, HPA has reported that no FGF7 production was detected at the protein level in Caco-2 cells.17 Furthermore, it has been reported that combining mTOR and FGFR inhibitors successfully inhibited cell signaling and motility in hepatocellular carcinoma cells and impaired tumor growth in vivo.10
Virtually all cancer patients initially respond to antitumor drugs such as antiangiogenics or mTOR-inhibitors, but within few months of therapy initiation they become nonresponsive.18 In the event of the treatment-targeting VEGF pathway, treatment-induced elevated tumor hypoxia often occurs, which leads to the production of a different proangiogenic mediators such as FGFs at the tumor microenvironment that lead to drug-related acquired resistance and poor prognosis.19 Observations suggested that the impermeability of tumor cell membrane to most molecules diminishes the cellular uptake of anticancer drugs. Previous studies reported that no difference in EGFR-overexpressing tumor accumulation time or the biodistribution of epidermal growth factor receptor (EGFR) antibodies when compared to nontargeted therapy.20,21 Thus, the difference in tumor distribution between nontargeted and targeted therapies could be evaluated by the efficient cellular uptake and retention of the drug instead of tissue-specific targeting. In this sense, the function of the targeting ligand is to prevent the potential drug clearance by tumor cells rather than to enhance the recognition at the targeted site. On that basis, several peptides and ligands-based delivery strategies of anticancer agents have been investigated.22−24 These agents bind directly to a receptor overexpressed in a tumor cell and consequently improve the permeation, cellular uptake, and intracellular retention of the anticancer drug.22
In the present work, molecular-modelling tasks and in silico analysis techniques were utilized to design a new class of a potential anticancer complex to improve the efficacy of EV in CRC cells. Thereby, this study has demonstrated the in vitro cytotoxic activity of the FGF7:β-CD:EV complex on the Caco-2 cell line using real-time xCELLigence technology.
Results
Target Identification of β-CD and EV
Tables 1 and 2 listed the molecular targets of β-CD and EV, respectively. On the basis of the shape-similarity theory, states that the molecule-possessing similar 3D structure might exhibit an analogous biological activity. Swiss predicted with high probability that β-CD could target FGF7 and FGF10 (also known as KGF-1 and KGF-2, respectively) based on its 3D similarity to CHEMBL198643 with a similarity score of 0.758 out of 1. It has been reported that CHEMBL198643 strongly binds with FGF1 and FGF2.25 The consensus molecular targets predicted by Swiss for β-CD and EV are listed in Tables 1 and 2.
Table 1. Top Five Predicted Targets of β-CD.
| target | probability |
|---|---|
| fibroblast growth factor 1 | 0.71 |
| fibroblast growth factor 2 | 0.71 |
| vascular endothelial growth factor A | 0.71 |
| heparanase 8 kDa subunit | 0.71 |
| inactive heparanase-2 | 0.71 |
Table 2. Top Five Predicted Targets of EV.
| target | probability |
|---|---|
| serine/threonine-protein kinase mTOR | 0.85 |
| peptidyl-prolyl cis–trans isomerase FKBP1A | 0.85 |
| peptidyl-prolyl cis–trans isomerase FKBP4 | 0.85 |
| peptidyl-prolyl cis–trans isomerase FKBP5 | 0.85 |
| peptidyl-prolyl cis–trans isomerase FKBP1B | 0.85 |
Molecular Modeling Studies
Prediction of β-CD:EV Inclusion Complex Formation
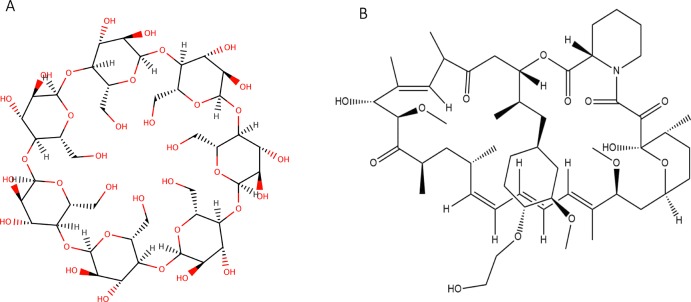
Molecular modeling studies for β-CD and EV interaction was performed using AutoDock Vina1.1.2. Evidence from docking scores suggested the best molecular docked conformation model of the β-CD:EV inclusion complex with a binding affinity of −5.31 kcal mol–1, which indicates good binding between β-CD (Figure 1A) and EV (Figure 1B) as well as good stability of the complex due to H-bonding (Figure 2).26,27
Figure 1.
(A) 2D structure of β-CD and (B) EV.
Figure 2.
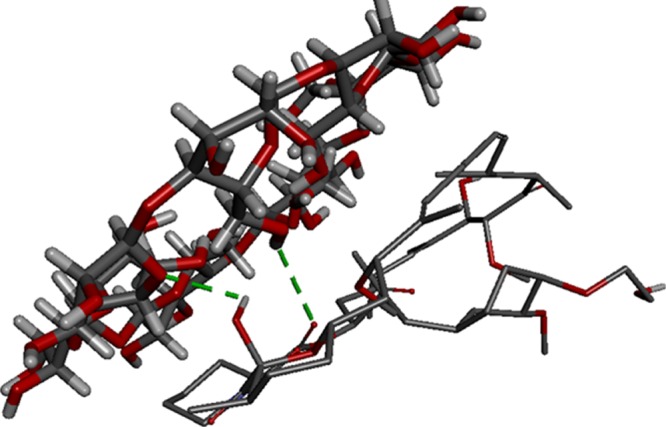
Best conformation model of β-CD:EV inclusion complex performed by Autodoc Vina 1.1.2 showing hydrogen bonds (green) interaction and binding location, β-CD:H142-EV:O6 with a distance of 3.05 Å and EV:H116-β-CD:O10 with a distance of 2.57 Å.
Binding Ability of β-CD and EV to FGF
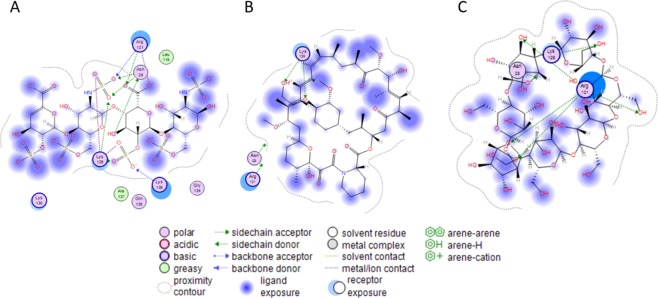
Molecular docking was performed via the molecular-operating environment (MOE.2014) software for β-CD and EV in the heparin binding site of a basic fibroblast growth factor (1BFB.pdb)28 with scoring affinity London dG and GBVI/WSA dG. The amino acids (Asn 28, Lys 120, Arg 121, Lys 126, Lys 136) interact with the native ligand (heparin tetramer fragment) in the binding site (Figure 3A). The docking free energy score for EV in the bind pocket of IBFB is −4.4615 (95% CI of mean = −4.795, −4.328) with RMSD = 1.772 (95% CI of mean = 1.981, 3.682) kcal/mol. EV was able to interact with Lys 126-forming two H-bonds (Figure 3B). Additionally, β-CD was able to bind to the 1BFB binding site with a docking free energy score of −5.2439 (95% CI of mean = −4.572, −3.740) and RMSD = 1.978 (95% CI of mean = 2.174, 3.258) kcal/mol. The visualization of the interaction in the binding pocket indicated that Arg 121 formed four H-bonds with the OH groups located in different sugar rings, although Lys 126 formed a single H-bond with OH group (Figure 3C).
Figure 3.
(A–C) 2D ligand interaction in the binding site of FGF: (A) heparin tetramer fragment, (B) EV, (C) β-CD.
FGF Binding with β-CD:EV Inclusion Complex
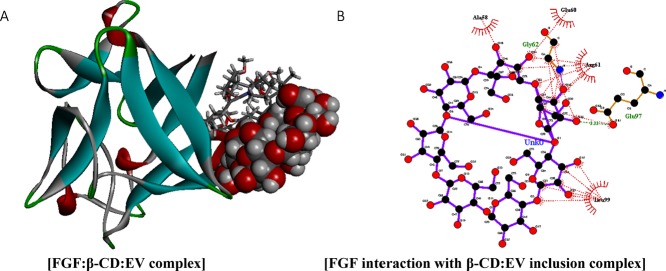
The binding ability of FGF (1BFB.pdb) to the inclusion complex was assessed also using Patchdock server, clustering RMSD was set at 4.0. Simulation results have suggested that FGF tends to bind with the inclusion complex (Figure 4A) through van der Waals, electrostatic, H-bonds, and hydrophobic interactions (Figure 4B) with a binding affinity of −179.39 kcal mol–1 and a binding score of 6864. Moreover, β-CD shows interaction with Ala58, Glu60, Gly 62, Arg61, Leu99, and Glu97 amino-terminal residues of FGF (Figure 4B).
Figure 4.
(A) FGF (1BFB.pdb) (blue-gray stick representation) has a high binding affinity of −179.39 kcal mol–1 against β-CD:EV inclusion complex (red-gray ball-and-stick representation), through van der Waals, electrostatic (purple), and H-bonds (green dotted lines) interaction, (B) whereas the spoked red-arcs represent the amino-terminal residues forming hydrophobic interaction with the ligand. (C) The binding location is demonstrated with the interacting FGF amino-terminal residues.
Preparation of Water-Soluble FGF7:β-CD:EV Complex
Inclusion complex of β-CD:EV was prepared in the 2:1 M ratio of β-CD and EV. The water solubility of the inclusion complex was measured by UV–Vis spectrometer and λmax of the pure EV in ethanol was found to be 267 nm. The absorbance of water-soluble β-CD:EV complex was recorded at 280 nm, because the λmax shift of the UV–Vis absorption of EV was observed after the formation of the inclusion complex.29 The aqueous solubility of the inclusion complex was 3.1± 0.23 μM, whereas the aqueous solubility of pure EV was 1.7± 0.16 μM. In addition, the FGF7:β-CD:EV complex was prepared by a physical adsorption method, as a result of hydrogen bonding and hydrophobic interaction, by dissolving the FGF7 and β-CD:EV complex in ultra-pure water followed by freeze-drying to obtain the FGF7:β-CD:EV complex in powder form.
FTIR Characterization of FGF7:β-CD:EV Complex
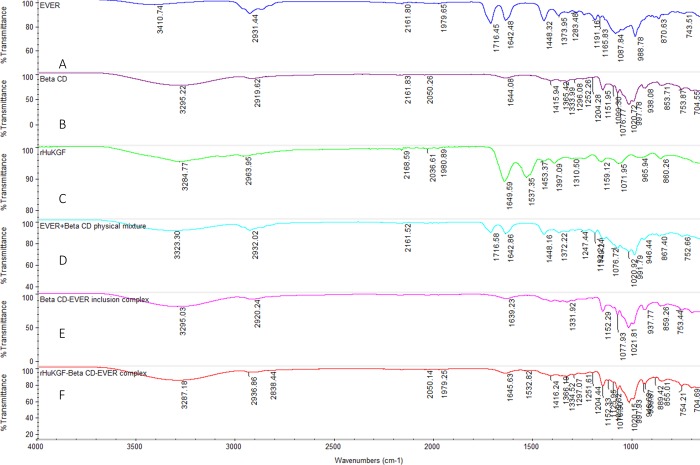
The FGF7:β-CD:EV complex was characterized by a FTIR spectrophotometer. FTIR spectrum of the complex was analyzed and compared with the spectra of the pure compounds and their physical mixture. The FTIR spectrum of EV shown characteristic peaks at 3410 cm–1 (OH) and 2931 cm–1 (−CH3), 1642 cm–1 (C=O), and 1448 cm–1 (−C–O–C−) (Figure 5A).30 On the other hand, The FTIR spectrum of β-CD shown characteristic peaks at 3295.22 cm–1 (asymmetric and symmetric stretching of OH), 2919.62 cm–1 (asymmetric stretching from CH2) and 1333 cm–1 (coupled in plane bending of CH2), Figure 5B.31 The physical mixture spectrum of EV and β-CD has represented all the characteristic peaks of both compounds (Figure 5D). The characteristic peaks of EV in the inclusion complex were completely vanished, indicating that the EV molecule was entirely inserted into the β-CD cavity (Figure 5E).32−34 The FTIR spectrum of interaction of the FGF7:β-CD:EV complex shows the characteristic peak 1334 cm–1 of β-CD along with the characteristic peak 1532 cm–1 (strong N–O stretching) of FGF7 (Figure 5F).
Figure 5.
(A) FTIR spectra (4000–1000 cm–1) of pure EV, (B) β-CD, (C) FGF7, (D) physical mixture of β-CD and EV, (E) β-CD:EV inclusion complex, and (F) FGF7:β-CD:EV complex.
Assessment of FGF7:β-CD:EV Complex Stability and EV Release Profile
FGF7:β-CD:EV complex stability in Dulbecco’s modified eagle medium (DMEM) culture media and the release of EV from the complex were measured by utilizing size restricted dialysis tubing procedure (Figure S1). Figure 6 represents the release profile of EV from both the pure EV sample and FGF7:β-CD:EV complex sample. The results revealed that after 15 min, around 27% of the pure EV sample was detected in a receiver compartment (Figure 6). On the other hand, up to 30 min of experiment, there was no detection of free EV from the FGF7:β-CD:EV complex sample in the receiver compartment, and about 35% of free EV was detected after 1 h.
Figure 6.
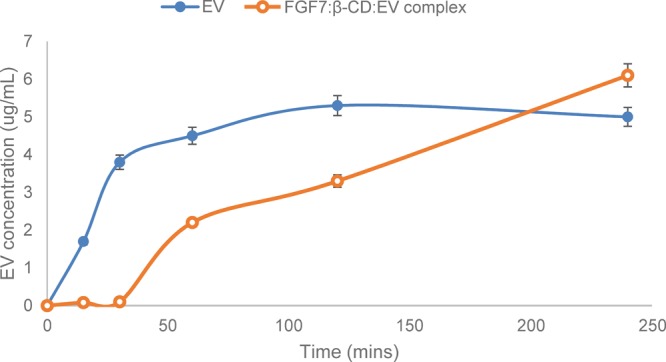
Time-dependent FGF7:β-CD:EV complex stability in DMEM culture media and the release profile of EV from the complex sample and pure EV sample (n = 3).
Dynamic Monitoring of Cytotoxic Activity Using RTCA DP Instrument
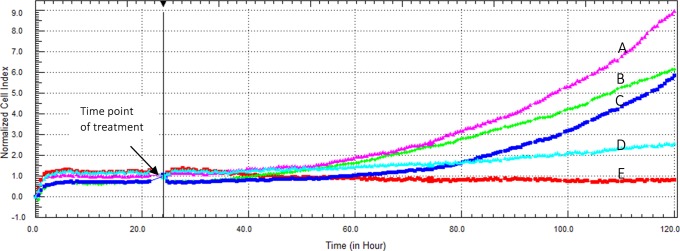
To evaluate the antiproliferative efficacy of different EV complexes on Caco-2 cells, EV, FGF7:EV, β-CD:EV inclusion complex, and FGF7:β-CD:EV complex with an EV concentrations of 3.26, 6.52, and 13.04 μM were incubated with Caco-2 cells for 96 h, and the cell viability was measured by an RTCA DP instrument. Figure 7 represents the concentration-dependent cytotoxicity of EV on Caco-2 cells for over 96 h incubation time. EV exhibited an IC50 value of 9.65 ± 1.42 μM after 96 h incubation time.
Figure 7.
(A–E) Cytotoxic effect of EV on Caco-2 cells as displayed by the RTCA DP instrument. Cells were seeded overnight to reach the log phase, (A) then incubated with 1.58 μM FGF7, (B) media only, (C) 3.26 μM EV, (D) 6.52 μM EV, or (E) 13.04 μM EV. The IC50 value of EV was found to be 9.65 ± 1.42 μM after 96 h incubation time.
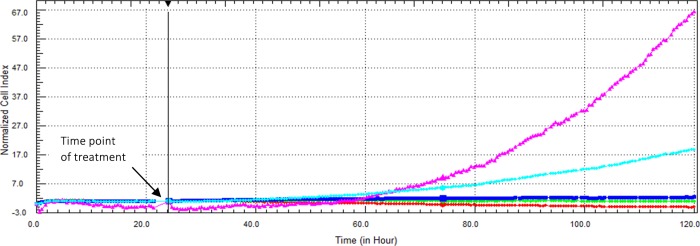
The effect of exogenous FGF7 on the cytotoxicity of EV is demonstrated in Figure 8. The IC50 value of the FGF7:EV complex in Caco-2 cells was found to be 3.81 ± 0.82 μM after 96 h incubation time.
Figure 8.
Cytotoxic effect of FGF7:EV complex on Caco-2 cells as displayed by the RTCA DP instrument. Cells were seeded overnight to reach the log phase, then incubated with 1.58 μM FGF7 (purple), media only (light-blue), FGF7:EV complex (contains 1.58 μM FGF7 and 3.26 μM EV) (dark-blue), FGF7:EV (contains 1.58 μM FGF7 and 6.52 μM EV) (green), or FGF7-EV (contains 1.58 μM FGF7 and 13.04 μM EV) (red). The IC50 value of the FGF7:EV complex was found to be 3.81 ± 0.82 μM after 96 h incubation time.
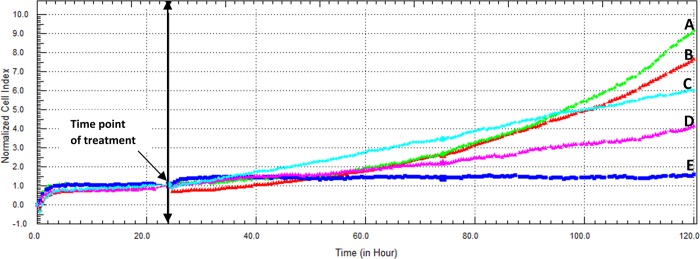
The cytotoxicity of β-CD:EV was lower than the parent drug EV, with an IC50 value of 17.71 ± 4.45 μM after 96 h incubation time (Figure 9).
Figure 9.
(A–E) Cytotoxic effect of β-CD:EV inclusion complex on Caco-2 cells as displayed by the RTCA DP instrument. (A) Cells were seeded overnight to reach the log phase, then incubated with media only, (B) β-CD only, (C) β-CD:EV inclusion complex (contains 3.26 μM EV), (D) β-CD:EV inclusion complex (contains 6.52 μM EV), or (E) β-CD:EV inclusion complex (contains 13.04 μM EV). The IC50 value of β-CD:EV inclusion complex was found to be 17.71 ± 4.45 μM after 96 h incubation time.
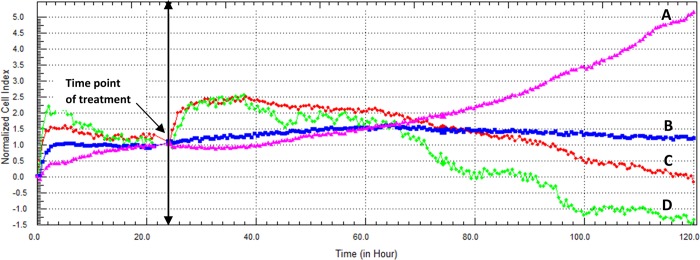
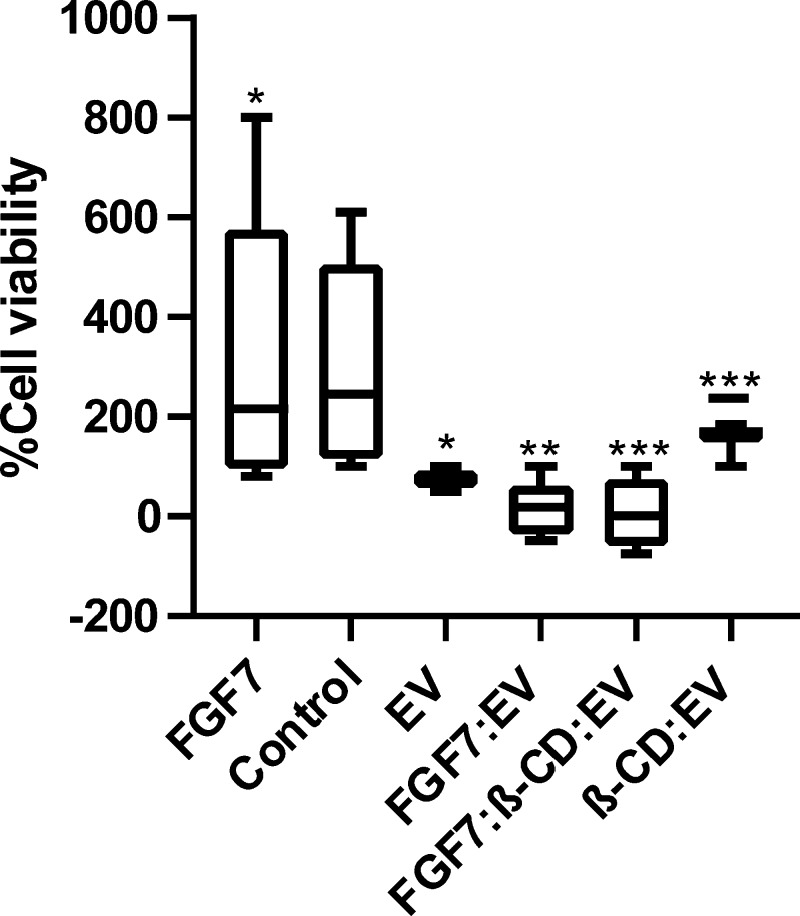
Target identification software Swiss suggested that β-CD could possess a cytotoxic effect. For this reason, β-CD and β-CD-FGF were tested on Caco-2 cell line. As a result, β-CD appeared to be cytotoxic to Caco-2 cell line with IC50 (5.11 μM). Adding β-CD and FGF together decreased the IC50 value to 2.73 μM. Interestingly, the cytotoxicity of EV was remarkably improved when combined with exogenous β-CD and FGF7, P < 0.001 (Figure 10). Figure 11 represents the cytotoxic activity of EV for each respective complex on Caco-2 cell line after 96 h incubation time.
Figure 10.
(A–D) Cytotoxic effect of FGF7:β-CD:EV complex on Caco-2 cells as displayed by the RTCA DP instrument. (A) Cells were seeded overnight to reach the log phase, then incubated with media only. (B) FGF7:β-CD:EV complex (contains 1.58 μM FGF7 and 3.26 μM EV). (C) FGF7:β-CD:EV complex (contains 1.58 μM FGF7 and 6.52 μM EV). (D) FGF7:β-CD:EV complex (contains 1.58 μM FGF7 and 13.04 μM EV). The IC50 value of FGF7:β-CD:EV complex was found to be 1.87 ± 0.33 μM after 96 h incubation time.
Figure 11.
In vitro activity determination of EV, FGF7:EV, β-CD:EV, and FGF7:β-CD:EV complexes. Results have demonstrated the cell growth by EV as the percentage of the control determined using RTCA xCELLigence technology after 96 h incubation time in Caco-2 cell lines (n = 6). In general, a 100% cell kill is only observed with the FGF7:β-CD:EV complex and FGF7:EV complex. *P < 0.05, **P < 0.01. ***P < 0.001.
Cytotoxicity of FGF7:β-CD:EV Complex on Normal Cells
In this study, the normal human fetal small intestinal (FHs 74 Int, ATCC CCL-241) cell line was used to investigate the cytotoxicity of FGF7:β-CD:EV complex on normal human cells, and the cell viability was measured by a RTCA DP instrument. Figure S2 represents the concentration-dependent cytotoxicity of EV on FHs 74 Int cells. The Pure EV sample has exhibited an IC50 value of 19.25 ± 1.35 μM for over 72 h incubation time. The cytotoxicity of FGF7:EV and β-CD:EV complexes on FHs 74 Int cells was found to be similar to pure EV with IC50 values of 15.9 ± 0.95 and 16.55 ± 1.05 μM, respectively (Figures S3 and S4). On the other hand, the cytotoxicity of the FGF7:β-CD:EV complex on FHs 74 Int cells was found to be lower (IC50 = 34.11 ± 1.9 μM) (Figure S5) when compare to the pure EV sample, P < 0.0001, mainly due to the fact that EV is less exposed to the cell because of its inclusion inside β-CD.
Assessment of FGF7:β-CD:EV Complex Retention in Caco-2 Cells
A 2D monolayer cell culture method was used to evaluate the drug uptake and retention in Caco-2 cells. The first 30 min of exposure was not considered because of the release time delay between two applications of EV to the tumor cells. The observations from Figure S6 indicated that the penetration of EV from both pure and complex samples was time-dependent, thus the intracellular accumulation of EV was significantly increased with FGF7:β-CD:EV complex application, P < 0.05, only ∼2.5% of free EV from the complex sample and ∼6% of the pure EV sample was detected extracellularly after 6 h. The retention of EV was enhanced with the complex application also. After 24 h of exposure, ∼3.5% of free drug was detected from cells treated with the complex sample, and ∼7% from cells treated with the pure EV sample.
Discussion
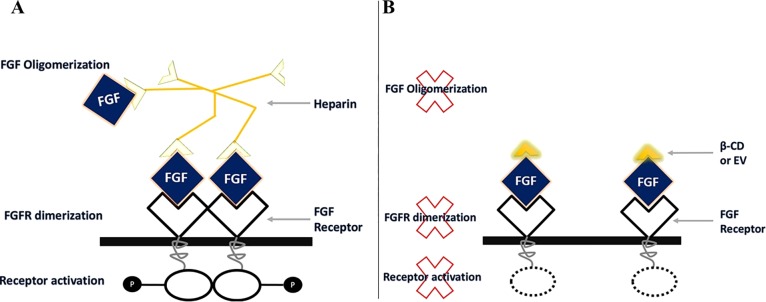
The causes of the failure of mTOR inhibitor EV as a monotherapy antitumor agent still remain unclear,35,36 but several observations have linked it with cancer cell membrane barriers, P-gp active efflux transporter or multidrug resistance-associated proteins.37 β-CD has been reported to increase the retention and accumulation of mTOR inhibitors in Caco-2 cells by significant decrease in the efflux ratio, suggesting the inhibition of P-gp-mediated efflux transport.38−40 Besides, increasing the retentions of mTOR inhibitors, we want to identify the molecular targets of β-CD. A Swiss target identification analysis was used to identify β-CD molecular targets. Swiss suggested that β-CD is capable to bind to FGF1 and FGF2. This could be supported by the strong affinity of a similar structure (β-CD tetradecasulfate) toward FGF.41 Heparin is essential for FGF to generate a biological response by binding to a FGF receptor. Heparin functions by binding to several FGF molecules forming FGF oligomerization. Then the FGF-heparin complex bind to couple of FGFRs, this leads to FGFR dimerization, which activates tyrosine kinase pathway (Figure 12A). A study showed that synthetic heparin analog, which can only bind to one FGF, blocks the dimerization of FGFR, thus stop its activation. We propose that β-CD antagonizes the action of heparin by binding to only one FGF; therefore, it cannot induce FGF oligomerization thus preventing FGFR dimerization.42,43 This prevent FGFR activation and suppresses the intracellular cascades of FGFR, leading to cell growth inhibition (Figure 12B).
Figure 12.
(A) Heparin induced FGF oligomerization and activate FGFR. (B) β-CD or EV binds to only one FGF preventing FGFR dimerization.
In the current work, the influence of exogenous FGF7 and β-CD on the cytotoxic activity of the parent drug EV was investigated in Caco-2 cell line. Molecular modeling studies were performed to predict the binding affinity of the FGF:β-CD:EV complex. First as shown in Figure 2, Ligand–ligand docking was performed using Autodock vina. An EV molecule was successfully docked into β-CD cavity with a binding affinity of −5.3 kcal mol–1. Because hydroxyl groups surround the narrow opening of β-CD, EV binding with this narrow opening of β-CD indicates possibility of H-bonding between EV oxygen atoms and hydroxyl groups of β-CD near the narrow opening. In addition, MOE was used to dock β-CD and EV (individually) in the heparin binding site of FGF (IBFB) with docking free energy score of −5.2439 and – 4.4615, respectively (Figure 3). FGF has shown a binding affinity of −179.39 kcal mol–1 to the β-CD:EV inclusion complex through van der Waals, electrostatic, H-bonds, and hydrophobic interactions (Figure 4), suggested a good stability of FGF:β-CD:EV complex.
In this study, β-CD was utilized to enhance the aqueous solubility of EV. Hence, the therapeutic application of the majority of anticancer drugs is severely limited because of their poor water-solubility and inadequate cancer cell penetration.44,45 β-CD is capable to form a stable inclusion complex with EV at molecular level based on hydrophobic interactions as the EV molecule inserts into the β-CD cavity.45,46 The aqueous solubility of the inclusion complex was increased by (3.1± 0.23 μM) when compared to the aqueous solubility of pure EV (1.7 ± 0.16 μM). FTIR studies indicate that a new structure was formed, and the EV molecule was entirely embedded into the β-CD cavity (Figure 5E) as the characteristic peaks of EV were completely vanished.32−34 Furthermore, the interaction of FGF7 with the β-CD:EV inclusion complex was determined also. There was a shifting of the broad classic band of β-CD from 3295.22 to 3287 cm–1, indicating a possibility of H-bonding between FGF7 and the inclusion complex as suggested by the molecular modeling scores (Figure 4). The FGF7:β-CD:EV complex stability in a DMEM media and the release of EV were measured by dialysis tubing procedure (Figure S1). Up to 30 min of experiment, there was no detection of free EV from the FGF7:β-CD:EV complex sample in a receiver compartment, and about 35% of free EV was detected after 1 h time. This indicated that the complex is stable in DMEM for at least 30 min and exhibits sustain release profile (up to 4 h).
RTCA xCELLigence technology results revealed that when cells are treated with EV alone, the IC50 value was 9.65 ± 1.42 μM. Treating cells with FGF and EV resulted in increase in the cytotoxicity significantly with IC50 (3.81 ± 0.82 μM) (P < 0.05) compare to EV alone. Considering the molecular docking result, we believe that part of the EV molecules binds to FGF and inhibiting FGF oligomerization, whereas the rest goes inside the cells and act as mTOR inhibitor. This can be supported by β-CD and β-CD:FGF cytotoxicity results. In our view when cells are treated with β-CD alone (IC50 = 5.11 μM), β-CD tries to substitute heparin from the existing FGF in the cells preventing FGF oligomerization; however, by adding both β-CD and FGF together, they decreased the IC50 value to 2.73 μM by directly working as a complex to block FGFR, preventing more receptors to be activated. The IC50 value of β-CD:EV was higher than that of EV, suggesting that conjugation significantly affect EV efficacy (P < 0.01), possibly due to the slow release profile of EV from the inclusion complex.47,48 Interestingly, the cytotoxicity of the β-CD:EV inclusion complex was remarkably improved when combined with FGF7, P < 0.001 (Figure 10) with a dramatic decrease in the IC50 value from 17.71 ± 1.42 to 1.87 ± 0.33 μM. Hence, FGF7 facilitated the intracellular delivery of EV. Also, according to the molecular docking result, both EV and β-CD are capable to bind in the heparin binding site of FGF; however, β-CD has a higher binding score and has more hydrogen bonds compare to EV. We assume that in the presence of the β-CD and FGF, most of EV molecules are able to enter the cells and act as an mTOR inhibitor, whereas β-CD binds to FGF and inhibits its oligomerization. Therefore, the multitargets effect of the complex facilitating the cellular uptake of EV, preventing FGF receptors activation, and enhancing the intracellular retention of EV. The antiproliferative effect of EV in Caco-2 cells was remarkably improved as the least IC50 value was obtained with the FGF7:β-CD:EV complex. Lastly, the concentration-dependent cytotoxicity of pure EV and FGF7:β-CD:EV complex on FHs 74 Int normal cell line was studied. A pure EV sample exhibited an IC50 value of 19.25 ± 1.35 μM at over 72 h incubation time. The cytotoxicity of the FGF7:β-CD:EV complex on FHs 74 Int cells was found to be lower (IC50 = 34.11 ± 1.9 μM) when compare to the pure EV sample, P < 0.0001, mainly due to the fact that EV is less exposed to the cell because of its inclusion inside β-CD.
Conclusions
Molecular modeling tasks and in silico analysis techniques were utilized to design a new class of a potential anticancer complex to improve the efficacy of EV in the Caco-2 cell line. This study demonstrated that a FGF7:β-CD complex dramatically improved the antiproliferative effect of the mTOR inhibitor EV by enhancing its cellular uptake, intracellular retention, and through preventing FGFR activation thus preventing cell proliferation and possessed less toxicity in the FHs 74 Int normal human cell line. These findings advance the understanding of the biological combinational effects of the β-CD:FGF7 complex and EV as an effective therapeutic to combat CRC.
Materials and Methods
Cell Culture and Reagents
Caco-2 HTB-37 (ATCC, USA), FHs 74 Int (ATCC, USA), streptomycin/penicillin solution (Gibco, USA), phosphate-buffered saline (PBS) (Gibco, USA), and trypsin/EDTA (Gibco, USA), β-Cyclodextrin (Sigma Aldrich, USA), Dulbecco’s modified eagle medium (ATCC, USA), fetal bovine serum (Gibco, USA), and EV (Toronto Research Chemicals, Canada).
Target Identification of β-CD and EV
Swiss predicts the molecular targets of small molecules based on their 2D and 3D similarity by comparing the query molecule to a library of 280 thousand compounds. SMILES of β -CD and EV were obtained from PubChem and were entered into Swiss target software to predict the molecular targets of β-CD and EV.49
Molecular Modeling Studies
Molecular modeling studies were performed to predict the formation of β-CD:EV, FGF7:β-CD, and FGF7:EV complexes and to measure their binding affinity by utilizing AutoDock Vina 1.1.2,50 PatchDock server,51,52 and MOE.2014 software, which are available from the Chemical Computing Group (CCG; www.chemcomp.com). The 3D structures of EV (PubChem CID: 6442177)53 and β-CD (PubChem CID: 444041)54 were obtained from NCBI PubChem compound database where the structural complex of FGF7 (PDB ID: 1BFB)28 was retrieved from RCSB Protein Data Bank (PDB). All structures of the selected compounds, served as molecules for modeling studies, were optimized through MOE.2014 software before docking. Hydrogen atoms and partial charges were added to the protein. Protein minimization was performed in gas solvation with the side chains, keeping it rigid and the ligand flexible.55 The selected site was isolated and minimized, followed by protonating the protein. The 3D ligands were minimized using MMFF94x with cutoffs of 10 to 12 Å. The hydrogens and charges were fixed, and the RMS gradient was set to 0.001 kcal/mol.56 To perform docking with AutoDock Vina software v1.1.2, the receptor and ligand structures were transformed to the PDBQTt file format, which included atomic charges, atom-type definitions, and for the ligands as well as the topological information (rotatable bonds). A grid with dimensions of 23 ×23× 23 points was centered to the co-crystallized ligands to ensure the coverage of the binding site of the structure. Default parameter PatchDock server was set as clustering root mean square deviation (RMSD) at 4.0 and docked poses were analyzed by LigPlot Plus for generating 2D schematic representations.57,58
Preparation of Water-Soluble FGF7:β-CD:EV Complex
The β-CD:EV inclusion complex was prepared in a 2:1 M ratio. Briefly, 10 mg of EV and 20 mg of β-CD were completely dissolved in (1:1 v/v) mixture of ethanol and 30% ammonium hydroxide. The solution was filtered through a 0.45 μ membrane filter, and the filtrate was evaporated under reduced pressure and dried in a vacuum oven.59,60 The water solubility of the inclusion complex was measured by double-beam UV–Vis spectrometer (PerkinElmer, USA). Briefly, a five-point calibration curve of EV was prepared in ethanol and absorbance was recorded at 267 nm, λmax (n = 6). Furthermore, a known amount of inclusion complex powder was dissolved in distilled water, the absorbance was recorded at 280 nm,λmax of the inclusion complex, and EV concentration was determined (n = 6) accordingly. Furthermore, the FGF7:β-CD:EV complex was prepared by a physical adsorption method by dissolving 6 μg FGF7 and β-CD:EV complex in ultra-pure water followed by freeze-drying for over 24 h (at −34 °C and gradual ascent up to 20 °C), using a Labconco freeze dryer (Labconco, USA) to obtain the FGF7:β-CD:EV complex in a powder form.
FTIR Characterization of FGF7-β-CD-EV Complex
For the physical mixture of FGF7, β-CD, and EV, the FGF7:β-CD:EV inclusion complex were characterized by FTIR. All spectra were obtained by a Thermo Fisher Scientific Nicolet iS5 spectrophotometer (Wisconsin, USA) using OMNIC Software from 1000 to 4000 cm–1 at a data acquisition rate of 2 cm–1 per point.
Assessment of FGF7:β-CD:EV Complex Stability and EV Release Profile in DMEM
A size-restricted dialysis tubing procedure was employed to measure the FGF7:β-CD:EV complex stability in a culture media and the release of EV from the complex. Briefly, complex stability and EV release from known amounts of complex (contains 6.52 μM of EV) were determined using a modified dissolution method. The medium comprised of a 0.05 M phosphate buffer solution (PBS) pH 7.4. The dialysis bags (MWCO 2000 Da, Sigma, Germany) were filled with known amount of complex along with cell culture media and placed in 50 mL PBS (pH 7.4) at 37°C with slow magnetic stirring (50 rpm) under perfect sink conditions. One mL of aliquots was withdrawn from the external solution and replaced with the same volume of fresh PBS. The drug concentration was detected by HPLC (Flexar FX-20, PerkinElmer, USA) at 278 nm. All experiments were carried out in triplicate and performed as at least three independent experiments.
Cell Culture
Caco-2 (ATCC HTB-37) and FHs 74 Int (ATCC CCL-241) cells were maintained in ATCC–formulated DMEM supplemented with 10% fetal bovine serum, 1% penicillin/streptomycin, and cells were incubated under a humidified atmosphere of 5% CO2 and 95% air at 37 °C.
Dynamic Monitoring of Cytotoxic Activity Using RTCA DP System
Real-time cellular analysis (RTCA) xCELLigence technology was used for screening of cytotoxicity by monitoring the cellular events in real-time during the entire time course of the experiment and to obtain more reveals about when and the rate of cellular responses.61 Caco-2 cells were seeded in E-plates 16 at a concentration of 5 ×10³, grown overnight to reach the log phase, then treated with EV, FGF7:EV, β-CD:EV, and FGF7:β-CD:EV complexes (each complex contained 3.26, 6.52, and 13.04 μM EV) or medium alone, and cell responses were monitored by taking xCELLigence RTCA DP instrument (ACEA Biosciences Inc., USA) readings every 5 min for 24 h and every 30 min for 96 h. The kinetic profile of the cellular responses, the decrease in cell index, and IC50 values as per each complex were obtained accordingly against their respective concentrations.62
Assessment of FGF7:β-CD:EV Complex Retention in Caco-2 Cells
Two-dimensional (2D) monolayer cell culture models are the most common method used to investigate tumor cells in vitro.63 We used a 2D monolayer cell culture system to identify the rate of EV penetration and the extent of drug accumulation in cancer cells. The experimental model used was the human colorectal cancer Caco-2 cells. Drug accumulation was determined by the extracellular concentration gradient of free EV and the relationship between exposure time and drug accumulation was investigated.64 Briefly, cells were seeded in 6-well plate at a concentration of 5 ×10⁴ per well and allowed to grow for 24 h. Cells were incubated at 37°C with the FGF7:β-CD:EV complex and EV only, each contain 6.52 μM EV, and the extracellular concentration of the free EV was measured at different time intervals by HPLC (PerkinElmer, USA) (for chromatographic conditions see the Supporting Information). All experiments were carried out in triplicate and performed as at least three independent experiments.
Statistical Analysis
The results are expressed as mean ± standard deviation (SD) (n = 6), and the statistical analysis was performed with GraphPad Prism 8 (GraphPad Software, Inc., La Jolla, CA, USA). The significance of any differences between experimental groups was evaluated by the one-way ANOVA followed by a Turkey–Kramer multiple comparisons test. The calculation of IC50 values of EV as per each complex was obtained using xCELLigence RTCA DP software. IC50 values were expressed as the mean (M) ± S.E.M. (n = 6). The 95% confidence intervals (CIs) of the binding affinity (according to their mean and standard errors) were estimated with 2.5 and 97.5 percentile as the lower and upper bounds. Error bars represent the standard error of the mean.
Acknowledgments
This project (ref FRGS/2/2014/SKK02/UCSI/02/1) is supported by Department of Higher Education, Ministry of Education Malaysia, under the Fundamental Research Grant Scheme (FRGS) Malaysia.
Supporting Information Available
The Supporting Information is available free of charge on the ACS Publications website at DOI: 10.1021/acsomega.9b00109.
Diagram of dialysis tubing procedure, raw data of cytotoxicity on FHs 74 Int cells, HPLC chromatographic conditions, raw data of complex retention in Caco-2 cells, standard chromatogram of EV, raw data of Swiss target prediction, and docking scores for binding affinity of β-CD and EV to FGF7 (PDF)
The authors declare no competing financial interest.
Supplementary Material
References
- Su Y.-C.; Liao H.-F.; Yu C.-C.; Lin Y.-C. Anticancer activity of the mTOR inhibitor (everolimus) and dual mTORC1/mTORC2 Inhibitor (AZD2014) on mouse lymphocytic leukemia both in vitro and in vivo. Ann. Oncol. 2016, 27, 29. 10.1093/annonc/mdw362.29. [DOI] [Google Scholar]
- Vijayaraj Kumar P.; Venkata Subramanya Lokesh B. Designing and In-Vitro Characterization of Micelle Forming Amphiphilic PEGylated Rapamycin Nanocarriers for the Treatment of Gastric Cancer. Curr. Drug Delivery 2014, 11, 613–620. 10.2174/156720181105140922124759. [DOI] [PubMed] [Google Scholar]
- Pavel M. E.; Hainsworth J. D.; Baudin E.; Peeters M.; Hörsch D.; Winkler R. E.; Klimovsky J.; Lebwohl D.; Jehl V.; Wolin E. M.; Öberg K.; Van Cutsem E.; Yao J. C. Everolimus plus octreotide long-acting repeatable for the treatment of advanced neuroendocrine tumours associated with carcinoid syndrome (RADIANT-2): a randomised, placebo-controlled, phase 3 study. Lancet 2011, 378, 2005–2012. 10.1016/S0140-6736(11)61742-X. [DOI] [PubMed] [Google Scholar]
- Ng K.; Tabernero J.; Hwang J.; Bajetta E.; Sharma S.; Del Prete S. A.; Arrowsmith E. R.; et al. Phase II study of everolimus in patients with metastatic colorectal adenocarcinoma previously treated with bevacizumab-, fluoropyrimidine-, oxaliplatin-, and irinotecan-based regimens. Clin. Cancer. Res. 2013, 27, 3987. 10.1158/1078-0432.CCR-13-0027. [DOI] [PMC free article] [PubMed] [Google Scholar]
- Spindler K.-L. G.; Sorensen M. M.; Pallisgaard N.; Andersen R. F.; Havelund B. M.; Ploen J.; Lassen U.; Jakobsen A. K. M. Phase II trial of temsirolimus alone and in combination with irinotecan for KRAS mutant metastatic colorectal cancer: outcome and results of KRAS mutational analysis in plasma. Acta Oncol. 2013, 52, 963–970. 10.3109/0284186X.2013.776175. [DOI] [PubMed] [Google Scholar]
- Castellano D.; Bajetta E.; Panneerselvam A.; Saletan S.; Kocha W.; O’Dorisio T.; Anthony L. B.; Hobday T. Everolimus plus octreotide long-acting repeatable in patients with colorectal neuroendocrine tumors: a subgroup analysis of the phase III RADIANT-2 study. Oncologist 2013, 18, 46–53. 10.1634/theoncologist.2012-0263. [DOI] [PMC free article] [PubMed] [Google Scholar]
- Wang X.-W.; Zhang Y.-J. Targeting mTOR network in colorectal cancer therapy. World J. Gastroenterol. 2014, 20, 4178. 10.3748/wjg.v20.i15.4178. [DOI] [PMC free article] [PubMed] [Google Scholar]
- Gullotti E.; Yeo Y. Extracellularly Activated Nanocarriers: A New Paradigm of Tumor Targeted Drug Delivery. Mol. Pharmaceutics 2009, 6, 1041–1051. 10.1021/mp900090z. [DOI] [PMC free article] [PubMed] [Google Scholar]
- Mousa L.; Salem M. E.; Mikhail S. Biomarkers of Angiogenesis in Colorectal Cancer: Supplementary Issue: Biomarkers for Colon Cancer. Biomarkers in Cancer 2015, 7, 13. 10.4137/BIC.S25250. [DOI] [PMC free article] [PubMed] [Google Scholar]
- Scheller T.; Hellerbrand C.; Moser C.; Schmidt K.; Kroemer A.; Brunner S. M.; Schlitt H. J.; Geissler E. K.; Lang S. A. mTOR inhibition improves fibroblast growth factor receptor targeting in hepatocellular carcinoma. Br. J. Cancer 2015, 112, 841. 10.1038/bjc.2014.638. [DOI] [PMC free article] [PubMed] [Google Scholar]
- Rubin J. S.; Bottaro D. P.; Chedid M.; Miki T.; Ron D.; Cunha G. R.; Finch P. W.. Keratinocyte growth factor as a cytokine that mediates mesenchymal-epithelial interaction. In Epithelial-Mesenchymal Interactions in Cancer; Springer: 1995; pp 191–214. [DOI] [PubMed] [Google Scholar]
- D’Hondt L.; Lonchay C.; AndrÉ M.; Cannon J.-L. Oral mucositis induced by anticancer treatments: physiopathology and treatments. Ther. Clin. Risk Manage. 2006, 2, 159. 10.2147/tcrm.2006.2.2.159. [DOI] [PMC free article] [PubMed] [Google Scholar]
- Calautti E.; Li J.; Saoncella S.; Brissette J. L.; Goetinck P. F. Phosphoinositide 3-kinase signaling to Akt promotes keratinocyte differentiation versus death. J. Biol. Chem. 2005, 280, 32856–32865. 10.1074/jbc.M506119200. [DOI] [PubMed] [Google Scholar]
- Lotti L. V.; Rotolo S.; Francescangeli F.; Frati L.; Torrisi M. R.; Marchese C. AKT and MAPK signaling in KGF-treated and UVB-exposed human epidermal cells. J. Cell. Physiol. 2007, 212, 633–642. 10.1002/jcp.21056. [DOI] [PubMed] [Google Scholar]
- Otte J. M.; Schmitz F.; Banasiewicz T.; Drews M.; Fölsch U. R.; Herzig K. H. Expression of keratinocyte growth factor and its receptor in colorectal cancer. Eur. J. Clin. Invest. 2000, 30, 222–9. 10.1046/j.1365-2362.2000.00617.x. [DOI] [PubMed] [Google Scholar]
- Fibroblast growth factor receptor 2. https://www.proteinatlas.org/ENSG00000066468-FGFR2/cell.
- Fibroblast growth factor 7. https://www.proteinatlas.org/ENSG00000140285-FGF7/cell.
- Kerbel R. S. Tumor angiogenesis. N. Engl. J. Med. 2008, 358, 2039–2049. 10.1056/NEJMra0706596. [DOI] [PMC free article] [PubMed] [Google Scholar]
- Casanovas O.; Hicklin D. J.; Bergers G.; Hanahan D. Drug resistance by evasion of antiangiogenic targeting of VEGF signaling in late-stage pancreatic islet tumors. Cancer Cell 2005, 8, 299–309. 10.1016/j.ccr.2005.09.005. [DOI] [PubMed] [Google Scholar]
- Mamot C.; Drummond D. C.; Noble C. O.; Kallab V.; Guo Z.; Hong K.; Kirpotin D. B.; Park J. W. Epidermal growth factor receptor–targeted immunoliposomes significantly enhance the efficacy of multiple anticancer drugs in vivo. Cancer Res. 2005, 65, 11631–11638. 10.1158/0008-5472.CAN-05-1093. [DOI] [PubMed] [Google Scholar]
- Kirpotin D. B.; Drummond D. C.; Shao Y.; Shalaby M. R.; Hong K.; Nielsen U. B.; Marks J. D.; Benz C. C.; Park J. W. Antibody targeting of long-circulating lipidic nanoparticles does not increase tumor localization but does increase internalization in animal models. Cancer Res. 2006, 66, 6732–6740. 10.1158/0008-5472.CAN-05-4199. [DOI] [PubMed] [Google Scholar]
- Lin C.; Zhang X.; Chen H.; Bian Z.; Zhang G.; Riaz M. K.; Tyagi D.; Lin G.; Zhang Y.; Wang J.; Lu A.; Yang Z. Dual-ligand modified liposomes provide effective local targeted delivery of lung-cancer drug by antibody and tumor lineage-homing cell-penetrating peptide. Drug Delivery 2018, 25, 256–266. 10.1080/10717544.2018.1425777. [DOI] [PMC free article] [PubMed] [Google Scholar]
- Borrelli A.; Tornesello A. L.; Tornesello M. L.; Buonaguro F. M. Cell penetrating peptides as molecular carriers for anti-cancer agents. Molecules 2018, 23, 295. 10.3390/molecules23020295. [DOI] [PMC free article] [PubMed] [Google Scholar]
- Trabulo S.; Cardoso A. L.; Mano M.; De Lima M. C. P. Cell-penetrating peptides—mechanisms of cellular uptake and generation of delivery systems. Pharmaceuticals 2010, 3, 961–993. 10.3390/ph3040961. [DOI] [PMC free article] [PubMed] [Google Scholar]
- Karoli T.; Liu L.; Fairweather J. K.; Hammond E.; Li C. P.; Cochran S.; Bergefall K.; Trybala E.; Addison R. S.; Ferro V. Synthesis, biological activity, and preliminary pharmacokinetic evaluation of analogues of a phosphosulfomannan angiogenesis inhibitor (PI-88). J. Med. Chem. 2005, 48, 8229–8236. 10.1021/jm050618p. [DOI] [PubMed] [Google Scholar]
- Du X.; Li Y.; Xia Y.-L.; Ai S.-M.; Liang J.; Sang P.; Ji X.-L.; Liu S.-Q. Insights into protein–ligand interactions: mechanisms, models, and methods. Int. J. Mol. Sci. 2016, 17, 144. 10.3390/ijms17020144. [DOI] [PMC free article] [PubMed] [Google Scholar]
- Chen F.; Wang Z.; Wang C.; Xu Q.; Liang J.; Xu X.; Yang J.; Wang C.; Jiang T.; Yu R. Application of reverse docking for target prediction of marine compounds with anti-tumor activity. J. Mol. Graphics Modell. 2017, 77, 372–377. 10.1016/j.jmgm.2017.09.015. [DOI] [PubMed] [Google Scholar]
- Faham S.; Hileman R. E.; Fromm J. R.; Linhardt R. J.; Rees D. C. Heparin structure and interactions with basic fibroblast growth factor. Science 1996, 271, 1116–1120. 10.1126/science.271.5252.1116. [DOI] [PubMed] [Google Scholar]
- Jiang H.; Xu Y.; Na L.; Jin R.; Zhang S. UV-vis Spectral Analysis of Inclusion Complexes between β -Cyclodextrin and Aromatic/Aliphatic Guest Molecules. Curr. Drug Discovery Technol. 2008, 5, 173–176. 10.2174/157016308784746283. [DOI] [PubMed] [Google Scholar]
- Cao S.; Zhou X.; Yang Y.; Zhong W.; Sun T. Selective Substitution of 31/42–OH in Rapamycin Guided by an in Situ IR Technique. Molecules 2014, 19, 7770–7784. 10.3390/molecules19067770. [DOI] [PMC free article] [PubMed] [Google Scholar]
- Pant A.; Negi J. S. Novel controlled ionic gelation strategy for chitosan nanoparticles preparation using TPP-β-CD inclusion complex. Eur. J. Pharm. Sci. 2018, 112, 180–185. 10.1016/j.ejps.2017.11.020. [DOI] [PubMed] [Google Scholar]
- Yuan C.; Jin Z.; Xu X. Inclusion complex of astaxanthin with hydroxypropyl-β-cyclodextrin: UV, FTIR, 1H NMR and molecular modeling studies. Carbohydr. Polym. 2012, 89, 492–496. 10.1016/j.carbpol.2012.03.033. [DOI] [PubMed] [Google Scholar]
- Negi J. S.; Chattopadhyay P.; Sharma A. K.; Ram V. Preparation of gamma cyclodextrin stabilized solid lipid nanoparticles (SLNS) using stearic acid−γ-cyclodextrin inclusion complex. J. Inclusion Phenom. Macrocyclic Chem. 2014, 80, 359–368. 10.1007/s10847-014-0415-5. [DOI] [Google Scholar]
- Xu F.; Yang Q.; Wu L.; Qi R.; Wu Y.; Li Y.; Tang L.; Guo D.; Liu B. Investigation of inclusion complex of patchouli alcohol with β-cyclodextrin. PLoS One 2017, 12, e0169578 10.1371/journal.pone.0169578. [DOI] [PMC free article] [PubMed] [Google Scholar]
- Fahr A. Cyclosporin clinical pharmacokinetics. Clin. Pharmacokinet. 1993, 24, 472–495. 10.2165/00003088-199324060-00004. [DOI] [PubMed] [Google Scholar]
- Hu C.; Yin W.-j.; Li D.-y.; Ding J.-j.; Zhou L.-y.; Wang J.-l.; Ma R.-r.; Liu K.; Zhou G.; Zuo X.-c. Evaluating tacrolimus pharmacokinetic models in adult renal transplant recipients with different CYP3A5 genotypes. Eur. J. Clin. Pharmacol. 2018, 74, 1437–1447. 10.1007/s00228-018-2521-6. [DOI] [PubMed] [Google Scholar]
- Wacher V. J.; Salphati L.; Benet L. Z. Active secretion and enterocytic drug metabolism barriers to drug absorption. Adv. Drug Delivery Rev. 2001, 46, 89–102. 10.1016/S0169-409X(00)00126-5. [DOI] [PubMed] [Google Scholar]
- Lamoureux F.; Picard N.; Boussera B.; Sauvage F.-L.; Marquet P. Sirolimus and everolimus intestinal absorption and interaction with calcineurin inhibitors: a differential effect between cyclosporine and tacrolimus. Fundam. Clin. Pharmacol. 2012, 26, 463–472. 10.1111/j.1472-8206.2011.00957.x. [DOI] [PubMed] [Google Scholar]
- Yunomae K.; Arima H.; Hirayama F.; Uekama K. Involvement of cholesterol in the inhibitory effect of dimethyl-β-cyclodextrin on P-glycoprotein and MRP2 function in Caco-2 cells. FEBS Lett. 2003, 536, 225–231. 10.1016/S0014-5793(03)00059-0. [DOI] [PubMed] [Google Scholar]
- Cai C.; Zhu H.; Chen J. Overexpression of caveolin-1 increases plasma membrane fluidity and reduces P-glycoprotein function in Hs578T/Dox. Biochem. Biophys. Res. Commun. 2004, 320, 868–874. 10.1016/j.bbrc.2004.06.030. [DOI] [PubMed] [Google Scholar]
- Shing Y.; Folkman J.; Weisz P. B.; Joullie M. M.; Ewing W. R. Affinity of fibroblast growth factors for β-cyclodextrin tetradecasulfate. Anal. Biochem. 1990, 185, 108–111. 10.1016/0003-2697(90)90263-9. [DOI] [PubMed] [Google Scholar]
- Hsu Y.-R.; Nybo R.; Sullivan J. K.; Costigan V.; Spahr C. S.; Wong C.; Jones M.; Pentzer A. G.; Crouse J. A.; Pacifici R. E.; Lu H. S.; Morris C. F.; Philo J. S. Heparin Is Essential for a Single Keratinocyte Growth Factor Molecule To Bind and Form a Complex with Two Molecules of the Extracellular Domain of Its Receptor. Biochemistry 1999, 38, 2523–2534. 10.1021/bi9821317. [DOI] [PubMed] [Google Scholar]
- Spivak-Kroizman T.; Lemmon M. A.; Dikic I.; Ladbury J. E.; Pinchasi D.; Huang J.; Jaye M.; Crumley G.; Schlessinger J.; Lax I. Heparin-induced oligomerization of FGF molecules is responsible for FGF receptor dimerization, activation, and cell proliferation. Cell 1994, 79, 1015–1024. 10.1016/0092-8674(94)90032-9. [DOI] [PubMed] [Google Scholar]
- Zhang F.; Zhang S.; Pollack S. F.; Li R.; Gonzalez A. M.; Fan J.; Zou J.; Leininger S. E.; Pavía-Sanders A.; Johnson R.; Nelson L. D.; Raymond J. E.; Elsabahy M.; Hughes D. M. P.; Lenox M. W.; Gustafson T. P.; Wooley K. L. Improving paclitaxel delivery: in vitro and in vivo characterization of PEGylated polyphosphoester-based nanocarriers. J. Am. Chem. Soc. 2015, 137, 2056–2066. 10.1021/ja512616s. [DOI] [PubMed] [Google Scholar]
- Chen G.; Jiang M. Cyclodextrin-based inclusion complexation bridging supramolecular chemistry and macromolecular self-assembly. Chem. Soc. Rev. 2011, 40, 2254–2266. 10.1039/c0cs00153h. [DOI] [PubMed] [Google Scholar]
- Gao S.; Sun J.; Fu D.; Zhao H.; Lan M.; Gao F. Preparation, characterization and pharmacokinetic studies of tacrolimus-dimethyl-β-cyclodextrin inclusion complex-loaded albumin nanoparticles. Int. J. Pharm. 2012, 427, 410–416. 10.1016/j.ijpharm.2012.01.054. [DOI] [PubMed] [Google Scholar]
- Chen Y.; Huang Y.; Qin D.; Liu W.; Song C.; Lou K.; Wang W.; Gao F. β-cyclodextrin-based inclusion complexation bridged biodegradable self-assembly macromolecular micelle for the delivery of paclitaxel. PLoS One 2016, 11, e0150877 10.1371/journal.pone.0150877. [DOI] [PMC free article] [PubMed] [Google Scholar]
- Varan G.; Patrulea V.; Borchard G.; Bilensoy E. Cellular Interaction and Tumoral Penetration Properties of Cyclodextrin Nanoparticles on 3D Breast Tumor Model. Nanomaterials 2018, 8, 67. 10.3390/nano8020067. [DOI] [PMC free article] [PubMed] [Google Scholar]
- Gfeller D.; Michielin O.; Zoete V. Shaping the interaction landscape of bioactive molecules. Bioinformatics 2013, 29, 3073–3079. 10.1093/bioinformatics/btt540. [DOI] [PubMed] [Google Scholar]
- Trott O.; Olson A. J. AutoDock Vina: improving the speed and accuracy of docking with a new scoring function, efficient optimization and multithreading. J. Comput. Chem. 2010, 30, 455–461. 10.1002/jcc.21334. [DOI] [PMC free article] [PubMed] [Google Scholar]
- Duhovny D.; Nussinov R.; Wolfson H. J. In Efficient Unbound Docking of Rigid Molecules, International workshop on algorithms in bioinformatics; Springer: 2002; pp 185–200. [Google Scholar]
- Schneidman-Duhovny D.; Inbar Y.; Nussinov R.; Wolfson H. J. PatchDock and SymmDock: servers for rigid and symmetric docking. Nucleic Acids Res. 2005, 33, W363–W367. 10.1093/nar/gki481. [DOI] [PMC free article] [PubMed] [Google Scholar]
- Everolimus PubChem Compound Database, https://pubchem.ncbi.nlm.nih.gov/compound/Everolimus.
- β-cyclodextrin PubChem Compound Database, https://pubchem.ncbi.nlm.nih.gov/compound/beta-CYCLODEXTRIN.
- Ferreira L. G.; Dos Santos R. N.; Oliva G.; Andricopulo A. D. Molecular docking and structure-based drug design strategies. Molecules 2015, 20, 13384–13421. 10.3390/molecules200713384. [DOI] [PMC free article] [PubMed] [Google Scholar]
- El-Nakkady S. S.; Hanna M. M.; Roaiah H. M.; Ghannam I. A. Y. Synthesis, molecular docking study and antitumor activity of novel 2-phenylindole derivatives. Eur. J. Med. Chem. 2012, 47, 387–398. 10.1016/j.ejmech.2011.11.007. [DOI] [PubMed] [Google Scholar]
- Wallace A. C.; Laskowski R. A.; Thornton J. M. LIGPLOT: a program to generate schematic diagrams of protein-ligand interactions. Protein Eng. 1995, 8, 127–134. 10.1093/protein/8.2.127. [DOI] [PubMed] [Google Scholar]
- Laskowski R. A.; Swindells M. B. LigPlot+: multiple ligand-protein interaction diagrams for drug discovery. J. Chem. Inf. Model. 2011, 51, 2778–2786. 10.1021/ci200227u. [DOI] [PubMed] [Google Scholar]
- Miecznik P.; Kaczmarek M. Ultrasonic investigations of inclusion complexation of α-cyclodextrin by iodide ions in pseudo-binary aqueous system. J. Mol. Liq. 2007, 133, 120–124. 10.1016/j.molliq.2006.07.010. [DOI] [Google Scholar]
- Chen W.; Yang L.-J.; Ma S.-X.; Yang X.-D.; Fan B.-M.; Lin J. Crassicauline A/β-cyclodextrin host–guest system: Preparation, characterization, inclusion mode, solubilization and stability. Carbohydr. Polym. 2011, 84, 1321–1328. 10.1016/j.carbpol.2011.01.031. [DOI] [Google Scholar]
- Bird C.; Kirstein S. Real-time, label-free monitoring of cellular invasion and migration with the xCELLigence system. Nat. Methods 2009, 6, 622. 10.1038/nmeth.f.263. [DOI] [Google Scholar]
- Chiu C.-H.; Lei K. F.; Yeh W.-L.; Chen P.; Chan Y.-S.; Hsu K.-Y.; Chen A. C.-Y. Comparison between xCELLigence biosensor technology and conventional cell culture system for real-time monitoring human tenocytes proliferation and drugs cytotoxicity screening. J. Orthop. Surg. Res. 2017, 12, 149. 10.1186/s13018-017-0652-6. [DOI] [PMC free article] [PubMed] [Google Scholar]
- Kadletz L.; Heiduschka G.; Domayer J.; Schmid R.; Enzenhofer E.; Thurnher D. Evaluation of spheroid head and neck squamous cell carcinoma cell models in comparison to monolayer cultures. Oncol. Lett. 2015, 10, 1281–1286. 10.3892/ol.2015.3487. [DOI] [PMC free article] [PubMed] [Google Scholar]
- Horning J. L.; Sahoo S. K.; Vijayaraghavalu S.; Dimitrijevic S.; Vasir J. K.; Jain T. K.; Panda A. K.; Labhasetwar V. 3-D tumor model for in vitro evaluation of anticancer drugs. Mol. Pharmaceutics 2008, 5, 849–862. 10.1021/mp800047v. [DOI] [PubMed] [Google Scholar]
Associated Data
This section collects any data citations, data availability statements, or supplementary materials included in this article.


