Abstract
This study investigated the effects of incorporating glucose microparticles (GMPs) and poly(lactic-co-glycolic acid) microparticles (PLGA MPs) within a calcium phosphate cement on the cement’s handling, physicochemical properties, and the respective pore formation. Composites were fabricated with two different weight fractions of GMPs (10 and 20 wt%) and two different weight fractions of PLGA MPs (10 and 20 wt%). Samples were assayed for porosity, pore morphology, and compressive mechanical properties. An in vitro degradation study was also conducted. Samples were exposed to a physiological solution for 3 days, 4 wks, and 8 wks in order to understand how the inclusion of GMPs and PLGA MPs affects the composite’s porosity and mass loss over time. GMPs and PLGA MPs were both successfully incorporated within the composites and all formulations showed an initial setting time that is appropriate for clinical applications. Through a main effects analysis, we observed that the incorporation of GMPs had a significant effect on the overall porosity, mean pore size, mode pore size, and in vitro degradation rate of PLGA MPs as early as after 3 days (p < 0.05). After 4 wks and 8 wks, these same properties were affected by the inclusion of both types of MPs (p < 0.05). Advanced polymer chromatography confirmed that the degradation of PLGA MPs coincided with an increase in composite porosity, mean pore size, and mode pore size. Finally, it was observed that the inclusion of GMPs slowed the degradation of PLGA MPs in vitro and reduced the solution acidity due to PLGA degradation products. Our results suggest that the dual inclusion of GMPs and PLGA MPs is a valuable approach for the generation of early macropores, while also mitigating the effect of acidic degradation products from PLGA MPs on their degradation kinetics.
Keywords: Calcium phosphate cement, Porogen, Glucose, Poly(lactic-co-glycolic acid), Macroporosity
1. Introduction
Calcium phosphate cements (CPCs) are a class of bioresorbable ceramics that are gradually degraded in bony defects [1]. In addition, CPCs have the ability to promote osteoblast activity, leading to a uniquely robust bone-cement interface [2]. As such, several different formulations of CPCs have been adopted within the fields of orthopedic surgery and dentistry as a bone substitute for defects due to various pathologies [3,4]. In vivo, CPC degradation can proceed by both active and passive resorption. Fast (weeks to months) resorbable CPCs are passively degraded by dissolution and byproducts are actively removed by giant cells and macrophages, while slowly (months to years) resorbable CPCs are actively degraded by osteoclasts [5]. However, passive resorption is dependent upon the intrinsic solubility of the CPC [6]. While the microstructure of CPCs is considered porous, the diameters of these pores is in the sub-micron range [7]. Sub-micron pores are adequate to enable fluid flow, and thus encourage passive resorption, but they are not large enough to facilitate angiogenesis and tissue ingrowth [8]. While the ideal pore size is a topic of much debate and depends upon the defect site, it is important to introduce macroporosity (pore diameter > 100 μm) within CPCs to support mass transport and encourage cellular infiltration thereby accelerating the resorption and replacement of CPCs with new bone [9].
To this end, a multitude of strategies and techniques have been investigated to introduce macropores within CPCs [3,8,10–13]. One of the most common approaches is porogen leaching [14]. In this method, a mixture of the CPC and porogen is cast in a mold, allowed to dry, and then the porogen is leached, generating the pores [15]. Glucose and poly(lactic-co-glycolic acid) (PLGA) have both been widely studied as potential additives to CPCs to generate porosity by this method [11,12,16]. Glucose rapidly dissolves in an aqueous solution, which allows the creation of porosity within a matter of minutes when incorporated within CPCs [16,17]. Glucose is also efficiently processed by cells with no harmful degradation byproducts [18]. Likewise, PLGA has received significant attention as a porogen additive in CPCs. PLGA is also useful as a controlled release carrier for delivery of drugs, growth factors, or other bioactive molecules [19,20]. Significant effort has been placed into understanding the major parameters that influence PLGA degradation such as: (i) lactic/glycolic acid ratio; (ii) molecular weight; (iii) end-group functionalization; and (iv) morphology [6]. Unlike glucose, PLGA degradation occurs hydrolytically, generating acidic degradation products, lactic and glycolic acid [21]. If the local concentration of acidic degradation products in vivo is sufficiently high, a localized inflammatory response can be triggered [6]. To minimize this risk, PLGA microparticles (MPs) are frequently combined with other materials that work to counteract this acidity [22,23]. It is hypothesized that the fast dissolution of GMPs in a CPC composite also incorporating PLGA MPs will create an initial macroporosity and increase the surface area within the CPC, thus enhancing the diffusion of PLGA degradation products and preventing a significant decrease in pH. Furthermore, as PLGA degradation occurs over several weeks to months, additional macroporosity will be generated at later time points within CPCs.
The objectives of the current work were to investigate the potential use of both GMPs and PLGA MPs as a dual porogen system for CPCs and to evaluate the effect of GMP incorporation on the in vitro degradation rate of PLGA MPs. This study also sought to characterize the effects of incorporating both GMPs and PLGA MPs on cement setting, the formation of a macroporous structure following porogen leaching, and the physicochemical properties of the resulting GMP/PLGA/CPC composites. Composites were fabricated with three different weight fractions of GMPs (0, 10, and 20 wt%) and three different weight fractions of PLGA MPs (0, 10, and 20 wt%). Setting times for the composites were also tested. The mechanical properties of the formed composites following glucose dissolution and PLGA degradation were characterized via mechanical testing. Composites were further analyzed for surface structure and pore morphology using scanning electron microscopy (SEM) and microcomputed tomography (μCT), respectively. Finally, the molecular weights of PLGA MPs were analyzed using advanced polymer chromatography (APC) to further understand how the presence of GMPs within the CPC initially affects the in vitro degradation of PLGA.
2. Materials and methods
2.1. Preparation GMP/PLGA/CPC composites
The glucose microparticles (GMPs) were prepared as previously described [16]. Briefly, 40 g of > 99.5% glucose crystals (D-(+)-glucose (Sigma-Aldrich, St. Louis, MO)) were mixed with 15 mL deionized water (diH2O) to create a glucose slurry. The glucose slurry was immersed in liquid nitrogen and flash frozen. Afterward, the flash frozen glucose was lyophilized overnight. The resulting solid glucose crystals were ground and sieved to obtain GMPs 150–300 μm in diameter. Sieved GMPs were then lyophilized overnight, purged with nitrogen, and stored in −20 °C freezers to prevent water reabsorption.
To manufacture the composites, GMPs and PLGA MPs (sieved between 50 and 100 μm, Mn = 11300 ± 200 Da, Mw = 16600 ± 300 Da, acid terminated, lactic:glycolic acid ratio (L:G) = 50:50, kindly provided by Purac (Gorinchem, the Netherlands)) were mixed with CPC powder (100% αTCP, kindly provided by CAM Bioceramics B.V. (Leiden, the Netherlands), mean particle size of ~ 4.0 μm, according to nine different GMP/PLGA/CPC weight ratios (0/0/100, 0/10/90, 0/20/80, 10/0/90, 20/0/80, 10/10/80, 10/20/70, 20/10/70, and 20/20/60). The resulting mixture was then transferred to 10 mL syringes (10 mL BD Luer-Lok Syringes, BD, Franklin Lake, NJ) and shaken on a vibrating mill (Silmat® mixing apparatus) to homogenize the distribution of porogen additives.
A solution of 24 wt% Na2HPO4 (Sigma-Aldrich) saturated with glucose (saturated liquid, 0.909 g/mL glucose in order to prevent the dissolution of GMPs before the calcium phosphate cement hardened) was added at a liquid/powder weight ratio of 0.56 and shaken again for 25 s using the vibrating mill (Silmat® mixing apparatus). The resulting paste was injected into Teflon molds (6 mm diameter, 12 mm height). As previously described, the samples were left to set at room temperature for 24 h, removed from the molds, and stored in a vacuum dryer with Drierite (Drierite Co LTD, Xenia, Ohio) until further testing [6,24].
2.2. Setting time
A Gillmore needle apparatus was used to evaluate the initial and final setting time of the samples following ASTM C266 [25]. Cement pastes were mixed and injected into Teflon molds (6 mm in diameter, 12 mm in height) in a retrograde fashion after which the initial and final setting time of the samples was determined at 23.0 ± 3.0 °C. Briefly, the initial setting time was determined to be the first time when the initial Gillmore needle was not able to mark the specimen with a complete circular indentation, while the final setting time was determined to be the first time when the final setting needle did not mark the specimen [25].
2.3. Morphology analysis
Scanning electron microscopy was used to evaluate the morphology of the GMP/PLGA/CPC composites before and after leaching in 37 °C phosphate-buffered saline (PBS, pH 7.4) solution for 3 days, 4 wks, and 8 wks. Samples were mounted on aluminum specimen mounts using carbon tape and sputter coated with gold before examination (FEI Quanta 400 ESEM FEG).
2.4. In vitro degradation
To study the degradation of the composites, each sample was immersed in 5 mL of PBS and incubated at 37 °C in a warm room on a shaker table at 90 RPM [6]. The buffer solution was initially refreshed at 1 and 12 hrs following immersion. Thereafter, for all samples with the exception of the 3 day time point, the sample buffer was refreshed weekly, at which time the pH of the solution was measured; the 3 day time point received media changes only 1 and 12 hrs prior to analysis. At 3 days, 4 wks, and 8 wks, samples were removed from the PBS and vacuum-dried overnight. The mass left of the samples was calculated using Equation (1) below:
where M0 is the initial mass of the sample (g) and Mt is the mass of the sample (g) at 3 days, 4 wks, or 8 wks.
2.5. Porosity
Following previously established protocols, composite porosity was evaluated by microcomputed tomography (μCT) [16,26,27]. In brief, samples at 3 days, 4 wks, and 8 wks were scanned at a current of 250 mA and a voltage of 40 kV with no filter using a SkyScan 1172 μCT imaging system (SkyScan, Aartselaar, Belgium). Samples were scanned at a resolution of 7.2 μm/pixel to create high resolution (1280 × 1024 pixel) images. NRecon and CTan (SkyScan, Aartselaar, Belgium) software packages were used to reconstruct, reslice, and analyze the acquired serial tomograms. A 5-mm-diameter × 4-mm-height cylindrical region of interest, located in the center of the sample, was applied to the data set to eliminate edge effects. A total of 688 μCT slices were used to calculate the porosity and mean pore size of each sample. Finally, the images were computationally binarized using a global threshold value of 70–255 to extract the total porosity and pore size distributions. In addition, pore interconnectivity was quantified by applying a shrink-wrap algorithm with a pixel size ranging from 12 to 96 μm as previously described [28].
2.6. Poly(lactic-co-glycolic acid) degradation
Size exclusion chromatography was utilized to monitor the molecular weight of the PLGA at t = 0, 3 days, 4 wks, and 8 wks using a Waters (Milford, MA) Acquity Advanced Polymer Chromatography system (APC) consisting of pump (ACQ-ISM), sample manager (ACQ-FTN), column manager (ACQ-CM), and refractive index detector (ACQ-RI). Crushed GMP/PLGA/CPC composites (n = 3) were placed in tetrahydrofuran (THF) on a shaker table for 24 h to extract residual PLGA, and the resulting solutions were filtered using 0.2 μm Acrodisc Nylon Syringe Filters. 4 mL of THF were utilized for composites containing 20 wt% PLGA and 2 mL for composites containing 10 wt% PLGA at t = 0 to yield a concentration of ~20 mg/mL. For the later time points (4 and 8 wks), 0.5 mL were utilized for all groups, as this was the lowest amount of THF that could be added to crushed composites, recovered, and filtered with ~100 μL of solution remaining to perform injections. APC was performed (n = 3/group, 2 injections/sample) at a flow rate of 0.5 mL/min with a Waters Acquity APC XT 125 2.5 μm 4.6×75 mm column at 35°C with the refractive index detector set to 45°C. Injection volume was set to 10 μL. A calibration curve was constructed using linear polystyrene standards ranging from 266 to 28,000 Da. The number average molecular weight (Mn), weight average molecular weight (Mw), and polydispersity index (PDI) were measured and calculated using Empower 3 software (Waters).
2.7. Mechanical testing
Samples (6 mm diameter, 12 mm height, n = 10) were dried overnight in a vacuum oven and were placed in a mechanical testing bench (858 MiniBionixII®, MTS Corp., Eden Prairie, MN), and the compressive strength and compressive modulus along the height of the specimens (parallel to the long axis of the samples) were measured with a crosshead speed of 0.5 mm/min. While wet testing is more physiological, several studies have shown that testing CPCs in a dry state is an accepted protocol for investigating their mechanical properties [26,27].
2.8. Phase composition analysis
X-ray diffraction (XRD; Rigaku Smartlab, The Woodlands, TX) was used to analyze the crystallographic composition of the αTCP. CPC samples were prepared as described in section 2.1, dried, and crushed into a powder with a mortar. A CuKα with a wavelength of 1.54 Å at a voltage of 40 kV and 30 mA was used to perform powder XRD.
2.9. Statistical analysis
Statistics reported were computed using JMP Pro 10 (SAS, Cary, NC) to analyze the data. Continuous data are expressed as means ± standard deviations. In order to compare the mass remaining, porosity, pH, mean pore size, and mode pore size between groups, a one-way analysis of variance (ANOVA) test was performed with posthoc analysis by Tukey’s honestly significant difference (HSD). Furthermore, to better understand the relationship between porogen input parameters (amount of GMPs and amount of PLGA MPs) on final physicochemical properties (outputs), a linear regression model was fit via standard least-squares using all of the raw data (n = 3/group technical replicates from each of the nine groups).
3. Results
3.1. Cement setting times
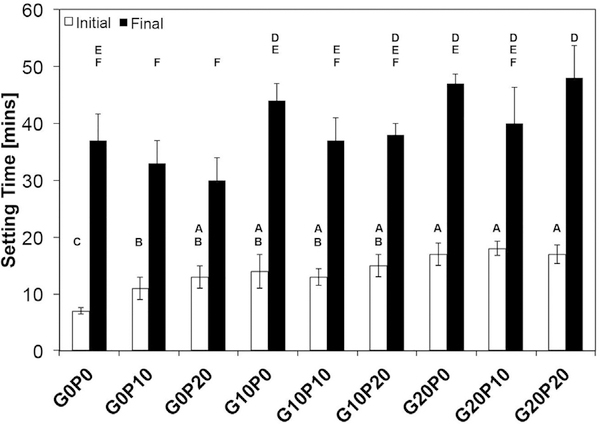
The setting times for each cement composition are presented in Fig. 1. The addition of either porogen significantly increased the initial setting time as compared to the control (p < 0.05). However, the initial setting time was dependent upon the type of porogen as well as the wt%. The addition of 10 wt% PLGA MPs increased the initial setting time to 11.7 ± 1.7 min compared to the 10 wt% GMPs composites with an average of 14.3 ± 3.1 min. This was also observed in both the 20 wt% single porogen formulations (G20P0 and G0P20). For dual porogen systems, all initial setting times were between the minimum and maximum for the single porogen cements. Interestingly, an increase in final setting time was only observed for the G20P20 group (p < 0.05).
Fig. 1.
Initial and final setting times of the different formulations investigated are presented. G0P0 represents the control CPC group. GMPs and PLGA MPs were introduced in three different weight fractions (0, 10, and 20 wt%). Within each series, groups that do not share the same letter are statistically significantly different (n = 4, p < 0.05).
3.2. Morphological analysis and phase composition
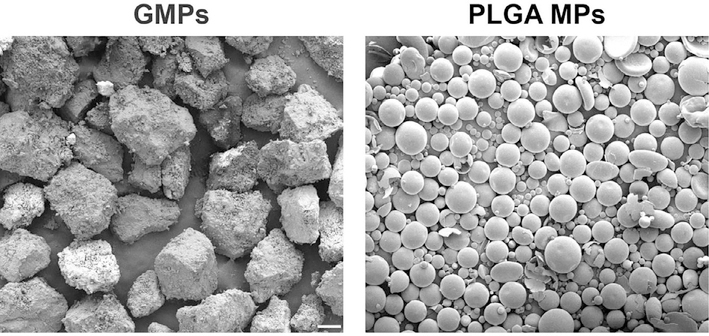
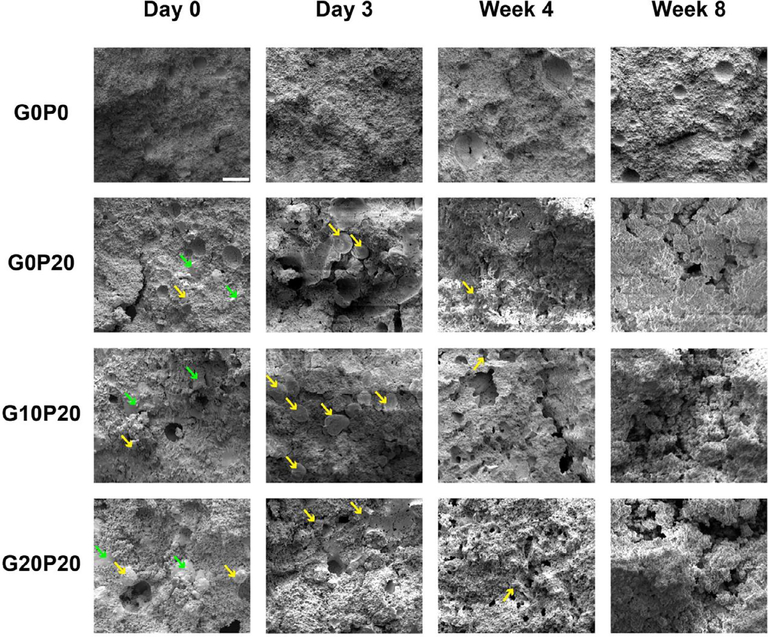
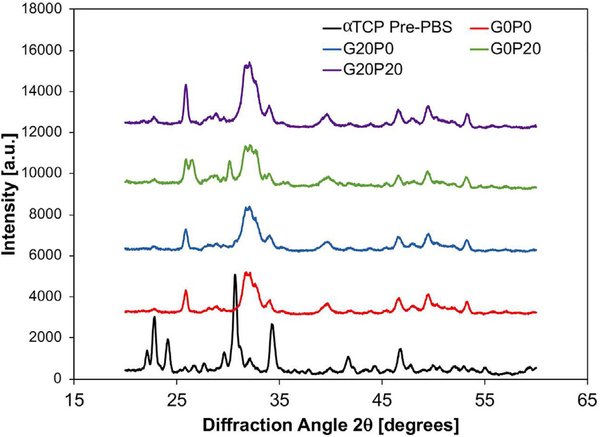
The external morphologies of GMPs and PLGA MPs are presented in Fig. 2. The GMPs were observed to have a jagged irregular shape, while the PLGA MPs had a smooth spherical geometry. Representative scanning electron micrographs revealing the internal microscale morphology of GMP/PLGA/CPC composites are presented in Fig. 3 and Fig. S3. The jagged irregular regions represent areas of GMPs, while PLGA MPs can be identified by the smooth spherical areas, as observed in Fig. S1. At day 0 both GMPs and PLGA MPs can be seen within the internal structure of the samples. Composites that had a larger porogen content displayed a greater amount of pitting and internal defects as compared to the control. Specifically, groups that incorporated GMPs had a greater amount of pores and these pores were characterized by larger diameters. A similar effect was observed at day 3. The control group had the least amount of voids, and PLGA MPs were still present. Cavernous voids were observed again in samples that incorporated GMPs. At day 3, round smooth pores were observed within the composites. However, PLGA MPs were still observed within the composites. Starting at wk 4 and proceeding to wk 8, samples that incorporated GMPs began to display signs of large scale cavitation as evidenced by the increase in large voids. Moreover, as the concentration of GMPs increased, fewer PLGA MPs were found in the SEM micrographs. Furthermore, the crystallographic composition was analyzed by XRD and presented in Fig. 4. After the samples were exposed to PBS for 3 days, the αTCP transformed into HA. This is concluded by the disappearance of the characteristic αTCP peak at a 2Θ value of 30.9° followed by the appearance of the characteristic HA peaks of 2Θ values 25.8° and 31.8° [29].
Fig. 2.
GMPs and PLGA MPs external morphology analyzed by scanning electron microscopy (SEM) after fabrication. The white scale bar represents 100 μm in both micrographs.
Fig. 3.
Representative scanning electron microscopy (SEM) images showing the internal morphology of composites upon fabrication (Day 0) and after being leached in PBS at 37 °C for 3 days, 4 wks, and 8 wks. G0P0 represents the control. GMPs were introduced in three different weight fractions (0, 10, and 20%) and represented by groups G0P20, G10P20, and G20P20, respectively. The smooth spherical particles annotated by a yellow arrow represent PLGA MPs, while the jagged irregular particles marked with a green arrow represent GMPs. The white scale bar in the image in row 1 column row 1 represents 100 μm in all micrographs. (For interpretation of the references to colour in this figure legend, the reader is referred to the web version of this article.)
Fig. 4.
Representative x-ray diffraction (XRD) patterns for GMP/PLGA/CPC composites analyzed before being placed in PBS (αTCP Pre-PBS) and after 3 days in PBS (G0P0, G20P0, G0P20, and G20P20).
3.3. In vitro degradation
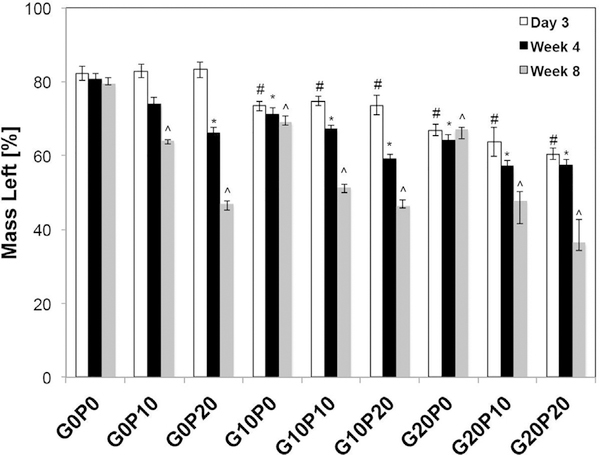
Fig. 5 and Table S1 present the remaining mass of the CPC composites as a function of incubation time. All experimental groups showed a decrease in mass following immersion in PBS. Theoretically, 19.7 wt% of the samples’ mass can be attributed to glucose that has precipitated out of the 24 wt% Na2HPO4 solution [16]. The G0P0 composite retained 82.2 ± 1.8% of its initial weight after 3 days, which is in accordance with the theoretical amount of glucose that precipitates out of the saturated liquid. Composites with only GMPs showed a greater mass loss compared to the control group or groups that only contained PLGA MPs after 3 days (p < 0.05). Specifically, the mass retained after 3 days was 73.4 ± 1.3% and 66.8 ± 1.5% for G10P0 and G20P0, respectively. No difference in mass was observed between samples that only contained PLGA MPs (G0P10 and G0P20) and G0P0, with the G0P10 and G0P20 retaining 82.9 ± 1.8% and 83.2 ± 2.1%, respectively (p > 0.05). Mass loss for samples that included GMPs and PLGA MPs varied with respect to the weight percentages of each component. This mass loss can be reasonably attributed to the dissolution of GMPs within the composites, given the degradation of the control. In the combined GMP/PLGA composites, the mass loss varied depending on the relative weight percentages, but all exhibited mass loss greater than the control (p < 0.05). After 4 wks of incubation, no additional mass loss was detected from samples that only contained GMPs (p > 0.05). This effect was observed for the remainder of the study. However, groups that contained PLGA MPs saw a significant increase in mass loss starting at 4 wks followed by further decrease at 8 wks (p < 0.05). Groups that contained both GMPs and PLGA MPs experienced an initial mass loss that was similar to samples that only contained GMPs (p > 0.05) followed by a mass loss that was similar to groups that only contained PLGA MPs (p > 0.05).
Fig. 5.
Percentage of mass left for the different formulations tested after being leached in PBS at 37 °C for 3 days, 4 wks, and 8 wks. GMPs and PLGA MPs were introduced in three different weight fractions (0, 10, and 20 wt%). Within the Day 3 series, # denotes significance with respect to G0P0. In the Week 4 series, * denotes significance with respect to G0P0. In the Week 8 series, ^ denotes significance with respect to G0P0 (n = 6, p < 0.05).
3.4. Porosity of composites
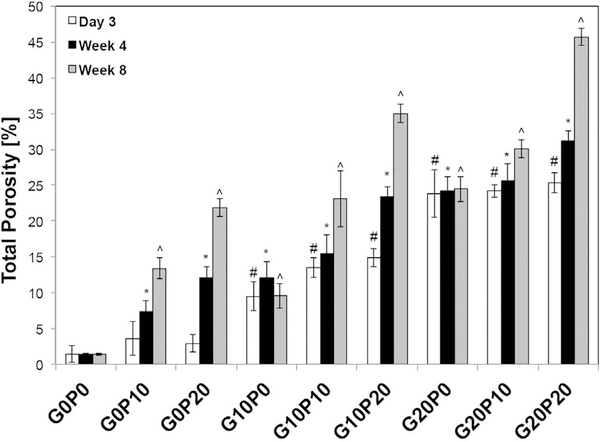
The total porosity of the different CPC formulations was measured by μCT and is presented in Fig. 6. After 3 days of incubation, incorporation of GMPs within the samples resulted in a higher overall porosity as compared to the control (p < 0.05). Furthermore, an increase in the overall porosity was seen in samples that incorporated a greater fraction of GMPs (p < 0.05, Table S2). At 3 days, the porosity increased from 9.5 ± 2.4% to 23.8 ± 1.4% for the G10P0 and G20P0 samples, respectively. In samples that contained both porogens, the addition of PLGA MPs had no effect on the composites’ overall porosity after 3 days (p > 0.05). Furthermore, no difference was seen between samples that only incorporated PLGA MPs (G0P10 & G0P20) and the CPC control (G0P0) after 3 days of incubation (p > 0.05). While composites that only incorporated GMPs did not show an additional increase in porosity after 4 wks of incubation, the use of PLGA MPs further increased the porosity at 4 wks (from 25.3 ± 3.3% at day 3 to 31.2 ± 1.9% at 4 wks for G20P20, p < 0.05). The magnitude of this effect was also dependent upon the weight fraction of PLGA MPs incorporated. After 8 wks of incubation, samples that only contained GMPs (G10P0 and G20P0) or no porogen at all (G0P0) showed no further increase in porosity (p > 0.05). However, samples that contained PLGA MPs continued to have an increase in overall porosity (from 31.2 ± 1.9% at 4 wks to 45.7 ± 2.8% at 8 wks for G20P20, p < 0.05; Table S2).
Fig. 6.
Total porosity of the GMP/PLGA/CPC composites evaluated by microCT after being leached in PBS at 37 °C for 3 days, 4 wks, and 8 wks. GMPs and PLGA MPs were introduced in three different weight fractions (0, 10, and 20 wt%). Within the Day 3 series, # denotes significance with respect to G0P0. In the Week 4 series, * denotes significance with respect to G0P0. In the Week 8 series, ^ denotes significance with respect to G0P0 (n = 3, p < 0.05).
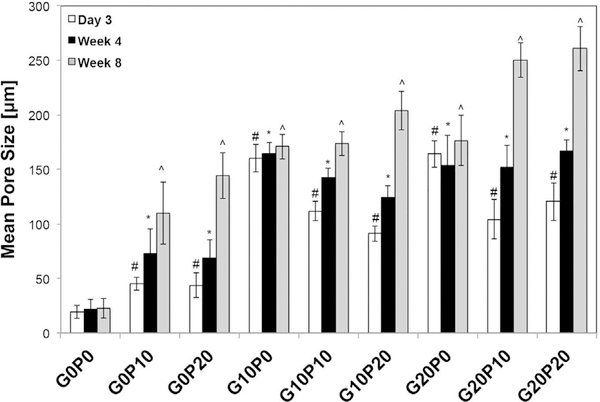
Pore size was another parameter that was significantly affected by the weight fraction and the specific porogen that was present in the composite. The mean pore size and mode pore size as a function of incubation time are presented in Fig. 7 and Supplemental Fig. S2, respectively. At 3 days of incubation, a significant increase (p < 0.05) in mean pore size was observed for samples that contained either GMPs or PLGA MPs. However, the effect of GMPs on the mean pore size was more pronounced than that of PLGA MPs. For the remainder of the study, an additional increase in mean pore size was not observed for G10P0 and G20P0 groups (p > 0.05, Table S3). On the contrary, at 4 wks and 8 wks, samples that incorporated PLGA MPs continued to develop larger pores (p < 0.05). In addition, the overall weight fraction of the incorporated porogen had a direct effect on the average pore size. As the overall weight fraction of the porogen increased, so did the mean pore size. A similar effect was observed for the mode pore size. Specifically, the mode pore size of G10P10, G10P20, G20P10, and G20P20 initially resembled the one of G10P0 and G20P0 (p > 0.05, Table S4). However, the peak pore size gradually increased over time to a maximum of 334 ± 30 μm after 8 wks of incubation for group G20P20. Finally, pore interconnectivity (Fig. S5) was affected by both the composition of the porogen and the weight fraction of porogen present. As compared to the control, at 3 days the addition of GMPs increased the percentage of open porosity and the availability of objects>12 μm to traverse the composites. However, the addition of PLGA MPs did not create an open pore structure after 3 days. Although after 8 weeks, the incorporation of PLGA MPs had a profound effect on the interconnected pore structure as compared to the control and groups that only incorporated GMPs.
Fig. 7.
Mean pore size of the GMP/PLGA/CPC composites determined by microCT after being leached in PBS at 37 °C for 3 days, 4 wks, and 8 wks. GMPs and PLGA MPs were introduced in three different weight fractions (0, 10, and 20 wt%). Within the Day 3 series, # denotes significance with respect to G0P0. In the Week 4 series, * denotes significance with respect to G0P0. In the Week 8 series, ^ denotes significance with respect to G0P0 (n = 3, p < 0.05).
3.5. PLGA molecular weight
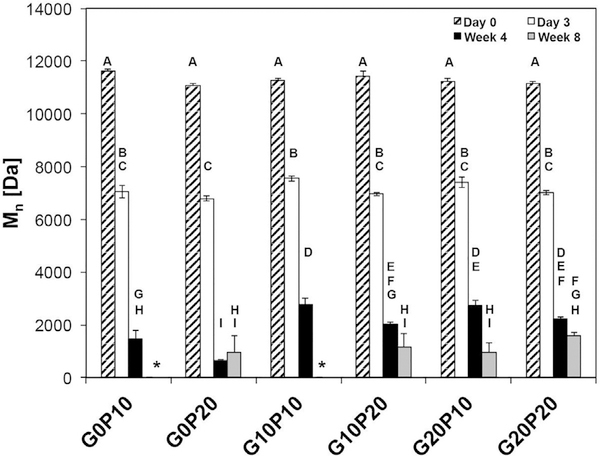
The number average molecular weight (Mn) and weight average molecular weight (Mw) of PLGA MPs within the samples at different time points are presented in Fig. 8 and Supplemental Fig. S3, respectively. At day 0, the Mn was consistent across all groups at around 11,000 Da. After 3 days, the number average molecular weight had decreased to 7,000 Da in all groups. At 4 wks, significant differences could be seen between groups. The highest molecular weights measured at 4 wks were found in the G10P10 and G20P10 (2785 ± 205 and 2732 ± 175 Da, respectively), while the lowest molecular weight was seen in the G0P20 group at 663 ± 32 Da. The presence of GMPs resulted in slower degradation and in higher molecular weight of the PLGA at 4 weeks. Several groups with higher PLGA content (G0P20 and G10P20) had significantly lower Mn (p < 0.05) than groups with less PLGA but the same amount of glucose incorporated (G0P10 and G10P10); a similar trend was seen between G20P20 and G20P10, but this was not statistically significant. The PLGA molecular weight continued to decrease with increasing time in PBS. After 8 weeks, the average Mn was<10% of the starting value. Additionally, two groups (G0P10 and G10P10) had chromatogram peaks that extended beyond the narrow peak of the lowest standard and could not be quantified.
Fig. 8.
The number average molecular weight (Mn) of the PLGA inside CPC composites evaluated by advanced polymer chromatography (APC) after fabrication (day 0) and after being leached in PBS at 37 °C for 3 days, 4 wks, and 8 wks. GMPs and PLGA MPs were introduced in three different weight fractions (0, 10, and 20%). Those that do not share the same letter are statistically significantly different (p < 0.05). The introduction of GMPs impeded the degradation of PLGA through 4 wks, with lower molecular weights seen in groups containing higher percentages of PLGA. At 8 wks, G0P10 and G10P10 (marked with an *) could not be quantified due to a broad chromatogram extending beyond that of the lowest standard (266 Da).
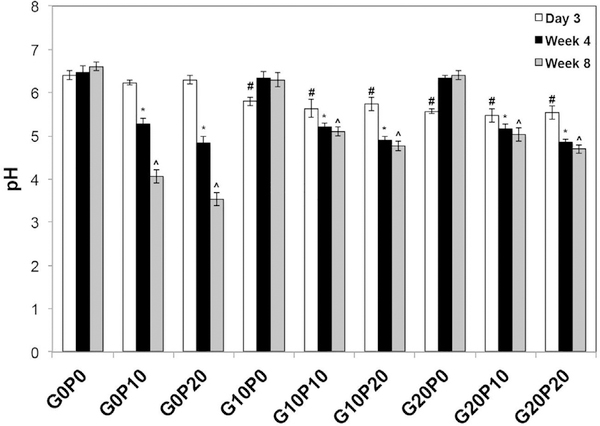
To gain insight about the amount of acidic degradation products due to hydrolysis of PLGA, pH measurements of the incubation media as a function of time are presented in Fig. 9 and Table S5. The incorporation of GMPs decreased the pH of the incubation media after 3 days as compared to the control composite (p < 0.05). However, this observation was short lived. After 4 wks and continuing for the duration of the study, no difference in pH was noted between groups that only incorporated GMPs and the control (p > 0.05). On the contrary, while samples that only incorporated PLGA MPs had no observable decrease in pH after 3 days compared to the control (p > 0.05), after 4 wks an observable decrease in the pH of the incubation media was noted (p < 0.05). There was a further decrease in the pH of the incubation media after 8 wks (p < 0.05) in the groups that contained only PLGA MPs. Interestingly, the incorporation of GMPs in composites that also contained PLGA MPs led to a higher pH of the incubation media at 8 wks as compared to composites that only incorporated PLGA MPs (p < 0.05, Table S5). In addition, a further decrease in pH was not observed between 4 and 8 wks for composites that contained both GMPs and PLGA MPs (p > 0.05; Table S5).
Fig. 9.
Incubation media pH during the GMP/PLGA/CPC degradation studies GMPs and PLGA MPs were introduced in three different weight fractions (0, 10, and 20 wt %). Within the Day 3 series, # denotes significance with respect to G0P0. In the Week 4 series, *denotes significance with respect to G0P0. In the Week 8 series, ^denotes significance with respect to G0P0 (n = 3, p < 0.05).
3.6. Mechanical properties
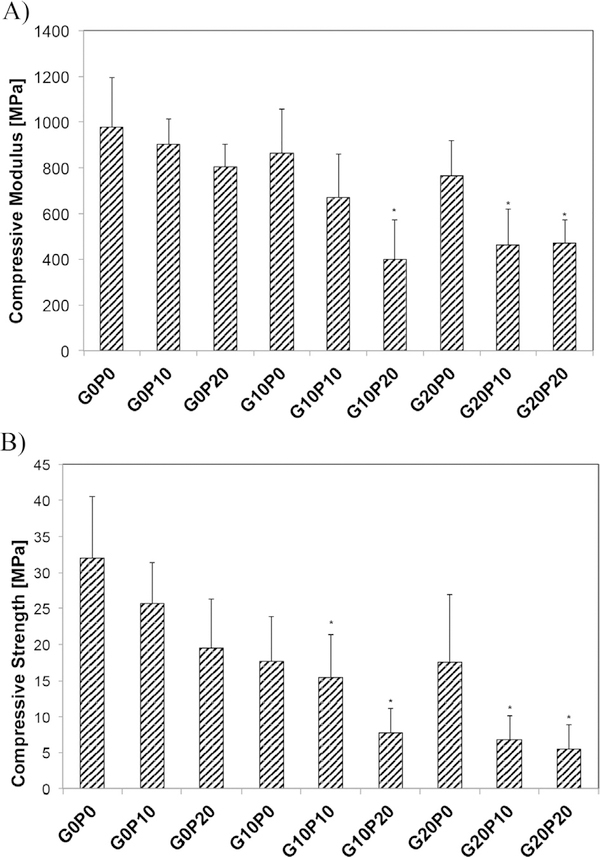
The mechanical properties of the composites were evaluated and are presented in Fig. 10. Both the compressive modulus and the compressive strength were evaluated prior to leaching. The addition of porogens decreased the compressive modulus from the control values of 978 ± 214 MPa to 863 ± 192 MPa for G10P0, 901 ± 110 MPa for G0P10, and 470 ± 104 MPa for G20P20. This reduction in compressive modulus was independent of incorporating GMPs vs PLGA MPs, but was exacerbated with higher weight fractions of porogens. Likewise, the compressive strength of the control was measured to be 32 ± 8 MPa and decreased with the addition of porogens as seen in Fig. 10.
Fig. 10.
Compressive modulus (A) and compressive strength (B) of different formulations tested upon fabrication. G0P0 represents the control CPC group. GMPs and PLGA MPs were introduced in three different weight fractions (0, 10, and 20 wt%).Within each figure panel, * indicate statistical difference from the control (6 ≤ n ≤ 12, p < 0.05).
4. Discussion
We investigated the use of glucose microparticles (GMPs) and poly(lactic-co-glycolic acid) microparticles (PLGA MPs) as means to generate early (<3 days) macroporosity within calcium phosphate cements (CPCs) and to reduce the acidity due to PLGA degradation products. It was hypothesized that the inclusion of GMPs would create early macroporosity within the CPC that would enhance the diffusion of PLGA acidic degradation products and consequently impede the degradation of the PLGA and prevent the decrease in pH as a result of the degradation. For this study, three different weight fractions of GMPs (0, 10, and 20 wt%) and three different weight fractions of PLGA MPs (0, 10, and 20 wt%) were used. We characterized how these conditions affected the physicochemical properties of the obtained GMP/PLGA/CPC composites. Furthermore, the effect of incorporating GMPs on the in vitro degradation rate of PLGA MPs was investigated and compared to composites that solely incorporated PLGA MPs.
Quantification of the handling properties, specifically the initial and final setting time, is of great importance from a clinical perspective. If the setting time for a bone cement is too long, the cement will not retain its shape or the cement will not be able to adequately support the surrounding tissue [30]. As such, several investigators have proposed that the initial setting time for CPCs should be approximately 15 min [30–32]. Analyses of the initial setting times of the GMP/PLGA/CPC composites emphasized that the inclusion of GMPs and PLGA MPs increased the initial setting time compared to the control. However, all groups had an initial setting time that was within the upper limit for clinical use, in agreement with previous investigations that have used water-soluble porogens or polymer based porogens [16,24,31,33]. Bohner et al. states that one can observe a three- to fourfold reduction in the setting time of apatite CPCs when the temperature increases from 20 to 37 °C [34]. As such, we contend that these setting times would be significantly reduced in clinical applications suggesting that GMPs and PLGA MPs can be incorporated within CPCs without significantly delaying the wound closure time. Furthermore, it has been shown that other factors such as particle size, temperature of the liquid phase, and liquid-to-powder ratio can influence the setting times [2]. The porosity of a scaffold may also decrease the compressive mechanical properties of the material by increasing the number of stress raisers within the bulk material [35]. While the addition of either GMPs or PLGA MPs diminished the compressive modulus and compressive strength, these results are also congruent with other studies that introduce water-soluble or polymer based porogens within CPCs [2,36].
Regarding the mass loss of the GMP/PLGA/CPC composites, formulations that contained GMPs showed a mass loss that was consistent with the initial amount of GMPs that were loaded within the composites, after being leached in PBS for 3 days. In addition, the mass of composites that only contained GMPs (G10P0 and G20P0) remained constant over the duration of the study. These observations support the conclusion that this change in mass loss can be attributed to the dissolution of GMPs, which is consistent with other studies that have leveraged water-soluble porogens within CPCs [16,24]. On the contrary, composites that contained only PLGA MPs (G0P10 and G0P20) did not show a decrease in mass loss after 3 days compared to the CPC controls. However, starting at week 4 and continuing for the remainder of the study, there was an observable mass loss for G0P10 and G0P20 groups. Composites that included both GMPs and PLGA MPs saw an initial mass loss after 3 days, as a result of the dissolution of the GMPs, followed by a gradual mass loss that was proportional to the amount of PLGA MPs for the duration of the study. Since it has been shown that the acidic PLGA degradation products accelerate the degradation of the CPC matrix, the addition of PLGA MPs presents another benefit of this system compared to relying on only GMPs [24]. These observations are further corroborated with the SEM micrographs. After the composites were exposed to PBS for 3 days, GMPs could not be observed within the composites.
As seen by the μCT data, the incorporation of either 10 or 20 wt% of GMPs established an initial porosity within the composites after being leached in PBS for 3 days supporting previous findings from our laboratory [16]. In addition, these results corroborate with other studies that have introduced polysaccharides for the generation of macroporosity with CPCs [16,24,37]. However, groups that also incorporated PLGA MPs saw an additional increase in porosity. While, it took several weeks for cements that contained PLGA MPs to reach their maximum porosity, which was proportional to the in vitro degradation rate of PLGA, providing a method for later pore formation. While the amount of void space is an important parameter, the size of these pores is an equally important criterion. Specifically, for bone tissue engineering, investigators have proposed a minimum pore size of 75–100 μm [38]. As such, the pore size measurements revealed that at day 3, G0P10 and G0P20 samples were similar to the CPC controls. On the contrary, composites that incorporated GMPs led to the generation of pores on the order of 200 μm after 3 days. Furthermore, it was observed that composites that incorporated GMPs had a gradual pore enlargement over the duration of the study with composites that contained 20 wt% GMPs and PLGA obtaining a maximum peak pore size of 261 ± 20 μm. Thus, the addition of GMPs created an initial porosity that is of adequate size to support perfusion by body fluids, while PLGA MPs allow for the extended development of porosity and pore enlargement. Although this work utilized a method that has been established previously for evaluating macroporosity in CPCs, gas displacement and mercury intrusion porosimetry are additional techniques that could provide useful data in future investigations [39,40].
Quantification of PLGA molecular weight showed that the addition of glucose or the amount of PLGA MPs added to the composite did not affect the initial molecular weight of the PLGA. After 3 days, significant decrease in molecular weight was seen in all groups--these values are similar to those obtained by Kamei et al. [41]. Since PLGA degradation yields acidic components, an increased presence of PLGA creates a greater amount of acidic degradation products that can catalyze the degradation reaction of PLGA, thereby increasing the degradation rate of PLGA [42]. With an increase in the local concentration of the acidic degradation products, PLGA degradation occurs at an accelerated rate due to an autocatalytic effect [43]. This effect becomes significant after 4 weeks, the groups that contained increased PLGA (G0P20, G10P20, and G20P20) had Mn that were 45%, 72%, and 80% of the Mn of G0P10, G10P10, and G20P10, respectively. At 4 weeks, it was also shown that incorporation of any glucose (either 10 wt% or 20 wt%) resulted in an increased PLGA molecular weight relative to groups that did not contain any glucose. However, there were no statistical differences between the G10P10 and G20P10 groups at 4 weeks. The pH measurements confirmed that incorporating PLGA MPs resulted in increased acid concentration in the incubation media. It is likely that the increased porosity seen in glucose-containing groups allowed for the acidic byproducts of PLGA degradation to be removed from the area immediately surrounding the PLGA and to be distributed throughout the PBS, slowing the autocatalysis seen in the G0P10 and G0P20 groups at 4 weeks. The observed pH difference between groups that contained only PLGA MPs and those that contain both porogens confirms that the presence of GMPs results in more acidic degradation products being leached out of the scaffold and into the media. The increased PLGA degradation with lower porosity (as seen in groups without GMPs) has been previously shown in literature [44].
Finally, in order to better understand the impact of the type and amount of porogen on the resulting composites physicochemical properties over time, a linear regression model was built. This model generated descriptive data that identified input parameters that had a statistically significant effect on the composites. The parameter estimates in Table 1 are model coefficients. The estimate for GMPs indicates the expected change in output per each additional increase in GMP wt% and the estimate for PLGA MPs indicates the expected change in output for each additional increase in wt% PLGA MPs that was incorporated within the CPCs. For example, for the porosity after 8 wks, the porosity of the composite is expected to increase 1.0% with each 1 wt% addition of GMPs and increase 1.1% with each 1 wt% addition of PLGA MPs. Currently, this model only applies to CPCs that have incorporated 0–20 wt% GMPs and 0–20 wt% PLGA MPs. In order to further our understanding and the utility of this model, additional data from experimental replicates as well as a larger range of input variables may be added. Variables such as liquid/powder ratio and particle size have been previously demonstrated to affect the specific physicochemical properties such as porosity of CPCs [45].
Table 1.
Statistical model based on porogen content data.
| Day 3 | |||||||||
|---|---|---|---|---|---|---|---|---|---|
| GMPs | PLGA MPs | Interaction | |||||||
| Property | Estimate | SEM | p | Estimate | SEM | p | Estimate | SEM | p |
| Porosity | 1.067 | 0.054 | <.0001a | 0.117 | 0.054 | 0.042a | 0.003 | 0.007 | 0.651 |
| Mean Pore Size | 4.677 | 0.667 | <.0001a | −1.464 | 0.667 | 0.039 a | −0.171 | 0.082 | 0.048a |
| Mode Pore Size | 9.260 | 1.074 | <.0001a | 0.743 | 1.074 | 0.496 | −0.020 | 0.132 | 0.879 |
| Mass Left | −0.998 | 0.083 | <.0001a | −0.092 | 0.083 | 0.280 | −0.007 | 0.010 | 0.494 |
| pH | −0.039 | 0.004 | <.0001a | −0.003 | 0.004 | 0.392 | 0.000 | 0.000 | 0.725 |
| Week 4 | |||||||||
| GMPs | PLGA MPs | Interaction | |||||||
| Property | Estimate | SEM | P | Estimate | SEM | p | Estimate | SEM | p |
| Porosity | 0.930 | 0.030 | <.0001a | 0.493 | 0.030 | <.0001a | −0.010 | 0.004 | <.0001a |
| Mean Pore Size | 5.153 | 0.697 | <.0001a | 0.332 | 0.697 | 0.638 | −0.084 | 0.085 | 0.337 |
| Mean Pore Size | 8.454 | 0.929 | <.0001a | 3.106 | 0.929 | 0.0028a | −0.100 | 0.114 | 0.387 |
| Mass Left | −0.716 | 0.060 | <.0001a | −0.562 | 0.060 | <.0001a | 0.012 | 0.007 | 0.123 |
| pH | −0.003 | 0.006 | 0.557 | −0.076 | 0.006 | <.0001a | 0.000 | 0.001 | 0.549 |
| Week 8 | |||||||||
| GMPs | PLGA MPs | Interaction | |||||||
| Property | Estimate | SEM | p | Estimate | SEM | P | Estimate | SEM | p |
| Porosity | 1.050 | 0.064 | <.0001a | 1.110 | 0.064 | <.0001a | 0.002 | 0.008 | 0.801 |
| Mean Pore Size | 6.830 | 0.655 | <.0001a | 3.974 | 0.655 | <.0001a | −0.093 | 0.080 | 0.260 |
| Mode Pore Size | 8.148 | 0.951 | <.0001a | 5.540 | 0.951 | <.0001a | −0.043 | 0.116 | 0.711 |
| Mass Left | −0.620 | 0.065 | <.0001a | −1.400 | 0.065 | <.0001a | 0.013 | 0.008 | 0.106 |
| pH | 0.0322 | 0.0105 | 0.0056a | −0.1050 | 0.0105 | <.0001a | 0.0034 | 0.0013 | 0.0145a |
Estimates are the predicted change in the property per each additional 1 wt% GMPs or PLGA MPs incorporated within the CPC. SEM= standard error of the mean.
Significant effect size of the input parameter on the final property (p < 0.05).
Previously we investigated the use of GMPs to serve as a fast-acting porogen for CPCs and characterized the effect of incorporating GMPs on the physicochemical properties of GMP/CPC composites [16]. While the results of the previous study highlighted that GMPs can be leverage to generate an interconnected macroporous composite within 3 days, it would be of interest to combine this method with a porogen that has been shown to accelerate the degradation of CPCs, such as PLGA. Overall, the results of the present study suggest that the incorporation of GMPs and PLGA MPs is a method for the preparation of porous calcium phosphate cements and improves upon our previous approach. This method had the advantages of attaining an initial porosity after 3 days, followed by continued pore development, due to the degradation of PLGA MPs, for the remainder of the study. In addition, the initial porosity established by the GMPs facilitated the diffusion of acidic PLGA degradation products, thereby preventing a decrease in the local pH. However, this method extended the in vitro degradation of PLGA MPs. This could be overcome by altering characteristics such as the molecular weight of PLGA, microsphere morphology, lactic/glycolic acid ratio or end-group functionalization.
5. Conclusions
In the present study, macroporous CPCs were fabricated utilizing a multimodal approach that leveraged GMPs and PLGA MPs. The results of this study contend that the combination of GMPs and PLGA MPs is a promising method for the introduction of macropores within CPCs. By altering the concentration of GMPs and PLGA MPs one can tailor setting time, porosity, and degradation kinetics for the desired application. Within 3 days it was observed that dissolution of GMPs resulted in macropores that were adequate for fluid perfusion. After 8 weeks the PLGA MPs had almost completely degraded, further increasing the porosity of the composites. Furthermore, the incorporation of GMPs impeded a local acidity due to released lactic acid and glycolic acid by increasing the scaffold porosity to facilitate their diffusion to the surrounding media, thus allowing better control of the PLGA degradation kinetics.
Supplementary Material
Statement of significance.
A multitude of strategies and techniques have been investigated for the introduction of macropores with calcium phosphate cements (CPC). However, many of these strategies take several weeks to months to generate a maximal porosity or the degradation products of the porogen can trigger a localized inflammatory response in vivo. As such, it was hypothesized that the fast dissolution of glucose microparticles (GMPs) in a CPC composite also incorporating poly(lactic-co-glycolic acid) (PLGA) microparticles (MPs) will create an initial macroporosity and increase the surface area within the CPC, thus enhancing the diffusion of PLGA degradation products and preventing a significant decrease in pH. Furthermore, as PLGA degradation occurs over several weeks to months, additional macroporosity will be generated at later time points within CPCs. The results offer a new method for generating macroporosity in a multimodal fashion that also mitigates the effects of acidic degradation products.
Acknowledgements
This work was supported by the Army, Navy, NIH, Air Force, VA, and Health Affairs to support the AFIRM II effort, under Award W81XWH-14-2-0004. We acknowledge support by the National Institutes of Health in the preparation of this work (P41 EB023833). B.T.S and E.W. received support from Ruth L. Kirschstein Fellowships from the National Institute of Arthritis and Musculoskeletal and Skin Diseases (F30 AR071258) and the National Institute of Dental and Craniofacial Research (F31 DE027586), respectively. B.T.S and E.W. acknowledge the Baylor College of Medicine Medical Scientist Training Program.
Footnotes
Appendix A. Supplementary data
Supplementary data associated with this article can be found, in the online version, at https://doi.org/10.1016/j.actbio.2018.07.054.
References
- [1].Ohtsuki C, Kamitakahara M, Miyazaki T, Bioactive ceramic-based materials with designed reactivity for bone tissue regeneration, J. R. Soc. Interface 6 (Suppl 3) (2009) S349–60. [DOI] [PMC free article] [PubMed] [Google Scholar]
- [2].Ambard AJ, Mueninghoff L, Calcium phosphate cement: review of mechanical and biological properties, J. Prosthodont 15 (2006) 321–328. [DOI] [PubMed] [Google Scholar]
- [3].Zhang J, Liu W, Schnitzler V, Tancret F, Bouler J-M, Calcium phosphate cements for bone substitution: chemistry, handling and mechanical properties, Acta Biomater. 10 (2014) 1035–1049. [DOI] [PubMed] [Google Scholar]
- [4].Bohner M, Physical and chemical aspects of calcium phosphates used in spinal surgery, Eur. Spine J 10 (Suppl 2) (2001) S114–21. [DOI] [PMC free article] [PubMed] [Google Scholar]
- [5].Theiss F, Apelt D, Brand B, Kutter A, Zlinszky K, Bohner M, Matter S, Frei C, Auer JA, von Rechenberg B, Biocompatibility and resorption of a brushite calcium phosphate cement, Biomaterials 26 (2005) 4383–4394. [DOI] [PubMed] [Google Scholar]
- [6].Félix Lanao RP, Leeuwenburgh SCG, Wolke JGC, Jansen JA, In vitro degradation rate of apatitic calcium phosphate cement with incorporated PLGA microspheres, Acta Biomater. 7 (2011) 3459–3468. [DOI] [PubMed] [Google Scholar]
- [7].Ginebra M-P, Delgado J-A, Harr I, Almirall A, Del Valle S, Planell JA, Factors affecting the structure and properties of an injectable self-setting calcium phosphate foam, J. Biomed. Mater. Res. A. 80 (2007) 351–361. [DOI] [PubMed] [Google Scholar]
- [8].O’Neill R, McCarthy HO, Montufar EB, Ginebra M-P, Wilson DI, Lennon A, Dunne N, Critical review: injectability of calcium phosphate pastes and cements, Acta Biomater. 50 (2017) 1–19. [DOI] [PubMed] [Google Scholar]
- [9].Loh QL, Choong C, Three-dimensional scaffolds for tissue engineering applications: role of porosity and pore size, Tissue Eng. Part B Rev. 19 (2013) 485–502. [DOI] [PMC free article] [PubMed] [Google Scholar]
- [10].Ramay HRR, Zhang M, Biphasic calcium phosphate nanocomposite porous scaffolds for load-bearing bone tissue engineering, Biomaterials 25 (2004) 5171–5180. [DOI] [PubMed] [Google Scholar]
- [11].Link DP, van den Dolder J, Jurgens WJFM, Wolke JGC, Jansen JA, Mechanical evaluation of implanted calcium phosphate cement incorporated with PLGA microparticles, Biomaterials 27 (2006) 4941–4947. [DOI] [PubMed] [Google Scholar]
- [12].Félix Lanao RP, Leeuwenburgh SCG, Wolke JGC, Jansen JA, Bone response to fast-degrading, injectable calcium phosphate cements containing PLGA microparticles, Biomaterials 32 (2011) 8839–8847. [DOI] [PubMed] [Google Scholar]
- [13].Xu HHK, Burguera EF, Carey LE, Strong, macroporous, and in situ-setting calcium phosphate cement-layered structures, Biomaterials 28 (2007) 3786–3796. [DOI] [PMC free article] [PubMed] [Google Scholar]
- [14].Canillas M, Pena P, de Aza AH, Rodríguez MA, Calcium phosphates for biomedical applications, Bol. Soc. Esp. Ceram. Vidr 56 (2017) 91–112. [Google Scholar]
- [15].Denry I, Kuhn LT, Design and characterization of calcium phosphate ceramic scaffolds for bone tissue engineering, Dent. Mater 32 (2016) 43–53. [DOI] [PMC free article] [PubMed] [Google Scholar]
- [16].Smith BT, Santoro M, Grosfeld EC, Shah SR, van den Beucken JJJP, Jansen JA, Mikos AG, Incorporation of fast dissolving glucose porogens into an injectable calcium phosphate cement for bone tissue engineering, Acta Biomater. 50 (2017) 68–77. [DOI] [PMC free article] [PubMed] [Google Scholar]
- [17].Wei G, Ma PX, Macroporous and nanofibrous polymer scaffolds and polymer/bone-like apatite composite scaffolds generated by sugar spheres, J. Biomed. Mater. Res. A 78 (2006) 306–315. [DOI] [PubMed] [Google Scholar]
- [18].Zhang J-Y, Beckman EJ, Hu J, Yang G-G, Agarwal S, Hollinger JO, Synthesis, Biodegradability, and Biocompatibility of Lysine Diisocyanate-Glucose Polymers, Tissue Eng. 8 (2002) 771–785. [DOI] [PMC free article] [PubMed] [Google Scholar]
- [19].Makadia HK, Siegel SJ, Poly lactic-co-glycolic acid (PLGA) as biodegradable controlled drug delivery carrier, Polymers 3 (2011) 1377–1397. [DOI] [PMC free article] [PubMed] [Google Scholar]
- [20].Shah SR, Henslee AM, Spicer PP, Yokota S, Petrichenko S, Allahabadi S, Bennett GN, Wong ME, Kasper FK, Mikos AG, Effects of antibiotic physicochemical properties on their release kinetics from biodegradable polymer microparticles, Pharm. Res 31 (2014) 3379–3389. [DOI] [PMC free article] [PubMed] [Google Scholar]
- [21].Shive MS, Anderson JM, Biodegradation and biocompatibility of PLA and PLGA microspheres, Adv. Drug Deliv. Rev 28 (1997) 5–24. [DOI] [PubMed] [Google Scholar]
- [22].Yoon SJ, Kim SH, Ha HJ, Ko YK, So JW, Kim MS, Yang YI, Khang G, Rhee JM, Lee HB, Reduction of inflammatory reaction of poly(d, l-lactic-co-glycolic Acid) using demineralized bone particles, Tissue Eng. Part A 14 (2008) 539–547. [DOI] [PubMed] [Google Scholar]
- [23].Lee Y, Kwon J, Khang G, Lee D, Reduction of inflammatory responses and enhancement of extracellular matrix formation by vanillin-incorporated poly (lactic-co-glycolic acid) scaffolds, Tissue Eng. Part A 18 (2012) 1967–1978. [DOI] [PMC free article] [PubMed] [Google Scholar]
- [24].Lodoso-Torrecilla I, van Gestel NAP, Diaz-Gomez L, Grosfeld E-C, Laperre K, Wolke JGC, Smith BT, Arts JJ, Mikos AG, Jansen JA, Hofmann S, van den Beucken JJJP, Multimodal pore formation in calcium phosphate cements, J. Biomed. Mater. Res. A. 106 (2018) 500–509. [DOI] [PMC free article] [PubMed] [Google Scholar]
- [25].C01 Committee, Test Method for Time of Setting of Hydraulic-Cement Paste by Gillmore Needles, ASTM International, West Conshohocken PA, 2015. 10.1520/C0266–15. [Google Scholar]
- [26].Habraken WJEM, Wolke JGC, Mikos AG, Jansen JA, PLGA microsphere/calcium phosphate cement composites for tissue engineering: in vitro release and degradation characteristics, J. Biomater. Sci. Polym Ed. 19 (2008) 1171–1188. [DOI] [PubMed] [Google Scholar]
- [27].Habraken WJEM, Wouter JE, Wolke JGC, Mikos AG, Jansen JA, Porcine gelatin microsphere/calcium phosphate cement composites: Anin vitrodegradation study, J. Biomed. Mater. Res. B Appl. Biomater 91B (2009) 555–561. [DOI] [PubMed] [Google Scholar]
- [28].Shah SR, Smith BT, Tatara AM, Molina ER, Lee EJ, Piepergerdes TC, Uhrig BA, Guldberg RE, Bennett GN, Wenke JC, Mikos AG, Effects of local antibiotic delivery from porous space maintainers on infection clearance and induction of an osteogenic membrane in an infected bone defect, Tissue Eng. Part A 23 (2017) 91–100. [DOI] [PMC free article] [PubMed] [Google Scholar]
- [29].Lopez-Heredia MA, Sariibrahimoglu K, Yang W, Bohner M, Yamashita D, Kunstar A, van Apeldoorn AA, Bronkhorst EM, Félix Lanao RP, Leeuwenburgh SCG, Itatani K, Yang F, Salmon P, Wolke JGC, Jansen JA, Influence of the pore generator on the evolution of the mechanical properties and the porosity and interconnectivity of a calcium phosphate cement, Acta Biomater. 8 (2012) 404–414. [DOI] [PubMed] [Google Scholar]
- [30].Sugawara A, Asaoka K, Ding S-J, Calcium phosphate-based cements: clinical needs and recent progress, J. Mater. Chem. B Mater. Biol. Med 1 (2013) 1081–1089. [DOI] [PubMed] [Google Scholar]
- [31].Fernández E, Gil FJ, Ginebra MP, Driessens FC, Planell JA, Best SM, Calcium phosphate bone cements for clinical applications. Part I: solution chemistry, J. Mater. Sci. Mater. Med 10 (1999) 169–176. [DOI] [PubMed] [Google Scholar]
- [32].Lewis G, Injectable bone cements for use in vertebroplasty and kyphoplasty: state-of-the-art review, J. Biomed. Mater. Res. B Appl. Biomater 76 (2006) 456–468. [DOI] [PubMed] [Google Scholar]
- [33].Habraken WJEM, de Jonge LT, Wolke JGC, Yubao L, Mikos AG, Jansen JA, Introduction of gelatin microspheres into an injectable calcium phosphate cement, J. Biomed. Mater. Res. A 87 (2008) 643–655. [DOI] [PubMed] [Google Scholar]
- [34].Bohner M, Gbureck U, Barralet JE, Technological issues for the development of more efficient calcium phosphate bone cements: a critical assessment, Biomaterials 26 (2005) 6423–6429. [DOI] [PubMed] [Google Scholar]
- [35].Woodard JR, Hilldore AJ, Lan SK, Park CJ, Morgan AW, Eurell JAC, Clark SG, Wheeler MB, Jamison RD, Wagoner Johnson AJ, The mechanical properties and osteoconductivity of hydroxyapatite bone scaffolds with multiscale porosity, Biomaterials 28 (2007) 45–54. [DOI] [PubMed] [Google Scholar]
- [36].Xu HH, Quinn JB, Takagi S, Chow LC, Eichmiller FC, Strong and macroporous calcium phosphate cement: Effects of porosity and fiber reinforcement on mechanical properties, J. Biomed. Mater. Res. 57 (2001) 457–466. [DOI] [PubMed] [Google Scholar]
- [37].Xu HHK, Weir MD, Burguera EF, Fraser AM, Injectable and macroporous calcium phosphate cement scaffold, Biomaterials 27 (2006) 4279–4287. [DOI] [PubMed] [Google Scholar]
- [38].Hulbert SF, Young FA, Mathews RS, Klawitter JJ, Talbert CD, Stelling FH, Potential of ceramic materials as permanently implantable skeletal prostheses, J. Biomed. Mater. Res 4 (1970) 433–456. [DOI] [PubMed] [Google Scholar]
- [39].Mondrinos M, Dembzynski R, Lu L, Byrapogu V, Wootton D, Lelkes P, Zhou J, Porogen-based solid freeform fabrication of polycaprolactone–calcium phosphate scaffolds for tissue engineering, Biomaterials 27 (2006) 4399–4408. [DOI] [PubMed] [Google Scholar]
- [40].Weiss P, Obadia L, Magne D, Bourges X, Rau C, Weitkamp T, Khairoun I, Bouler JM, Chappard D, Gauthier O, Daculsi G, Synchrotron X-ray microtomography (on a micron scale) provides three-dimensional imaging representation of bone ingrowth in calcium phosphate biomaterials, Biomaterials 24 (2003) 4591–4601. [DOI] [PubMed] [Google Scholar]
- [41].Heya T, Okada H, Ogawa Y, Toguchi H, In vitro and in vivo evaluation of thyrotrophin releasing hormone release from copoly(dl-lactic/glycolic acid) microspheres, J. Pharm. Sci 83 (1994) 636–640. [DOI] [PubMed] [Google Scholar]
- [42].Siepmann J, Elkharraz K, Siepmann F, Klose D, How autocatalysis accelerates drug release from PLGA-based microparticles: a quantitative treatment, Biomacromolecules 6 (2005) 2312–2319. [DOI] [PubMed] [Google Scholar]
- [43].Zolnik BS, Burgess DJ, Effect of acidic pH on PLGA microsphere degradation and release, J. Control. Release 122 (2007) 338–344. [DOI] [PubMed] [Google Scholar]
- [44].Wu L, Ding J, Effects of porosity and pore size on in vitro degradation of three-dimensional porous poly(D, L-lactide-co-glycolide) scaffolds for tissue engineering, J. Biomed. Mater. Res. A 75 (2005) 767–777. [DOI] [PubMed] [Google Scholar]
- [45].Ginebra MP, Espanol M, Montufar EB, Perez RA, Mestres G, New processing approaches in calcium phosphate cements and their applications in regenerative medicine, Acta Biomater 6 (2010) 2863–2873. [DOI] [PubMed] [Google Scholar]
Associated Data
This section collects any data citations, data availability statements, or supplementary materials included in this article.


