Abstract
People express emotion using their voice, face and movement, as well as through abstract forms as in art, architecture and music. The structure of these expressions often seems intuitively linked to its meaning: romantic poetry is written in flowery curlicues, while the logos of death metal bands use spiky script. Here, we show that these associations are universally understood because they are signalled using a multi-sensory code for emotional arousal. Specifically, variation in the central tendency of the frequency spectrum of a stimulus—its spectral centroid—is used by signal senders to express emotional arousal, and by signal receivers to make emotional arousal judgements. We show that this code is used across sounds, shapes, speech and human body movements, providing a strong multi-sensory signal that can be used to efficiently estimate an agent's level of emotional arousal.
Keywords: emotion, arousal, cross-modal, spectral centroid, supramodal
1. Introduction
Arousal is a fundamental dimension of emotional experience that shapes our behaviour. We bark in anger and slink away in despair; we sigh in contentment and jump for joy. The studies presented here are motivated by the observation that these and other expressions of emotional arousal seem intuitively to match each other, even across the senses: angry shouting is frequently accompanied by jagged, unpredictable flailing and peaceful reassurance with deliberate, measured movement. These correspondences abound in the art and artefacts of everyday life. Lullabies and Zen gardens both embody a tranquil simplicity; anthems and monuments a kind of inspiring grandeur. Remarkably, expressions of emotional arousal are interpretable not only across cultures [1,2], but across species as well [3,4]. What accounts for the multi-sensory consistency and universal understanding of emotional arousal?
Previous research has shown that low-level physical features of shapes, speech, colours and movements influence emotion judgements [5–10]. These physical features include the arrangement and number of lines, corners and rounded edges in shapes, the pitch, volume, and timbre of speech, the hue, saturation and brightness of colours, and the speed, jitter and direction of movements. In particular, spectral features have been shown to predict emotional arousal judgements of human speech [11], non-verbal vocalizations [12] and music [13], as well as of dog barks [4,14,15], and of vocalizations across all classes of terrestrial vertebrates [3]. Accordingly, determining exactly how information about internal states (including emotions) is transmitted using low-level stimulus properties is a necessary step towards understanding inter-species communication [16,17].
Based on these findings, we propose that expressions of emotional arousal are universally understood across cultures and species because they are signalled [18,19] using a multi-sensory code. Here, we test this hypothesis, showing over five studies that signal senders and receivers both encode and decode variation in emotional arousal using variation in the spectral centroid (SC), a low-level stimulus feature that is shared across sensory modalities. We further show that the SC predicts arousal across a range of emotions, regardless of whether those emotions are positively or negatively valenced. (Our hypothesis is limited to emotional arousal and the SC. We do not intend to suggest, for example, that the complete form of a shape with a given level of emotional arousal is recoverable from a similarly expressive sound—only that, all else being equal, shapes and sounds with the same level of emotional arousal will have similar SCs.)
Study 1 tests this hypothesis using a classic sound–shape correspondence paradigm [20,21], comparing judgements of emotional arousal for shapes and sounds with either high or low SCs. Study 2 tests whether participants in fact use the SC to express emotion in the visual domain by asking them to draw many emotionally expressive shapes and comparing their SCs. Study 3 tests whether the SC predicts emotional arousal better than other candidate features across a wide range of shapes and sounds. Study 4 tests whether the SC predicts judgements of emotional arousal in natural stimuli. Finally, study 5 tests whether the SC predicts continuously varying emotional arousal across a wide range of emotion categories. Findings from all studies are summarized in table 1.
Table 1.
Summary of findings. Each study tested how well the SC predicted emotional arousal. Studies 1–4 used categorical emotion labels, while study 5 used continuous judgements of emotional arousal. The result column indicates the accuracy of a logistic regression classifier that uses the SC to predict emotional arousal, except for study 5, where we report the β weight associated with the SC for continuous prediction of emotional arousal.
| task | stimuli | emotions | result | |
|---|---|---|---|---|
| study 1 | emotion judgement (categorical) | shapes and sounds based on Köhler [20] | angry, sad, excited, peaceful | 77–89% accuracy |
| study 2 | emotion expression (categorical) | shapes drawn by participants | angry, sad, excited, peaceful | 71–78% accuracy |
| study 3 | emotion judgement (categorical) | procedurally generated shapes (n = 390) and sounds (n = 390) | angry, sad, excited, peaceful | 78% accuracy |
| study 4 | emotion judgement (categorical) | natural speech and body movements | angry, sad | 86–88% accuracy |
| study 5 | emotional arousal judgement (continuous) | natural speech and body movements | anger, boredom, disgust, anxiety/fear, happiness, sadness, neutral | SC β = 0.76 |
2. Study 1: the spectral centroid predicts emotional arousal in shapes and sounds
(a) Methods
Participants were 262 students, faculty and staff of Dartmouth College. Because these experiments were brief (1–2 min), participants viewed an information sheet in lieu of a full informed consent procedure and were compensated with their choice of bite-sized candies. Sample sizes for all tasks reported in this manuscript were determined as described in the electronic supplementary material. Ethical approval was obtained from the Dartmouth College institutional review board. For all studies and tasks, participants were excluded from analysis if they reported knowledge of Köhler's [20] experiment. Eight participants were excluded from study 1 for this reason.
For all reported studies, we compared auditory and visual stimuli in the same terms: their observable frequency spectra, obtained via the Fourier transform. In time-varying stimuli such as human speech and movement, we quantify the central tendency of the frequency spectrum as the SC. SC is defined in the equation
| 2.1 |
where M is a magnitude spectrum possessing frequency components f, both indexed by i [22]. The SC can be understood as the ‘centre of mass’ of a spectrum—the frequency around which the majority of the energy is concentrated.
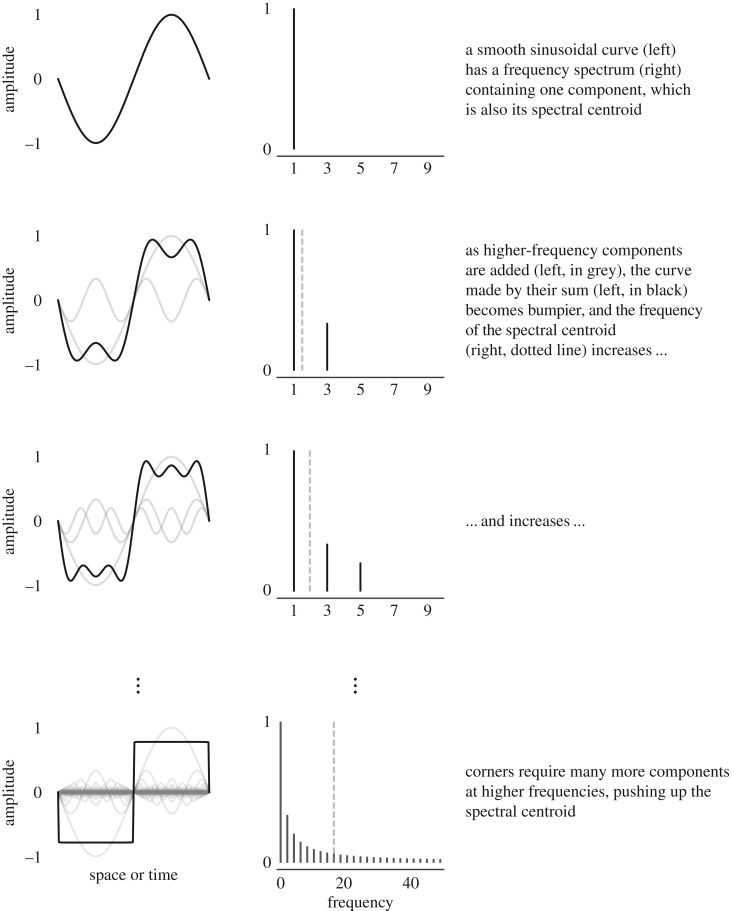
We estimated the SC of two-dimensional drawings using a different method. When a two-dimensional contour is closed and non-overlapping, it can be represented by a Fourier shape descriptor [23]. Shapes with more sharp corners require higher-magnitude high-frequency components, pushing up their SC (see figure 1 for a visual explanation). Here, we analysed drawings containing open, overlapping contours, and therefore did not use Fourier descriptors. Instead, we took advantage of the link between corners and high-frequency energy components, estimating the SC of shapes using Harris corner detection [24].
Figure 1.
Visual explanation of the link between SC and corners.
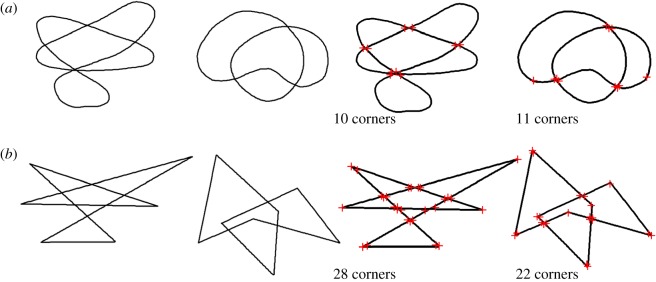
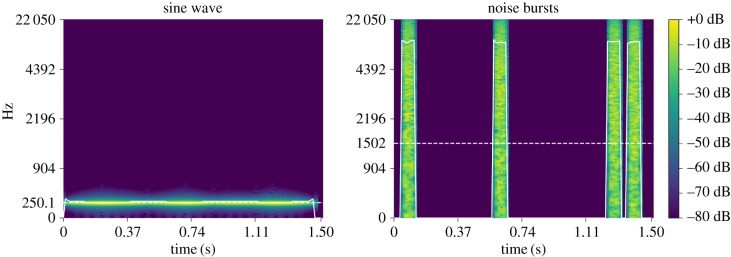
We hypothesized that sounds and shapes with higher SC relative to similar stimuli would be associated with high-arousal emotions. Two shape pairs with differing SCs were created based on Köhler's [20] shapes, where the general outline, positions of line crossings and size were matched for each pair (figure 2). We used two non-phonetic sounds, 1.5 s in duration, with differing mean SCs (figure 3). One sound, designed to match the spiky shape, consisted of four 54 ms bursts of white noise in an asymmetrical rhythm. The second sound, designed to match the rounded shape, consisted of an amplitude-modulated sine wave at 250 Hz with volume peaks creating an asymmetrical rhythm similar to the noise burst pattern. To account for the possibility that the effect of SC differed across positive and negative emotions, we used two emotion pairs (angry/sad and excited/peaceful) differing in valence [25]. In all tasks, each participant completed a single trial, and the order of shapes, sounds and emotion words was counterbalanced across participants.
Figure 2.
Shape pairs used in tasks 1 and 2, based on Köhler's [20] shapes, before and after Harris corner detection. (a) Low SC, low corner count shapes; (b) high SC, high corner count shapes.
Figure 3.
Spectrograms of sound stimuli. Solid white line shows instantaneous SC; dotted white line shows the mean SC. (Online version in colour.)
(i). Task 1: shape–emotion matching
In the negative valence shape–emotion task, participants (n = 60) viewed a single shape and chose one of two emotion labels. The instructions took the form: ‘Press 1 if this shape is angry. Press 2 if this shape is sad.’ Participants in the positive valence shape–emotion task (n = 71) viewed a single shape and answered a pen-and-paper survey reading ‘Is the above shape peaceful or excited? Circle one emotion.’ Data in the negative shape–emotion matching task were originally collected and reported by Sievers et al. [26].
(ii). Task 2: sound–emotion matching
In the negative valence sound–emotion task, participants (n = 59) heard one sound and chose one of two emotion labels (angry and sad). The instructions took the form: ‘Click on the emotion that goes with [noise bursts]’. Participants in the positive valence sound–emotion task (n = 71) heard one of the sounds and answered a pen-and-paper survey reading ‘Is the above shape angry or sad? Circle one emotion.’
(b). Results
(i). Matching
Across all matching tasks, participants associated high mean SC sounds (noise burst) and shapes (spiky) with high-arousal emotions (angry, excited), and low mean SC sounds (sine wave) and shapes (rounded) with low-arousal emotions (sad, peaceful).
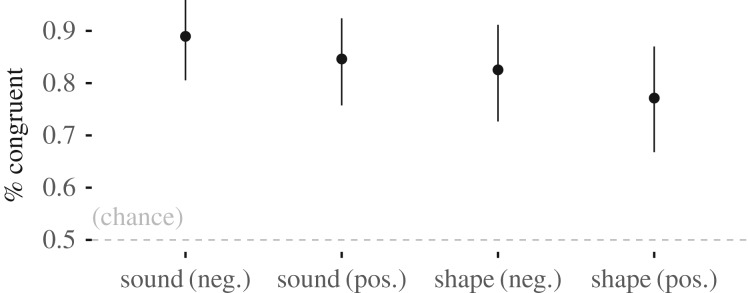
The sound–emotion estimated success rate was 89% (95% confidence interval (CI): 0.80–0.96, n = 59) for negative emotions and 85% (95% CI: 0.75–0.92, n = 68) for positive emotions, and the shape–emotion estimated success rate was 83% (95% CI: 0.73–0.91, n = 60) for negative emotions and 77% (95% CI: 0.67–0.87, n = 63) for positive emotions (figure 4).
Figure 4.
Study 1 results. Angry and excited (high arousal) were associated with high SC stimuli (noise bursts and spiky shapes), while sad and peaceful (low arousal) were associated with low SC stimuli (sine wave and rounded shapes).
These results are consistent with the hypothesis that expressions of emotional arousal are universally understood because they share observable, low-level features, even across sensory domains. Specifically, the SC of both auditory and visual stimuli predicted perceived emotional arousal across sounds and shapes.
3. Study 2: drawing emotional shapes
(a). Methods
To directly test the hypothesis that people use SC variation to express emotional arousal, we asked participants to draw abstract shapes that expressed emotions. Participants (n = 68) completed a pen-and-paper survey. The first page of the survey showed a single shape with the text: ‘Is the above shape angry or sad? Circle one emotion.’ Below this question, participants were instructed to draw a shape that expressed the emotion they did not circle. On the second page, participants answered two free-response questions: ‘What is different between the shape we provided and the shape you drew?’ and ‘Why did you draw your shape the way you did?’ Participants were given no information about our hypothesis, and their responses were not constrained to be either spiky or rounded. We replicated this study using a second survey (n = 152) that did not show an example shape, and included the positively valenced emotions excited and peaceful. This survey had two questions: ‘Below, draw an abstract shape that is [emotion]’ and ‘Why did you draw your shape the way you did?’ Surveys are available at https://github.com/beausievers/supramodal_arousal.
Bayesian logistic regression classification was used to determine whether the SC, estimated using Harris corner detection [24], was sufficient to predict emotional arousal. All classification analyses used fivefold stratified cross-validation. All receiver operating characteristic (ROC) analyses were conducted using the same cross-validation training and test sets as their corresponding classification analysis.
(b). Results
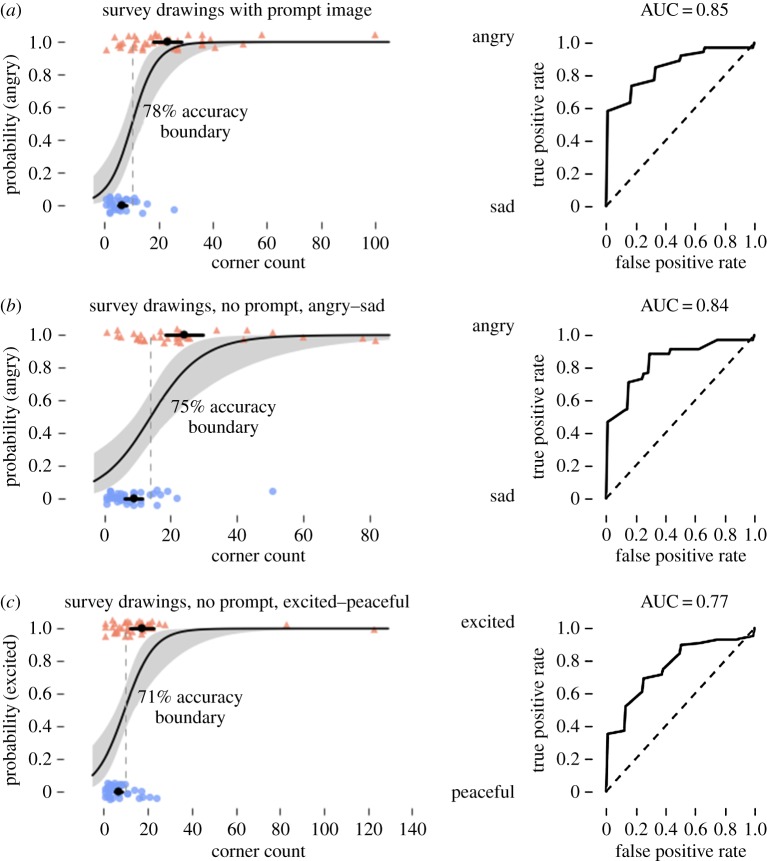
In responses to our first survey, including a prompt image and using only negatively valenced emotions, drawings of angry shapes had a mean of 23.3 corners, while sad shapes had 6.6 corners. Bayesian logistic regression classified angry and sad shapes with 78% accuracy and 85% area under the curve (AUC) based on the number of corners alone. Responses to our second survey, with no prompt image and including both positive and negative emotions, showed angry shapes had a mean of 24.2 corners, sad shapes had a mean of 8.8 corners, excited shapes had a mean of 17.1 corners and peaceful shapes had a mean of 6.8 corners (figure 5). Bayesian logistic regression classified angry and sad shapes with 75% accuracy and 84% AUC, and excited and peaceful shapes with 71% accuracy and 77% AUC (figure 6).
Figure 5.
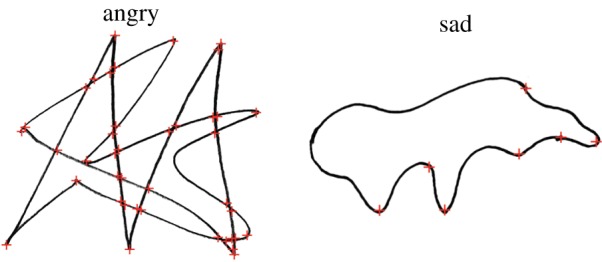
Characteristic angry and sad drawings from study 3, after smoothing and corner detection. Corners are marked with red ‘+’ signs. Among our participants, angry drawings had a mean of 23.3 corners, while sad drawings had a mean of 6.6 corners. (Online version in colour.)
Figure 6.
Bayesian logistic regression classification of angry, sad, excited and peaceful drawings from our survey participants. For all logistic regression plots, black dots and bars show means and 95% CIs of the mean, and the dotted line shows the 50% probability boundary. (a) Participants were shown a prompt image and asked to draw a shape conveying the opposite arousal negative emotion. (b,c) Participants were shown no prompt image and asked to draw a shape that was angry, sad, excited or peaceful.
Most participants were aware of their strategy, using terms such as ‘jagged’ and ‘sharp’, noting that angry emotion implied ‘pointed’ images with many crossing lines while sad emotion implied ‘round’ or ‘smooth’ images with fewer or no crossing lines. Participants sometimes used cross-modal and affective language to describe their drawings, describing angry as having ‘fast movement’, being ‘frantic’, etc. while sad was ‘soft’.
4. Study 3: the spectral centroid predicts emotional arousal across many shapes and sounds
(a). Methods
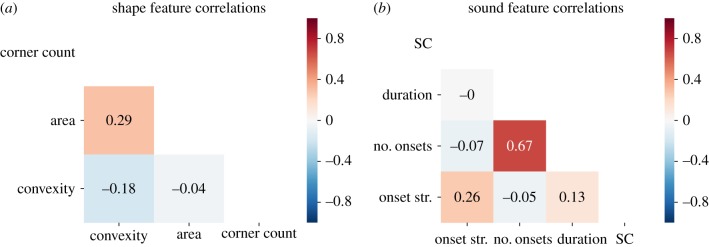
In study 3, we procedurally generated 390 shapes and 390 sounds that varied broadly in their observable features. These features included convexity, area and corner count for shapes, and onset strength, the number of onsets, duration and SC for sounds (see electronic supplementary material for details). Stimuli were separated into 13 equally spaced bins of 30 stimuli each based on Harris corner count (range: 1–14) or SC (range: 0–1950 Hz). Stimuli were generated such that SC and corner count were not strongly correlated with other features that could contribute to emotion judgement (figure 7). This enabled accurate estimation of effect sizes for each feature.
Figure 7.
Correlation matrices for features of procedurally generated (a) shape and (b) sound stimuli. Corner count and SC were not strongly correlated with other features, enabling accurate estimation of effect sizes for each feature. (Online version in colour.)
Participants in the positive valence condition (n = 20) judged whether stimuli were excited or peaceful, and a separate group of participants in the negative valence condition (n = 20) judged whether stimuli were angry or sad. A judgement trial consisted of attending to a randomly selected stimulus (presented on screen or in headphones) then clicking on the best fitting emotion label. Stimulus order was randomized, and the position of emotion label buttons was counterbalanced across participants. Participants performed 40 trials for each stimulus bin, totalling 520 trials. Four participants performed fewer trials (156, 156, 286 and 416 trials) due to a technical error, and 104 trials were excluded from analysis because participants indicated they could not hear the sound, giving 9862 total shape trials and 9768 total sound trials.
To test our hypothesis that expressions of emotional arousal are universally understood because they share observable, low-level features across sensory domains, judgements of emotional arousal were predicted using Bayesian hierarchical logistic regression. The contribution of SC to emotional arousal judgements in shapes and sounds was estimated by training a full model on all trials in both modalities. Predictors included SC/corner count bin, modality and valence. Additionally, to facilitate comparison of the predictors, separate models were trained for each single predictor. To assess the contribution of modality-specific features to emotion judgements, this process was repeated for each modality. For sounds and shapes, we constructed a full model including all modality-specific predictors, as well as additional models for each single predictor. For shapes, predictors included corner count bin, rectangular bounding box area and convexity (the ratio of shape area to bounding box area). For sounds, predictors included SC bin, duration, number of onsets and mean onset strength. The number of onsets is sensitive to peaks in amplitude, and onset strength to changes in spectral flux. Onset features were calculated using LibROSA's onset_detect and onset_strength functions [27].
All models used random slopes and intercepts per participant, as well as weakly informative priors that shrank parameter estimates towards zero (see electronic supplementary material). All scalar predictors were z-scored before model fitting. Model accuracy was determined using fivefold cross-validation, with folds stratified by participant ID to ensure each fold contained trials from all participants. ROC analyses were conducted using the same cross-validation training and test sets used to determine model accuracy. Chance thresholds were determined by the base rates of participant emotion judgements. Note that because these models capture inter-participant uncertainty, cross-validated accuracy and AUC are conservative estimates of goodness of fit.
(b). Results
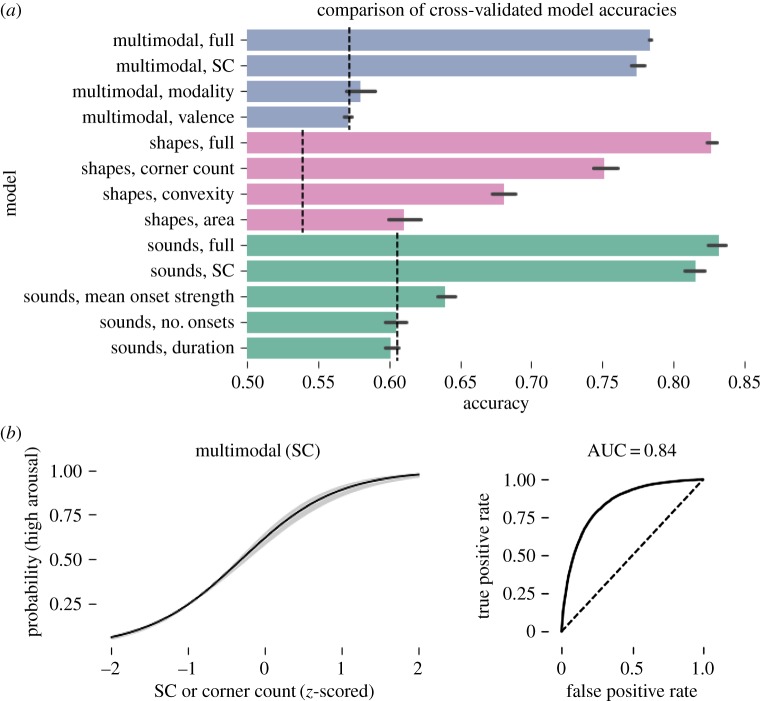
Results are summarized in figure 8. The full multimodal model predicted high-arousal emotion judgements of shapes and sounds with 78% accuracy (s.d. < 0.001, 86% AUC, n = 40). The multimodal SC/corner count bin-only model was comparably accurate (77% acc., s.d. = 0.006, 84% AUC, n = 40), and the modality and valence models did not exceed the chance threshold, providing strong evidence that SC drives judgements of emotional arousal across modalities. Estimates of interaction weights for SC bin with valence (M = 0.72, s.d. = 0.17) and modality (M = 0.69, s.d. = 0.15) were positive, indicating sounds were perceived as having slightly higher arousal than shapes, and that participants made more high-arousal judgements when the choice of emotions was positively valenced. Random effects terms indicated moderate variability in slopes and intercepts across participants, suggesting individual differences in the tendency to identify stimuli as having high emotional arousal (s.d. = 0.36), and in the effect of SC on emotional arousal judgements (s.d. = 0.42). See electronic supplementary material for tables summarizing all estimated model weights.
Figure 8.
Bayesian logistic regression classification of participant emotion judgements of procedurally generated shapes and sounds. (a) Comparison of model accuracies. Dashed lines indicate chance performance. ‘Full’ models included all predictors and interactions; others were limited to the single labelled predictor. All models included random slopes and intercepts per participant. (b) Fixed effect of SC in the multimodal, single-predictor model. Lines and shaded areas show the mean and 95% credible interval. See electronic supplementary material for all model fit plots. (Online version in colour.)
Modality-specific models revealed SC was the best single predictor of high-arousal emotion judgements for shapes (75% acc., s.d. = 0.011, 83% AUC, n = 20) and sounds (82% acc., s.d. = 0.008, 89% AUC, n = 20). For shapes, convexity (68% acc., s.d. = 0.01, 73% AUC, n = 20) and bounding box area (61% acc., s.d. = 0.01, 64% AUC, n = 20) also predicted high-arousal emotion better than chance. For sounds, the mean onset strength weakly predicted high-arousal emotion (63% acc., s.d. = 0.007, 69% AUC, n = 20), while single-predictor models using the number of onsets and duration did not perform better than chance. The inclusion of modality-specific predictors may explain the slightly higher accuracy of modality-specific models (shapes: 83% acc., s.d. = 0.004, 91% AUC, n = 20; sounds: 83% acc., s.d. = 0.008, 91% AUC, n = 20).
5. Study 4: spectral centroid analysis of naturalistic emotion movement and speech databases
(a). Methods
To test whether SC predicts emotional arousal judgements in naturalistic stimuli, we analysed the Berlin Database of Emotional Speech [28] and the PACO Body Movement Library [29]. The PBML consists of point-light movement recordings of male and female actors expressing several emotions. The BDES consists of audio recordings of male and female actors reading the same emotionally neutral German sentences while expressing several emotions. We hypothesized that SC would predict the emotional arousal of stimuli in both databases. For the BDES, we used the mean SC of each emotional expression. For the PBML, a collection of point-light movements, we used the mean SC for each joint axis, reducing each expression to 45 features. The BDES includes 127 angry and 62 sad expressions, while the PBML has 60 expressions per emotion.
(b). Results
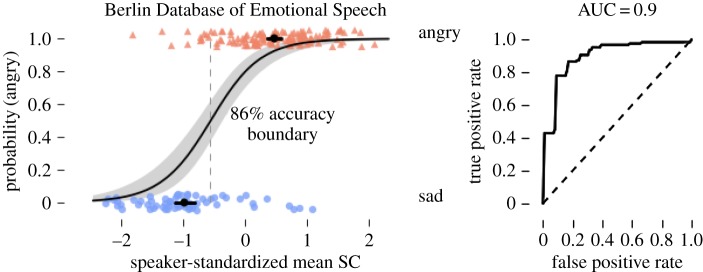
The mean SC was consistently higher in angry versus sad speech. This pattern was robust across genders and held for 8 of 10 speakers. To compensate for inter-speaker differences, SC was standardized per speaker. Using SC alone, Bayesian logistic regression classified angry and sad expressions with 86% accuracy and 90% AUC (figure 9).
Figure 9.
Bayesian logistic regression classification of angry and sad examples from the Berlin Database of Emotional Speech. (Online version in colour.)
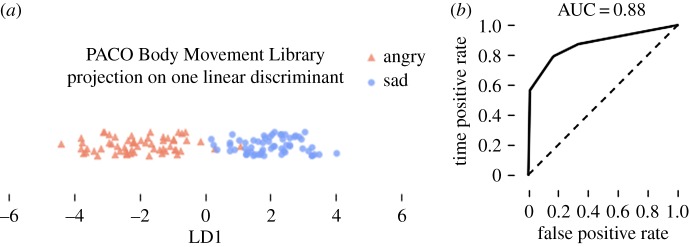
To assess whether the high dimensional structure of emotional movement data in the PBML could be reduced to a single arousal dimension, we performed a Bayesian linear discriminant analysis using stratified 10-fold cross-validation. The mean SCs of 45 movement dimensions (15 joints by 3 axes per joint) were projected on to a single linear discriminant, resulting in 88% classification accuracy and 88% AUC (figure 10). See electronic supplementary material for additional results.
Figure 10.
(a) Projection of angry and sad movements from the PACO Body Movement Library onto a single linear discriminant using Bayes rule. (b) ROC analysis of LDA-based classification. (Online version in colour.)
6. Study 5: continuous arousal across emotions
The previous studies tested the emotions angry, sad, excited and peaceful, but did not directly test the hypothesis that the SC predicts continuously varying arousal levels across a wide range of emotion categories. To test this, we used the full BDES and PACO stimulus databases introduced in study 4, including 775 unique stimuli drawn from all emotion categories (BDES: anger, boredom, disgust, anxiety/fear, happiness, sadness, neutral; PACO: angry, happy, sad, neutral). Participants (n = 50) that were fluent in English and did not understand German completed 220 arousal judgement trials each, where they attended to a single randomly selected speech or movement stimulus and used slider bars to rate its valence and arousal on continuous scales from 0 to 100. Seven participants completed fewer than 220 trials, giving a final total of 10 934 trials.
Results were analysed using Bayesian hierarchical linear regression, with valence, arousal, sensory modality (sound versus vision) and all interactions as predictors, and with SC as the dependent variable. Note that predicting the continuous SC is more challenging than predicting discrete emotion category labels. All models used random slopes and intercepts per participant and all values were z-scored before model fitting. All parameters, including the coefficient of determination (R2), were fitted using fivefold cross-validation, with folds stratified by participant ID.
(a). Results
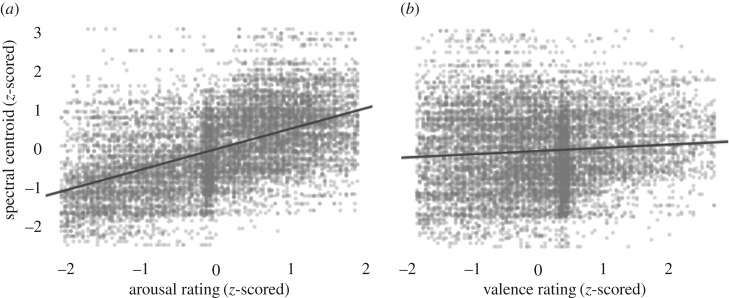
The model was able to perform the challenging task of predicting the SC of a stimulus from its valence and arousal ratings (R2 = 0.3), across emotion categories and modalities. Stimuli rated higher in arousal had higher SCs (β = 0.76, 95% CI: 0.71–0.81), while stimuli rated as having more positive valence had slightly lower SCs (β = −0.09, 95% CI: −0.13 to −0.05). These main effects were qualified by arousal–modality (β = −0.22, 95% CI: −0.26 to −0.18) and valence-modality (β = −0.06, 95% CI: −0.11 to −0.02) interactions, indicating that arousal and valence judgements both had slightly stronger effects on the predicted SCs of movements than speech. We also observed a valence–arousal interaction (β = −0.1, 95% CI: −0.13 to 0.07), indicating stimuli that were both highly arousing and positively valenced had slightly lower SCs and a valence–arousal–modality interaction (β = 0.15, 95% CI: 0.11–0.18) indicating that this effect was slightly weaker for speech than for movement. The relationships between valence, arousal and SC are illustrated in figure 11.
Figure 11.
Visualizations of the relationship between arousal, valence and the SC. See above for complete hierarchical Bayesian linear regression results. (a) Stimuli rated as having higher arousal also have higher SCs. (b) The relationship between valence and SC is relatively weak.
7. Discussion
Across a series of empirical studies and analyses of extant databases, the SC predicted emotional arousal in abstract shapes and sounds, body movements and human speech. Study 1 showed that participants map the SCs of shapes and sounds (similar to those used in Köhler's classic demonstration of the Bouba-Kiki effect) to the arousal level of emotions. Study 2 asked many participants to draw shapes expressing high or low emotional arousal. With no additional instruction, participants matched the SCs of their drawings to the level of emotional arousal, showing that SC matching is a consistent feature of emotion expression. Study 3 additionally tested the generalizability of this matching principle to 390 different shapes and sounds, showing that the SC (over and above other stimulus features) predicted emotional arousal judgements. Study 4 further generalized this finding to previously existing databases of body movements and emotional speech. Finally, study 5 demonstrated that the SC predicts continuous emotional arousal judgements across a wide range of emotion categories, showing that the predictive power of the SC does not depend on forced-choice experimental paradigms or discrete emotion labels. Taken together, these studies provide strong evidence that expressions of emotional arousal are universally understood because they are signalled using a multi-sensory code, where signal senders and receivers both encode and decode variation in emotional arousal using variation in the central tendency of the frequency spectrum.
Across all of these studies, we estimated the central tendency of the frequency spectrum using SC and Harris corner detection. We do not suggest that SC and Harris corner detection are the only tools appropriate for this task, nor that matching in the frequency domain is the sole cause of emotional arousal judgements. Study 3 identified several other features that predict arousal (e.g. convexity in shapes, mean onset strength in sounds), although none were as accurate as the SC. Additionally, other measures that closely track the central tendency of the frequency spectrum (e.g. local entropy, pitch) should also predict emotional arousal.
We limited our studies to perceptual modalities where the frequency spectrum is observable, and predict similar results to obtain whenever this is the case (e.g. in touch and vibration). However, our results do not speak to cross-modal mappings when the frequency spectrum cannot be observed. This is the case for taste and smell, which are sensitive to variation in molecular shape. In such cases, we predict cross-modal correspondences depend on statistical learning or deliberative processes. A difference in the underlying mechanism may create measurably different behaviour, and may explain why some cross-modal correspondences involving taste vary across cultures [30,31].
The findings reported here are consistent with the ‘common code for magnitude’ theory of Spector & Maurer [32], where ‘more’ in one modality corresponds with ‘more’ in other modalities. Following this theory, it is possible that people use a single supramodal SC representation to assess whether there is more emotional arousal. Alternatively, it is possible that perception of emotional arousal depends on higher-level abilities such as language use and reasoning [33]. Although these two accounts are not mutually exclusive, developmental studies show that perception of relevant cross-modal correspondences occurs before language and reasoning competence: pre-linguistic infants show the Bouba-Kiki effect [34] and associate auditory pitch with visual height and sharpness [35]. Further, words learned early in language acquisition are more iconic than those learned later [36,37], suggesting that cross-modal correspondences come prior to, and are important for the development of, language competence. Although these findings support a ‘common code’ or supramodal representation account, additional research is required to characterize the specific internal representations employed and to chart the course of their development. In particular, it would be valuable to assess to what extent the internal representations used are innate ‘core knowledge’ endowed by evolution [38], and to what extent they develop over the lifetime due to the operation of modality-general statistical learning and predictive coding mechanisms [39,40].
A supramodal SC representation may arise from natural selection. To wit, one function of emotional states is facilitating or constraining action [41]. For example, high emotional arousal facilitates big, spiky vocalizations and movements that necessarily have high SCs. These cross-modal gestures function as cross-modal emotion signals. Organisms that can send and receive these signals have obvious fitness advantages: senders share their emotional states, so receivers know when to approach or avoid them, making both senders and receivers more likely to receive care and avoid harm. All else being equal, organisms with more efficient systems for detecting and representing emotion signals should have better reproductive fitness than those with less efficient systems. We should therefore expect a wide range of species to have an efficient means of detecting cross-modal signals of emotional arousal, and a supramodal SC representation is an excellent fit for this purpose. (Note that we should expect this even if there exist more accurate means of detecting emotion, such as language and reasoning, as long as those means tend to be less efficient.) Accordingly, preliminary evidence suggests the SC predicts emotional arousal across cultures [26] and across species [3,4]. By understanding how the brain extracts low-level, cross-modal features to determine meaning, we can build a deeper understanding of how communication can transcend immense geographical, cultural and genetic variation.
Supplementary Material
Acknowledgements
We thank Professor Robert Caldwell at Dartmouth for helping us clarify the relationship between the Fourier transform and Harris corner detection, as well as Rebecca Drapkin, Evan Griffith, Erica Westenberg, Jasmine Xu and Emmanuel Kim for assistance collecting data.
Data accessibility
Data, code, stimuli and materials for all studies and analyses can be downloaded at https://github.com/beausievers/supramodal_arousal.
Authors' contributions
B.S. and T.W. contributed equally to study design. W.H., B.S. and C.L. wrote the software. B.S. and C.L. collected data. B.S. performed data analysis. B.S., T.W. and C.L. wrote the paper.
Competing interests
We declare we have no competing interests.
Funding
This research was supported in part by a McNulty Grant from the Nelson A. Rockefeller Center (T.W.) and a Neukom Institute for Computational Science Graduate Fellowship (B.S.).
References
- 1.Sauter DA, Eisner F, Ekman P, Scott SK. 2010. Cross-cultural recognition of basic emotions through nonverbal emotional vocalizations. Proc. Natl Acad. Sci. USA 107, 2408–2412. ( 10.1073/pnas.0908239106) [DOI] [PMC free article] [PubMed] [Google Scholar]
- 2.Russell JA, Lewicka M, Niit T. 1989. A cross-cultural study of a circumplex model of affect. J. Pers. Soc. Psychol. 57, 848–856. ( 10.1037/0022-3514.57.5.848) [DOI] [Google Scholar]
- 3.Filippi P, et al. 2017. Humans recognize emotional arousal in vocalizations across all classes of terrestrial vertebrates: evidence for acoustic universals. Proc. R. Soc. B 284, 1–9. ( 10.1098/rspb.2017.0990) [DOI] [PMC free article] [PubMed] [Google Scholar]
- 4.Faragó T, Andics A, Devecseri V, Kis A, Gácsi M, Miklósi Á. 2014. Humans rely on the same rules to assess emotional valence and intensity in conspecific and dog vocalizations. Biol. Lett. 10, 20130926 ( 10.1098/rsbl.2013.0926) [DOI] [PMC free article] [PubMed] [Google Scholar]
- 5.Holland M, Wertheimer M. 1964. Some physiognomic aspects of naming, or, maluma and takete revisited. Percept. Mot. Skills 19, 111–117. ( 10.2466/pms.1964.19.1.111) [DOI] [PubMed] [Google Scholar]
- 6.Sievers B, Polansky L, Casey M, Wheatley T. 2013. Music and movement share a dynamic structure that supports universal expressions of emotion. Proc. Natl Acad. Sci. USA 110, 70–75. ( 10.1073/pnas.1209023110) [DOI] [PMC free article] [PubMed] [Google Scholar]
- 7.Palmer SE, Schloss KB, Xu Z, Prado-León LR. 2013. Music-color associations are mediated by emotion. Proc. Natl Acad. Sci. USA 110, 8836–8841. ( 10.1073/pnas.1212562110) [DOI] [PMC free article] [PubMed] [Google Scholar]
- 8.Lim A, Okuno HG. 2012. Using speech data to recognize emotion in human gait. In Human behavior understanding (eds Salah A, Ruiz-del-Solar J, Meriçli Ç, Oudeyer P-Y), pp. 52–64. Berlin, Germany: Springer. [Google Scholar]
- 9.Lundholm H. 1921. The affective tone of lines: experimental researches. Psychol. Rev. 28, 43–60. ( 10.1037/h0072647) [DOI] [Google Scholar]
- 10.Poffenberger A, Barrows B. 1924. The feeling value of lines. J. Appl. Psychol. 8, 187–205. ( 10.1037/h0073513) [DOI] [Google Scholar]
- 11.Banse R, Scherer KR. 1996. Acoustic profiles in vocal emotion expression. J. Pers. Soc. Psychol. 70, 614–636. ( 10.1037/0022-3514.70.3.614) [DOI] [PubMed] [Google Scholar]
- 12.Sauter DA, Eisner F, Calder AJ, Scott SK. 2010. Perceptual cues in nonverbal vocal expressions of emotion. Q. J. Exp. Psychol. 63, 2251–2272. ( 10.1080/17470211003721642) [DOI] [PMC free article] [PubMed] [Google Scholar]
- 13.Gingras B, Marin MM, Fitch WT. 2014. Beyond intensity: spectral features effectively predict music-induced subjective arousal. Q. J. Exp. Psychol. 67, 1428–1446. ( 10.1080/17470218.2013.863954) [DOI] [PubMed] [Google Scholar]
- 14.Pongrácz P, Molnár C, Miklósi Á, Csányi V. 2005. Human listeners are able to classify dog (Canis familiaris) barks recorded in different situations. J. Comp. Psychol. 119, 136–144. ( 10.1037/0735-7036.119.2.136) [DOI] [PubMed] [Google Scholar]
- 15.Pongrácz P, Molnár C, Miklósi Á. 2006. Acoustic parameters of dog barks carry emotional information for humans. Appl. Anim. Behav. Sci. 100, 228–240. ( 10.1016/j.applanim.2005.12.004) [DOI] [Google Scholar]
- 16.Seyfarth RM, Cheney DL. 2017. The origin of meaning in animal signals. Anim. Behav. 124, 339–346. ( 10.1016/j.anbehav.2016.05.020) [DOI] [Google Scholar]
- 17.Marler P. 1961. The logical analysis of animal communication. J. Theor. Biol. 1, 295–317. ( 10.1016/0022-5193(61)90032-7) [DOI] [PubMed] [Google Scholar]
- 18.Otte D. 1974. Effects and functions in the evolution of signaling systems. Annu. Rev. Ecol. Syst. 5, 385–417. ( 10.1146/annurev.es.05.110174.002125) [DOI] [Google Scholar]
- 19.Owren MJ, Rendall D, Ryan MJ. 2010. Redefining animal signaling: influence versus information in communication. Biol. Philos. 25, 755–780. ( 10.1007/s10539-010-9224-4) [DOI] [Google Scholar]
- 20.Köhler W. 1929. Gestalt psychology. Oxford, UK: Liveright. [Google Scholar]
- 21.Ramachandran S, Hubbard EM. 2003. Hearing colors, tasting shapes. Sci. Am. 288, 43–49. ( 10.1038/scientificamerican0503-52) [DOI] [PubMed] [Google Scholar]
- 22.Schubert E, Wolfe J. 2006. Does timbral brightness scale with frequency and spectral centroid? Acta Acust. Acust. 92, 820–825. [Google Scholar]
- 23.Zahn CT, Roskies RZ. 1972. Fourier descriptors for plane closed curves. IEEE Trans. Comput. C-21, 269–281. ( 10.1109/TC.1972.5008949) [DOI] [Google Scholar]
- 24.Harris C, Stephens M. 1988. A combined corner and edge detector. In Proc. Alvey Vision Conf., pp. 147–151. See http://www.bmva.org/bmvc/1988/avc-88-023.html. [Google Scholar]
- 25.Russell JA. 1980. A circumplex model of affect. J. Pers. Soc. Psychol. 39, 1161–1178. ( 10.1037/h0077714) [DOI] [Google Scholar]
- 26.Sievers B, Parkinson C, Walker T, Haslett W, Wheatley T. 2017. Low-level percepts predict emotion concepts across modalities and cultures. See https://psyarxiv.com/myg3b/. [Google Scholar]
- 27.McFee B, Raffel C, Liang D, Ellis DPW, McVicar M, Battenberg E, Nieto O. 2015. librosa: audio and music signal analysis in python. In Proc. 14th Python Sci Conf. (SCIPY 2015), Austin, TX, July, pp. 18–25. Scipy. [Google Scholar]
- 28.Burkhardt F, Paeschke A, Rolfes M, Sendlmeier W, Weiss B. 2005. A database of German emotional speech. In Ninth European Conf. Speech Communication Technology, pp. 3–6. See http://citeseerx.ist.psu.edu/viewdoc/download?doi=10.1.1.130.8506&rep=rep1&type=pdf. [Google Scholar]
- 29.Ma Y, Paterson HM, Pollick FE. 2006. A motion capture library for the study of identity, gender, and emotion perception from biological motion. Behav. Res. Methods 38, 134–141. ( 10.3758/BF03192758) [DOI] [PubMed] [Google Scholar]
- 30.Bremner AJ, Caparos S, Davidoff J, de Fockert J, Linnell KJ, Spence C. 2013. ‘Bouba’ and ‘Kiki’ in Namibia? A remote culture make similar shape-sound matches, but different shape-taste matches to Westerners. Cognition 126, 165–172. ( 10.1016/j.cognition.2012.09.007) [DOI] [PubMed] [Google Scholar]
- 31.Knoeferle KM, Woods A, Käppler F, Spence C. 2015. That sounds sweet: using cross-modal correspondences to communicate gustatory attributes. Psychol. Mark. 32, 107–120. ( 10.1002/mar.20766) [DOI] [Google Scholar]
- 32.Spector F, Maurer D. 2009. Synesthesia: a new approach to understanding the development of perception. Dev. Psychol. 45, 175–189. ( 10.1037/a0014171) [DOI] [PubMed] [Google Scholar]
- 33.Martino G, Marks LE. 1999. Perceptual and linguistic interactions in speeded classification: tests of the semantic coding hypothesis. Perception 28, 903–923. ( 10.1068/p2866) [DOI] [PubMed] [Google Scholar]
- 34.Ozturk O, Krehm M, Vouloumanos A. 2013. Sound symbolism in infancy: evidence for sound-shape cross-modal correspondences in 4-month-olds. J. Exp. Child Psychol. 114, 173–186. ( 10.1016/j.jecp.2012.05.004) [DOI] [PubMed] [Google Scholar]
- 35.Walker P, Bremner JG, Mason U, Spring J, Mattock K, Slater A, Johnson SP. 2010. Preverbal infants' sensitivity to synaesthetic cross-modality correspondences. Psychol. Sci. 21, 21–25. ( 10.1177/0956797609354734) [DOI] [PubMed] [Google Scholar]
- 36.Monaghan P, Shillcock RC, Christiansen MH, Kirby S. 2014. How arbitrary is language? Phil. Trans. R. Soc. B 369, 20130299 ( 10.1098/rstb.2013.0299) [DOI] [PMC free article] [PubMed] [Google Scholar]
- 37.Perry LK, Perlman M, Winter B, Massaro DW, Lupyan G. 2018. Iconicity in the speech of children and adults. Dev. Sci. 21, 1–8. ( 10.1111/desc.12572) [DOI] [PubMed] [Google Scholar]
- 38.Spelke ES, Kinzler KD. 2007. Core knowledge. Dev. Sci. 10, 89–96. ( 10.1111/j.1467-7687.2007.00569.x) [DOI] [PubMed] [Google Scholar]
- 39.Saffran JR, Kirkham NZ. 2018. Infant statistical learning. Annu. Rev. Psychol. 69, 181–203. ( 10.1146/annurev-psych-122216-011805) [DOI] [PMC free article] [PubMed] [Google Scholar]
- 40.Lupyan G, Clark A. 2015. Words and the world: predictive coding and the language–perception–cognition interface. Curr. Dir. Psychol. Sci. 4, 279–284. ( 10.1177/0963721415570732) [DOI] [Google Scholar]
- 41.Damasio A, Carvalho GB. 2013. The nature of feelings: evolutionary and neurobiological origins. Nat. Rev. Neurosci. 14, 143–152. ( 10.1038/nrn3403) [DOI] [PubMed] [Google Scholar]
Associated Data
This section collects any data citations, data availability statements, or supplementary materials included in this article.
Supplementary Materials
Data Availability Statement
Data, code, stimuli and materials for all studies and analyses can be downloaded at https://github.com/beausievers/supramodal_arousal.


