

Abstract
A barrier to practical use of electrotactile stimulation for haptic feedback has been large variability in perceived sensation intensity due to changes in the impedance of the electrode-skin interface, such as when electrodes peel or users sweat. Here, we show how to significantly reduce this variability by modulating stimulation parameters in response to measurements of impedance. Our method derives from three contributions. First, we created a model between stimulation parameters and impedance at constant perceived sensation intensity by looking at the peak pulse energy and phase charge. Our model fits experimental data better than previous models (mean R2 > 0.9) and holds over a larger set of conditions (subjects, sessions, magnitudes of sensation, stimulation locations, electrode sizes). Second, we implemented a controller that regulates perceived sensation intensity by using our model to derive a new current amplitude and pulse duration in response to changes in impedance. Our controller accurately predicts subject-chosen stimulation parameters at constant sensation intensity (mean R2 > 0.9). Third, we demonstrated as a proof-of-concept on two subjects with below-elbow amputations—using a prosthesis with electrotactile touch feedback—that our controller can regulate sensation intensity in response to large impedance changes that occur in activities of daily living. These results make electrotactile stimulation for human-machine interfaces more reliable during activities of daily living.
Introduction
Haptic feedback is a critical part of many human-machine interfaces. One way to provide haptic feedback is through electrotactile stimulation, which involves the application of electrical current over the skin to stimulate sensory nerves. Compared to mechanotactile stimulation, such as from vibration motors or actuated pins, electrotactile stimulation has advantages in that it has low latency, it is energy efficient, and it can be delivered in a small, unobtrusive form factor [1, 2].
By varying the waveform, frequency, location, or electrodes, various sensations can be elicited including vibration, touch, tingling, itching, pinching, pressure, and pain, among others [1]. Because these sensations can be elicited with very small amounts of current (1–10mA) for very short amounts of time (200–1000 μs), sensory neurons located more superficially can be stimulated without activating deeper motor neurons that would cause muscle contractions. Furthermore, while invasive methods of providing sensation to users have been successful [3, 4], the non-invasiveness of electrotactile stimulation makes it easily applicable and useful in a greater number of applications, such as conveying texture in a multi-touch display [5], touch information in a virtual reality setting [6], suture tension to a physician teleoperating a surgical robot [7], or touch and proprioception information to people with amputations who wear prostheses [8].
A barrier to practical use of electrotactile stimulation is the large variability in perceived sensation intensity that derives from changes in the impedance of the electrode-skin interface. The changes in impedance may be caused by mechanical disturbances, such as varying contact between the electrode and the skin, or by physiological disturbances, such as sweating at the electrode sites [1]. Researchers typically estimate impedance by measuring the voltage across stimulation electrodes and computing a resistance by dividing by the applied current, detailed in Note S1 [1, 9–11]. Like the impedance, the resistance also changes in response to external disturbances such as peeling back electrodes [10, 11]. For example, Fig. 1 shows current passing through the skin across various mechanoreceptors and nerve endings to produce sensation. As the electrode peels, the current becomes concentrated in a smaller area on the surface of the skin due to poor contact, and can result in a shock.
Fig. 1. Variability in sensation intensity due to changes in impedance during electrotactile stimulation.
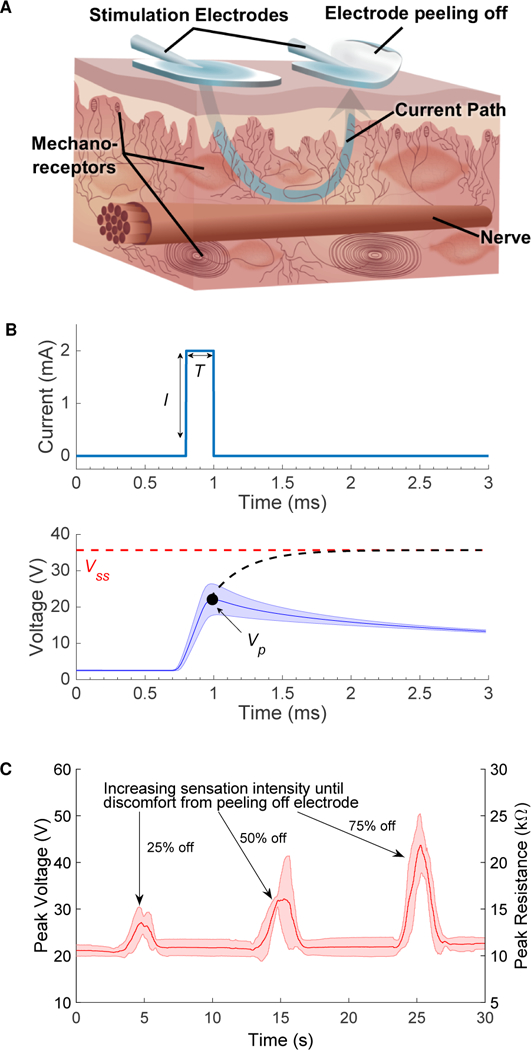
(A) Current flows across the mechanoreceptors in the skin to produce sensation. When the electrode is peeled back, current density increases resulting in a stronger sensation. (B) Current stimulation waveform (top), with I = 2 mA, T = 200 μs at 20 Hz, delivered across the skin and the resulting measured voltage waveform (bottom). The mean and standard deviation for an individual pulse are shown as the subject peeled back and reapplied an electrode. The recorded voltage, Vp, is the peak of the voltage waveform and is used as a measure of the steady state voltage, Vss (Note S1). (C) Changes in the peak resistance of the electrode-skin interface due to peeling back and reapplying the electrode. As more of the electrode is peeled back, the sensation gets stronger leading to discomfort. The mean and standard deviation over five trials are shown.
Efforts have been made to reduce variability in perceived sensation by modulating stimulation parameters, specifically current amplitude (I) and pulse duration (T), in response to measurements of impedance [1, 10–12]. To work well, these approaches require knowing precisely the relationship between stimulation parameters, impedance, and perceived sensation. In finding this relationship, researchers typically use psychophysical methods to quantify perceived sensation, in particular the method of adjustment [10, 11]. Using the method of adjustment, researchers find stimulation parameters at varying impedance values that result in the same perceived sensation. Existing characterizations of this relationship are able to reduce variability in perceived sensation, but rely on poor models relating sensation intensity to stimulation parameters. For example, seminal work by Tachi et al. [10] equated a constant sensation intensity with a constant pulse energy. This work was based upon the assumption that impedance is independent of applied current, an assumption that is known to be false [1, 13]. More recent work by Kajimoto [11] discarded this assumption but relied on a relationship between pulse duration and impedance with a low R2 (0.359). We consider an R2 value greater than 0.7 to denote a strong correlation [14], suggesting that Kajimoto’s results may not have been consistent across different subjects, magnitudes of sensation, and locations of stimulation. Kantor et al. [15] observed that phase charge remains nearly constant for constant sensation intensity, but other studies—such as one by Baker and Bowman [16]—provide evidence that phase charge can vary even while perceived sensation intensity remains constant. In our previous work [17], we presented a preliminary model suggesting that at a constant sensation intensity both pulse energy and phase charge vary linearly with impedance. We observed these linear relationships for five subjects across two sessions and two magnitudes of sensation. We also investigated linear relationships for two subjects across three stimulation locations and two electrode sizes. While our average R2 values were greater than 0.9 across all conditions, a one-tailed Wilcoxon sign rank-test with Bonferroni-Holm correction indicated that the R2 values were not statistically significantly greater than 0.7 across each condition (Z < 1.89, p > 0.05) due to the low sample sizes.
In this paper, we present a method of reducing variability in perceived sensation intensity during electrotactile stimulation due to changes in impedance. In our first experiment (Exp. 1), we modeled the relationship between stimulation parameters and impedance at constant perceived sensation intensity across ten subjects. In our second experiment (Exp. 2), based on the model from Exp. 1, we implemented a controller that regulates perceived sensation intensity. We validated this controller in three subexperiments (Exps. 2A-2C), comparing controller-derived stimulation parameters to subject-derived values. In Exp. 2A, we used electroconductive gel to vary impedance, and the same ten subjects matched sensation intensity to electrotactile stimulation provided by separate reference electrodes. In Exp. 2B, we again used electroconductive gel to vary impedance, however, ten new subjects matched the sensation intensity to a vibrotactile reference. In Exp. 2C, the same ten subjects from Exp. 2B varied impedance by exercising and resting, and again matched the sensation intensity to a vibrotactile reference. In both Exps. 1 and 2, a one-tailed Wilcoxon sign rank-test with Bonferroni-Holm correction was used to determine statistical significance. In our final experiment (Exp. 3), we demonstrated as a proof-of-concept on two subjects with below-elbow amputations that our controller can regulate sensation intensity in response to large impedance changes that occur from poor electrode contact (Exp. 3A) and in activities of daily living (Exp. 3B). These results make electrotactile stimulation for nerve stimulation and haptic feedback more reliable in human-machine interfaces.
Results
Exp. 1: Ep and Q vary linearly with Rp at constant sensation intensity
To expand on our previous work [17] and further develop a model between stimulation parameters, impedance, and perceived sensation intensity, a total of ten subjects volunteered for Exp. 1 to test eight experimental conditions that included different sessions (A, B on separate days), magnitudes of sensation (weak, strong), stimulation locations (forearm, biceps, back), and electrode sizes (20 × 15 mm, 28 × 20 mm). In all conditions, constant current electrotactile stimulation was delivered to the subject. Using the method of adjustment as in Tachi, et al. [10], subjects adjusted the current amplitudes of pulses with different pulse durations to match a reference sensation intensity. The pulse duration (T), subject-chosen current amplitude (I), and peak voltage (Vp) were recorded for ten different values of T for each of the eight conditions. Our results from using this protocol to compare I to T are consistent with previous studies [1, 10, 18], as discussed further in Note S2 and Fig. S1.
All subjects across all conditions show linear trends for both peak pulse energy (Ep) vs. peak resistance (Rp) values and phase charge (Q) vs. peak resistance (Rp) values that produced the same perceived sensation intensity. Furthermore, the best fit lines for every condition tend to originate from a common point. Based on this trend, we determined values for the points of convergence for both Ep vs. Rp and Q vs. Rp. The data for one of the ten subjects across all conditions along with their respective linear regressions constrained to the points of convergence are shown in Figs. 2A–2H. Data from all ten subjects constrained to the points of convergence are shown in Fig. S2. The R2 values from the constrained linear regression are reported in Fig. 2I. Across the ten subjects × eight conditions (n = 80), the average value for Ep vs. Rp was 0.941 and for Q vs. Rp was 0.925, where an R2 value of 1 denotes a perfect fit to the data, indicating very strong linear trends for both Ep vs. Rp and Q vs. Rp. The R2 values for each of the eight conditions across all ten subjects are statistically significantly greater than 0.7 for both Ep vs. Rp (Z = 2.75, p < 0.01) and Q vs. Rp (Z > 2.14, p < 0.05), denoting a strong correlation. The R2 distributions for each condition are shown in Figs. 2J–2K. When comparing weak and strong magnitudes of sensation, we observed that strong sensations had higher linear slopes in every case.
Fig. 2. Results from Exp. 1 modeling the relationship of peak resistance (Rp) to peak pulse energy (Ep) and phase charge (Q) at constant sensation intensity.
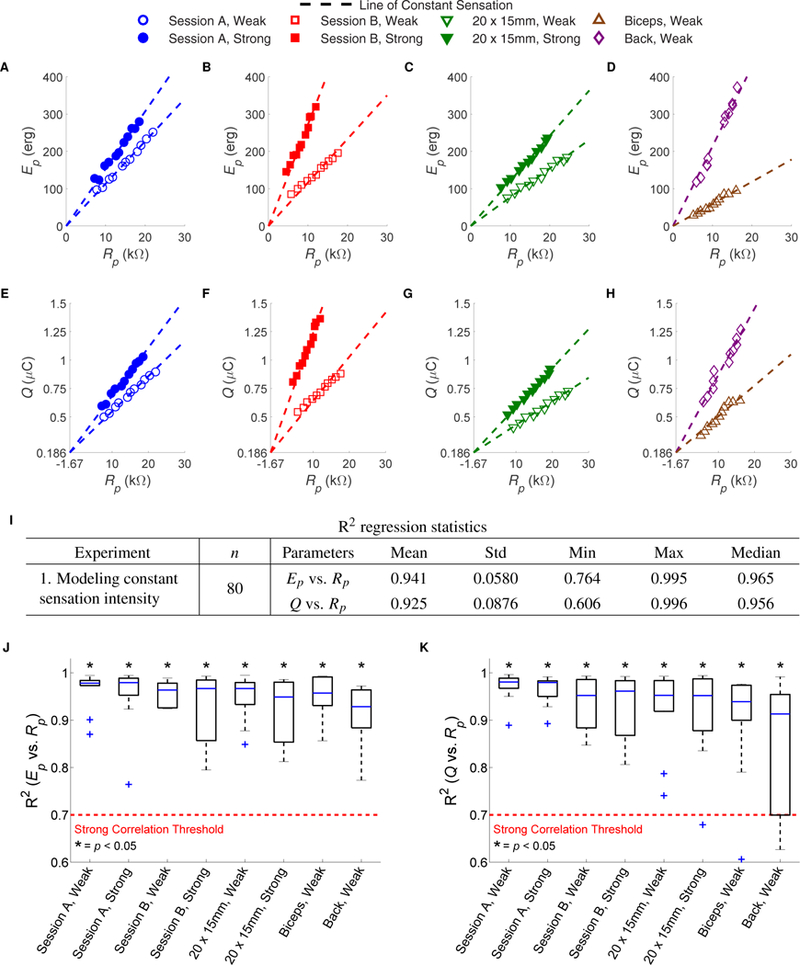
(A)-(D) Ep vs. Rp and (E)-(H) Q vs. Rp plots showing all trials from a single subject across sessions, magnitudes of sensation, stimulation locations, and electrode sizes. Each sensation felt at each of the 11 data points of the same condition was equivalent in subjective intensity. Best fit lines were constrained to go through the origin in (A)-(D), while all the lines in (E)-(H) were constrained to go through an optimal point of convergence (−1.67 kΩ, 0.186μC). Each best fit line represents a line of constant sensation intensity. (I) R2 regression statistics constrained to the origin for Ep vs. Rp and the point of convergence for Q vs. Rp across 10 subjects and 8 conditions (n = 80). The 8 conditions, described in the figure key, cover 2 sessions, 2 magnitudes of sensation, 3 stimulation locations, and 2 electrode sizes. The R2 distributions for each of the 8 conditions are shown in (J) for Ep vs. Rp and (K) for Q vs. Rp. A sign-rank test indicated that the R2 values are statistically significantly greater than 0.7 (p < 0.05), denoting a strong correlation across all conditions.
According to Eq. 7, since Ep = RpI2T, it holds that when Rp = 0kΩ, Ep = 0 erg. Consequently, this dictates that all linear trends between the two variables should go through the origin. Furthermore, the slopes of these lines equal I2T, meaning that at constant sensation the value of I2T is constant. A similar result was found by Tachi et al. [10], but an erroneous assumption led them to a different conclusion, as described in Note S3. Because the value of Q is not defined by Rp according to Eq. 6, we solved for the optimal point of convergence over all conditions. Using constrained linear regression and a grid search, the optimal point of convergence was found to be Rp = −1.67 kΩ, Q = 0.186 μC, as described in Note S4.
The model can be used to implement a controller
Using the linear relationships between Ep vs. Rp and Q vs. Rp, we can compute stimulation parameters I and T in response to changes in Rp. Fig. 3 shows a block diagram of this process. Suppose a subject is initially stimulated with a monophasic square pulse at some initial values of I0 and T0. Given these values of I0 and T0, we can measure Rp0 after the initial pulse and compute the slopes of the lines of constant sensation intensity using the following two equations,
| (1) |
where mE is the slope of the constant sensation line from Ep vs. Rp and is independent of Rp0, and
| (2) |
where mQ is the slope of the constant sensation line for Q vs. Rp and (x*, y*) is the point of convergence of all the lines of constant sensation for Q vs. Rp.
Fig. 3. Block diagram for our controller that modulates stimulation parameters to keep perceived sensation intensity constant.
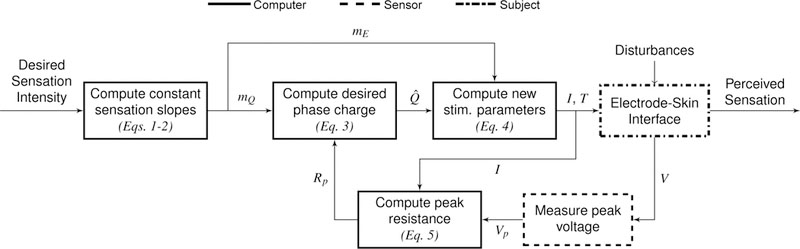
First, a desired sensation intensity is chosen, and the slopes of the lines of constant sensation intensity, mE and mQ, are calculated by a computer using the linear relationships determined by the modeling experiment. The value of mQ is used to compute Q̂, the desired value of Q from the line of constant sensation intensity relating Q to Rp, and is determined by the value of Rp at the previous timestep. Using mE and Q̂, the current (I) and pulse duration (T) used for stimulation are computed, and the appropriate waveform is delivered to the subject. The time-varying voltage (V) is measured across the electrodes by the sensor, whose peak value (Vp) is divided by I to obtain the peak resistance (Rp) used in the next iteration.
Now that we know the slopes of the lines of constant sensation intensity we want to remain on, suppose Rp changes in response to a mechanical disturbance, such as an electrode peeling off. We can solve for the next values of I and T using the equations
| (3) |
where is the desired Q determined from the Q vs. Rp line of constant sensation intensity. Rearranging these equations, we obtain
| (4) |
These values of I and T produce values of Ep and Q that are on the original lines of constant sensation intensity for the measured value of Rp, and we would send these stimulation parameters to the subject. Consequently, holding mE (Eq. 1) and mQ (Eq. 2) constant would result in a constant perceived sensation intensity.
The linear relationship we have found for Q vs. Rp is critical to computing stimulation parameters for constant sensation intensity in response to impedance changes, though it has not been considered in previous studies. As previously mentioned, the value of I2T should be constant in order to maintain a constant sensation intensity. However, simply holding this value constant is not sufficient because it does not account for changes in impedance. Recall the example in Fig. 1C. In this example, I and T were held fixed, thus making I2T constant. Nevertheless, changes in sensation intensity—corresponding to the changes in Rp shown—were still felt despite I2T being constant. Consequently, an additional relationship between the stimulation parameters I and T and Rp is necessary. Since by definition Q = IT (Eq. 6), the linear relationship for Q vs. Rp satisfies this requirement.
Exp. 2A: The controller regulates sensation intensity when Rp varies
To validate the controller, ten subjects volunteered to test five experimental conditions including different magnitudes of sensation (weak, strong), stimulation locations (forearm, biceps, back), and electrode sizes (20 × 15 mm, 28 × 20 mm). Subjects wore a testing and reference pair of electrodes placed in the same location but on contralateral sides of the body. Electroconductive gel was applied to or removed from the testing pair of electrodes to change the impedance of the electrode-skin interface a total of three times for each condition. Upon changing the impedance, the controller would compute the new stimulation parameters I and T to keep sensation intensity constant. At the new Rp and controller-computed T, subjects adjusted I on the testing pair of electrodes in order to match the perceived sensation intensity from the reference pair of electrodes.
Data showing the results from the controller experiment for both Ep vs. Rp and Q vs. Rp from a single subject across all five experimental conditions are plotted in Figs. 4A–4B. The results from all ten subjects are shown in Figs. S3–S4. To evaluate the effectiveness of the controller, the R2 value was computed to determine how well the line of constant sensation intensity for a single condition fit the three subject-derived values for both Ep vs. Rp and Q vs. Rp. The R2 values from the linear regression are reported in Fig. 4E. Across the ten subjects × five conditions (n = 50), the average R2 for Ep vs. Rp was 0.941 and for Q vs. Rp was 0.917. As with the modeling results, these linear relationships held across ten different subjects, both magnitudes of sensation, both electrode sizes, and all three stimulation locations. The R2 values for each of the five conditions across all ten subjects are statistically significantly greater than 0.7 for both Ep vs. Rp (Z > 2.65, p < 0.05) and Q vs. Rp (Z = 2.75, p < 0.05). The R2 distributions for each condition are shown in Figs. 4F–4G. These large values of R2 strongly suggest that these lines computed by the controller represent constant sensation intensities, even when there are up to 40 kΩ changes in the measured Rp of the electrode-skin interface.
Fig. 4. Results from Exp. 2 validating the controller.
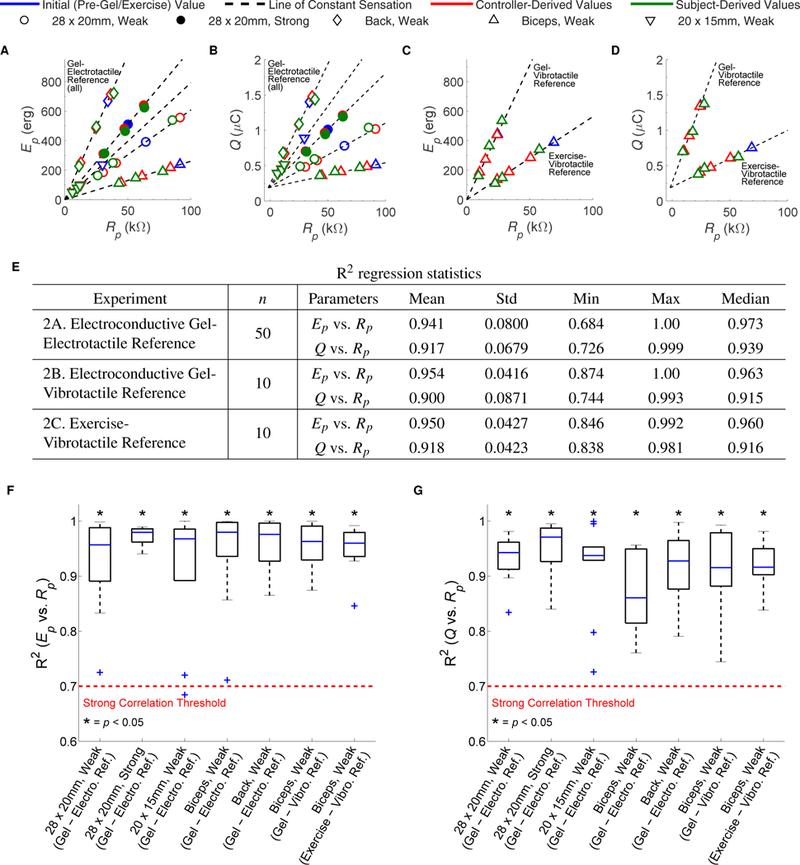
For every condition, subjects were asked to match a reference sensation intensity at three differing values of Rp. (A) Peak pulse energy (Ep) and (B) phase charge (Q) for a subject across 2 magnitudes of sensation, 3 stimulation locations, and 2 electrode sizes using electroconductive gel to change Rp and an electrotactile reference. (C) Ep and (D) Q for a subject with a below-elbow amputation (Subject TR1) at a weak magnitude of sensation over the right biceps using a vibrotactile reference and either electroconductive gel or exercise to change Rp. In (A)-(D), initial pre-gel/exercise values of Ep and Q vs. Rp (blue) are used to compute lines of constant sensation intensity (dashed lines). When Rp changes, the controller computes new stimulation parameters to stay on the lines of constant sensation intensity (red). At the controller-computed pulse duration, subjects adjusted the current amplitude to match a constant reference sensation intensity, and we derive Ep and Q (green). (E) R2 regression statistics from fitting the controller-computed lines of constant sensation intensity to the subject-derived values of Ep and Q across 10 subjects without arm impairment in Exp. 2A (10 subjects × 5 conditions, n = 50) as well as 9 subjects without arm impairment and Subject TR1 in Exps. 2B-2C (10 subjects × 1 condition, n = 10). The R2 distributions are shown in (F) for Ep vs. Rp and (G) for Q vs. Rp. A sign-rank test indicated that the R2 values are statistically significantly greater than 0.7 (p < 0.05).
Exps. 2B-2C: The controller regulates sensation intensity after exercise
To simulate changes in electrode-skin interface impedance during activities of daily living, we had nine new subjects without impairment and a subject with a right below-elbow amputation (Subject TR1: male, age 39) perform a similar experiment to Exp. 2A, replacing gel with sweat generated from exercise as the means to change the impedance. Subject TR1 was included to demonstrate the application of electrotactile stimulation in a prosthesis, described in Exp. 3. In Exps. 2B-2C, an electrotactile reference could not be used since exercise would change the impedance of the reference electrodes, thus changing the perceived electrotactile sensation intensity. Instead, a vibrotactile reference was used on the left biceps, under the assumption that changes in skin impedance have little to no effect on perceived vibrotactile stimulation intensity.
To verify that vibrotactile stimulation could be used as a reference to compare to electrotactile stimulation, we first repeated the electroconductive gel experiment, similar to Exp. 2A, for all ten subjects. However, users adjusted I to match a vibrotactile stimulation intensity instead for Exp. 2B. After completing Exp. 2B, the subjects were asked to repeat the experiment while still using a vibrotactile reference and replacing gel with exercise as the means to change the impedance for Exp. 2C. Subjects were asked to ascend and descend stairs for five minutes in order to reduce their measured Rp and then rest for ten minutes in order to increase their measured Rp.
Data showing the results from Exps. 2B-2C for Subject TR1 for both Ep vs. Rp and Q vs. Rp are in Figs. 4C–4D. The results from all ten subjects are shown in Figs. S5–S6 for Exp. 2B and in Figs. S7–S8 for Exp. 2C. As in Exp. 2A, the R2 value was computed to determine how well the line of constant sensation intensity for a single trial fit the three subject-derived values for both Ep vs. Rp and Q vs. Rp. The R2 values from the linear regression are reported in Fig. 4E. Across the ten subjects × one condition (n = 10), the average value for Ep vs. Rp was 0.954 and for Q vs. Rp was 0.900 for Exp. 2B, and 0.950 and 0.918, respectively, for Exp. 2C. In both experiments, the R2 values for all ten subjects are statistically significantly greater than 0.7 for both Ep vs. Rp (Z = 2.75, p < 0.01) and Q vs. Rp (Z = 2.75, p < 0.01). The R2 distributions for the two experiments are shown in Figs. 4F–4G. These results suggest that vibrotactile stimulation can perform well as a reference for this experiment, which we discuss further in Note S5. More importantly, the results provide evidence that the controller will maintain constant sensation intensity even after changes in impedance due to exercise.
Exp. 3A: The controller can be applied when electrodes peel back
When performing activities of daily living with electrotactile stimulation, it is possible for electrodes to peel back or diminish contact over time, causing changes in perceived sensation intensity. To test the effectiveness of our controller in this situation, we asked two subjects with right below-elbow amputations (Subject TR1: male, age 39; Subject TR2: female, age 49) to peel back and reapply one of the two electrodes during stimulation. The means and standard deviations of I, T, Rp, mE, and mQ over five trials with and without the controller in use are shown in Fig. 5. Real-time changes in these variables during peeling with and without the controller are shown in Movie S1.
Fig. 5. Experiment 3A real-time results from two subjects (TR1, TR2) with below-elbow amputations peeling and reapplying electrodes during stimulation.
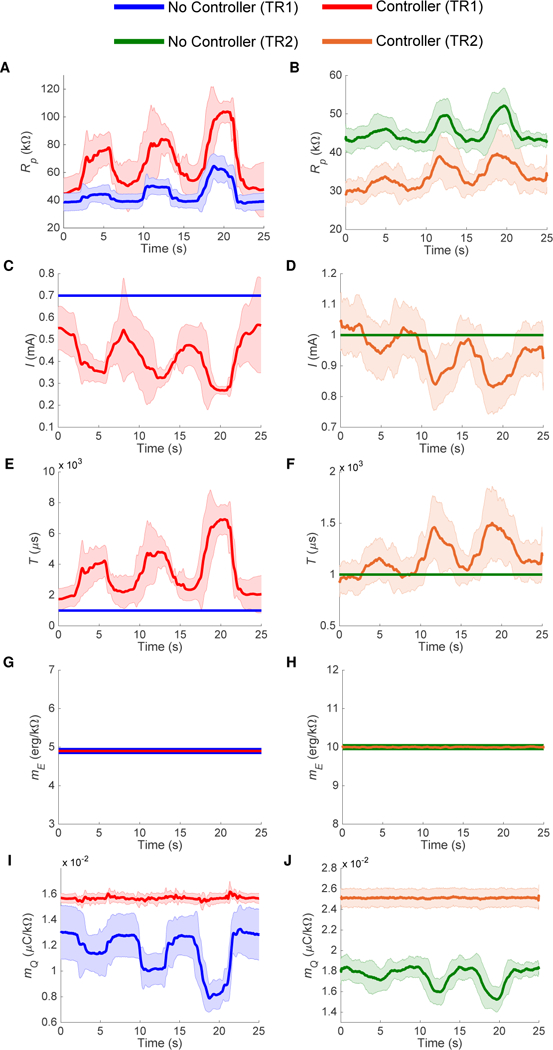
Upon stimulation with and without the controller, the subjects were asked to peel back and reapply the electrodes within ten seconds by 25%, 50%, and 75%, pausing for five seconds in between. (A)-(B) Rp increases as the electrodes were peeled back. (C)-(D) I and (E)-(F) T remain constant when the controller is not used, but are modulated in response to changes in Rp when the controller is used. In both cases, (G)-(H) mE remains constant because it does not depend on Rp. In (I)-(J) mQ varies greatly when the controller is not use. When the controller is in use, I and T are modulated to keep mQ constant. The subjects reported no change in sensation intensity when using the controller, but reported discomfort when peeling back the electrodes without the controller. The means and standard deviations for both subjects over five trials are shown.
Rp(Figs. 5A–5B) varied in response to the electrode being peeled back and reapplied. When the controller was not in use, I (Figs. 5C–5D) and T (Figs. 5E–5F) were held constant and resulted in a constant value of mE (Figs. 5G–5H), which is equal to I2T. However, because the controller was not in use, mQ (Figs. 5I–5J) varied, since it depends on Rp, which was changing throughout each trial. Like the example in Fig. 1C, the subjects reported increasing discomfort each time they peeled back the electrode by an increasing amount.
When the controller was in use, I and T were modulated in order to keep mE and mQ constant. Because changes in I result in changes in Rp, fluctuations in Rp can be larger than when the controller is not in use (Fig. 5A). Differences in Rp between the subjects could be due to varying skin conditions (e.g. hydration). Again, mE was always constant since its value does not depend on Rp. However, because mQ depends on Rp, there are small fluctuations in mQ that are modulated by the controller to hold it constant. By keeping mE and mQ constant, Ep and Q are driven to their lines of constant sensation intensity. The subjects reported no discomfort throughout all five trials. In fact, the subjects reported no changes in sensation intensity any time they peeled back the electrode by any amount. This is in sharp contrast to when the controller was not in use, where the subjects reported discomfort proportional to the amount the electrode was peeled back.
Exp. 3B: The controller can be applied to a below-elbow prosthesis
We asked Subjects TR1 and TR2 to wear a prosthesis that gave electrotactile feedback on fingertip contact [19]. While wearing the prosthesis, the subjects were asked to perform three activities of daily living for five minutes each: stair ascent and descent, hammering nails into wood, and exercising on an elliptical trainer.
Fig. 6 shows the measured Rp and the computed slopes of the lines of constant sensation intensity (mE and mQ) when the prosthesis came into contact with objects during stair ascent and descent (Fig. 6A–6C), hammering (Fig. 6E–6G), and using the elliptical trainer (Fig. 6I–6K). The figures show a decrease in peak resistance over the five minutes of activity measured without the controller running. In response to changes in Rp, the controller was able to maintain constant values for mE and mQ, while the value of mQ deviates greatly from its initial value when the controller is not in use.
Fig. 6. Experiment 3B real-time results from two subjects (TR1, TR2) with below-elbow amputations using a prosthesis with electrotactile touch feedback during three different activities of daily living.
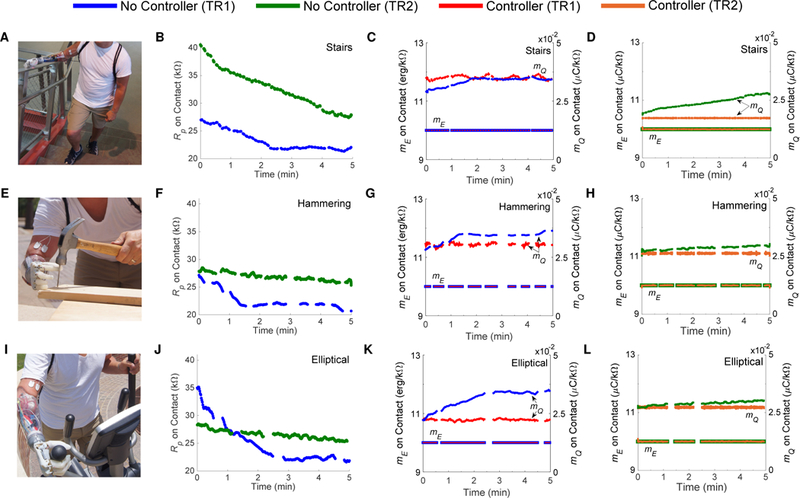
When the prosthesis came into contact with an object, subjects would receive electrotactile feedback from electrodes placed on the biceps of the residual limb. (A) The subjects ascended and descended stairs for five minutes. (B) Rp was recorded during contact when the controller was not in use. The decreases in Rp are consistent with the decreases that occurred when applying electroconductive gel. (C)-(D) When the controller was in use, stimulation parameters were modulated to keep mE and mQ constant; however, mQ varied when the controller was not in use. Similar results are shown for hammering a nail (E)-(H) and exercising on an elliptical trainer (I)-(L) for five minutes. Breaks in the plots correspond to times when the prosthesis was not in contact with an object. In each activity, the subjects reported a lack of sensation by the end of the activity when the controller was not in use, but reported the sensation to still be present when the controller was in use.
The purpose of the exercise and electrode peeling tests on subjects with below-elbow amputations was to evaluate the effectiveness of the controller in examples of situations that decrease impedance (exercise) and increase impedance (electrode peeling). Movie S2 shows the response of the controller in real-time during these examples. For each of the exercises (stairs, hammering, and elliptical), the measured Rp decreased consistently throughout the activity. The subjects reported a lack of sensation by the end of each exercise across the electrodes whose stimulation intensity was not modulated by the controller due to the decrease in Rp. However, they reported the sensation to still be present across the electrodes whose stimulation intensity was modulated by the controller.
Discussion
We presented a method of reducing variability in perceived sensation intensity during electrotactile stimulation due to changes in impedance. Our results make electrotactile stimulation more reliable for activities of daily living by reducing the risk of shocks or loss of sensation caused by changes in impedance.
Potential limitations of the controller
Changes in perceived sensation intensity could also be caused by nerve adaptation [20], for which our controller would not compensate since nerve adaptation is not reflected in measurements of impedance. However, by using short, intermittent stimulations on the order of seconds, adaptation can be delayed [21]. In fact, in practical implementations of stimulation feedback, it has been shown that providing short stimulations in response to discrete events is more effective than providing continuous feedback [22].
If changes in Rp are large enough, the controller may compute values for I or T that can drop below sensation threshold. For example, sensation might disappear when I < 0.5mA or when T < 100μs. At these values, I or T can be fixed at its sensation threshold bound and the other stimulation parameter can be solved for to keep mE = I2T constant, though the sensation may feel diminished.
Controller compensation
Because changes in I induce changes in Rp, the controller must run for multiple iterations (i.e. multiple stimulation pulses) until the values for Q and Rp are back on the line of constant sensation (Figs. S9A–S9B)—in other words, when the actual value of mQ approximates the original desired mQ computed using Eq. 2. Figure S9C shows an example of the change in mQ after gel is added and the subsequent nine iterations (180 ms) of the controller to drive the actual mQ towards the desired mQ until their difference was within a heuristically-chosen threshold of 2.5 × 10⁻⁵μC/kΩ. In preliminary tests, at this threshold, subjects did not perceive a difference in sensation intensity between the converged stimulation parameters and the reference. Furthermore, the example in Fig. S9 shows an extreme drop in Rp (> 20kΩ) due to electroconductive gel being applied, yet the controller still recovered within nine pulses. Smaller changes in Rp recover will more quickly.
Extensions and future work
The work presented in this paper can be extended in several ways. We used positive monophasic square pulses to study the relationship between stimulation parameters and sensation intensity. To control intensity for different qualities of sensation, the work would need to be extended to account for different waveforms, such as biphasic pulses [23]. We also used adhesive-based gel electrodes to provide electrotactile stimulation as these electrodes are commonly used in previous studies [24–26]. In practical applications, dry electrode arrays that make contact with the skin could be used [27]. Both the adhesive-based and dry electrodes would have issues with contact over time, causing changes in impedance for which our controller could compensate. State-of-the-art electrodes such as epidermally applied thin-film electrodes could help mitigate contact issues and provide more mechanically stable stimulation [28].
Another important opportunity for future work is to study the effectiveness of long-term electrotactile sensory substitution in improving sensorimotor control and embodiment of prostheses, as well as analyze long-term variations in impedance when performing activities of daily living. To enable this study, it would be necessary to develop an electrotactile stimulation system with an adjustable stimulation waveform and impedance monitoring that is also compact enough to fit in a prosthesis socket. Stimulators with these capabilities are under development by Kajimoto, et al. [27] and Cornman, et al. [29]. However, further work is required to make these stimulators small enough to integrate seamlessly inside a socket while achieving compliance voltages greater than 100 V. These same stimulators (when used with our controller) could be integrated with other human-machine interfaces that require haptic feedback—future studies would be needed to verify the effectiveness of electrotactile sensory substitution in these other applications.
Materials and Methods
Study Design
All experimental protocols and equipment were approved by the Institutional Review Board of the University of Illinois at Urbana-Champaign (#13920). Ten human subjects without arm impairment (five male, five female, ages 20–30) volunteered for Exp. 1 (the modeling experiment) and Exp. 2A (electroconductive gel experiment). Nine new human subjects without arm impairment (four male, five female, ages 18–29) and a human subject with a right proximal below-elbow amputation (Subject TR1: male, age 39) volunteered for Exps. 2B-2C (the vibrotactile reference experiments). Experiments 1–2 used the method of adjustment to evaluate equivalent perceived sensation intensities. Subject TR1 and an additional human subject with a right proximal below-elbow amputation (Subject TR2: female, age 49) volunteered for the proof-of-concept demonstrations in Exp. 3 (electrode peeling/placing and the activities of daily living).
Electrotactile stimulation
Monophasic positive square pulses were generated by an NI myDAQ (National Instruments, Austin, TX) data acquisition device for the modeling experiments, electroconductive gel experiments using an electrotactile reference, electroconductive gel experiments using a vibrotactile reference, and exercise experiments using a vibrotactile reference. A Teensy 3.2 microcontroller (PJRC, Sherwood, OR) generated square pulses for the electrode peeling/placing experiments and the activities of daily living experiments. The pulses were fed to a STMISOLA linear isolated stimulator (BIOPAC Systems, Goleta, CA) that provided a constant current stimulation to the subject. The voltage across the electrodes was also recorded by the NI myDAQ at 10kHz or the Teensy 3.2 microcontroller at 100 Hz. All data were collected and processed using the MATLAB Data Acquisition Toolbox (MathWorks, Natick, MA).
To observe the effect of changing resistance with electrode contact, we applied a constant current positive monophasic square pulse across the skin superficial to the left flexor carpi radialis in a 21 year-old male subject. The subject peeled back and reapplied an electrode within ten seconds by roughly 25%, 50%, and 75%, pausing for five seconds in between. We measured the peak voltage (Vp) across the electrodes of every pulse and show the average voltage response in Fig. 1B. We then obtained the peak resistance (Rp) by dividing Vp by the current amplitude, I. When the electrode was peeled back, the increase in current density was reflected by a sharp increase in Rp, and the subject experienced increased stimulation intensities to the point of discomfort as the electrode contact area decreased (Fig. 1C).
Equations for deriving peak resistance, peak pulse energy, and phase charge
In all experiments, we measured the peak voltage (Vp) across the electrodes after applying a monophasic square pulse with current amplitude I and pulse duration T. We then derived the peak resistance (Rp),
| (5) |
the phase charge (Q) for a monophasic square wave,
| (6) |
and the peak pulse energy (Ep) for a monophasic square wave,
| (7) |
Exp. 1: Modeling experiments
Subjects were asked to participate in two sessions held on different days with four conditions being tested, testing eight conditions total. In the first session (Session A), the four conditions tested were 1) weak and 2) strong stimulation using two large 28 × 20 mm electrodes (AMBU Neuroline 710, Ballerup, Denmark) placed over an area of hairless skin on the proximal left forearm over the flexor carpi radialis muscle, and 3) weak and 4) strong stimulation using two small 20 × 15 mm electrodes (AMBU Neuroline 700, Ballerup Denmark) in the same location. In the second session (Session B), the four conditions tested were again 5) weak and 6) strong stimulation using the larger electrodes on the forearm, and weak stimulation using the larger electrodes on 7) the skin lateral to the long head of the left biceps brachii muscle, and 8) the right lumbar paraspinal area of the back. In all conditions, the center-to-center distance between the electrodes was 3 cm.
In testing all conditions, the method of adjustment was used. Subjects adjusted current amplitudes (I) at different fixed pulse durations (T) to match a particular magnitude of sensation (Fig. S1A). T was varied between 200–700 μs in increments of 50 μs. Two magnitudes of sensation were used, weak and strong. The weak magnitude of sensation was chosen to be around the subject’s sensation threshold at 200 μs. The strong magnitude of sensation was chosen by increasing the current amplitude from the weak magnitude of sensation until it felt like a strong yet comfortable sensation. Pulses were delivered at a frequency of 50 Hz. For each condition, eleven data points were collected that had the same perceived magnitude of sensation, consisting of the value of I and the peak voltage (Vp) corresponding to each value of T. Vp was computed as the average of the peak voltages over ten pulses. From this, we derived values for peak resistance (Rp), peak pulse energy (Ep), and phase charge (Q).
Testing each condition started by defining an initial reference sensation. The initial reference sensation was found by adjusting the current of a waveform with T = 200 μs until the sensation intensity for a specified magnitude of sensation (weak or strong) was reached. To ensure that each sensation intensity felt the same across all values of T, each sensation felt above T > 200 μs was compared to the initial reference sensation at T = 200 μs. The reference sensation would be presented to the subject for two seconds, followed by a two second period of rest before presenting the new stimulation for two seconds at a higher value of T. The subject would then adjust the current amplitude until the sensation intensity felt the same as the reference sensation. The subjects were allowed to repeat the presentation of stimulations as many times as they needed.
Because a range of values of I may result in the same perceived sensation intensity as the reference sensation, subjects were asked to increase the current amplitude to the upper bound of this range. The final values of I and Vp were recorded. Finally, to validate that the sensation intensity at each value of T felt the same, a new reference was set at the stimulation amplitude determined at T = 700 μs, and all values of I and Vp at shorter values of T were compared again and adjusted to match the new reference sensation intensity.
Since skin properties (e.g. hydration) may vary daily, the first two conditions tested in Session A (weak and strong stimulation with larger electrodes on the forearm) were repeated in Session B to observe trends despite different skin conditions. The other four conditions that were tested investigated the effect of changing the size of the electrodes as well as the stimulation location on sensation intensity. To minimize the time needed for subject testing, these additional conditions were not repeated across sessions. For the smaller electrodes, stimulation took place on the forearm at weak and strong magnitudes of sensation. The forearm, biceps, and back locations were chosen since they are commonly used stimulation sites in haptic feedback studies [8, 10, 15, 30–33].
Exp. 2A: Electroconductive gel experiments using an electrotactile reference
Subjects were asked to participate in one session testing five conditions. The five conditions tested were 1) weak and 2) strong stimulation using two large 28 × 20 mm electrodes (AMBU Neuroline 710) placed over an area of hairless skin on the proximal left forearm over the flexor carpi radialis muscle, 3) weak stimulation using two small 20 × 15 mm electrodes (AMBU Neuroline 700) placed in the same location, and weak stimulation using the large electrodes on 4) the skin lateral to the long head of the left biceps brachii muscle, and 5) the right lumbar paraspinal area of the back. The hardware setup was the same as the modeling experiments.
For all conditions, two pairs of electrodes were used—a testing pair whose impedance was manipulated in order to test the controller, and a reference pair to provide a constant reference sensation intensity for comparison. For the testing electrodes, electroconductive gel (Electro-Gel, Electro-Cap International, Eaton, OH) was either applied or removed between the electrodes and the skin in order to change the impedance. The reference electrodes were placed in the same location of the body on the contralateral side (e.g. right forearm corresponding to the location of the testing electrodes on the left forearm). Using the method of adjustment, subjects were asked to adjust I on the testing electrodes to match the sensation intensity from the reference electrodes. Pulses were generated at a frequency of 50 Hz for each trial.
Testing each condition started by adjusting I at a pulse with T = 1000 μs sent across the reference electrodes until the sensation intensity reached one of two specified magnitudes of sensation, weak or strong. These two magnitudes of sensation were chosen in the same manner as in Exp. 1. Next, the value of I sent across the testing pair of electrodes (again with T = 1000 μs) was adjusted by the subject until the sensation intensity matched that of the reference electrodes. To ensure that each sensation intensity felt the same throughout each trial, a similar process to Exp. 1 was used.
The values of I, T, and Rp for the initial sensation intensity from the testing electrodes that matched the reference were used to compute Ep and Q, corresponding to Label 1 in Fig. S9. Using the linear relationships and convergence points from Exp. 1, we determined the slopes of the lines of constant sensation intensity for the controller to stay on (mE and mQ) in response to changes in Rp (Label 2 in Fig. S9). When gel was applied or removed, Rp changed and the controller computed new values of I and T that stay on the lines of constant sensation intensity using Eq. 4. I, T, and Rp are used to compute the converged values of Ep and Q (Label 3 in Fig. S9). Finally, to test how well the subject would match the controller-generated line of constant sensation intensity at the new value of Rp, we fixed T to the controller-computed value and asked the subject to adjust I until the sensation intensity from the testing electrodes matched that of the reference electrodes. We fixed T and adjusted I because, in general, when performing electrotactile stimulation, intensity changes are usually made by adjusting I [1, 10]. This was also how sensation intensity was adjusted in Exp. 1. The values of Ep and Q from the subject-chosen I and controller-computed T were derived, corresponding to Label 4 in Fig. S9A.
For each condition, this process was repeated three times. This resulted in seven data points per condition, each consisting of an Ep, Q, and Rp value for 1) an initial subject-chosen value of I at T = 1000 μs that matched the reference, 2–4) the controller-computed stimulation parameters after applying or removing gel three times, and 5–7) the subject-chosen values of I at the controller-computed values of T after applying or removing gel three times.
Exp. 2B: Electroconductive gel experiments using a vibrotactile reference
The same experiment as Exp. 2A was performed using a vibrotactile reference sensation instead. Two large 28 × 20mm electrodes (AMBU Neuroline 710) were placed over an area of hairless skin on the subject’s right biceps. Monophasic positive square pulses were sent across these electrodes at a frequency of 50 Hz. An electrotactile reference sensation could not be used because exercise would change the impedance of the reference electrodes as well as the testing electrodes. Instead, a vibrotactile motor (310–103, Precision Microdrives, London, UK) was used to provide a reference sensation intensity over the left biceps, under the assumption that changes in skin impedance have little to no effect on vibrotactile stimulation intensity.
Exp. 2C: Exercise experiments using a vibrotactile reference
Subjects performed a similar experiment to Exp. 2B, replacing gel with sweat generated from exercise as the means to change the impedance. The subjects were asked to ascend and descend a flight of stairs for five minutes in order to reduce the electrode-skin impedance. At this point, as in Exps. 2A and 2B, the user was asked to adjust the value of I at a controller-computed value of T to match the vibrotactile reference sensation intensity on the left biceps. The subject would then rest for ten minutes to wait for his impedance to recover to a higher value before again trying to match the reference sensation intensity. Finally, the subject was again asked to ascend and descend the flight of stairs for five minutes, after which we recorded the third subject-chosen sensation intensity.
Exp. 3A: Electrode peeling/placing experiments
Subjects TR1 and TR2 peeled back and reapplied one of the two electrotactile stimulation electrodes placed on their right biceps during stimulation in order to manipulate the impedance. Upon stimulation, after five seconds, the subjects were asked to peel back and reapply the electrodes within ten seconds by 25%, 50%, and 75%, pausing for five seconds in between. This was repeated for five trials using the controller and five trials without using the controller. The initial stimulation parameters for Subject TR1 were I = 0.7 mA and T = 1000 μs. For Subject TR2, the initial stimulation parameters were I = 1 mA and T = 1000 μs. The different initial values for I across the subjects were due to differences in stimulation intensity comfort levels. For both subjects, their respective initial stimulation parameters were the same across all ten trials. The values of I, T, Rp, mE, and mQ throughout each trial were recorded. Finally, the subjects were asked to report any changes in sensation throughout each trial.
Exp. 3B: Activities of daily living with a prosthesis
Subjects TR1 and TR2 felt a pulse with initial stimulation parameters of I = 1 mA and T = 1000 μs at 50 Hz when contacting an object with the index, middle, or thumb digits of the prosthesis. The electrotactile stimulation system was placed in a backpack that the subjects wore throughout the experiment.
The subjects ascended and descended stairs, hammered nails into wood, and exercised on an elliptical trainer for five minutes each. For stair ascent and descent, the subjects made contact with the handrail on every step in order to receive sensory feedback. When hammering nails into wood, the subjects hammered with their unimpaired left arm and received sensory feedback from the prosthesis when guiding the nail or holding the board in place. When using the elliptical trainer, the subjects kept the prosthesis gripping the handle for most of the activity. Two sets of electrodes were placed on the right biceps. The values of I, T, Rp, mE, and mQ throughout each trial were recorded from each pair of electrodes. The controller was not in use on the first pair of electrodes, while the controller was used on the second pair of electrodes. In order to test the constancy of the sensation intensity, only a single sensation intensity was tested.
Supplementary Material
Acknowledgments
General: The authors would like to thank Sam Goldfinger and Jesse Cornman for help in data collection, Kyung Yun Choi for assistance with the prosthesis and photographs, and Dan Simons for useful discussion.
Funding: This work was partially supported by NIH F30HD084201 to A.A. and NSF 0955088 and IIS-1320519 to T.B.
Footnotes
Competing interests: The authors declare no competing financial interests.
Data and materials availability: All data needed to evaluate the conclusions presented are in the paper. Data files may be requested from the authors.
References
- [1].Kaczmarek K, Webster J, Bach-y Rita P, and Tompkins WJ, “Electrotactile and vibrotactile displays for sensory substitution systems,” IEEE Trans. Biomed. Eng, vol. 38, no. 1, pp. 1–16, 1991. [DOI] [PubMed] [Google Scholar]
- [2].Kajimoto H, “Electro-tactile display: principle and hardware,” in Pervasive Haptics. Springer, 2016, pp. 79–96. [Google Scholar]
- [3].Raspopovic S, Capogrosso M, Petrini FM, Bonizzato M, Rigosa J, Di Pino G, Carpaneto J, Controzzi M, Boretius T, Fernandez E et al. , “Restoring natural sensory feedback in real-time bidirectional hand prostheses,” Sci, vol. 6, no. 222, pp. 222ra19–222ra19, 2014. [DOI] [PubMed] [Google Scholar]
- [4].Tan DW, Schiefer MA, Keith MW, Anderson JR, Tyler J, and Tyler DJ, “A neural interface provides long-term stable natural touch perception,” Sci. Transl. Med, vol. 6, no. 257, pp. 257ra138–257ra138, 2014. [DOI] [PMC free article] [PubMed] [Google Scholar]
- [5].Altinsoy M and Merchel S, “Electrotactile feedback for handheld devices with touch screen and simulation of roughness,” IEEE Trans. Haptics, vol. 5, no. 1, pp. 6–13, 2012. [DOI] [PubMed] [Google Scholar]
- [6].Pamungkas D and Ward K, “Electro-tactile feedback system to enhance virtual reality experience,” Int. J. Comp. Theory Eng, vol. 8, no. 6, p. 465, 2016. [Google Scholar]
- [7].Kitagawa M, Dokko D, Okamura AM, and Yuh DD, “Effect of sensory substitution on suture-manipulation forces for robotic surgical systems,” J. Thorac. Cardiovasc. Surg, vol. 129, no. 1, pp. 151–158, 2005. [DOI] [PubMed] [Google Scholar]
- [8].Witteveen H, Droog E, Rietman J, and Veltink P, “Vibro-and electrotactile user feedback on hand opening for myoelectric forearm prostheses,” IEEE Trans. Biomed. Eng, vol. 59, no. 8, pp. 2219–2226, 2012. [DOI] [PubMed] [Google Scholar]
- [9].Assambo C, Baba A, Dozio R, and Burke MJ, “Determination of the parameters of the skin-electrode impedance model for ECG measurement,” in Proceedings of the WSEAS International Conference on Electronics, Hardware, Wireless and Optical Communications, 2007, pp. 90–95. [Google Scholar]
- [10].Tachi S, Tanie K, Komoriya K, and Abe M, “Electrocutaneous communication in a guide dog robot (MELDOG),” IEEE Trans. Biomed. Eng, vol. 32, no. 7, pp. 461–469, 1985. [DOI] [PubMed] [Google Scholar]
- [11].Kajimoto H, “Electrotactile display with real-time impedance feedback using pulse width modulation,” IEEE Trans. Haptics, vol. 5, no. 2, pp. 184–188, 2012. [DOI] [PubMed] [Google Scholar]
- [12].Saunders FA, Electrocutaneous displays. Psychonomic Society, 1973, pp. 20–26. [Google Scholar]
- [13].Boxtel A, “Skin resistance during square-wave electrical pulses of 1 to 10 mA,” Med. Biol. Eng. Comput, vol. 15, no. 6, pp. 679–687, 1977. [DOI] [PubMed] [Google Scholar]
- [14].Kaliki R, Davoodi R, and Loeb G, “Prediction of distal arm posture in 3-D space from shoulder movements for control of upper limb prostheses,” Proc. IEEE, vol. 96, no. 7, pp. 1217–1225, July 2008. [Google Scholar]
- [15].Kantor G, Alon G, and Ho HS, “The effects of selected stimulus waveforms on pulse and phase characteristics at sensory and motor thresholds,” Phys. Ther, vol. 74, no. 10, pp. 951–962, 1994. [DOI] [PubMed] [Google Scholar]
- [16].Bowman BR and Baker LL, “Effects of waveform parameters on comfort during transcutaneous neuro-muscular electrical stimulation,” Ann. Biomed. Eng, vol. 13, no. 1, pp. 59–74, 1985. [DOI] [PubMed] [Google Scholar]
- [17].Akhtar A, Boyce B, and Bretl T, “The relationship between energy, phase charge, impedance, and perceived sensation in electrotactile stimulation,” in Proceedings of the IEEE Haptics Symposium (HAPTICS), Feb 2014, pp. 69–74. [Google Scholar]
- [18].Pfeiffer EA, “Electrical stimulation of sensory nerves with skin electrodes for research, diagnosis, communication and behavioral conditioning: A survey,” Med. Biol. Eng, vol. 6, no. 6, pp. 637–651, 1968. [DOI] [PubMed] [Google Scholar]
- [19].Akhtar A, Choi KY, Fatina M, Cornman J, Wu E, Sombeck J, Yim C, Slade P, Lee J, Moore J, Gonzales D, Wu A, Anderson G, Rotter D, Shin C, and Bretl T, “A low-cost, open-source, compliant hand for enabling sensorimotor control for people with transradial amputations,” in Proceedings fo the IEEE Engineering in Medicine and Biology Conference (EMBC), 2016. [DOI] [PMC free article] [PubMed] [Google Scholar]
- [20].Kaczmarek K, “Electrotactile adaptation on the abdomen: preliminary results,” IEEE Trans. Rehabil. Eng, vol. 8, no. 4, pp. 499–505, 2000. [DOI] [PubMed] [Google Scholar]
- [21].Buma DG, Buitenweg JR, and Veltink PH, “Intermittent stimulation delays adaptation to electrocutaneous sensory feedback,” IEEE Trans. Neural Syst. Rehabil. Eng, vol. 15, no. 3, pp. 435–441, September 2007. [DOI] [PubMed] [Google Scholar]
- [22].Cipriani C, Segil JL, Clemente F, Edin B et al. , “Humans can integrate feedback of discrete events in their sensorimotor control of a robotic hand,” Exp. Brain Res, vol. 232, no. 11, pp. 3421–3429, 2014. [DOI] [PMC free article] [PubMed] [Google Scholar]
- [23].Kaczmarek KA and Haase SJ, “Pattern identification and perceived stimulus quality as a function of stimulation waveform on a fingertip-scanned electrotactile display,” IEEE Trans. Neural Syst. Rehabil. Eng, vol. 11, no. 1,pp. 9–16, 2003. [DOI] [PubMed] [Google Scholar]
- [24].Geng B and Jensen W, “Human ability in identification of location and pulse number for electrocutaneous stimulation applied on the forearm,” J Neuroeng Rehabil, vol. 11, no. 1, p. 97, June 2014. [Online]. Available: 10.1186/1743-0003-11-97 [DOI] [PMC free article] [PubMed] [Google Scholar]
- [25].Hartmann C, Doen S, Amsuess S, and Farina D, “Closed-loop control of myoelectric prostheses with electrotactile feedback: Influence of stimulation artifact and blanking,” IEEE Trans. Neural Syst. Rehabil. Eng, vol. 23, no. 5, pp. 807–816, September 2015. [DOI] [PubMed] [Google Scholar]
- [26].Dosen S, Markovic M, Strbac M, Belic M, Kojic V, Bijelic G, Keller T, and Farina D, “Multichannel electrotactile feedback with spatial and mixed coding for closed-loop control of grasping force in hand prostheses,” IEEE Trans. Neural Syst. Rehabil. Eng, vol. 25, no. 3, pp. 183–195, March 2016. [DOI] [PubMed] [Google Scholar]
- [27].Kajimoto H, Suzuki M, and Kanno Y, “Hamsatouch: Tactile vision substitution with smartphone and electro-tactile display,” in CHI ‘14 Extended Abstracts on Human Factors in Computing Systems, ser. CHI EA ‘14 New York, NY, USA: ACM, 2014, pp. 1273–1278. [Online]. Available: http://doi.acm.org/10.1145/2559206.2581164 [Google Scholar]
- [28].Xu B, Akhtar A, Liu Y, Chen H, Yeo W-H, Park SI, Boyce B, Kim H, Yu J, Lai H-Y, Jung S, Zhou Y, Kim J, Cho S, Huang Y, Bretl T, and Rogers JA, “An epidermal stimulation and sensing platform for sensorimotor prosthetic control, management of lower back exertion, and electrical muscle activation,” Adv. Mater, 2015. [Online]. Available: 10.1002/adma.201504155 [DOI] [PMC free article] [PubMed] [Google Scholar]
- [29].Cornman J, Akhtar A, and Bretl T, “A portable, arbitrary waveform, multichannel constant current electrotactile stimulator,” in Proceedings of the IEEE/EMBS Conference on Neural Engineering (NER), May 2017, pp. 300–303. [DOI] [PMC free article] [PubMed] [Google Scholar]
- [30].Mann R and Reimers S, “Kinesthetic sensing for the EMG controlled “Boston Arm”,” IEEE Trans. ManMach. Syst, vol. 11, no. 1, pp. 110–115, 1970. [Google Scholar]
- [31].Wheeler J, Bark K, Savall J, and Cutkosky M, “Investigation of rotational skin stretch for proprioceptive feedback with application to myoelectric systems,” IEEE Trans. Neural Syst. Rehabil. Eng, vol. 18, no. 1, pp. 58–66, 2010. [DOI] [PubMed] [Google Scholar]
- [32].Israr A and Poupyrev I, “Tactile brush: drawing on skin with a tactile grid display,” in Proceedings of the ACM SIGCHI Conference on Human Factors in Computing Systems, 2011, pp. 2019–2028. [Google Scholar]
- [33].Seps M, Dermitzakis K, and Hernandez-Arieta A, “Study on lower back electrotactile stimulation characteristics for prosthetic sensory feedback,” in Proceedings of the IEEE/RSJ International Conference on Intelligent Robots and Systems (IROS), 2011, pp. 3454–3459. [Google Scholar]
Associated Data
This section collects any data citations, data availability statements, or supplementary materials included in this article.