Adrenocortical carcinoma (ACC) is a rare endocrine cancer with limited treatment options for metastatic disease. Resistance to adjuvant therapy is the main factor behind treatment failure. This article reports the potential of microRNAs in the regulation of chemotherapy and adrenolytic agents in ACC.
Keywords: Adrenal gland neoplasms, microRNAs, Drug resistance
Abstract
Background.
Adrenocortical carcinoma (ACC) is a rare endocrine cancer with treatments limited in efficacy for metastatic disease. New molecular targeted therapies have yet to improve patient outcomes. In contrast, established treatment regimens of adrenolytics and chemotherapy have demonstrated treatment benefit, although admittedly in a minority of patients. Identification of microRNAs (miRNAs) in patients responsive to adjuvant therapy may offer a means to sensitize patients with progressive disease to existing adjuvant regimens.
Materials and Methods.
Samples from primary ACC tumors of 10 Stage IV patients were examined for differentially expressed miRNAs between a “sensitive” and “resistant” cohort. Candidate microRNAs were restored via transfection in two functional ACC cell lines. Gain of function and effects on apoptosis and cell cycle were assessed.
Results.
microRNA‐431 (miR‐431) was underexpressed in patients with ACC with progressive disease undergoing adjuvant therapy. Restoration of miR‐431 in vitro decreased the half maximal inhibitory concentrations of doxorubicin and mitotane, with markedly increased apoptosis. We found that a reversal of epithelial‐mesenchymal transition underlies the action of miR‐431 with doxorubicin treatment, with Zinc Finger E‐Box Binding Homeobox 1 implicated as the molecular target of miR‐431 in ACC.
Conclusion.
This is the first report of the potential of miRNA therapy to sensitize ACC to current established adjuvant therapy regimens, which may mitigate the resistance underlying treatment failure in patients with advanced ACC. Effective and well‐studied methods of targeted miRNA delivery in existence hints at the imminent translatability of these findings.
Implications for Practice.
Adrenocortical carcinoma (ACC) is a rare endocrine cancer with outcomes not improving despite extensive research and new targeted therapies. Mitotane and etoposide/doxorubicin/cisplatin chemotherapy is trial validated for improved recurrence‐free survival. However, a minority of patients experience sustained benefit. Significant side effects exist for this regimen, with patients often unable to attain target drug doses shown to give survival benefit. This preclinical study examines the role of microRNAs in sensitizing ACC to doxorubicin or mitotane. This study offers an important bridge between new and existing cancer treatments, offering an imminently translatable approach to the treatment of adrenocortical carcinoma.
Introduction
Adrenocortical carcinoma (ACC) is a rare endocrine cancer with an incidence of up to two cases per million population [1]. Recent European consensus guidelines [2] for management recommend complete resection and loco‐regional node resection with localized disease and complete resection of oligometastatic disease, where possible, at index operation. However, there are limited treatments for systemic disease. Current trial‐validated adjuvant treatment comprises chemotherapy (etoposide, doxorubicin, cisplatin) and the adrenolytic mitotane. The FIRM‐ACT trial demonstrated the superiority of the etoposide/doxorubicin/cisplatin (EDP)/mitotane regimen over the streptozocin/mitotane regimen, with improved recurrence‐free survival but not overall survival [3]. Five‐year survival rates of 35% in advanced ACC suggests that resistance to adjuvant therapy is the main factor behind treatment failure [4].
In ACC, a variety of new molecular therapies against targets including epidermal growth factor receptor, insulin‐like growth factor receptor 1, and angiogenesis inhibitors [5], [6], [7], [8], [9], [10], [11], [12], [13] have reached clinical trial stage but have not yet demonstrated sufficiently positive results for further development or widespread implementation. Despite this, there have been scattered case reports in the literature reporting on sustained and prolonged survival in metastatic ACC following adjuvant treatment with EDP chemotherapy and/or mitotane [14], [15], [16], [17]. Thus, studying molecular differences in responders to therapy compared with nonresponders is a novel, rational, and valuable approach that may yield adjunctive therapies possibly effecting chemosensitization of ACC to current adjuvant therapies in use.
One molecular difference could be due to microRNA (miRNA) expression. miRNAs are a novel class of short, noncoding RNAs that have been implicated in all normal biological functions such as growth, proliferation, cell differentiation, and death [18]. In cancer, they can act as either a tumor suppressor or promoter [19], [20]. Of particular interest in the clinical setting is miRNA regulation of cell response to chemotherapy. For example, in colorectal cancer, overexpression of miR‐129 suppressed B‐cell lymphoma 2 gene (BCL2), leading to decreased cell proliferation, increased cell death, and enhanced 5‐fluorouracil action [21]. In gallbladder cancer, miR‐145 overexpression enhanced degradation of multidrug resistance protein 1 (MDR1), leading to cisplatin sensitivity [22].
In this study, we sought to investigate miRNA signatures of patients with ACC with clinically demonstrated disease response to adjuvant therapy, finding low miR‐431 expression in patients with Stage IV ACC resistant to adjuvant treatment. Our candidate miRNA, microRNA‐431 (miR‐431), increased ACC cell response to mitotane and doxorubicin treatment. We demonstrate that Zinc Finger E‐Box Binding Homeobox 1 (ZEB1), a target of miR‐431, is implicated in reversal of epithelial‐mesenchymal transition (EMT), leading to increased cell responses to adjuvant therapies in ACC. This is the first study to show the potential of miRNAs in the regulation of chemotherapy and adrenolytic agents in ACC.
Materials and Methods
Clinical Samples
Clinical samples were obtained from patients with histologically proven ACC. Stage IV disease was diagnosed radiologically and biopsy proven where clinically appropriate, or histologically proven following resection. All patients gave informed consent for tissue use and clinical data collection.
Cell Culture
The human ACC cell line H295R (NCI‐H295R, American Type Culture Collection [ATCC] CRL‐2128) was purchased from ATCC (Manassas, VA). Cells were cultured in Dulbecco's modified Eagle's medium/F12 (ThermoFisher Scientific, Carlsbad, CA), with 5% fetal bovine serum and 1% Insulin‐Transferrin‐Selenium supplement (BD Biosciences, Bedford, MA). Primary ACC cells were obtained following surgical resection and cultured in the same media at 37°C in a humidified atmosphere under 5% CO2.
miRNA Transfection and Drug Treatment
Cells were transfected with synthetic miRNA mimics (miRVana miRNA mimics, Catalog Number 446406; ThermoFisher Scientific) or a negative control miRNA (miR‐NC, AM171100, Ambion, ThermoFisher Scientific) in parallel at a concentration of 40 nM using Lipofectamine RNAiMax (ThermoFisher Scientific) according to the manufacturer's instructions. Cells were transfected when they were 30%–50% confluent on Day 0, and 2 days later a second transfection was performed.
Doxorubicin was purchased from Sigma Aldrich (Product Number D1515, St Louis, MO) and dissolved in sterile nuclease‐free water at a concentration of 10 mM as stock solution according to the manufacturer's recommendation. Mitotane was purchased from Selleckchem (Product Number S1732, Houston, TX) and dissolved in dimethyl sulfoxide at a concentration of 50 mM as stock solution according to the manufacturer's recommendation.
Cell Proliferation and Cell Cycle Analysis
Cell proliferation was assessed by absorbance at 490 nm (BioTek Synergy HT Multi‐Detection Microplate Reader; ThermoFisher Scientific) with CellTiter 96 Aqueous One Solution Cell Proliferation Assay following manufacturer's recommendations (Promega, Madison, WI). For primary ACC cells, assessment for proliferation was performed with IncuCyte Live Cell Analysis system (Essen BioScience, Ann Arbor, MI) following the manufacturer's instructions.
Cell cycle was assessed with fluorescence activated cell sorting analysis (FACS Calibre, BD Biosciences, Bedford, MA). Cells were harvested following miRNA transfection and drug treatment, washed with phosphate‐buffered saline twice, and stained with propidium iodide (Sigma Aldrich, St Louis, MO) at a concentration of 17.4 ug/mL. Generated flow cytometry histograms were analyzed with Modfit LT software (Verity Software House, Topsham, ME).
Cell Migration and Invasion
The ability of cells to migrate or invade through a polycarbonate membrane (8 μm pore size) was measured using CytoSelect 24‐well cell migration and invasion assay kit (Cell Biolabs, San Diego, CA) according to the manufacturer's protocol.
RNA Extraction, Real‐Time Quantitative Polymerase Chain Reaction, and miRNA Arrays
Total RNA was extracted from fresh frozen or paraffin‐embedded samples using miRNeasy Mini Kit and miRNeasy FFPE Kit, respectively (Qiagen, Hilden, Germany) following manufacturer's instructions. RNA concentration and purity was assessed with NanoDrop ND 1000 Spectrophotometer (ThermoFisher Scientific). For profiling the relative expression of 384 miRNAs per sample, TaqMan Low Density Human MicroRNA Array A cards were used (TLDA cards, Catalog Number 4398977; Applied Biosystems, Foster City, CA). One microgram of total RNA per tissue sample was used for miRNA mega reverse transcription (RT) following manufacturer's instructions. Quantification of miRNA polymerase chain reaction (PCR) products on the TLDA cards was performed with ABI 7900 HT Real‐time PCR system (Applied Biosystems) using manufacturer‐specified cycling conditions.
Quantification of all mRNA RT‐PCR products was performed with ABI 7900HT Real‐time PCR System (Applied Biosystems) under standard cycling conditions. Relative expression (RQ) was obtained by the 2‐ΔΔCt method using RQ Manager Version 1.2.1 (Applied Biosystems).
DataAssist (Version 3.01; Applied Biosystems) was used for analysis and generation of differentially expressed miRNAs between comparing groups. Small nucleolar RNA, C/D Box 48 (RNU48) was used as a reference gene.
For relative quantification of individual mRNA transcript, 1 μg of total RNA underwent reverse transcription with a high‐capacity RNA to complementary DNA reverse transcription kit (ThermoFisher Scientific) and amplification with TaqMan gene expression assays (ThermoFisher Scientific). Glyceraldehyde 3‐phosphate dehydrogenase (GAPDH) was used as a reference gene.
Protein Extraction and Immunoblotting
Radioimmunoprecipitation assay buffer followed by sonication was used for cell lysis. Protein concentration was determined with Pierce BCA Protein Assay Kit (Pierce Biotechnology, Rockford, IL) following manufacturer's instructions. A minimum of 40 μg of total protein lysate was denatured for 10 minutes at 70°C prior to electrophoresis (precast 4%–12% bis‐Tris gels; ThermoFisher Scientific). Electrophoresed proteins were transferred to polyvinylidene difluoride (Immobilon P, Catalog Number PVH00010; Merck Millipore, Burlington, MA) membrane. Membranes were blocked with Tris‐buffered saline with 0.1% Tween‐20 with 5% nonfat milk, and probed with relevant antibodies overnight at 4°C. To visualize proteins, Western Bright Quantum detection kit (Advansta, Menlo Park, CA) was used with LAS4000 digital imaging system (Fujifilm, Tokyo, Japan). MultiGauge software (V 3.0, Fujifilm) was used for protein expression quantification, normalized to GAPDH.
Statistical Analysis
GraphPad Prism Software (version 7.0b; GraphPad, San Diego, CA) was used for graphical generation and statistical calculation. Paired Student's t test was used for parametric data. Four‐parameter nonlinear regression was used to generate dose response curves and F test via two‐way analysis of variance was used to assess differences in dose response curves. Findings were considered statistically significant when p < .05.
Results
miR‐431 Is Underexpressed in Patients with Stage IV ACC Resistant to Adjuvant Treatment
We sought to identify differentially expressed miRNAs between patients with disease responsive to adjuvant therapy (mitotane, chemotherapy, and radiotherapy) and those whose disease progressed on adjuvant therapy.
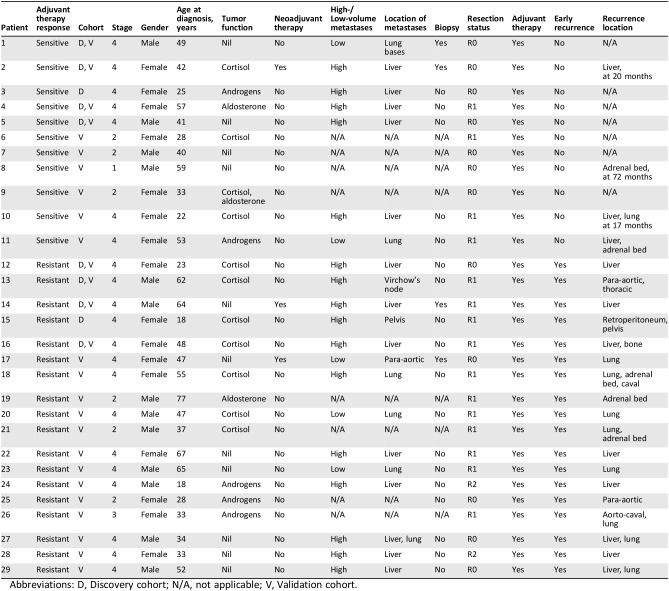
A discovery cohort of 10 patients with stage IV ACC was used for initial identification of candidate miRNAs through TLDA cards (Applied Biosystems). The clinicopathological data and clinical response to adjuvant therapy for these 10 patients are detailed in Table 1.
Table 1. The clinicopathological features of patients in the discovery and validation cohorts.
Abbreviations: D, Discovery cohort; N/A, not applicable; V, Validation cohort.
Five patients were “responsive to therapy,” where small‐volume metastatic disease regressed radiologically while receiving adjuvant therapy or where primary and oligometastatic disease had no recurrence following resection and adjuvant therapy for at least 12 months following index operation. Five patients were “resistant to therapy” when they were found to have early recurrence (<12 months) of disease while on adjuvant therapy, or radiological progression of metastatic disease while undergoing adjuvant therapy.
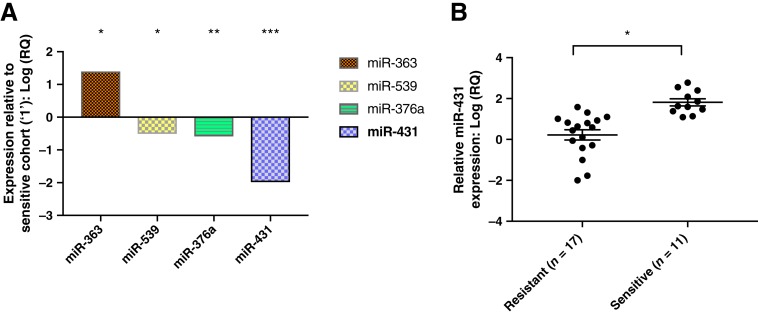
Four differentially expressed miRNAs between the responsive and nonresponsive groups were identified (Fig. 1A). miR‐431 was 100‐fold underexpressed in the resistant cohort when compared with the sensitive cohort and was selected for further exploration.
Figure 1.
Differentially expressed miRNAs sensitive versus resistant. (A): Four differentially expressed miRNAs were identified using TaqMan Low Density Human MicroRNA Array A in a discovery cohort of five patients with “sensitive” versus five with “resistant” stage IV adrenocortical carcinoma (ACC). miR‐431 was 100‐fold underexpressed in the resistant cohort compared with the sensitive cohort and selected for further experimentation. *, p = .03. **, p = .04. ***, p = .047. (B): Relative quantification of miR‐431 via real‐time quantitative polymerase chain reaction in an expanded validation cohort of patients with ACC with various stages. The mean miR‐431 expression in the sensitive group is 21‐fold greater than the mean miR‐431 in the expanded resistant group. *, p = .04. Error bars represent SEM.
Abbreviation: RQ, relative expression.
The expression of miR‐431 was further tested in an expanded cohort of 28 patients using the quantitative reverse transcription‐polymerase chain reaction (RT‐qPCR) technique. The clinicopathological data and clinical response to adjuvant therapy for the expanded cohort are also summarized in Table 1. miR‐431 was 21‐fold underexpressed in the resistant group (p = .04) when compared with that of the sensitive group (Fig. 1B).
Examining the clinical data for the discovery and expanded cohorts of patients showed a heterogeneous manner in which metastatic disease was identified. This was not surprising given that the patients were from five different states across Australia, and this reflects differences in local practices. There were 29 patients in the discovery and validation cohorts combined, with 21 having Stage IV disease. Four of these patients had biopsies to confirm ACC (fine needle; core biopsies). The first patient had biopsy‐proven low‐volume lung metastases not suitable for lobectomy, with the primary tumor resected. The remaining three all had neoadjuvant therapy and were biopsied for tissue diagnosis: Their liver metastases were deemed unresectable primarily. Two had very good response to neoadjuvant therapy; the last did not but was deemed suitable for resection after a second opinion.
Of the 17 patients who did not have biopsy confirmation of metastatic disease, 14 had high volume disease, mostly liver, that was resected primarily with the adrenal, thus confirming the diagnosis of metastases. One patient had suspected disease in Virchow's node from preoperative imaging and underwent thoracic duct dissection at the index operation.
Restoration of miR‐431 Increased Cell Responses to Adjuvant Therapy
In order to investigate the activity of miR‐431 upon ACC cells to adjuvant therapy, gain‐of‐function studies were performed on ACC H295R cells and primary‐derived ACC cells.
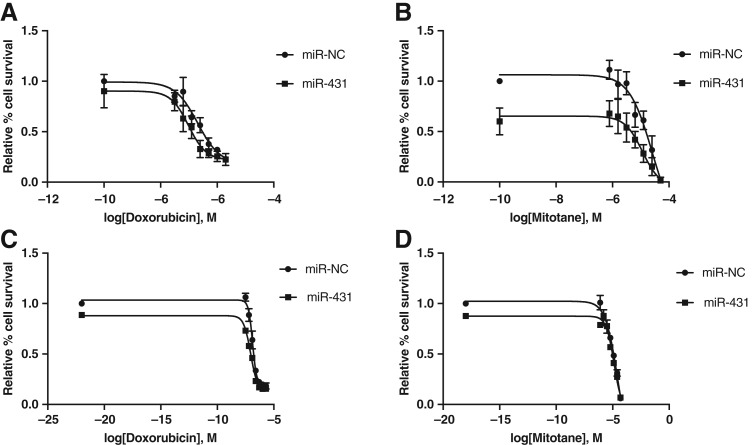
First, restoration of miR‐431 via transfection of miR‐431 mimics in H295R cells was confirmed via RT‐qPCR (supplementary online Fig. 1). Two days following miR‐431/NC restoration, H295R cells were treated with doxorubicin in a 0–2,000 nM (0, 31.3, 62.5, 125, 250, 500, 1,000, 2,000 nM) series dose range for 48 hours. Cell viability was assessed with a cell proliferation assay, MTS assay ([3‐(4,5‐dimethylthiazol‐2‐yl)‐5‐(3‐carboxymethoxyphenyl)‐2‐(4‐sulfophenyl)‐2H‐tetrazolium, inner salt]) thereafter for 7 days. A decreased cell proliferation was maximally observed in miR‐431‐restored cells versus miR‐NC on Day 5 after drug treatment, with a decreased half maximal inhibitory concentration (IC50) from 205 to 97 nM (Fig. 2A). This represents a 53% decrease in IC50.
Figure 2.
Dose response of H295R and primary adrenocortical carcinoma (ACC) cells following miR‐431 replacement and treatment with doxorubicin or mitotane, respectively. (A): H295R cells were restored with miR‐431/NC and treated with doxorubicin. A maximal left shift of the dose response curve was observed on Day 5, with a 53% decrease in half maximal inhibitory concentration (IC50; 205 to 97 nM doxorubicin). Error bars represent SEM, n = 3; p < .05 for miR‐431, NC effect, and doxorubicin dose effect. (B): H295R cells were restored with miR‐431/NC and treated with mitotane. A maximal left shift of the dose response curve was observed on Day 3, with a 55% decrease in IC50 (25.3 to 11.5 μM mitotane). Error bars represent SEM, n = 3; p < .05 for miR‐431, NC effect, and mitotane dose effect. (C): Primary ACC cells were restored with miR‐431/NC and treated with doxorubicin. A maximal left shift of the dose response curve was observed on Day 7, with a 32% decrease in IC50 (131 to 88 nM doxorubicin). Error bars represent SEM, n = 3; p < .05 for miR‐431, NC effect, and doxorubicin dose effect. p < .05 for miR‐431 + doxorubicin versus NC + doxorubicin. (D): Primary ACC cells were restored with miR‐431/NC and treated with mitotane. A maximal left shift of the dose response curve was observed on Day 7, with a 52% decrease in IC50 (27.5 to 13.2 μM mitotane). Error bars represent SEM, n = 3; p < .05 for miR‐431, NC effect, and mitotane dose effect. p < .05 for miR‐431 + mitotane versus NC + mitotane. miR‐NC, negative control.
Similarly, following miR‐431 restoration, cells were treated with mitotane in a 0–50 μM (0, 0.8, 1.6, 3.2, 6.3, 12.5, 25, 50 μM) series dose range for 48 hours. For mitotane‐treated cells, decreased cell proliferation was maximally observed in miR‐431‐restored cells on Day 3 versus miR‐NC (Fig. 2B). A 55% decrease, from 25.3 to 11.5 μM, of the IC50 was identified in miR‐431‐restored cells compared with miR‐NC.
Primary ACC cells, developed from a patient with stage IV ACC resistant to all adjuvant therapy, were also tested to further assess the effects of miR‐431 on cell response to adjuvant therapies. This patient was among the “resistant” group in the discovery cohort. Immunohistochemical staining of the primary cells was negative for steroidogenic factor 1, melan‐1, inhibin, and calretinin (data not shown), indicating their complete dedifferentiation. To confirm adrenocortical origin, supernatant media from the primary cells was aspirated 48 hours after incubation and assayed for cortisol and aldosterone. The resultant hormone profiles displayed strong steroidogenic and aldosteronic properties, exceeding those of ACC H295R cells (supplementary online Table 1), confirming the adrenocortical and functional identity of the primary cells.
Primary ACC cells restored with miR‐431/miR‐NC were treated with doxorubicin as per H295R and proliferation assessed daily with IncuCyte Live Cell Analysis (Essen BioScience, Ann Arbor, MI). A decrease in cell proliferation for miR‐431‐restored cells versus miR‐NC was continually observed but maximal on Day 7 after doxorubicin treatment, with a decrease in IC50 from 131 to 88 nM, a 32% reduction (Fig. 2C).
Similarly, primary ACC cells were treated with mitotane as per H295R and proliferation assessed daily with IncuCyte Live Cell Analysis (Essen BioScience, Ann Arbor, MI). In concordance with H295R, a continual decreased cell proliferation was observed in miR‐431‐restored cells but was maximally observed on Day 7 following mitotane treatment, with a decrease in IC50 from 27.5 to 13.2 μM, a 52% decrease (Fig. 2D).
miR‐431 Restoration and Doxorubicin Effects S‐Phase Cell Cycle Arrest
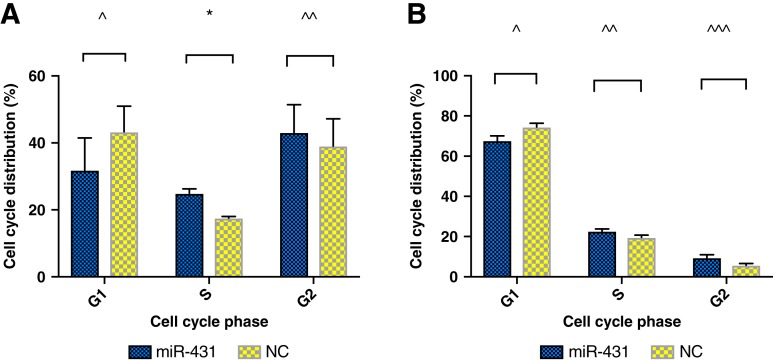
The effect of miR‐431 restoration on ACC cells was investigated further with cell cycle studies. H295R cells were miR‐431/NC restored and, 2 days later, treated with 500 nM doxorubicin for 48 hours. miR‐431‐restored H295R cells showed a proportion of 25% in S phase, increased from 18% of miR‐NC, p = .03 (Fig. 3A). However, the difference of cell percentage in the G2 (43%–39%) and G1 phase (32%–43%) between miR‐431 and NC did not reach statistical significance. In cells with restored miR‐431 treated with 12.5 μM mitotane, the difference of cell percentages in cell cycle phases did not reach statistical significance.
Figure 3.
Cell cycle effects of miR‐431 on adrenocortical carcinoma H295R cells. (A): Cell cycle effects of miR‐431 with doxorubicin treatment. Error bars represent SEM. *, p = .03. (B): Cell cycle effects of miR‐431 with mitotane treatment. Error bars represent SEM. Data did not reach statistical significance. NC denotes negative control. ^, ^̂, ^̂̂ denotes nonsignificant differences.
miR‐431 Restoration plus Adjuvant Therapy Induced Cell Apoptosis
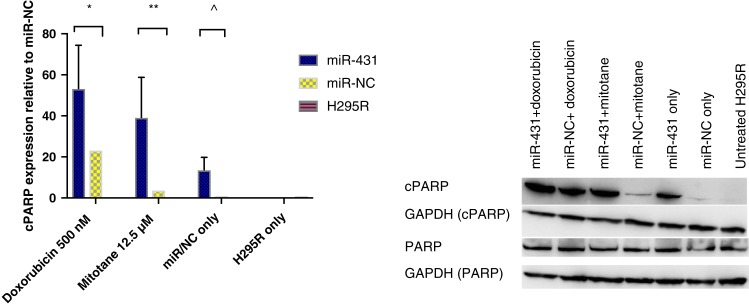
We sought to examine the effect on apoptosis that miR‐431 and/or adjuvant therapy would confer. H295R cells with restored miR‐431/NC were treated with doxorubicin 500 nM or mitotane 12.5 μM, respectively, for 48 hours. Thereafter, cells were collected to test the expression of cleaved poly‐ADP‐ribose polymerase (cPARP) by Western blot (Fig. 4). miR‐431‐restored cells combined with doxorubicin displayed a twofold increase in cPARP when compared with miR‐NC plus doxorubicin, p = .002.
Figure 4.
The effect of miR‐431 on cell apoptosis. Following restoration of miR‐431/NC, cells were treated with 500 nM doxorubicin or 12.5 μM mitotane, respectively, for 48 hours. Error bars represent SEM, n = 3. *, p = .002. **, p = .0003. ^, p = .1. Representative images of one Western blot experiment are shown.
Abbreviations: cPARP, cleaved poly‐ADP‐ribose polymerase; GAPDH, glyceraldehyde 3‐phosphate dehydrogenase; miR‐NC, negative control; PARP, poly‐ADP‐ribose polymerase.
For mitotane, there was a 13‐fold increase in cPARP in miR‐431‐restored cells compared with miR‐NC plus mitotane, p = .0003.
ZEB1 Is a Target of miR‐431 in ACC Cells
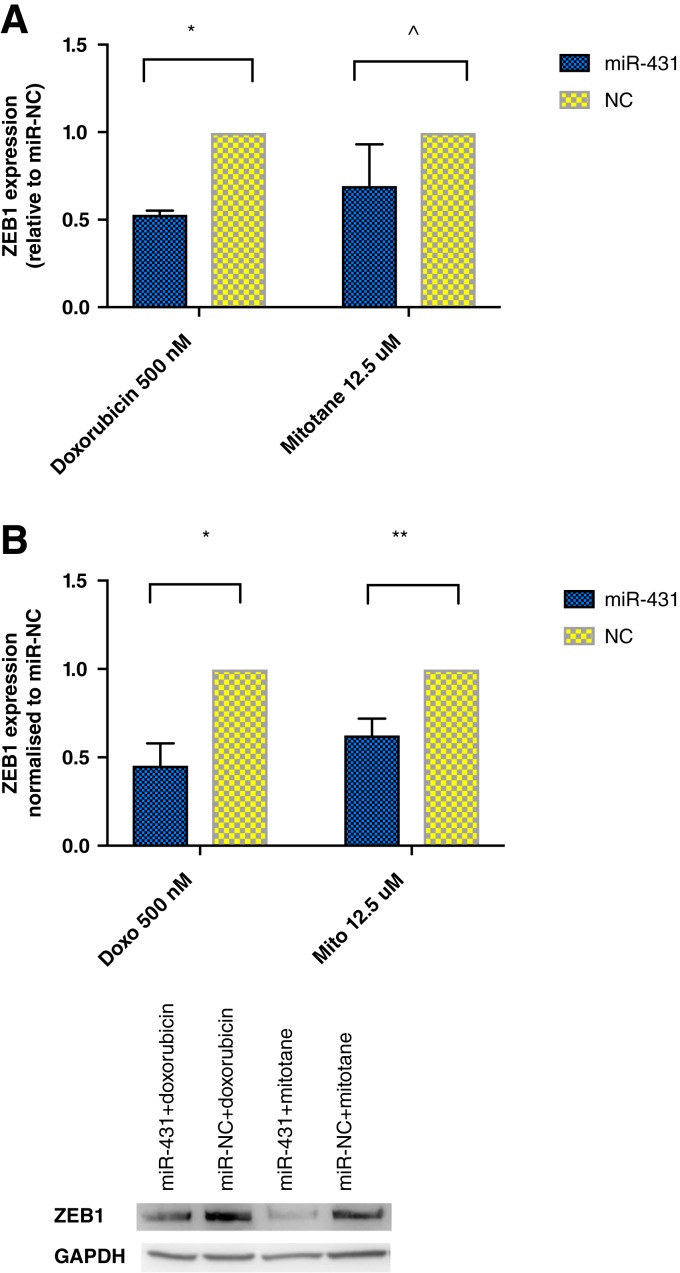
ZEB1 has been shown to be a molecular target of miR‐431 in human lung adenocarcinoma [23] and hepatocellular carcinoma [24]. We found that in ACC H295R cells, ZEB1 mRNA transcript (Fig. 5A) and protein expression (Fig. 5B) were significantly reduced by twofold in miR‐431 plus doxorubicin‐treated cells compared with miR‐NC plus doxorubicin.
Figure 5.
The effect of miR‐431 on ZEB1 expression. (A): Relative expression of ZEB1 via real‐time quantitative polymerase chain reaction. Error bars represent SEM. *, p = .0008. ^, p = .2. (B): ZEB1 protein expression in Western blot. Error bars represent SEM. *, p = .001. **, p = .008. Representative images of one experiment are shown.
Abbreviations: GAPDH, glyceraldehyde 3‐phosphate dehydrogenase; miR‐NC, negative control; ZEB1, Zinc Finger E‐Box Binding Homeobox 1.
Similarly, in miR‐431 plus mitotane cells, ZEB1 protein expression was significantly decreased by 38% when compared with NC (Fig. 5B). However, the decrease of ZEB1 mRNA transcript did not reach statistical significance (Fig. 5A).
miR‐431 Has Influence upon Epithelial Mesenchymal Transition Processes
miR‐431 restoration has been associated with EMT reversal in hepatocellular carcinoma [24]. We sought to investigate this aspect in ACC by examining miR‐431 effects on invasion, migration, and specific markers for EMT.
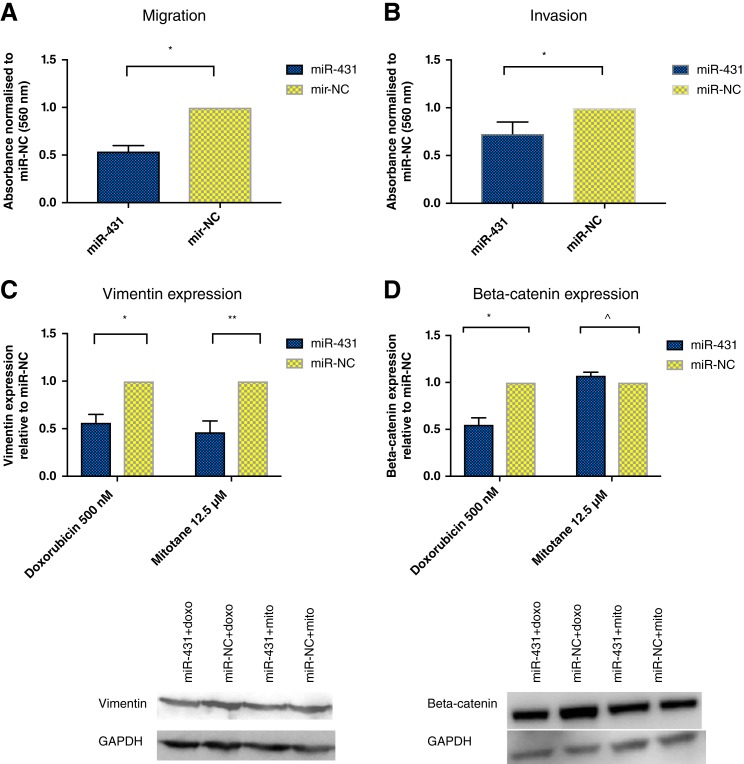
Following miR‐431/miR‐NC restoration in H295R and treatment with 500 nM doxorubicin for 48 hours, migration and invasion were assessed via transwell assay. Migration was significantly reduced by 46% and invasion by 27%, respectively, in miR‐431‐restored cells compared with miR‐NC (Fig. 6A, 6B). However, miR‐431 plus mitotane had no effect on cell migration and invasion (data not shown).
Figure 6.
The effects of miR‐431 on epithelial‐mesenchymal transition processes. (A): Following miR‐431/NC restoration, cells were treated with 500 nM doxorubicin for 48 hours and assessed for migration via transwell assay. There was a 46% decrease on migration in miR‐431‐restored cells. Error bars represent SEM. *, p = .02. (B): Following miR‐431/NC restoration, cells were treated with 500 nM doxorubicin for 48 hours and assessed for invasion via transwell assay. There was a 27% decrease on invasion in miR‐431‐restored cells. Error bars represent SEM. *, p = .01. (C): Following miR‐431/NC restoration, cells were treated with 500 nM doxorubicin or 12.5 μM mitotane for 48 hours. Vimentin was twofold decreased in miR‐431‐restored cells treated with doxorubicin or mitotane. Error bars represent SEM, n = 3. *, p = .007. **, p = .04. Representative images of one Western blot experiment are shown. (D): Following miR‐431/NC restoration, cells were treated with 500 nM doxorubicin or 12.5 μM mitotane for 48 hours. In miR‐431 + doxorubicin cells, there was a twofold decrease in beta‐catenin expression. This was not detected for miR‐431 cells treated with mitotane. Error bars represent SEM, n = 3. *, p = .008. ^, p = .09. Representative images of one Western blot experiment are shown.
Abbreviations: doxo, doxorubicin; GAPDH, glyceraldehyde 3‐phosphate dehydrogenase; miR‐NC, negative control; mito, mitotane.
We next examined the expression of E‐cadherin and vimentin, protein markers associated specifically with the EMT process, in ACC cells with miR‐431 restoration. Vimentin was twofold decreased in miR‐431‐restored cells plus doxorubicin or mitotane versus miR‐NC (Fig. 6C). E‐cadherin was not expressed in ACC cells (data not shown).
Beta‐catenin has been implicated in the initiation of physiological EMT [25], but its accumulation has been described as a cardinal event in the pathogenesis of ACC [26], [27], [28]. We found that in miR‐431‐restored ACC cells treated with doxorubicin, beta‐catenin was significantly twofold decreased compared with miR‐NC (Fig. 6D). However, this was not observed for miR‐431‐replaced cells treated with mitotane.
Discussion
This study highlights the potential of miR‐431 replacement to enhance the cytotoxic effects of doxorubicin and mitotane, by significantly reducing the amount of drug required to effect IC50.
Doxorubicin, an anthracycline drug exerting its effects by DNA intercalation and inhibition of DNA synthesis [29], has been an essential element of a trial‐validated chemotherapy regimen (etoposide, doxorubicin, cisplatin) shown to improve disease‐free survival in ACC [3]. Doxorubicin is usually dosed according to body surface area (mg/m2), varying according to the cancer treated. One significant side effect associated with doxorubicin is cardiotoxicity. In ACC, there is a significant subset of patients presenting with cortisol‐secreting tumors, that can have influence upon cardiovascular risk factors including hypertension [30] and cardiomyopathy [31]. It is in these patients that a decreased doxorubicin dosage with equivalent IC50 to a higher dose via miR‐431 restoration would be of benefit.
Mitotane, an adrenolytic drug, is unique to the treatment of ACC. Studies have demonstrated that attaining a serum drug level of 14 mg/L confers better outcomes in ACC [32], [33]. In practicality, these same studies show only 50% of patients achieve this drug level with side effects including neurological, hepatic, and gastrointestinal. Our findings that miR‐431 restoration can reduce the dose of mitotane necessary to achieve an equivalent IC50 as mitotane alone may obviate the need to achieve drug levels of 14 mg/L to confer benefit.
We have demonstrated the potential of miR‐431 restoration for chemosensitization in two steroidogenic ACC cell lines. H295R is a well‐studied functional/hormone‐producing ACC cell model. Additionally, we have developed a primary ACC model with steroidogenic, aldosteronic, and androgenic capabilities eclipsing that of H295R, derived from a patient with disease known to be particularly aggressive and refractory to adjuvant therapy, who had early hepatic recurrence within 3 months despite R0 en‐bloc resection. One challenge in ACC is that of functional tumors, associated with increased risk of postoperative complications and reduced recurrence‐free survival [34]. Additionally, hormone‐producing cancers are a source of considerable and difficult‐to‐manage morbidity in patients with disseminated ACC not suitable for debulking. Thus, our finding of miR‐431‐mitigated increased response to doxorubicin and mitotane is of significance.
Our use of H295R cells for gain of function and molecular studies relies on this cell line being the only commercially available ACC cell line of definitive adrenocortical origin. This is in contrast with another commercially available ACC line, SW‐13, that is nonfunctional and thought to be of small cell origin [35]. H295R proved, in our instance, readily suitable for gain‐of‐function and molecular studies. Our primary ACC cell line, also functional, proved suitable for gain‐of‐function studies. As is typical of primary cell lines, cells did not survive beyond 10 passages, and their use was restricted to gain‐of‐function studies. Our confidence in the gain‐of‐function findings is from the similar results being found in these two ACC cell lines. There were differences between the two cell lines with regard to when the maximal IC50 changes for doxorubicin and mitotane were observed. However, both cell lines displayed a continual IC50 difference between miR‐431‐replaced and control cells throughout the period of proliferation assessment, and the variation in timing of the maximally observed difference is likely due to their respective cell doubling times for each cell line.
A direct effect of the observed chemosensitization of ACC cells via miR‐431 restoration is the impact on cell death. We found significantly increased levels of cPARP protein expression in the miR‐431‐restored cells, twofold for doxorubicin and 13‐fold in mitotane. Thus, miR‐431 restoration in ACC cells greatly potentiates the effects of doxorubicin and mitotane.
We have demonstrated that ZEB1 is a target of miR‐431 in ACC, consistent with that in other tumors. In hepatocellular carcinoma (HCC), miR‐431 expression was decreased in cancerous liver compared with normal liver, and also reduced in HCC with more aggressive phenotype [24].
We now have several findings supporting a reversal of EMT as the mechanism underlying the observed chemosensitizing role of miR‐431 in ACC, in particular for doxorubicin. In cancer, EMT has been widely implicated in the process in which carcinoma in situ acquires the ability to breach the basement membrane, becoming a carcinoma, and beyond, to metastatic disease [36].
In this study, we observed a significant reduction in migration and invasion in miR‐431‐restored ACC cells treated with doxorubicin. We then examined expression of the intermediate filament protein vimentin, which is expressed in increasing proportions when cells are in the mesenchymal end of the EMT spectrum [25]. We found a decreased expression of vimentin in miR‐431‐replaced cells treated with doxorubicin or mitotane, suggesting that there is a reversal of the EMT process following miR‐431 replacement and subsequent adjuvant therapy. Bulzico et al. did find a role for EMT in ACC, examining expression of EMT markers including vimentin, with increased vimentin expression in aggressive ACCs [37]. Nakano et al. had already shown increased vimentin staining in higher‐stage ACCs [38]. Additionally, we are in concordance with their findings of negative E‐cadherin expression, which is posited to be due to the mesodermal origin of the adrenal cortex. Our finding of decreased vimentin in miR‐431‐restored cells treated with drug may indicate a differentiation of cells to a less aggressive state.
To further strengthen our position of the role of miR‐431 in EMT reversal, we became interested in beta‐catenin protein expression. Beta‐catenin is a key component in Wnt‐signaling—essential in normal adrenal development but deregulated in cancer. Additionally, membrane‐bound beta‐catenin is involved in cadherin base adhesion, with cadherin loss releasing beta‐catenin to engage the Wnt pathway. In ACC pathology, accumulation of beta‐catenin in the cytoplasm and translocation to the nucleus leads to activation of Wnt target genes. In ACC, abnormal cytoplasmic or nuclear localization of beta‐catenin was seen in 85% of ACCs [27] and is associated with more aggressive ACC. Our finding of a significant decrease of beta‐catenin may indicate the potential of miR‐431 plus doxorubicin in preventing the accumulation of pathological beta‐catenin, which is known to be a hallmark of ACC.
Our findings support those of Salomon et al. [39], where siRNAs were used to silence beta‐catenin expression in H295R. They found that silencing beta‐catenin decreased cell growth, decreased migration and invasion, increased cell apoptosis, and induced cell cycle S/G2 arrest. Interestingly, Wnt signaling is linked to EMT, by indirect activation of ZEB1 [40], which we found ZEB1 to be suppressed with miR‐431 restoration and drug treatment.
The picture for miR‐431 potentiating the action of chemotherapy in ACC via reversal of epithelial‐mesenchymal transition has been stronger for doxorubicin compared with mitotane. This may be explained by examining the actions of the wholly different drugs doxorubicin and mitotane. The antineoplastic activity of doxorubicin has been purported to be from inhibiting enzymatic activity of topoisomerase II, needed for cell growth and division [41]. In colon cancer, topoisomerase IIα was shown as a necessary component for T‐cell factor transcription promoting epithelial‐mesenchymal transition [42]. This finding in colon cancer may explain why miR‐431 potentiating doxorubicin action in ACC cells through epithelial‐mesenchymal transitional reversal is more convincing. In contrast, the deleterious action of mitotane on adrenal tissue has been thought to be due to induction of oxidative stress leading to apoptosis [43]. There has been no evidence so far in the literature of any implication of EMT in this. In our study, we find that miR‐431 potentiates the apoptotic action of mitotane in ACC, with the mechanism needing further elucidation.
Conclusion
We have, in this study, shown for the first time that replacing miR‐431, differentially underexpressed in stage IV ACCs resistant to adjuvant therapy, followed by doxorubicin or mitotane, leads to decreased cell proliferation and increased cell apoptosis. In miR‐431‐restored ACC cells treated with doxorubicin, there is evidence of a reversal of EMT phenotype. ZEB1, a transcriptional factor implicated in EMT, is a target in miR‐431‐replaced cells treated with doxorubicin or mitotane. Our finding that miR‐431 restoration may sensitize ACC to these currently available therapies offers imminent translatability in the treatment of ACC.
See http://www.TheOncologist.com for supplemental material available online.
Acknowledgments
G.T.Y.K. is a recipient of Sydney Medical School John Brooke Moore Scholarship 2015, Royal Australian College of Surgeons Foundation for Surgery Catherine Marie Enright Kelly Scholarship 2016, EnGeneIC Cancer Research Foundation Scholarship 2017. S.B.S. is a Sydney Medical School Foundation Fellow (University of Sydney).
Author Contributions
Conception/design: Grace T.Y. Kwok, Jing Ting Zhao, Stan B. Sidhu
Provision of study material or patients: Grace T.Y. Kwok, Jing Ting Zhao, Anthony J. Gill, Stan B. Sidhu
Collection and/or assembly of data: Grace T.Y. Kwok, Jing Ting Zhao, Anthony J. Gill, Julian C.Y. Ip, Stan B. Sidhu
Data analysis and interpretation: Grace T.Y. Kwok, Jing Ting Zhao, Anthony J. Gill, Stan B. Sidhu
Manuscript writing: Grace T.Y. Kwok, Jing Ting Zhao, Anthony R. Glover, Stan B. Sidhu
Final approval of manuscript: Grace T.Y. Kwok, Jing Ting Zhao, Anthony R. Glover, Anthony J. Gill, Roderick Clifton‐Bligh, Bruce G. Robinson, Julian C.Y. Ip, Stan B. Sidhu
Disclosures
The authors indicated no financial relationships.
References
- 1.Kebebew E, Reiff E, Duh QY et al. Extent of disease at presentation and outcome for adrenocortical carcinoma: Have we made progress? World J Surg 2006;30:872–878. [DOI] [PubMed] [Google Scholar]
- 2.Fassnacht M, Dekkers O, Else T et al. European Society of Endocrinology Clinical Practice Guidelines on the Management of Adrenocortical Carcinoma in Adults, in collaboration with the European Network for the Study of Adrenal Tumors. Eur J Endocrinol 2018. [Epub ahead of print]. [DOI] [PubMed] [Google Scholar]
- 3.Fassnacht M, Terzolo M, Allolio B et al. Combination chemotherapy in advanced adrenocortical carcinoma. N Engl J Med 2012;366:2189–2197. [DOI] [PubMed] [Google Scholar]
- 4.Fassnacht M, Libe R, Kroiss M et al. Adrenocortical carcinoma: A clinician's update. Nat Rev Endocrinol 2011;7:323–335. [DOI] [PubMed] [Google Scholar]
- 5.Naing A, Lorusso P, Fu S et al. Insulin growth factor receptor (IGF‐1R) antibody cixutumumab combined with the mTOR inhibitor temsirolimus in patients with metastatic adrenocortical carcinoma. Br J Cancer 2013;108:826. [DOI] [PMC free article] [PubMed] [Google Scholar]
- 6.Naing A, Kurzrock R, Burger AM et al. Phase I trial of cixutumumab combined with temsirolimus in patients with advanced cancer. Clin Cancer Res 2011;17:6052–6060. [DOI] [PMC free article] [PubMed] [Google Scholar]
- 7.Samnotra V, Vassilopoulou‐Sellin R, Fojo A et al. A phase II trial of gefitinib monotherapy in patients with unresectable adrenocortical carcinoma (ACC). J Clin Oncol 2007;25(suppl 18):15527a. [Google Scholar]
- 8.Quinkler M, Hahner S, Wortmann S et al. Treatment of advanced adrenocortical carcinoma with erlotinib plus gemcitabine. J Clin Endocrinol Metab 2008;93:2057–2062. [DOI] [PubMed] [Google Scholar]
- 9.Wortmann S, Quinkler M, Ritter C et al. Bevacizumab plus capecitabine as a salvage therapy in advanced adrenocortical carcinoma. Eur J Endocrinol 2010;162:349–356. [DOI] [PubMed] [Google Scholar]
- 10.Kroiss M, Quinkler M, Johanssen S et al. Sunitinib in refractory adrenocortical carcinoma: A phase II, single‐arm, open‐label trial. J Clin Endocrinol Metab 2012;97:3495–3503. [DOI] [PubMed] [Google Scholar]
- 11.Berruti A, Sperone P, Ferrero A et al. Phase II study of weekly paclitaxel and sorafenib as second/third‐line therapy in patients with adrenocortical carcinoma. Eur J Endocrinol 2012;166:451–458. [DOI] [PubMed] [Google Scholar]
- 12.O'Sullivan C, Edgerly M, Velarde M et al. The VEGF inhibitor axitinib has limited effectiveness as a therapy for adrenocortical cancer. J Clin Endocrinol Metab 2014;99:1291–1297. [DOI] [PMC free article] [PubMed] [Google Scholar]
- 13.Haluska P, Worden F, Olmos D et al. Safety, tolerability, and pharmacokinetics of the anti‐IGF‐1R monoclonal antibody figitumumab in patients with refractory adrenocortical carcinoma. Cancer Chemother Pharmacol 2010;65:765–773. [DOI] [PMC free article] [PubMed] [Google Scholar]
- 14.Chalasani S, Vats HS, Banerjee TK et al. Metastatic virilizing adrenocortical carcinoma: A rare case of cure with surgery and mitotane therapy. Clin Med Res 2009;7:48–51. [DOI] [PMC free article] [PubMed] [Google Scholar]
- 15.El Ghorayeb N, Rondeau G, Latour M et al. Rapid and complete remission of metastatic adrenocortical carcinoma persisting 10 years after treatment with mitotane monotherapy: Case report and review of the literature. Medicine (Baltimore) 2016;95:e3180. [DOI] [PMC free article] [PubMed] [Google Scholar]
- 16.Ilias I, Alevizaki M, Philippou G et al. Sustained remission of metastatic adrenal carcinoma during long‐term administration of low‐dose mitotane. J Endocrinol Invest 2001;24:532–535. [DOI] [PubMed] [Google Scholar]
- 17.De León DD, Lange BJ, Walterhouse D et al. Long‐term (15 years) outcome in an infant with metastatic adrenocortical carcinoma. J Clin Endocrinol Metab 2002;87:4452–4456. [DOI] [PubMed] [Google Scholar]
- 18.Ameres SL, Zamore PD. Diversifying microRNA sequence and function. Nat Rev Mol Cell Biol 2013;14:475–488. [DOI] [PubMed] [Google Scholar]
- 19.Bueno MJ, Malumbres M. MicroRNAs and the cell cycle. Biochim Biophys Acta 2011;1812:592–601. [DOI] [PubMed] [Google Scholar]
- 20.Pichler M, Calin G. MicroRNAs in cancer: From developmental genes in worms to their clinical application in patients. Br J Cancer 2015;113:569–573. [DOI] [PMC free article] [PubMed] [Google Scholar]
- 21.Karaayvaz M, Zhai H, Ju J. miR‐129 promotes apoptosis and enhances chemosensitivity to 5‐fluorouracil in colorectal cancer. Cell Death Dis 2013;4:e659. [DOI] [PMC free article] [PubMed] [Google Scholar]
- 22.Zhan M, Zhao X, Wang H et al. miR‐145 sensitizes gallbladder cancer to cisplatin by regulating multidrug resistance associated protein 1. Tumour Biol 2016;37:10553–10562. [DOI] [PubMed] [Google Scholar]
- 23.Ren J, Chen Y, Song H et al. Inhibition of ZEB1 reverses EMT and chemoresistance in docetaxel‐resistant human lung adenocarcinoma cell line. J Cell Biochem 2013;114:1395–1403. [DOI] [PubMed] [Google Scholar]
- 24.Sun K, Zeng T, Huang D et al. MicroRNA‐431 inhibits migration and invasion of hepatocellular carcinoma cells by targeting the ZEB1‐mediated epithelial‐mensenchymal transition. FEBS Open Bio 2015;5:900–907. [DOI] [PMC free article] [PubMed] [Google Scholar] [Retracted]
- 25.De Craene B, Berx G. Regulatory networks defining EMT during cancer initiation and progression. Nat Rev Cancer 2013;13:97. [DOI] [PubMed] [Google Scholar]
- 26.Berthon A, Martinez A, Bertherat J et al. Wnt/β‐catenin signalling in adrenal physiology and tumour development. Mol Cell Endocrinol 2012;351:87–95. [DOI] [PubMed] [Google Scholar]
- 27.Tissier F, Cavard C, Groussin L et al. Mutations of β‐catenin in adrenocortical tumors: Activation of the Wnt signaling pathway is a frequent event in both benign and malignant adrenocortical tumors. Cancer Res 2005;65:7622–7627. [DOI] [PubMed] [Google Scholar]
- 28.Gaujoux S, Grabar S, Fassnacht M et al. β‐catenin activation is associated with specific clinical and pathological characteristics and a poor outcome in adrenocortical carcinoma. Clin Cancer Res 2011;17:328–336. [DOI] [PubMed] [Google Scholar]
- 29.Sartiano GP, Lynch WE, Bullington WD. Mechanism of action of the anthracycline anti‐tumor antibiotics, doxorubicin, daunomycin and rubidazone: Preferential inhibition of DNA polymerase alpha. J Antibiot (Tokyo) 1979;32:1038–1045. [DOI] [PubMed] [Google Scholar]
- 30.Whitworth JA, Williamson PM, Mangos G et al. Cardiovascular consequences of cortisol excess. Vasc Health Risk Manag 2005;1:291–299. [DOI] [PMC free article] [PubMed] [Google Scholar]
- 31.Kamenický P, Redheuil A, Roux C et al. Cardiac structure and function in Cushing's syndrome: A cardiac magnetic resonance imaging study. J Clin Endocrinol Metab 2014;99:E2144–E2153. [DOI] [PMC free article] [PubMed] [Google Scholar]
- 32.Terzolo M, Baudin A, Ardito A et al. Mitotane levels predict the outcome of patients with adrenocortical carcinoma treated adjuvantly following radical resection. Eur J Endocrinol 2013;169:263–270. [DOI] [PubMed] [Google Scholar]
- 33.Hermsen IG, Fassnacht M, Terzolo M et al. Plasma concentrations of o, p′ DDD, o, p′ DDA, and o, p′ DDE as predictors of tumor response to mitotane in adrenocortical carcinoma: Results of a retrospective ENS@ T multicenter study. J Clin Endocrinol Metab 2011;96:1844–1851. [DOI] [PubMed] [Google Scholar]
- 34.Margonis GA, Kim Y, Tran TB et al. Outcomes after resection of cortisol‐secreting adrenocortical carcinoma. Am J Surg 2016;211:1106–1113. [DOI] [PMC free article] [PubMed] [Google Scholar]
- 35.ATCC. SW‐13 (ATCC CCL‐105) 2018. Available at https://www.atcc.org/products/all/CCL-105.aspx#generalinformation. Accessed March 14, 2019.
- 36.Thiery JP. Epithelial‐mesenchymal transitions in tumour progression. Nat Rev Cancer 2002;2:442–454. [DOI] [PubMed] [Google Scholar]
- 37.Rubin B, Regazzo D, Redaelli M et al. Investigation of N‐cadherin/β‐catenin expression in adrenocortical tumors. Tumor Biol 2016;37:13545–13555. [DOI] [PubMed] [Google Scholar]
- 38.Nakano M. Adrenal cortical carcinoma: A clinicopathological and immunohistochemical study of 91 autopsy cases. Acta Pathol Jpn 1988;38:163–180. [DOI] [PubMed] [Google Scholar]
- 39.Salomon A, Keramidas M, Maisin C et al. Loss of β‐catenin in adrenocortical cancer cells causes growth inhibition and reversal of epithelial‐to‐mesenchymal transition. Oncotarget 2015;6:11421. [DOI] [PMC free article] [PubMed] [Google Scholar]
- 40.Schmalhofer O, Brabletz S, Brabletz T. E‐cadherin, β‐catenin, and ZEB1 in malignant progression of cancer. Cancer Metastasis Rev 2009;28:151–166. [DOI] [PubMed] [Google Scholar]
- 41.Patel AG, Kaufmann SH. How does doxorubicin work? eLife 2012;1:e00387. [DOI] [PMC free article] [PubMed] [Google Scholar]
- 42.Zhou Q, Abraham A, Li L et al. Topoisomerase IIα mediates TCF‐dependent epithelial‐mesenchymal transition in colon cancer. Oncogene 2016;35:4990–4999. [DOI] [PMC free article] [PubMed] [Google Scholar]
- 43.Waszut U, Szyszka P, Dworakowska D. Understanding mitotane mode of action. J Physiol Pharmacol 2017;68:13–26. [PubMed] [Google Scholar]


