

Abstract
Objective
Crohn's disease (CD) is characterised by inflammation, predominantly associated with ilea. To investigate the basis for this inflammation in patients with CD, we examined dendritic cells (DC) which are pivotal for maintenance of immunological tolerance in the gut.
Methods
Ileal biopsies and blood DCs from CD patients and controls were examined by microscopy and flow cytometry for PD‐L1 and PD‐L2 expression, as PD‐L1 has been implicated in colitis but the contribution of PD‐L2 is less clear. In vitro studies, of blood samples from CD patients, were used to demonstrate a functional role for PD‐L2 in disease pathogenesis.
Results
Quantitative microscopy of CD11c+ DCs in inflamed and noninflamed ilea from CD patient showed > 75% loss of these cells from the villi, lamina propria and Peyer's patches compared with non‐CD controls. Given this loss of DCs from ilia of CD patients, we hypothesised DCs may have migrated to the blood as these patients can have extra‐intestinal symptoms. We thus examined blood DCs from CD patients by flow cytometry and found significant increases in PD‐L1 and PD‐L2 expression compared with control samples. Microscopy revealed an aggregated form of PD‐L2 expression, known to drive Th1 immunity, in CD patients but not in controls. In vitro functional studies with PD‐L2 blockade confirmed PD‐L2 contributes significantly to the secretion of pro‐inflammatory cytokines known to cause disease pathogenesis.
Conclusion
Taken together, this study shows that PD‐L2 can influence the progression of CD and blockade of PD‐L2 may have therapeutic potential.
Keywords: Crohn's disease, dendritic cells, pathogenesis, programmed death‐1 ligand 2
The pathology of Crohn's disease is supported by excessive production of TNF‐α and INF‐γ production. This study shows that dendritic cells (DC) migrate away from the ileum of patients with Crohn's disease and that DCs in the blood of these patients overexpress PD‐L2 which can overdrive TNF‐α and INF‐γ production.
Introduction
Inflammatory bowel disease (IBD) is a group of inflammatory conditions in the colon and small intestine, with Crohn's disease (CD) and ulcerative colitis being the principal types. CD is a T‐cell‐mediated, chronic, transmural inflammatory disease predominantly involving the distal small intestine (ileum).1, 2 CD‐inflamed tissue is heavily infiltrated by activated leucocytes, and this population is predominantly composed of T cells. These cells predominantly synthesise Th1 cytokines, including IFN‐γ and TNF‐α1, 3 which have a primary role in promoting disease pathology.2, 3 Interestingly, a subset of CD11c+ dendritic cells (DC) in inflamed ileal mucosa are susceptible to LPS‐mediated TNF‐α secretion4 which may also contribute to pathology.
TNF‐α blockade (e.g. infliximab and adalimumab) has shown clinical benefit in managing the disease but 20–25% of patients with CD lost therapeutic responses at 12 weeks following commencement of anti‐TNF‐α therapy and between 30% and 60% lost responses by 12 months.5 The IL‐23 receptor is a major susceptibility gene for CD and has led to the development of an immunotherapy that targets this p40 protein subunit used by both the IL‐12 and IL‐23 cytokines (Ustekinumab). Similar to anti‐TNF‐α therapies for CD, this treatment demonstrates efficacy in a subgroup of patients with maintenance of response rates of ~ 50% at 12 months.6 Thus, new therapies and a deeper understanding of IBD pathogenesis are required.
Dendritic cells are a key player in the mucosal immune system, which provide a rapid initial response to pathogens, while their tolerogenic properties minimise immune response to commensal microflora.7 Previous studies showed that a DC subset transports self‐antigens from the ileum to T‐cell areas of mesenteric lymph nodes to maintain self‐tolerance.8 DCs maintain this immunological tolerance in the gut by their expression of PD‐L1 which interacts with PD‐1 on self‐reactive T cells to suppress autoimmunity.9, 10, 11 DCs and PD‐L1 were implicated as central players in IBD pathogenesis when administering PD‐L1 protein, protected mice from inflammatory colitis induced by dextran sulphate.12 In contrast, studies using a murine chronic colitis model induced by adoptive transfer of CD4+CD45RBhigh T cells into SCID mice found PD‐L1 blockade reduced inflammation.13 Similarly, PD‐L1 expression on CD90+ stromal cells of colonic mucosa of patients undergoing colectomy for CD was implicated in disease pathogenesis.14 However, the contribution of PD‐L2 to CD in the ileum is unclear.
An immunological study of PD‐1 during infections revealed that while PD‐L1 on DCs suppresses immune responses, PD‐L2 co‐expressed on DCs in an aggregated form can ‘naturally’ inhibit the PD‐L1 (DCs) to PD‐1 (T cells) immunosuppressive interaction15 to support inflammatory Th1 immune responses. Thus, in the presence of aggregated PD‐L2 on DCs, T cells continue to function and Th1 immunity is enhanced.
Previous studies showed changes to the distribution of CD68 macrophages16 and DCs17 during CD. Furthermore, DCs mediate gut tolerance8 and PD‐L1 protein reduces colitis in mice.12 This led us to hypothesise that CD may be a result of overexpression of PD‐L2 on DCs which prevented the PD‐L1 to PD‐1 axis from controlling pathogenic inflammation. In this current study, we examined localised ileal and systemic blood DCs from CD patients to investigate the contribution of PD‐L2 to inflammation and used peripheral blood mononuclear cells (PBMCs) from the same patients to investigate the role of PD‐L2 in facilitating systemic inflammation.
Results
Quantitative studies of biopsies from CD patients
Biopsies of noninflamed and inflamed ileum from CD patients and noninflamed ileum tissue from control patients were labelled for CD11c expression to identify DCs and their expression of PD‐L1 and PD‐L2, along with DAPI to identify the nuclei in all cells. The noninflamed ileum from CD patients was selected based on the absence of macroscopic damage or inflammation. The villi and lamina propria of inflamed and noninflamed ileal tissue from CD patients appeared to have fewer DCs compared with non‐CD controls (Figure 1a with additional examples in Supplementary figure 1). Significantly, compared with control ileum, DCs were also absent from the Peyer's patches (lymphatic nodules) in inflamed and noninflamed ileal tissue of CD patients (Figure 1b). This indicated the DCs in CD patients had not migrated from the villi and lamina propria to nodules.
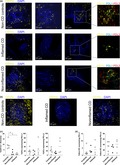
Figure 1.
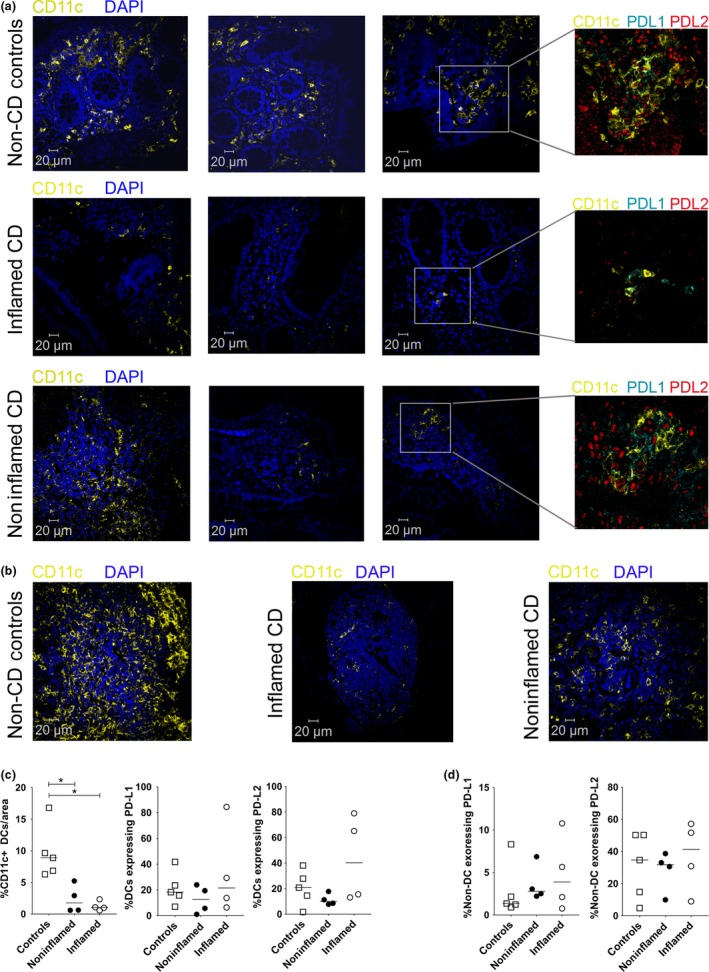
Loss of dendritic cells (DC) in the ileum during Crohn's disease (CD). Representative examples of ileum tissue labelled for CD11c (yellow), PD‐L1 (cyan), PD‐L2 (red) and DAPI (blue) from (a) controls or inflamed and noninflamed ileum tissue from CD patients. Replicate examples highlight the loss of CD11c+ DCs (yellow) between disease and nondiseased tissue. The inset box shows a higher magnification image of PD‐L1 and PD‐L2 expression on CD11c+ DCs. (b) Representative examples of Peyer's patches or lymphoid aggregates in controls or inflamed and noninflamed ileum tissue from CD patients labelled for CD11c (yellow) and DAPI (blue). (c) Graphical summary of the percentage of CD11c+ DCs per area in controls or inflamed and noninflamed ileum tissue from CD patients with their expression of PD‐L1 and PD‐L2. (d) Graphical summary of non‐DCs expressing PD‐L1 and PD‐L2. Scale bar for microscopy represents a 20 μm. Bars in the summaries represent median values. Significance was analysed using the nonparametric Mann–Whitney U‐test based on a one‐sided tail. (*P‐value = 0.0079; comparisons between groups).
The sections were then imaged and analysed using an automated system to quantify the average percentage of DCs present in biopsy sections. Same‐sized areas of villi, lamina propria and Peyer's patches were selected for automated analysis in each section. In control tissues, ~ 9.7% of all cells were CD11c‐expressing DCs and this percentage dropped to 1.25% in inflamed areas of patients with CD (P‐value < 0.0079) and 2.5% in noninflamed areas of the same CD patients (P‐value < 0.0079; Figure 1c). However, the percentage of DCs expressing PD‐L1 and PD‐L2 were similar between noninflamed controls and CD patient (inflamed, noninflamed) groups (Figure 1c). Similarly, there were no significant differences in percentages of non‐DCs (including stromal cells) expressing PD‐L1 or PD‐L2 (Figure 1d).
Overall, the data show that the percentages of CD11c+ DCs are diminished by > 75% (P‐value = 0.0079) in the inflamed and noninflamed ileum of CD patients compared with controls but the percentages of resident DCs and non‐DCs expressing of PD‐L1 and PD‐L2 were similar. A very significant loss of DCs in the ileum indicates a reduction in the capacity of the immune system to provide protection against pathogens as well as a potential absence of tolerogenic control. A loss of CD11c+ DCs, from inflamed ilea of CD patients, has been previously reported to be associated with leptin,17 an immunomodulatory adipokine18. However, we now show that noninflamed areas of ileum in CD patients, with no macroscopic damage or inflammation, also had fewer DCs, indicating that the loss of DCs may be a precursor to subsequent pathology.
PD‐L1 and PD‐L2 expression on blood DCs increases during CD
Given that the numbers of CD11c+ DCs in ilea from CD patients were lower than the control samples, DCs from mucosal tissues can recirculate in the blood and many CD patients will develop extra‐intestinal symptoms,19, 20, 21 and we next examined blood DCs by flow cytometry (Figure 2a). There were no significant differences in the percentage of DCs expressing PD‐L1 (Figure 2b) or PD‐L2 (Figure 2c) between controls and CD patients similar to quantification in the ileum by microscopy (Figure 1c). We noted that one patient on previous TNF‐blockade therapy who was included in error showed a marked reduction in percentage of DCs expressing PD‐L2 but not PD‐L1. However, the level of both PD‐L1 and PD‐L2 expressed on DCs (geometric mean fluorescence intensity; GMI) from CD patients was significantly increased compared with control samples (Figure 2d, e). Overall, these studies indicated that the expression of PD‐L1 and PD‐L2, which balances immune responses and immunological tolerance, was affected during CD.
Figure 2.
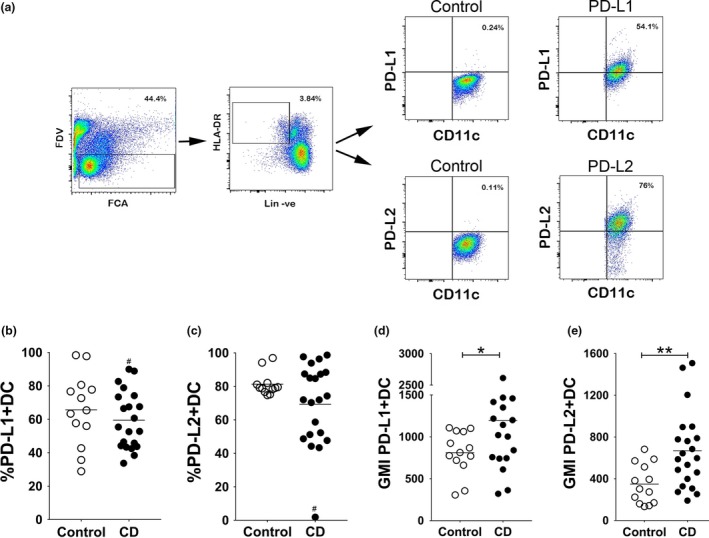
PD‐L2 expression on blood dendritic cells (DC) increases during Crohn's disease (CD). (a) Representative gating strategy used to assess PD‐L1 and PD‐L2 expression on CD11c+ DCs from blood by flow cytometry of a CD patient compared with the isotype control. (b, c) Scatter plot showing percentage of (b) PD‐L1+ and (c) PD‐L2+ DCs from control donors and CD patients. (d, e) Scatter plot showing geometric mean fluorescence intensity (GMI) of (d) PD‐L1‐expression and (e) PD‐L2‐expression on CD11c+ DCs from control donors and CD patients. One patient on previous TNF‐blockade therapy, included in error, is marked by the # symbol. Bars represent mean percentage or GMI (N = 13–20). Significance was analysed using the nonparametric Mann–Whitney U‐test based on a two‐sided tail. (*P‐value = 0.0292; **P‐value = 0.0032; comparisons between groups).
Blood DC microscopy
A recent study showed that while PD‐L1 expressed by DCs attenuates immune responses, PD‐L2 co‐expression regulates immune responses by inhibiting the binding of PD‐L1 to PD‐1 to enhance Th1 immune responses.15 Of note, PD‐L2 on DCs was expressed as locally enriched aggregates (clusters) that colocalised with PD‐L1, which was also expressed all over the surface of the cell. We thus isolated peripheral blood DCs from control donors and CD patients to visualise PD‐L1 and PD‐L2 expression by confocal microscopy (Figure 3). Blood DCs from controls had an overall speckled expression of PD‐L1 and PD‐L2, spread across the cell surface (Figure 3a). However, CD patients had varying levels of PD‐L1 expression ranging from high to levels undetectable by microscopy, while PD‐L2 expression was generally polarised and appeared as aggregates (Figure 3b; arrows). PD‐L2 could also be found colocalising with PD‐L1 within the aggregates. Overall, microscopic assessment of DCs indicated that CD patients have increased levels of PD‐L2, which tend to be in aggregates that could contribute to inflammation.15
Figure 3.
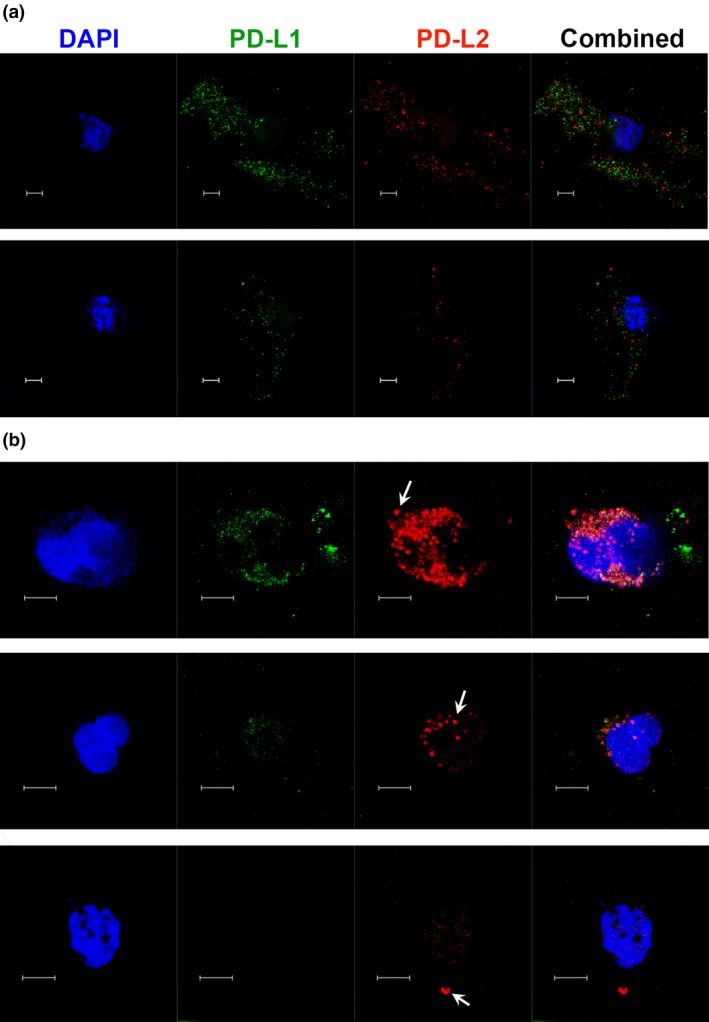
Microscopy of blood dendritic cells (DC) from Crohn's disease (CD) patients shows increased PD‐L2 expression. Microscopy shows PD‐L1 (green) and PD‐L2 (red) expression with nuclei labelled with DAPI (blue), on DCs isolated from blood of (a) control (HC) donors and (b) three representative CD patients. Images are maximum intensity projections of multiple z‐stack sections. Arrows indicate expression of PD‐L2 as aggregates. Scale bar represents 5 μm.
PD‐L2 blockade
To determine whether the increased expression of aggregated PD‐L2 on DCs from CD patients was associated with the production of inflammatory cytokines which damage the ileum, we undertook in vitro studies. Because of the significant limitation of blood volumes that can be obtained from CD patients with active disease, a simple blockade study with PBMCs was undertaken. PBMCs from 14 CD patients were cultured with anti‐CD3 to mimic TCR activation. We hypothesised that increased PD‐L2 expression on blood DCs (Figures 2e and 3b) inhibited the PD‐L1/PD‐1‐mediated control of inflammation and that PD‐L2 blockade would re‐instate immune suppression. Thus, control IgG or anti‐PD‐L2 antibodies were added to cultures of PBMC from CD patients to stop PD‐L2 and permit PD‐L1‐mediated blockade of cytokine production (Figure 4).
Figure 4.
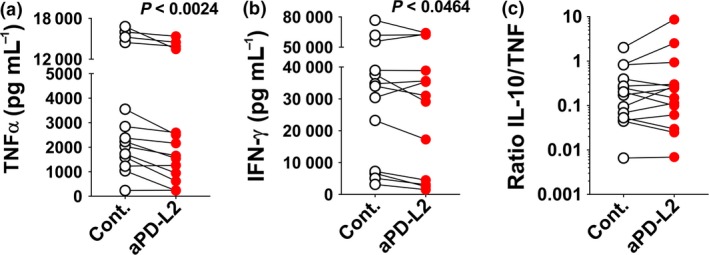
PD‐L2 inhibition reduces pro‐inflammatory cytokine production. (a, b) Mean concentration of (a) TNF‐α (pg mL−1) and (b) IFN‐γ (pg mL−1) is shown for PBMCs from patients with Crohn's disease (N = 14) cultured for 36 h with control IgG or anti‐PD‐L2 antibody. (c) Plot showing the ratio of IL‐10: TNF‐α. Significance between matched PBMC samples treated with control IgG or anti‐PD‐L2 antibody was analysed by the Wilcoxon matched‐pairs signed rank test.
Peripheral blood mononuclear cells from all CD patients secreted TNF‐α (Figure 4a) and IFN‐γ (Figure 4b) following in vitro stimulation. After PD‐L2 blockade, samples from 92% of patients showed a significant reduction in TNF‐α (one sample with very low secretion was excluded) and 71% showed a reduction in secretion in IFN‐γ (Figure 4a, b). In contrast, while some patients showed a concomitant increase in IL‐10 secretion, the ratio of immunosuppressive IL‐10 to inflammatory TNF‐α (Figure 4c) did not change significantly. Overall, 92% of samples from CD patients showed a significant reduction in TNF‐α and/or IFN‐γ production in response to PD‐L2 blockade in culture. This study highlighted the anti‐inflammatory potential of using PD‐L2 blockade as a therapy for CD.
Discussion
Dendritic cells are a key player in the mucosal immune system, where they provide a rapid initial response to pathogens but their tolerogenic properties minimise immune response to commensal microflora.7 As T cells have been implicated in driving the chronic, transmural inflammatory disease in the ileum,1, 2 we examined any potential contribution by DCs. Our quantitative microscopy study of inflamed and noninflamed ileal tissue in CD patients shows a > 75% loss of DCs from the villi and lamina propria. This indicates a very significant loss in the capacity of the ileal tissue to provide protection against pathogens as well as a potential absence of tolerogenic control. Given the loss of DCs in the ilea, we examined DCs in the blood of CD patients and found increased expression of PD‐L1 and PD‐L2 compared with controls. Significantly, blood DCs from CD patients showed an increased expression of PD‐L1 and PD‐L2 which balance immune activation with regulation. The DCs from CD patients expressed a more aggregated form of PD‐L2 compared with speckled expression in non‐CD controls, supporting a role for PD‐L2 in exacerbating Th1 immune responses.15 The inflammation in CD patients was at least partially mediated by PD‐L2 as in vitro PD‐L2‐blockade studies showed a reduction in inflammatory cytokines. Thus, PD‐L2 was implicated in CD.
Sensitive, multicolour tyramide fluorescent labelling with automated analysis revealed that CD patients have fewer DCs at the site of inflammation and noninflammation than controls (Figure 1a–c). Significantly, these noninflamed areas showed no macroscopic damage or inflammation, indicating that the loss of DCs may be a precursor to subsequent damage. Furthermore, PD‐L1 and PD‐L2 are important immune regulators, and during CD, their expression was maintained on resident DCs in the ileum but quantification of blood DCs by flow cytometry showed significant increases in their levels of expression. A previous study in mice reported that PD‐L1‐Fc protein could be used as a therapy for colitis.12 However, our study suggests that there is no lack of PD‐L1 per se, but rather a loss of immunoregulatory DCs in the ileum of CD patients. Studies are now required to understand the reason for the loss of DCs in the ileum during CD, to repair the underlying problem for a more lasting treatment for this disease.
A longitudinal study of intestinal T lymphocyte subsets during CD, at first presentation and over time, revealed increased percentages of CD4+ T cells, regulatory T cells and central memory T cells, with lower percentages of CD8+ T cells and CD103+ T cells, compared with healthy controls or endoscopic inactive IBD.22 PD‐L2 is generally expressed on antigen‐presenting cells including DCs as wells as activated T cells and B cells.23, 24, 25 A previous study examined PD‐L1 and PD‐L2 expression on CD90+ stromal cells in human colonic mucosa tissue and found lower expression of PD‐L1 but not PD‐L2.14 We focussed on DCs in the ilea and blood of patients, as previous studies have shown that aggregated PD‐L2 on DCs is essential for Th1 immunity15 which drives CD pathology. While we found no differences in PD‐L2 levels in the ilea from CD patients with controls, flow cytometry studies of blood DCs showed increased levels of PD‐L2 while microscopy confirmed the protein is aggregated. This suggests systemic DCs could potentially mediate systemic Th1 immune responses to explain extra‐intestinal symptoms known to occur during CD. Furthermore, PD‐L2 blockade in cultures of PBMCs reduced Th1 cytokines (TNF‐α and IFN‐γ), indicating a role for PD‐L2 in the pathology of CD. However, given that activated T cells can also express PD‐L2 but these cells were not investigated in our study, we cannot rule out if targeting PD‐L2 on T cells in cultures contributed to reduced cytokine production.
In CD, there is a predominant synthesis of Th1 cytokines, including IFN‐γ and TNF‐α.1, 3 TNF‐α blockade (e.g. infliximab and adalimumab) has shown clinical benefit in managing the disease but 20–25% of patients lost response at 12 weeks following commencement of anti‐TNF‐α treatment and between 30% and 60% lost response by 12 months.5 Furthermore, the IL‐23 receptor is a major susceptibility gene for CD and has led to the development of an anti‐p40 immunotherapy that targets this pathway (Ustekinumab). Similar to anti‐TNF‐α therapies for CD, this treatment demonstrates efficacy in a subgroup of patients with maintenance of response rates of ~ 50% at 12 months.6 Significantly, the selection of patients for immunological treatments is based upon dated and subjective disease activity criteria. However, because of increased infection risks, inefficacy in some patients, variable uptake as well as high costs, an assay capable of predicting responses to treatment and then monitoring progression would be a major advance, allowing for decisions around safety and overall cost–benefit tailored to the individual patient.26 As PD‐L1 and PD‐L2 levels were significantly increased on blood DCs of CD patients, we propose that their expression on blood DCs in combination with other markers (e.g. faecal calprotectin levels and CRP) could form the basis of a predictive indicator of CD progression and (potentially) responses to treatment. Thus, the use of PD‐L1 and PD‐L2 as a predictive indication warrants further investigation.
In conclusion, our study of CD patients firstly shows that DC numbers are significantly reduced in the ilea (Figure 1c) which may be due to migration away from the ileum or in situ loss of these cells. Secondly, we show that PD‐L2 has a role in driving TNF‐α and IFN‐γ production, as PD‐L2 blockade reduces but does not abolish secretion of these cytokines in culture studies. This may be an advantage as total blockade of TNF‐α is associated with an increased risk of infectious diseases and malignancies. PD‐L2 blockade may therefore be a potential new avenue for managing CD.
Methods
Human Research Ethics approval
Colonoscopy was performed on patients with a diagnosis of ileal CD, or on controls undergoing colorectal cancer family history screening. Blood was collected from 29 CD patients and 13 non‐IBD controls. Patients with IBD were selected at different stages of treatment but excluded following anti‐TNF‐α treatment. All subjects provided written informed consent, and the study was approved by the Human Research Ethics Committees of the Royal Brisbane and Women's Hospital, Brisbane, Australia, and the QIMR Berghofer Medical Research Institute.
Details of Patients
| Number | Age at time of samples taken | Gender | Disease location LFU | Disease behaviour LFU |
|---|---|---|---|---|
| 1 | 43 | Male | L1 | B3 |
| 2 | 50 | Female | L2 | B2 |
| 3 | 27 | Male | L1 | B1 |
| 4 | 45 | Male | L3 | B2 |
| 5 | 55 | Male | L3 | B2 |
| 6 | 20 | Male | L3 | B1 |
| 7 | 23 | Male | L1 | B2 |
| 8 | 53 | Male | L1 | B2 |
| 9 | 29 | Male | Unknown | Unknown |
| 10 | 32 | Male | L3 | B1 |
| 11 | 47 | Male | L1 | B3 |
| 12 | 43 | Male | L1 | B3 |
| 13 | 44 | Female | L1 | B3 |
| 14 | 67 | Male | L1 | B2 |
| 15 | 58 | Female | L3 | B3 |
| 16 | 54 | Male | L1 | B3 |
| 17 | 38 | Male | L1 | B2 |
| 18 | 56 | Male | L1 | B3 |
| 19 | 49 | Female | L3 | B1 |
| 20 | 58 | Male | L1 | B2 |
| 21 | 27 | Female | L2 | B2 |
| 22 | 52 | Female | L1 | B3 |
| 23 | 77 | Female | L3 | B3 |
| 24 | 29 | Female | L3 | B3 |
| 25 | 53 | Male | L1 | B3 |
| 26 | 28 | Male | L1 | B3 |
| 27 | 38 | Male | L1 | B2 |
| 28 | 29 | Male | L1 | B2 |
| 29 | 21 | Male | L1 | Unknown |
Montreal classification of CD. Location: L1, ileal; L2, colonic; L3, ileocolonic. Behaviour: B1, nonstricturing, nonpenetrating; B2, stricturing; B3, penetrating; LFU, last follow‐up.
Depending on the volume of blood obtained from each patient, samples were prepared for flow cytometry and/or culture studies.
Preparation of peripheral blood mononuclear cells
Human PBMCs were isolated from heparinised blood by density centrifugation on Ficoll‐Paque (Pharmacia, Freiburg, Germany). Briefly, 10 mL of freshly drawn blood treated with ammonium heparin was diluted in phosphate‐buffered saline 1:1 and well mixed. A total of 20 mL diluted blood was then carefully layered over 18 mL of Ficoll‐Paque. The tubes were centrifuged without brakes at 400 g for 30 min at 20°C. The interphase containing mononuclear cells was transferred into a new Falcon tube, washed and cryopreserved in liquid nitrogen, until required.
Cryopreserved PBMCs were thawed in warmed R10 medium (RPMI‐1640 containing 10% FBS) and washed twice, and the final pellet was resuspended in FACS staining buffer. Cells were counted using a Neubauer chamber. Only viable cells were counted, using Trypan blue exclusion. The cells were resuspended in FACS staining buffer at a concentration of 2 × 10⁶ cells in 100 μL.
Flow cytometric analysis
Single cell suspensions obtained from PBMCs were incubated with an Fc receptor binding antibody to block nonspecific Fc binding by specific antibodies. Fixable Viability Dye eFluor780 (ebioscience, San Diego, CA, USA) was used to exclude dead cells from analysis. Serial dilutions of each antibody were pretested by flow cytometry to determine the optimal concentration for the main assay. The following anti‐human monoclonal antibodies were used to assess cells: HLA‐DR PerCP‐Cy5.5 (clone G46‐6; BD Bioscience, San Jose, CA, USA); lineage cocktail BV510 [CD3 (clone OKT3)/CD14 (clone M5E2)/CD16 (clone 3G8)/CD19 (clone HIB19)/CD20 (clone 2H7)and CD56 (clone HCD56)]; CD11c BV605 (clone 3.9; BioLegend, San Diego, CA, USA). Anti‐human PD‐L2 monoclonal antibody (clone MIH18; BioLegend) and anti‐human PD‐L1 monoclonal antibody (clone 29E.2A3; BioLegend) were labelled in‐house using the Lightning‐Link Rapid DyLight 647 and Lightning‐Link Rapid DyLight 488, respectively (BioNovus Life Sciences, Cherrybrook, NSW, Australia). Acquisition of data was performed using a BD LSR Fortessa flow cytometer and BD FACSDiva software (Becton, Dickinson and Company, Franklin Lakes, NJ, USA). Analysis of data was performed using FCS express (De Novo software, Glendale, CA, USA) or FlowJo (Tree Star; a subsidiary of Becton, Dickinson and Company, Ashland, OR, USA).
Microscopy
Formalin‐fixed, paraffin‐embedded whole tissues were derived from ileal biopsies taken from CD patients. These were immunolabelled with CD11c, PD‐L1, PD‐L2 and DAPI using the tyramide signal amplification fluorescence kits (according to manufacture instruction). The Vectra Automated Quantitative Pathology Imaging System with InForm (PerkinElmer, Hopkinton, MA, USA) and FSC express software was used to quantify DCs expressing CD11c, PD‐L1 and PD‐L2. The control samples were noninflamed ileum.
Isolation of blood DCs for microscopy was carried out using the blood DC isolation kit II (Miltenyi Biotec, Bergisch Gladbach, Germany), as per manufacturer's instructions. Isolated DCs were placed on chamber slides, fixed with 2% paraformaldehyde and labelled with fluorescent antibodies against PD‐L1 and PD‐L2. Multiple z‐stack images were acquired using 63×/100× objectives (NA1.4 on a Zeiss 780 Laser scanning confocal microscopy and images were processed with Zen software; Carl Zeiss Microscopy, Oberkochen, Germany). Images shown in Figure 3 are maximum intensity projections of these multiple z‐stack sections.
PD‐L2 blocking assay
Isolated PBMCs (2 × 10⁵ cells per well) from control and CD patients were added to wells precoated with anti‐CD3. R10 media used for culture assay was supplemented with penicillin (100 IU mL−1), streptomycin (0.1 mg mL−1) and L‐glutamine (0.29 g L−1). Control IgG or blocking anti‐PD‐L2 (MIH18) antibodies were added to the culture at 20 μg mL−1. After 36 h, cell‐free culture supernatants were harvested, and multiple aliquots were stored at −80°C until assayed. TNF‐α, IFN‐γ and IL‐10 production (in pg mL−1) was determined using the LEGENDplex™ human Th1 5‐plex panel (Biolegend). The lower limits of detection in pg mL−1 were as follows: TNF‐α (0.9 ± 0.6), IFN‐γ (1.3 ± 1.1) and IL‐10 (0.9 ± 0.4) with the upper limit being 10 000 pg mL−1. Samples with cytokine levels above the limit of detection were diluted and assays rerun. Acquisition of data was performed using a BD LSR Fortessa flow cytometer and BD FACSDiva software. Analysis of data to calculate the concentration of each cytokine was performed using LEGENDplex software.
Statistical methods
Except where otherwise noted, the data are shown as the mean ± SEM. Statistical analysis was performed using GraphPad Prism 7 (GraphPad software, San Diego, CA, USA). Tests used for each assay is noted in the corresponding figure legend.
Supplemental material
Supplemental data include additional images to support those presented in Supplementary Figure 1 and FMO for Supplementary Figure 2.
Conflict of interest
The authors declare no conflict of interest.
Author contributions
RF, JL, DK, CW and THN undertook experimentation. LS and AE sought informed consent forms, ethics applications and collection of samples. MW and GRS were involved in various aspects of designing the study, discussion and interpretation of the data and writing of the manuscript.
Supporting information
Acknowledgments
We sincerely thank the donors who provided samples for our study. This work was supported by grants from The National Health and Medical Research Council and QIMR Berghofer Medical Research Institute.
Contributor Information
Graham Radford‐Smith, Email: graham.radford-smith@qimrberghofer.edu.au.
Michelle Wykes, Email: michelle.wykes@qimrberghofer.edu.au.
References
- 1. Peluso I, Pallone F, Monteleone G. Interleukin‐12 and Th1 immune response in Crohn's disease: pathogenetic relevance and therapeutic implication. World J Gastroenterol 2006; 12: 5606–5610. [DOI] [PMC free article] [PubMed] [Google Scholar]
- 2. Fuss IJ, Neurath M, Boirivant M et al Disparate CD4+ lamina propria (LP) lymphokine secretion profiles in inflammatory bowel disease. Crohn's disease LP cells manifest increased secretion of IFN‐γ, whereas ulcerative colitis LP cells manifest increased secretion of IL‐5. J Immunol 1996; 157: 1261–1270. [PubMed] [Google Scholar]
- 3. Parronchi P, Romagnani P, Annunziato F et al Type 1 T‐helper cell predominance and interleukin‐12 expression in the gut of patients with Crohn's disease. Am J Pathol 1997; 150: 823–832. [PMC free article] [PubMed] [Google Scholar]
- 4. de Baey A, Mende I, Baretton G et al A subset of human dendritic cells in the T cell area of mucosa‐associated lymphoid tissue with a high potential to produce TNF‐α. J Immunol 2003; 170: 5089–5094. [DOI] [PubMed] [Google Scholar]
- 5. Macaluso FS, Fries W, Privitera AC et al A propensity score‐matched comparison of infliximab and adalimumab in TNF‐α inhibitors naïve and non‐naïve patients with Crohn's disease: real‐life data from the Sicilian Network for Inflammatory Bowel Disease (SN‐IBD). J Crohns Colitis 2018; 12: S399. [DOI] [PubMed] [Google Scholar]
- 6. Feagan BG, Sandborn WJ, Gasink C et al Ustekinumab as induction and maintenance therapy for Crohn's disease. N Engl J Med 2016; 375: 1946–1960. [DOI] [PubMed] [Google Scholar]
- 7. Bates J, Diehl L. Dendritic cells in IBD pathogenesis: an area of therapeutic opportunity? J Pathol 2014; 232: 112–120. [DOI] [PMC free article] [PubMed] [Google Scholar]
- 8. Huang F‐P, Platt N, Wykes M et al A discrete subpopulation of dendritic cells transports apoptotic intestinal epithelial cells to T cell areas of mesenteric lymph nodes. J Exp Med 2000; 191: 435–444. [DOI] [PMC free article] [PubMed] [Google Scholar]
- 9. Freeman GJ, Long AJ, Iwai Y et al Engagement of the PD‐1 immunoinhibitory receptor by a novel B7 family member leads to negative regulation of lymphocyte activation. J Exp Med 2000; 192: 1027–1034. [DOI] [PMC free article] [PubMed] [Google Scholar]
- 10. Brown JA, Dorfman DM, Ma FR et al Blockade of programmed death‐1 ligands on dendritic cells enhances T cell activation and cytokine production. J Immunol 2003; 170: 1257–1266. [DOI] [PubMed] [Google Scholar]
- 11. Latchman YE, Liang SC, Wu Y et al PD‐L1‐deficient mice show that PD‐L1 on T cells, antigen‐presenting cells, and host tissues negatively regulates T cells. Proc Natl Acad Sci USA 2004; 101: 10691–10696. [DOI] [PMC free article] [PubMed] [Google Scholar]
- 12. Song MY, Hong CP, Park SJ et al Protective effects of Fc‐fused PD‐L1 on two different animal models of colitis. Gut 2015; 64: 260–271. [DOI] [PubMed] [Google Scholar]
- 13. Kanai T, Totsuka T, Uraushihara K et al Blockade of B7‐H1 suppresses the development of chronic intestinal inflammation. J Immunol 2003; 171: 4156–4163. [DOI] [PubMed] [Google Scholar]
- 14. Beswick EJ, Grim C, Singh A et al Expression of programmed death‐ligand 1 by human colonic CD90+ stromal cells differs between ulcerative colitis and Crohn's disease and determines their capacity to suppress Th1 cells. Front Immunol 2018; 9: 1125. [DOI] [PMC free article] [PubMed] [Google Scholar]
- 15. Karunarathne DS, Horne‐Debets JM, Huang JX et al Programmed death‐1 ligand 2‐mediated regulation of the PD‐L1 to PD‐1 axis is essential for establishing CD4+ T cell immunity. Immunity 2016; 45: 333–345. [DOI] [PubMed] [Google Scholar]
- 16. Sarsfield P, Jones DB, Wright DH. Accessory cells in Crohn's disease of the terminal ileum. Histopathology 1996; 28: 213–219. [DOI] [PubMed] [Google Scholar]
- 17. Silva MA, Lopez CB, Riverin F, Oligny L, Menezes J, Seidman EG. Characterization and distribution of colonic dendritic cells in Crohn's disease. Inflamm Bowel Dis 2004; 10: 504–512. [DOI] [PubMed] [Google Scholar]
- 18. Al‐Hassi HO, Bernardo D, Murugananthan AU et al A mechanistic role for leptin in human dendritic cell migration: differences between ileum and colon in health and Crohn's disease. Mucosal Immunol 2013; 6: 751–761. [DOI] [PMC free article] [PubMed] [Google Scholar]
- 19. Rispo A, Scarpa R, Di Girolamo E et al Infliximab in the treatment of extra‐intestinal manifestations of Crohn's disease. Scand J Rheum 2005; 34: 387–391. [DOI] [PubMed] [Google Scholar]
- 20. Ephgrave K. Extra‐intestinal manifestations of Crohn's disease. Surg Clin North Am 2007; 87: 673–680. [DOI] [PubMed] [Google Scholar]
- 21. Hervouet C, Luci C, Bekri S et al Antigen‐bearing dendritic cells from the sublingual mucosa recirculate to distant systemic lymphoid organs to prime mucosal CD8 T cells. Mucosal Immunol 2014; 7: 280–291. [DOI] [PubMed] [Google Scholar]
- 22. Smids C, Horjus Talabur Horje CS, Drylewicz J et al Intestinal T cell profiling in inflammatory bowel disease: linking T cell subsets to disease activity and disease course. J Crohns Colitis 2018; 12: 465–475. [DOI] [PubMed] [Google Scholar]
- 23. Latchman Y, Wood CR, Chernova T et al PD‐L2 is a second ligand for PD‐1 and inhibits T cell activation. Nat Immunol 2001; 2: 261–268. [DOI] [PubMed] [Google Scholar]
- 24. Yamazaki T, Akiba H, Iwai H et al Expression of programmed death 1 ligands by murine T cells and APC. J Immunol 2002; 169: 5538–5545. [DOI] [PubMed] [Google Scholar]
- 25. Messal N, Serriari NE, Pastor S, Nunes JA, Olive D. PD‐L2 is expressed on activated human T cells and regulates their function. Mol Immunol 2011; 48: 2214–2219. [DOI] [PubMed] [Google Scholar]
- 26. Reenaers C, Belaiche J, Louis E. Impact of medical therapies on inflammatory bowel disease complication rate. World J Gastroenterol 2012; 18: 3823–3827. [DOI] [PMC free article] [PubMed] [Google Scholar]
Associated Data
This section collects any data citations, data availability statements, or supplementary materials included in this article.
Supplementary Materials