

Abstract
Nanopore DNA sequencing is limited by low base calling accuracy. Improved base-calling accuracy has so far relied on specialized base-calling algorithms, different nanopores and motor enzymes, or biochemical methods to re-read DNA molecules. Two primary error modes hamper sequencing accuracy: enzyme mis-steps and sequences with indistinguishable signals. We vary the driving voltage across an MspA nanopore between 100 to 200 mV with a frequency of 200 Hz, changing how the DNA strand moves through the nanopore. As a DNA helicase moves the DNA through the nanopore in discrete steps, the variable voltage positions the DNA continuously between these steps. The resulting electronic signal can be analysed to overcome the primary error modes in base-calling. Single-passage de novo base-calling accuracy in our device increases from 62.7 ± 0.5% with a constant driving voltage to 79.3 ± 0.3% with a variable driving voltage. Our variable-voltage sequencing mode is complementary to other advances in nanopore sequencing and is amenable to incorporation into other enzyme-actuated nanopore sequencing devices.
Editor’s summary
The accuracy of nanopore DNA sequencing is substantially improved by application of a variable-voltage sequencing mode.
Third-generation single-molecule nanopore DNA sequencing technology1,2 can be applied to generate very long contiguous reads3,4 and to directly detect non-canonical bases5 and epigenetically-relevant modified bases6–8 at low cost and with minimal sample preparation or instrumentation9,10. Enzyme-actuated nanopore DNA and RNA sequencing devices are now commercially available, demonstrating the potential of this technology as a stand-alone DNA sequencing platform11. Nanopore sequencing has been successfully applied to species and pathogen identification12–14, epigenetic mapping15, outbreak tracking16–18 and metagenomic sequencing19,20.
In enzyme-actuated nanopore strand sequencing2,21, a single nanometer-scale protein pore (“nanopore”) is inserted into a membrane that separates two wells (cis and trans), each of which are filled with a buffered, conductive electrolyte solution1,2,21 (Fig 1a). The nanopore provides the lone conductive pathway between the two wells. When a voltage is applied across the membrane, an ionic current flows through the pore. DNA molecules, which are poly-negatively charged, are drawn into, and then through the pore by the voltage. As the DNA passes through the pore, it partially blocks the ionic current flow, reducing the conductance of the pore to a value dependent on the specific nucleotides present within the narrowest constriction of the pore. A DNA-translocating motor protein such as a DNA polymerase2,21 or helicase22 binds to the DNA, comes to rest on the pore, and restricts the DNA’s translocation to discrete steps. The discrete enzyme steps incrementally pause translocation long enough to resolve the sequence-dependent modulations in the conductance signal. A change-point detection algorithm detects enzyme steps in the raw conductance signal, then a base calling algorithm decodes the segmented conductance signal into the DNA sequence.
Figure 1.
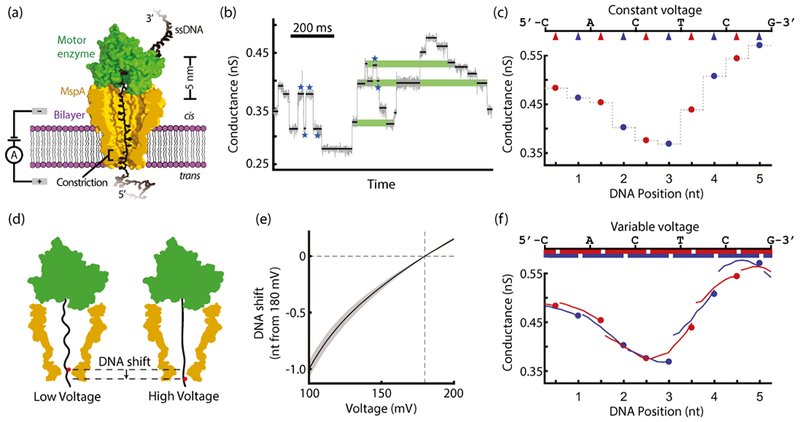
Basic principles of variable-voltage nanopore sequencing (a) A lone MspA nanopore (gold) inserts into a lipid bilayer (purple) separating two chambers, cis and trans. A Hel308 helicase motor enzyme (green) controls the motion of ssDNA (black) through the pore while we apply a voltage across the bilayer and measure the conductance through the pore. (b) A segment of constant-voltage nanopore data (gray data, downsampled to 500 Hz) shows several common sequencing error modes. The overlaid black lines show the mean conductance at each enzyme step. Blue stars mark the locations of enzyme missteps. Green bars highlight indistinguishable conductance states generated by distinct DNA sequences. (c) In constant-voltage sequencing, we sample the conductance of the DNA-blockaded pore at discrete locations (red and blue arrows) along the DNA sequence (top). The resulting signal is a time-ordered series of mean conductance values, one for each enzyme step (red and blue points; gray line to guide the eye). Red points mark odd-numbered half-nucleotide steps by the Hel308 helicase and blue points mark even-numbered steps. (d) Applying different voltages changes the pulling force on the DNA. Higher forces cause the DNA to extend further, shifting the DNA within the constriction of the pore and changing the DNA bases affecting the conductance. This cartoon shows a DNA base (red dot) changing position when the applied voltage is increased. (e) The range of applied voltages in our variable-voltage experiments (100 mV to 200 mV) shifts the DNA position in the pore by more than a full nucleotide. The position shift is relative to the DNA position at 180 mV. The shaded region shows the standard deviation of the position shift measurement. (f) Variable-voltage sequencing samples the conductance of the DNA-blockaded pore continuously along the DNA sequence (top). Red and blue bars (top) show the overlapping ranges along the DNA molecule probed during the voltage swing at odd (red) and even (blue) enzyme steps. In the resulting signal, each enzyme step is characterized by a conductance vs. DNA position curve (red and blue curves), rather than by a single mean conductance as in constant-voltage sequencing (red and blue points).
Nanopore sequencing is limited by a low single-passage de novo sequencing accuracy compared with other established sequencing platforms23,24. Improved accuracy can be achieved by combining multiple high-error nanopore reads to produce a consensus sequences with fewer errors11. However, this approach trades throughput for accuracy, and is still limited by systematic errors. Additionally, some nanopore applications, such as pathogen detection at low concentrations, or metagenomics studies, ideally need to be able to identify a single molecule of DNA with only one read. Therefore, the path toward fully realized nanopore sequencers requires improvement of the baseline single-passage accuracy.
Most of the single-passage sequencing errors can be attributed to two error modes: distinct sequences with indistinguishable conductance signals and irregular steps by the motor enzyme (Fig 1b). To decode an observed signal, the base-calling algorithm must use a model of the blockaded pore conductance that maps observed conductance values to the most likely DNA sequence3. The conductance through the nanopore is influenced by several nucleotides near the constriction of the pore2,25, resulting in a complex map of conductance to the underlying sequence. In many instances, different sequence segments generate statistically indistinguishable conductance values, thereby leading to error-prone base calls (Fig 1b, green bars).
Irregular stepping by the DNA-controlling motor enzyme can also introduce sequencing errors. Ideally, the DNA-controlling enzyme would move DNA unidirectionally through the pore in discrete steps of uniform length. However, the stochastic stepping of enzymes frequently diverges from this ideal behavior26. In addition to regular forward steps, “skips” can occur when multiple forward steps occur in quick succession, too fast to electronically resolve the intermediate step or steps. Additionally, “backsteps” can occur when the enzyme backtracks to a previously observed position along the DNA (Fig 1b, blue stars). The existence of irregular enzyme steps means that the observed time order of conductance states does not necessarily match the base order in the DNA, and no part of the nanopore signal clearly distinguishes these steps from regular processive behavior. This problem makes finding the true sequence from the observed conductance states difficult, and causes sequencing errors.
We hypothesized that replacing the constant bias voltage with a time-varying voltage would substantially reduce the impact of both of these error modes. In our sequencing experiments, we used Mycobacterium smegmatis porin A (MspA) as our nanopore. MspA has a single narrow constriction region that is ideally suited to resolve nucleotide-long enzyme steps along single-stranded DNA27,28 (ssDNA). We used the Hel308 DNA helicase enzyme from Thermococcus gammatolerans EJ3 (hereafter referred to as Hel308) as the motor enzyme to control DNA translocation through the pore. Hel308 has been observed to take two steps per nucleotide as it translocates along ssDNA, with each step approximately a half nucleotide in length22. These half-nucleotide steps provide two conductance measurements per nucleotide (Fig 1c).
Positive voltage applied across the nanopore generates a force on the DNA threaded through the pore. Varying the magnitude of this voltage changes the force pulling on the DNA. The force stretches the section of DNA between the DNA-binding sites within Hel308 and the high field region at the nanopore’s constriction22. Increasing the applied voltage elongates the DNA and shifts the relative position of the DNA in the constriction (Fig 1d). A voltage change from 100 mV to 200 mV repositions the DNA in the pore by slightly more than a full nucleotide (Fig. 1e, Supplementary Note 1). Thus, the applied voltage serves as a fine control over the DNA position in the pore.
The fine DNA position control using the variable-voltage complements the discrete stepping of the motor enzyme. We combine the enzyme and voltage control methods by replacing the constant applied voltage with a 200 Hz, symmetric triangle waveform voltage from 100 to 200 mV. The positive overall bias is necessary to keep the DNA-enzyme complex held on top of the pore. The 200 Hz triangle wave frequency goes through several cycles for each Hel308 step (average rate ~20 steps/s in our sequencing conditions, Supplementary Note 2). While the motor enzyme steps along the entire length of the DNA, the changing voltage repositions the DNA incrementally within each enzyme step. Together, the enzyme steps and the variable-voltage sample the effect of the DNA on the pore’s conductance nearly continuously along the DNA (Fig 1f).
In the constant-voltage signal, the pore conductance is probed only at a single DNA position at each enzyme step. Each step is thus only characterized by a single value: the conductance at that DNA position (Fig 2a, b; upper). Variable-voltage sequencing instead probes the conductance continuously over a ~1 nucleotide long range at each enzyme step, characterizing each step by a conductance vs. position curve (Fig 2a, b; lower). These curve segments provide additional identifying information as to the generating DNA sequence compared to the mean conductance alone (Supplementary Note 3) . Two sequences with nearly identical conductance values in the constant-voltage mode can be distinguished based on the shape of the curves generated by the variable-voltage (Fig. 2a, orange highlights).
Figure 2.
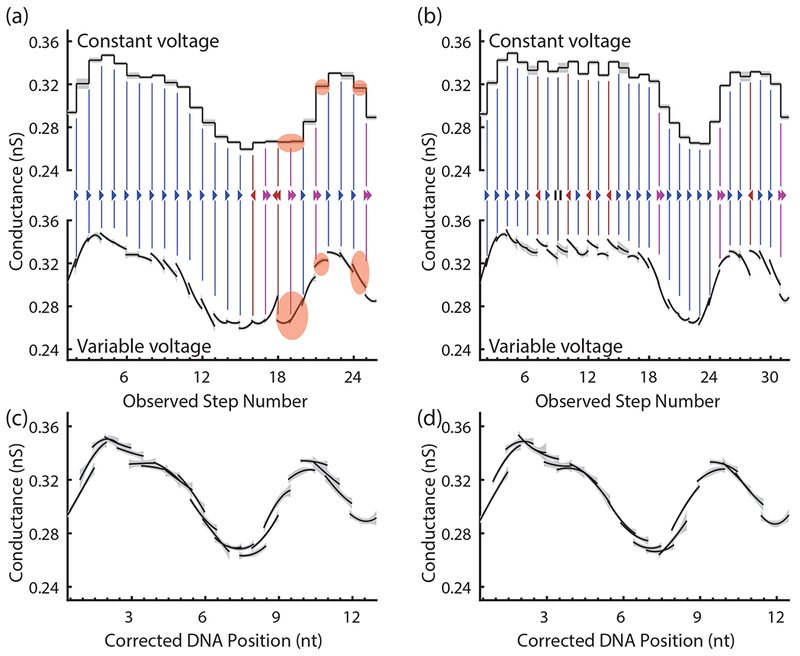
Error correction in variable-voltage sequencing. (a) and (b) compare the measured conductance vs. position curve segments of two typical variable-voltage reads (bottom) of the same DNA sequence to a reproduction of the corresponding constant-voltage reads (top), created by extracting the conductance of these segments at 180 mV only. Nearly identical conductances at 180 mV are easily distinguishable when the full conductance vs. position curves are compared (states highlighted in orange). Enzyme stepping errors are inferred from discontinuities in the curve and identification of repeated curve segments. These are marked with blue right arrows (forward steps), magenta double right arrows (skips), red left arrows (backsteps), and black pause symbols (hold steps). Shaded regions show the standard deviation of each conductance measurement. (c) and (d) show these reads after correction of the identified enzyme stepping errors. Although the uncorrected reads look dissimilar, the corrected reads are almost identical and will be decoded into the same DNA sequence.
The variable-voltage signal also provides information about the correct ordering of the measured enzyme steps and can be used to infer the existence of steps too fast to observe. The ability to identify enzyme missteps is enabled by the variable-voltage technique’s continuous sampling of the conductance through the pore as a function of DNA position. In variable-voltage sequencing, at each consecutive Hel308 half-nucleotide step, the full-nucleotide stretch caused by the voltage sweep samples the conductance at many of the same DNA positions as the previous and next Hel308 steps. Therefore, each measured segment of the conductance vs. position curve will be overlapping and continuous with the segments measured at adjacent Hel308 steps (Supplementary Note 4). If two consecutively measured segments are not overlapping and continuous, a non-uniform step such as a backstep or skip must have occurred. The degree of overlap between consecutive measurements can therefore be used to identify and correct enzyme missteps (Fig 2a, b; colored arrows). A probabilistic support vector machine informed by the shapes of the curves immediately preceding and following each enzyme step (Supplementary Note 5) is used on the variable-voltage signal to identify and eliminate misorderings caused by enzyme missteps and reestablish the order most representative of the generating DNA sequence. The resulting corrected signal (Fig 2c, d) is free of enzyme missteps and is more easily decoded into the correct DNA sequence. Measurements of DNA positions that go completely unobserved due to enzyme skips cannot be filled in at this stage. However, the overlap information can be used to label the probable locations of enzyme skips in the final signal to be sequenced. This information tells the sequencer that one or more bases must be inserted at this location, reducing the detrimental impact of enzyme skips relative to constant-voltage nanopore sequencing.
To objectively evaluate the extent to which the variable-voltage method improves single-passage sequencing accuracy over the constant-voltage method, we tested both sequencing methods on the same target DNA sequence, using the same enzyme (Hel308) and nanopore (MspA). In both cases, we used a hidden Markov model (HMM) (Supplementary Note 6) to decode the generating DNA sequence for the observed signal. For both constant- and variable-voltage sequencing, we used a model mapping each unique 6 base sequence segment (6-mer) to an associated conductance signal. We generated this model empirically by measuring the signal of known DNA sequences (ΦX-174 and lambda phage DNA, as well as synthetic oligos) using our variable-voltage sequencing conditions (Supplementary Note 7). For constant-voltage sequencing, we extracted a constant-voltage 6-mer model from the variable-voltage model (Supplementary Note 8) to ensure that any systematic model errors affecting the sequencing accuracy of one method affected both methods equally.
We used the pET28a vector as the target DNA sequence because it provided a non-synthetic DNA testing ground for the two methods separate from the sequences that were used in constructing the 6-mer model. We fragmented the pET28a vector using a selection of restriction enzymes (Supplementary Note 9), allowing us to attach the necessary sequencing adapters and increasing the likelihood of reading sequences at all locations on the pET28a vector given the limited processivity of Hel308 (~1000 nt). The variable-voltage method does not reduce the nanopore sequencer’s ability to sequence long (multiple kb) reads (Supplementary Note 10).
We obtained reads of plasmid pET28a fragments using both constant-voltage (31 reads, n = 9368 bases across all reads) and variable-voltage (97 reads, n = 17309 bases across all reads) methods. Enzyme steps in the constant- and variable-voltage conductance signals were detected using a custom change-point detection algorithm (Supplementary Note 11), segmenting the data into distinct conductance states. In the variable-voltage experiments, the capacitive charging currents from the bilayer were removed from each state using custom software (Supplementary Note 12). We used the overlap information between successive conductance states to identify and correct enzyme mis-steps in the variable-voltage reads (Supplementary Note 5), then both sets of reads were calibrated and sequenced. For both the constant- and variable-voltage sequencing results, we determined the ground truth sequence for each read by aligning the called sequence to the pET28a reference sequence. Based on the alignment, we calculated the per-base sequencing accuracy as (number of matches) ÷ (number of matches + number of mismatches + number of insertions + number of deletions). The uncertainty in per-base sequencing accuracy is calculated using binomial errors as
where N is the number of bases sequenced.
Relative to the constant-voltage reads, the variable-voltage reads have fewer base calling errors (miscalls, deletions, and insertions, Fig 3a, b). The average per-base accuracy in the variable-voltage reads is 79.3 ± 0.3% (SEM) for single passages of a single-stranded DNA molecule. This represents a substantial improvement compared with nanopore sequencing using constant-voltage, which had an average accuracy of 62.7 ± 0.5% (SEM) for the same DNA sample. Our constant-voltage sequencing accuracies are similar to single-passage, unpolished 1D reads reported for the Oxford Nanopore Technologies’ MinION device29,30. To contextualize the relative accuracy of the two methods, we compared the distribution of observed per-read accuracies with the accuracy distribution for random sequences of the same lengths aligned against the pET28a reference sequence. The sequencing accuracies of these random sequences is about 58% (Fig 3c, d); this random base call accuracy is so high (that is, much larger than 25%) because of the freedom provided to the alignment algorithm to call insertions, deletions or mismatches. Whereas the constant-voltage read accuracies only barely outperform the accuracies of randomly generated sequences (Fig 3c), the variable-voltage read accuracies are substantially higher than the distribution of random accuracies (Fig 3d). We conclude that the variable-voltage method recovers significantly more information from the target DNA and thereby substantially increases the base calling accuracy.
Figure 3.
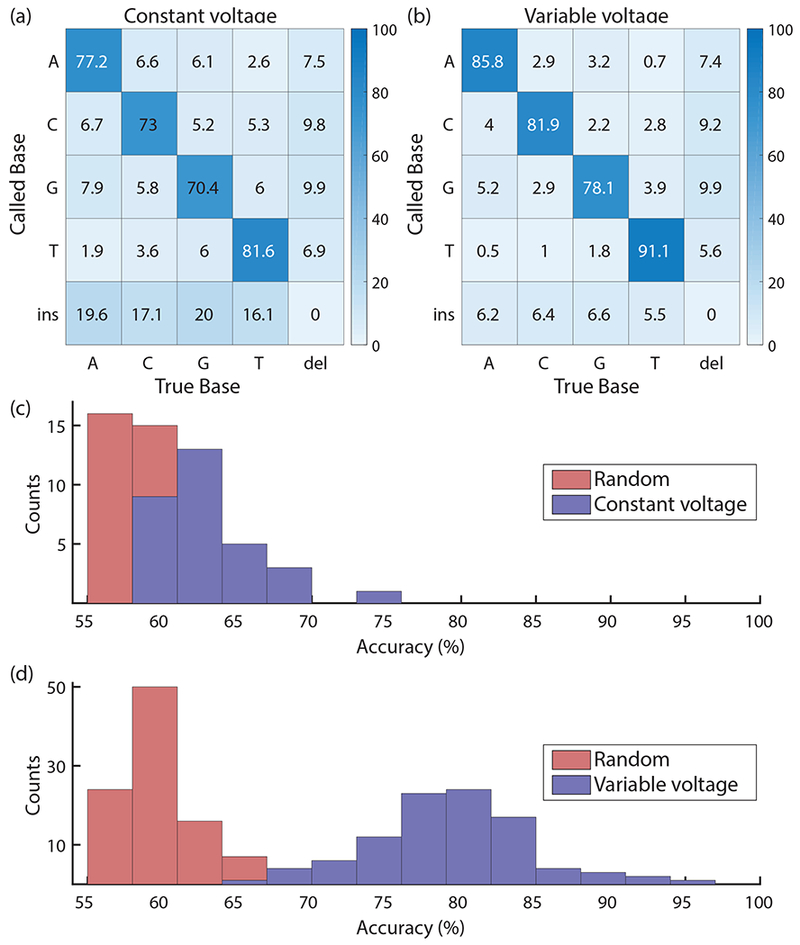
Performance using constant- and variable-voltage sequencing. Confusion matrices for sequencing using constant-voltage (a) and variable-voltage (b) show a reduction in mismatch, insertion and deletion errors across all bases with the use of variable-voltage. Histograms of single-passage accuracies for 31 constant-voltage reads (9368 total bases; 2203 called As, 2188 called Cs, 2166 called Gs, 2144 called Ts, 667 called gaps) (c) and 97 variable-voltage reads (17309 total bases; 4021 called As, 4073 called Cs, 3813 called Gs, 4081 called Ts, 1321 called gaps) (d) show a significant improvement in the distribution of read accuracies using variable-voltage. Single-passage sequencing accuracies are plotted in blue, with the distribution of accuracies for randomly generated sequences of the same lengths plotted in red. While constant-voltage nanopore sequencing is only a few percent above random base calling, the variable-voltage method yields a substantial improvement.
Improved single-read accuracy should enable fewer reads to be assembled into a high-accuracy consensus sequence, thereby reducing sequencing time and cost. Additionally, variable-voltage sequencing overcomes systematic errors, such as sequence-dependent enzyme mis-steps26 and indistinguishable signals, that persist even when the information from many reads is combined. Variable-voltage reads can be more confidently identified with only single-read coverage. This capability is necessary for nanopore sequencing applications in which high coverage is not an option, such as metagenomics studies or pathogen detection at low concentrations.
The additional information provided by the variable-voltage signal is complementary to other nanopore sequencing improvements, including more processive and predictable motor enzymes, more sophisticated base calling algorithms31–33, reading both sense and antisense of the target DNA strand in “2D” techniques23 (or the similar “1D squared” technique) or polishing reads with a consensus of passages of different DNA molecules34,35. Existing nanopore sequencers already consist of hundreds or thousands of parallel nanopores which are separately addressable with distinct driving voltages, so the variable-voltage method requires little re-engineering of the nanopore sequencing device other than the application of a waveform in place of a constant voltage. Consequently, our method could be used to improve sequencing accuracy of most existing platforms. The performance of variable-voltage nanopore sequencing will further improve as larger data sets are used to train both the model that maps conductance curves to DNA bases and the enzyme mis-step classifier.
We anticipate that incorporating our variable-voltage method into nanopore sequencing platforms will enable wide scale improvement of all nanopore-based DNA sequencing applications, including species identification, epigenetic mapping and higher accuracy de novo genome sequencing at lower coverage.
Online Methods
Proteins
The same mutant MspA protein was used in all sequencing experiments. This mutant, M2-NNN-MspA, was custom ordered from GenScript. M2-NNN-MspA is engineered on the wild type MspA (accession number CAB56052.1) with the following mutations: D90N/D91N/D93N/D118R/E139K/D134R27. All sequencing experiments used the Hel308 helicase enzyme from Thermococcus gammatolerans EJ3 (accession number WP_015858487.1). Hel308 was expressed in E. coli using standard techniques. All proteins were stored at −20 °C until immediately before use.
DNA Sequences and Constructs
Short DNA oligonucleotides were synthesized and purified using column purification methods at Stanford University Protein and Nucleic Acid Facility. The ΦX-174 DNA (NCBI reference sequence NC_001422.1) was obtained from New England Biolabs. The lambda phage DNA (GenBank J02459.1) was obtained from Promega. The pET-28a DNA was obtained from collaborators who used it as an expression vector for another DNA sequence not used in this work. The complete DNA sequences for ΦX-174, lambda, and pET28a can be found at http://dx.doi.org/10.6084/m9.figshare.7140896.v1.
All experiments were conducted with the DNA threaded through the pore 5′ end first. DNA constructs for Hel308 experiments consisted of a template read strand and a cholesterol-tagged blocking strand. A negatively-charged terminal phosphate was attached to the 5′ end of the template strand, increasing the capture rate of that end by MspA. The cholesterol tag at the 5′ end of the blocking strand anchors the DNA constructs into the bilayer, increasing the local concentration near the pore and increasing the capture rate. Detailed description of how the various DNA sequences were prepared can be found in Supplementary Note 7. The set of custom DNA sequences used in our experiments is provided in Supplementary Note 13.
Nanopore Experiments
All experiments were conducted as described in detail previously36. Briefly, experiments were established with a device made from Teflon that contains two ~50 μL chambers (cis and trans). The two chambers are connected by a Teflon heat-shrink “u-tube”, ~30 μL in volume. The cis side of the u-tube narrows into a horizontal ~20 μm aperture. Both chambers and the u-tube were filled with the operating buffers. The cis chamber was connected to ground via an Ag/AgCl electrode, while the trans-side Ag/AgCl electrode was connected to an Axopatch 200B integrating patch clamp amplifier (Axon Instruments) that also supplied the positive driving voltage. A lipid bilayer was formed across the aperture using 1,2-diphytanoyl-sn-glycero-3-phosphocholine (DPhPC) or 1,2-di-O-phytanyl-sn-glycero-3-phosphocholine (DOPC), obtained from Avanti Polar Lipids.
Following bilayer formation, M2-NNN-MspA was added to the cis chamber to a final concentration of ~2.5 ng/mL. A single pore insertion into the bilayer was recognized by a characteristic increase in the conductance. Upon single pore insertion, the cis chamber buffer was perfused out and replaced with MspA-free buffer to prevent the insertion of additional pores. The Hel308 motor enzyme was added to the cis chamber to a final concentration of ~50 nM, and DNA was added to a final concentration of ~5 nM.
Hel308 is used as a translocase, rather than a helicase, in the sequencing experiments presented here, similar to previously described experiments22. Briefly, Hel308 loads onto the overhanging 3′ end of the template DNA strand at the single-stranded/double-stranded junction. The 5′ end of the template strand is captured by the pore, and the blocking strand is sheared off as the template strand is pulled through the pore. Hel308 is too large to fit through MspA, and arrests the template strand translocation once the duplexed blocking strand has been completely sheared away. Hel308 proceeds as a translocase from 3′ to 5′ along the template strand, incrementally pulling the DNA out of the pore towards cis.
Operating Buffers
All experiments were conducted using symmetric cis and trans buffer conditions of 400 mM KCl with 10 mM HEPES at pH 8.00 ± 0.05. The cis buffer additionally contained 1 mM EDTA, 1 mM DTT, 10 mM MgCl2, and 100 μM ATP. ATP-containing buffer was re-perfused into cis approximately once per hour to prevent depletion of ATP and accumulation of ADP. Experiments were performed at 37 °C.
Data Acquisition and Analysis
Experiments were controlled and data were acquired with custom acquisition software written in LabView (National Instruments, version 2018) at a sampling rate of 50 kHz. The ionic current signal was low pass filtered at 10 kHz in the patch clamp amplifier. Ionic current traces were analyzed using custom programs written in Matlab (the Mathworks, version 2018a).
Reads were filtered using a custom compression filter (Supplemental Note 14) to eliminate transient fluctuations in ionic current unrelated to translocating DNA sequence. Enzyme-controlled DNA translocation events were detected with a thresholding algorithm as described in previous work3. For constant-voltage experiments, the open pore ionic current value was determined for the data, and an event was called whenever the ionic current drops below 75% of the open pore value. The event end was called when the ionic current returns to greater than 94% of the open pore value. Events failing certain basic criteria (duration longer than 1s, an average ionic current less than 10% or greater than 70% of the open pore value) were automatically discarded. Remaining events were classified by-eye based to select events with a large number of enzyme steps. The same thresholding method was used for event detection in the variable-voltage data, with the sole difference being that the variable-voltage data was first downsampled to 200 Hz, thus removing the periodic characteristics of the signal.
Small variations in temperature, salt concentration, and electrode offsets from day-to-day, pore-to-pore, and read-to-read cause changes in both the overall magnitude of the observed conductances (an “offset”) as well as the relative magnitudes of adjacent states (a “scale”). We calibrate each read to the 6-mer model prior to sequencing using a scale and an offset calculated specifically for that read.
Statistics
A complete accounting of the number of reads collected on each DNA strand can be found in Supplementary Note 15.
In Fig 1e, the uncertainty in the position shift as a function of voltage was determined using a bootstrapping method. The overall position shift was determined via analysis of the consensus signal of 18 variable-voltage reads of the same DNA sequence, as described in Supplementary Note 1. Using 10 unique subsets drawn from these 18 reads, we conducted identical analyses of the position shift as a function of voltage. The reported uncertainty (shaded region around the shift curve) is the standard deviation of these bootstrapped measurements.
In Fig 2, the uncertainty around each conductance measurement (shaded regions) was determined as follows. For variable-voltage measurements (Fig 2a, b lower panels and Fig 2c, d) we determined the covariance of the 3 principal component coefficients characterizing each segment by taking the covariance over the independent measurements of these 3 coefficients collected during each half-cycle of the voltage through the duration of that enzyme step (Supplementary Note 3). We converted the associated covariance of each mean conductance curve to a standard deviation around the mean by taking 100 random draws from a multivariate normal distribution with matching mean and covariance, then taking the standard deviation of these 100 random curves at each DNA position. For the constant-voltage measurements in the upper panels of Fig 2a, b, the shaded regions represent the standard deviation around the mean conductance extracted from the variable-voltage data at each enzyme step at the DNA position corresponding to the constant-voltage operating value of 180 mV.
For the determination of constant-voltage sequencing accuracy, we measured the average identity rate over all 9368 bases sequenced with this method over 31 separate reads. The uncertainty in the overall accuracy was determined using a binomial error model as discussed in the main text. The average variable-voltage sequencing accuracy, as well as its associated uncertainty, were calculated in the same fashion, using all 17309 bases sequenced over 97 separate reads. The confusion matrices in Fig 3c, d broke down the sequencing results by base identity. For constant-voltage sequencing, the 9368 total calls broke down into 2203 As, 2188 Cs, 2166 Gs, 2144 Ts, and 667 gaps. For variable-voltage sequencing, the 17309 total calls broke down into 4021 As, 4073 Cs, 3813 Gs, 4081 Ts, and 1321 gaps.
Data Availability
Data for the main text figures as well as for all the constant- and variable-voltage sequencing reads used for the validation study can be found on figshare at https://doi.org/10.6084/m9.figshare.7723214. This location also contains all the Matlab code and supporting files necessary to replicate our sequencing analysis for both constant- and variable-voltage, as well as scripts for generating the main text figures from their underlying data.
Code Availability
Code and supporting files for constant- and variable-voltage sequencing analysis, as well as for main text figure generation can be found on github at https://github.com/uwnanopore/variable-voltage-sequencing.git.
Supplementary Material
Acknowledgements
This work was supported by the National Human Genome Research Institute Grant R01HG005115 (JHG).
Footnotes
Competing Interests Statement
The authors, along with the University of Washington, have filed provisional patent applications covering the methods presented in this work.
References
- 1.Kasianowicz JJ, Brandin E, Branton D & Deamer DW Characterization of individual polynucleotide molecules using a membrane channel. Proc. Natl. Acad. Sci 93, 13770–13773 (1996). [DOI] [PMC free article] [PubMed] [Google Scholar]
- 2.Manrao EA et al. Reading DNA at single-nucleotide resolution with a mutant MspA nanopore and phi29 DNA polymerase. Nat. Biotechnol 30, 349–353 (2012). [DOI] [PMC free article] [PubMed] [Google Scholar]
- 3.Laszlo AH et al. Decoding long nanopore sequencing reads of natural DNA. Nat. Biotechnol 32, 829–833 (2014). [DOI] [PMC free article] [PubMed] [Google Scholar]
- 4.Jain M et al. Nanopore sequencing and assembly of a human genome with ultra-long reads. Nat. Biotechnol 36, 338–345 (2018). [DOI] [PMC free article] [PubMed] [Google Scholar]
- 5.Craig JM et al. Direct Detection of Unnatural DNA Nucleotides dNaM and d5SICS using the MspA Nanopore. PLOS ONE 10, e0143253 (2015). [DOI] [PMC free article] [PubMed] [Google Scholar]
- 6.Laszlo AH et al. Detection and mapping of 5-methylcytosine and 5-hydroxymethylcytosine with nanopore MspA. Proc. Natl. Acad. Sci 110, 18904–18909 (2013). [DOI] [PMC free article] [PubMed] [Google Scholar]
- 7.Schreiber J et al. Error rates for nanopore discrimination among cytosine, methylcytosine, and hydroxymethylcytosine along individual DNA strands. Proc. Natl. Acad. Sci. U. S. A 110, 18910–18915 (2013). [DOI] [PMC free article] [PubMed] [Google Scholar]
- 8.Rand AC et al. Mapping DNA methylation with high-throughput nanopore sequencing. Nat. Methods 14, 411–413 (2017). [DOI] [PMC free article] [PubMed] [Google Scholar]
- 9.Branton D et al. The potential and challenges of nanopore sequencing. Nat. Biotechnol 26, 1146–1153 (2008). [DOI] [PMC free article] [PubMed] [Google Scholar]
- 10.Castro-Wallace SL et al. Nanopore DNA Sequencing and Genome Assembly on the International Space Station. Sci. Rep 7, 18022 (2017). [DOI] [PMC free article] [PubMed] [Google Scholar]
- 11.Loman NJ, Quick J & Simpson JT A complete bacterial genome assembled de novo using only nanopore sequencing data. Nat. Methods 12, 733–735 (2015). [DOI] [PubMed] [Google Scholar]
- 12.Theuns S et al. Nanopore sequencing as a revolutionary diagnostic tool for porcine viral enteric disease complexes identifies porcine kobuvirus as an important enteric virus. Sci. Rep 8, 9830 (2018). [DOI] [PMC free article] [PubMed] [Google Scholar]
- 13.Bronzato Badial A et al. Nanopore Sequencing as a Surveillance Tool for Plant Pathogens in Plant and Insect Tissues. Plant Dis. PDIS-04-17-0488-RE (2018). doi: 10.1094/PDIS-04-17-0488-RE [DOI] [PubMed] [Google Scholar]
- 14.Cao MD et al. Streaming algorithms for identification pathogens and antibiotic resistance potential from real-time MinION™ sequencing. GigaScience 5, 1–16 (2016). [DOI] [PMC free article] [PubMed] [Google Scholar]
- 15.Simpson JT et al. Detecting DNA cytosine methylation using nanopore sequencing. Nat. Methods 14, 407–410 (2017). [DOI] [PubMed] [Google Scholar]
- 16.Quick J et al. Real-time, portable genome sequencing for Ebola surveillance. Nature 530, 228–232 (2016). [DOI] [PMC free article] [PubMed] [Google Scholar]
- 17.Quick J et al. Rapid draft sequencing and real-time nanopore sequencing in a hospital outbreak of Salmonella. Genome Biol. 16, 114 (2015). [DOI] [PMC free article] [PubMed] [Google Scholar]
- 18.Faria NR et al. Establishment and cryptic transmission of Zika virus in Brazil and the Americas. Nature 546, 406–410 (2017). [DOI] [PMC free article] [PubMed] [Google Scholar]
- 19.Kafetzopoulou LE et al. Assessment of Metagenomic MinION and Illumina sequencing as an approach for the recovery of whole genome sequences of chikungunya and dengue viruses directly from clinical samples. bioRxiv 355560 (2018). doi: 10.1101/355560 [DOI] [PMC free article] [PubMed] [Google Scholar]
- 20.Pomerantz A et al. Real-time DNA barcoding in a rainforest using nanopore sequencing: opportunities for rapid biodiversity assessments and local capacity building. GigaScience 7, (2018). [DOI] [PMC free article] [PubMed] [Google Scholar]
- 21.Cherf GM et al. Automated forward and reverse ratcheting of DNA in a nanopore at 5-A precision. Nat. Biotechnol 30, 344–348 (2012). [DOI] [PMC free article] [PubMed] [Google Scholar]
- 22.Derrington IM et al. Subangstrom single-molecule measurements of motor proteins using a nanopore. Nat. Biotechnol 33, 1073–1075 (2015). [DOI] [PMC free article] [PubMed] [Google Scholar]
- 23.Jain M et al. MinION Analysis and Reference Consortium: Phase 2 data release and analysis of R9.0 chemistry. F1000Research 6, 760 (2017). [DOI] [PMC free article] [PubMed] [Google Scholar]
- 24.Rang FJ, Kloosterman WP & de Ridder J From squiggle to basepair: computational approaches for improving nanopore sequencing read accuracy. Genome Biol. 19, 90 (2018). [DOI] [PMC free article] [PubMed] [Google Scholar]
- 25.Bhattacharya S et al. Molecular Dynamics Study of MspA Arginine Mutants Predicts Slow DNA Translocations and Ion Current Blockades Indicative of DNA Sequence. ACS Nano 6, 6960–6968 (2012). [DOI] [PMC free article] [PubMed] [Google Scholar]
- 26.Craig JM et al. Revealing dynamics of helicase translocation on single-stranded DNA using high-resolution nanopore tweezers. Proc. Natl. Acad. Sci 114, 11932–11937 (2017). [DOI] [PMC free article] [PubMed] [Google Scholar]
- 27.Butler TZ, Pavlenok M, Derrington IM, Niederweis M & Gundlach JH Single-molecule DNA detection with an engineered MspA protein nanopore. Proc. Natl. Acad. Sci 105, 20647–20652 (2008). [DOI] [PMC free article] [PubMed] [Google Scholar]
- 28.Manrao EA, Derrington IM, Pavlenok M, Niederweis M & Gundlach JH Nucleotide Discrimination with DNA Immobilized in the MspA Nanopore. PLOS ONE 6, e25723 (2011). [DOI] [PMC free article] [PubMed] [Google Scholar]
- 29.Krishnakumar R et al. Systematic and stochastic influences on the performance of the MinION nanopore sequencer across a range of nucleotide bias. Sci. Rep 8, 3159 (2018). [DOI] [PMC free article] [PubMed] [Google Scholar]
- 30.Rames E & Macdonald J Evaluation of MinION nanopore sequencing for rapid enterovirus genotyping. Virus Res. 252, 8–12 (2018). [DOI] [PubMed] [Google Scholar]
- 31.Boža V, Brejová B & Vinař T DeepNano: Deep Recurrent Neural Networks for Base Calling in MinION Nanopore Reads. PLOS ONE 12, e0178751 (2017). [DOI] [PMC free article] [PubMed] [Google Scholar]
- 32.Teng H et al. Chiron: Translating nanopore raw signal directly into nucleotide sequence using deep learning. bioRxiv (2018). doi: 10.1101/179531 [DOI] [PMC free article] [PubMed] [Google Scholar]
- 33.David M et al. Nanocall: an open source basecaller for Oxford Nanopore sequencing data. Bioinformatics 33, 49–55 (2017). [DOI] [PMC free article] [PubMed] [Google Scholar]
- 34.Vaser R, Sovic I, Nagarajan N & Sikic M Fast and accurate de novo genome assembly from long uncorrected reads. Genome Res. gr.214270.116 (2017). doi: 10.1101/gr.214270.116 [DOI] [PMC free article] [PubMed] [Google Scholar]
- 35.Simpson J Signal-level algorithms for MinION data. Contribute to jts/nanopolish development by creating an account on GitHub. (2018).
References for Online Methods
- 36.Laszlo AH, Derrington IM & Gundlach JH MspA nanopore as a single-molecule tool: From sequencing to SPRNT. Methods San Diego Calif 105, 75–89 (2016). [DOI] [PMC free article] [PubMed] [Google Scholar]
Associated Data
This section collects any data citations, data availability statements, or supplementary materials included in this article.
Supplementary Materials
Data Availability Statement
Data for the main text figures as well as for all the constant- and variable-voltage sequencing reads used for the validation study can be found on figshare at https://doi.org/10.6084/m9.figshare.7723214. This location also contains all the Matlab code and supporting files necessary to replicate our sequencing analysis for both constant- and variable-voltage, as well as scripts for generating the main text figures from their underlying data.