

ABSTRACT
Background
Avocados contain fiber, lutein, and vitamin E, and they are a rich source of MUFAs. The effect of including an avocado daily as part of a hypocaloric weight-loss diet on weight loss is not known.
Objective
The aim of this study was to determine the effect of daily avocado consumption as part of a hypocaloric diet on weight loss, body composition, satiety, biomarkers of inflammation, and intestinal microbiota composition.
Methods
In this randomized, parallel-controlled, open-label, 2-arm intervention study, 51 healthy overweight/obese women and men were assigned to a hypocaloric diet with 1 Hass avocado daily (AVO; n = 24) or a hypocaloric diet (CTRL; n = 27) without daily avocado for 12 wk. Serum markers and intestinal microbiota were analyzed at baseline and week 12.
Results
Both groups experienced significant weight loss, decrease in BMI (in kg/m2), total body fat, and visceral adipose tissue, respectively (AVO: −2.3 ± 2 kg, −0.8 ± 0.8, −1.1% ± 2%, and −81.2 ± 118 g; CTRL: −2.6 ± 3.6 kg, −0.9 ± 1, −1.5% ± 2%, and −87.4 ± 216 g). We observed a significant decrease in serum glucose over time in the control group compared with the AVO group. There was no change between the groups in serum triglyceride, but a significant decrease from baseline to 12 wk was observed in the AVO group. Serum hepatic growth factor (HGF) and relative proportion of bacterial phyla (Firmicutes and Bacteroidetes), family (Bacteroidaceae and Erysipelotrichaceae), and genus (Bacteroides, Clostridium, Methanosphaera, and Candidatus Soleaferrea) were significantly altered in the AVO group compared with the CTRL group. A trend to decrease in serum inflammatory factors IL-1β (P = 0.07) and C-reactive protein (P = 0.074) was observed in the AVO group compared with CTRL.
Conclusions
Daily Hass avocado consumption as part of a hypocaloric diet supported weight loss, a decrease in serum HGF, and an increase in the abundance of bacteria involved in plant polysaccharide fermentation. This trial was registered at clinicaltrials.gov as NCT02953158.
Keywords: avocado, clinical trial, hepatic growth factor, inflammation, intestinal microbiota, satiety, weight loss
Introduction
Overweight and obesity in the United States and other industrialized countries represent a significant and growing health problem (1). Individuals who are overweight or obese increase their risk of coronary heart disease, diabetes, metabolic syndrome, and cancer (2–4). Modest weight loss of 5–10% of body weight was associated with significant improvements in obesity-related chronic diseases (5). It has been demonstrated that low-calorie diet interventions help in both short- and long-term weight reduction in individuals who are overweight or obese (6). The role of diet composition in weight loss has been investigated extensively with inconsistent results (7). Restriction of calories appears to be the most important factor to the success of weight loss. However, there is evidence that quantity and quality of macronutrients also contribute to weight loss through regulation of satiety (7).
Avocados add monounsaturated fat, dietary fiber, and a variety of other important phytochemicals, such as lutein, vitamin E, niacin, and folate, to the diet (8, 9). We have previously demonstrated that adding avocado to a hamburger patty did not increase serum triglycerides, but it did decrease postprandial inflammation and preserve vascular function, suggesting the importance of dietary quality beyond calories (10). Based on the monounsaturated fat and fiber content of avocados, we hypothesized that the inclusion of 1 Hass avocado into a hypocaloric diet will improve the dietary quality and may enhance weight loss through increasing satiety and shaping the intestinal microbiota to sustain weight loss. This hypothesis was supported by previous intervention studies that provided evidence for Hass avocado or high-fiber diets to increase postprandial satiety and reduce hunger (11, 12). The human intestinal microbiota is an important contributor to human health and has been implicated in the development of obesity and obesity-related diseases such as diabetes and cardiovascular disease (13–15). The 2 most abundant bacterial phyla in humans and in mice are Firmicutes (40–60%) and Bacteroidetes (20–40%), with lower abundance of Actinobacteria, Fusobacteria, Proteobacteria, and Verrucomicrobia (16). Bacteria from the phyla Firmicutes and Actinobacteria are more efficient in energy extraction and are more abundant in the intestine of overweight/obese individuals (17). Diet is one of the most important factors shaping the intestinal microbiota (18). We therefore investigated if including 1 Hass avocado per day in a 500-calorie-deficient diet supports weight loss by changing the composition of the intestinal microbiota. We also determined if consuming 1 Hass avocado daily improves anti-inflammatory and metabolic markers compared with consuming a hypocaloric control diet.
Methods
Study design
We conducted a prospective, randomized, parallel, 2-arm, open-label intervention study at the Center for Human Nutrition, University of California, Los Angeles (UCLA). The study was performed in accordance with the guidelines of the Human Subjects Protection Committee of UCLA. The clinical protocol was approved by the Internal Review Board of UCLA. All subjects gave written informed consent before the study began. The study was registered in clinicaltrials.gov under the identifier NCT02953158 on November 2, 2016. Participants were randomly assigned to either the control group (CTRL), consuming a hypocaloric diet excluding avocados daily for 12 wk (n = 32), or the avocado group (AVO), consuming a hypocaloric diet including 1 Hass avocado daily for 12 wk (n = 31) (Supplemental Figure 1). The random permuted block design was implemented to carry out the randomization using our standard random number program. Block size was 4 or 6 performed in a random way. Study enrollment ended after at least 60 participants were enrolled.
Study participants
Eligibility criteria were healthy overweight and obese adults [BMI (in kg/m2): 27–35), age 20–60 y, not taking prescription or over-the-counter medications for weight loss, and without weight change of >5 pounds in the previous 3 mo. Sixty-three women and men met the eligibility criteria and were randomly assigned to a hypocaloric (500-calorie-deficit) meal plan with or without 1 Hass avocado per day for 12 wk. Twelve individuals (5 from the control and 7 from the avocado group) dropped out due to relocation, scheduling difficulties, or inability to follow the meal plan including daily avocado consumption. Their data were not included in the statistical evaluation. No adverse effects were reported.
Study outcomes
The primary outcome of this intervention study was to determine the effect of including 1 Hass avocado daily in a hypocaloric diet on weight loss and body composition. Multiple exploratory secondary outcomes included the effect of including 1 avocado daily in a hypocaloric diet on changes in satiety, fecal microbiota, serum glucose, lipids, and inflammatory markers. All outcome parameters were determined before (baseline) and after consumption of a hypocaloric diet with (AVO) or without 1 Hass avocado (CTRL) for 12 wk.
Anthropometric measurements
Body weight was measured using the Tanita Body Composition Analyzer BC-418. Body composition was determined using the Lunar iDXA machine (General Electric). The enCORE CoreScan version 13.6 software specifically designed to estimate visceral fat was used to conduct all total body scanning procedures. Female participants underwent a pregnancy test within 1 h prior to their scans. Satiety was measured using the Hunger-Satiety Scale from 0 to 8, with 0 being starving and 8 being stuffed.
Dietary intervention
Basal metabolic rates were determined using data from Dual Energy X-Ray Absorptiometry described previously. Caloric intake was determined from the individual's basal metabolic rate and activity level. Participants received dietary instruction from a registered dietitian at the commencement of the study. The goal of the dietary instruction was to achieve a daily calorie deficit of 500 calories. Dietary instruction provided information to eat a diet with caloric content of 30–35% from fat, 15–20% from protein, and 45–55% from carbohydrates. Subjects received a general meal plan and a checklist with the number of macronutrient servings (Supplemental Tables 1B, 1D, and 1F). Participants selected accustomed foods matching the example meal plan. Meal plans for the avocado group included 1 Hass avocado daily with an estimated caloric contribution of 250 kcal. The caloric value and fat content of the avocado were included in the hypocaloric diet. Subjects were instructed to complete a daily checklist by marking the number of servings from each macronutrient category (Supplemental Tables 1C, 1E, and 1G). Participants in both groups met with the registered dietitian every second week to review the checklists to ensure compliance with the dietary instructions.
Biochemical analysis
Circulating inflammatory [IL-6, TNF-α, IL-1β, monocyte chemoattractant protein-1 (MCP-1), and C-reactive protein (CRP)] and metabolic markers [hepatic growth factor (HGF), insulin, leptin, adiponectin, resistin, and plasminogen activator inhibitor-1 (PAI)] were analyzed using the human adipocyte panel, human metabolic hormone panel, and human cardiovascular panel 3 (EMD Millipore) on a MagPix analyzer (Luminex). Serum triglycerides, total cholesterol, and HDL cholesterol were analyzed spectrophotometrically using cholesterol and triglycerides reagents (Pointe Scientific). HDL cholesterol was calculated using the Friedewald equation. Serum glucose was analyzed using an enzymatic assay (Cayman Chemical).
Plasma fatty acid analysis
Plasma fatty acid (FA) concentration was analyzed by GC after conversion to methyl esters according to the method by Bagga et al. (19). Fatty acids are expressed as percentage of total fatty acids quantified.
Stool collection
Stool samples were collected from each subject at baseline and at the end of the study (12 wk). An aliquot of a daily stool specimen was collected by the participant and delivered to the UCLA Center for Human Nutrition in a cooler no later than 12 h after collection each time. At the laboratory, stool was aliquoted into smaller vials and frozen immediately and stored at −80°C.
Bacterial DNA sequencing
Bacterial DNA sequencing was performed as described previously (20). Briefly, DNA from stool was extracted using the DNeasy power soil DNA isolation kit (Qiagen). The quality and quantity of the DNA were confirmed using a Nanodrop 1000 (Thermo Fisher Scientific). The 16S rRNA gene V4 variable region was amplified using primer pair F515/R806. Sequencing was performed at MR DNA (www.mrdnalab.com) on a MiSeq (Illumina) following the manufacturer's guidelines. Sequence data were processed using a proprietary analysis pipeline (MR DNA). Operational taxonomic units (OTUs) were defined by clustering at 3% divergence (97% similarity). Final OTUs were taxonomically classified using BLASTn against a curated GreenGenes database (21). Within-community diversity (α-diversity) was calculated using the QIIME software package (22). Analysis of α-diversity (Shannon index) was performed by a 1-factor ANOVA. β-diversity was measured by calculating the weighted UniFrac distances (23) using QIIME default scripts, and weighted UniFrac PCoA biplot was visualized using EMPeror (24).
Statistical analysis
The sample size was estimated based on data from a similar study by Gerhard et al. (25). Eleven subjects were fed a low- or a high-monounsaturated fat diet for 6 wk in a crossover design (25). Results showed a significant time by diet interaction (P = 0.05), with subjects on the low-fat diet losing on average 1.53 kg, or 1.4% of original body weight, compared with 0.47 kg for subjects (0.5%) on the high-monounsaturated fat diet. Most likely in a randomized parallel design, the standard deviation will be larger than that in a crossover design, in which subjects serve as their own controls. Considering an upper bound of variance in what we might expect to observe in our proposed study, we used the SD (SD = 3.5) from a larger randomized multicenter trial of 2 hypo-energetic diets (high fat compared with low fat) in obese men and women (26). Given a larger SD, we can expect to observe a 2% difference in weight change between the 2 intervention diet groups with 84% power, given 30 subjects per group, and a 1-sided 0.05 significance level. The goal was to enroll 60 participants.
Summary statistics (mean, SD, and frequency distribution) were generated for baseline demographic, clinical information, and fecal bacterial content for each study group to characterize the study population. ANOVA and chi-square test were used to evaluate the difference between the 2 treatment groups for continuous variable and categorical variables, respectively. The 12-wk outcomes were compared between study groups, using ANCOVA with the adjustment of baseline values. Data management, variable transformations, and other statistical analyses were conducted using SAS 9.2 (SAS Institute). P values < 0.05 were considered statistically significant.
Results
Body weight, composition, and satiety
There was no difference in baseline demographics between the AVO and CTRL groups (Table 1). Body weight of participants decreased significantly in both groups (AVO group: 2.3 ± 2 kg; CTRL group: −2.6 ± 3.6 kg) during the 12 wk of hypocaloric diet consumption (Figure 1). BMI also decreased significantly in both groups by 0.84 ± 0.76 and 0.93 ± 1.3 in the AVO and CTRL groups at week 12 compared to baseline, respectively (Table 2). Percentage total body fat (AVO: −1.1% ± 2.3%; CTRL: −1.5% ± 1.6%) and visceral adipose tissue determined by DEXA (AVO: −81 ± 118 g; CTRL: −87 ± 216 g) were decreased significantly in both groups at week 12 compared to baseline (Table 2). There were no statistically significant differences in change in body weight, BMI, and total fat between the AVO and CTRL groups (Table 2). To determine if the consumption of 1 Hass avocado daily will affect satiety, study participants completed the Hunger-Satiety Scale at baseline and the end of the study. In the CTRL group, satiety decreased significantly over time, whereas we did not observe any significant decrease in the AVO group (Figure 2).
TABLE 1.
Baseline demographics of study participants1
| CTRL (n = 27) | AVO (n = 24) | |
|---|---|---|
| Sex, % women | 74 | 83 |
| Age, y | 36.4 ± 10.8 | 42.5 ± 12.7 |
| Weight, kg | 83.2 ± 15.8 | 83.2 ± 10.7 |
| BMI, kg/m2 | 30.0 ± 3.7 | 30.1 ± 3.2 |
| Total body fat, % | 38.3 ± 8.5 | 41.2 ± 5.1 |
Data are means ± SDs. ANCOVA model was used to compare outcomes adjusted for baseline value; *P < 0.05. AVO, Hass avocado group; CTRL, control group.
FIGURE 1.
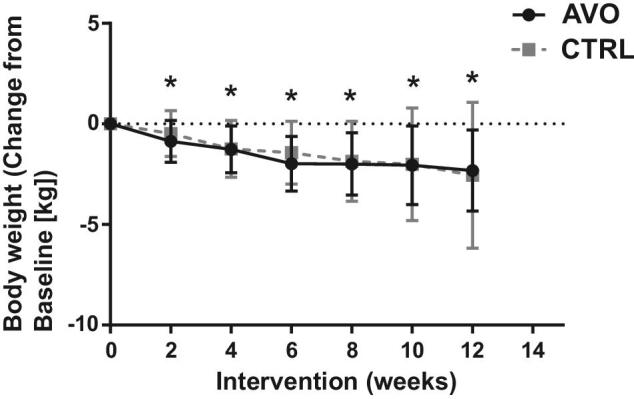
Body weight changes of participants in the AVO and CTRL groups from baseline to week 12. Data are means ± SDs, n = 27 (CTRL) and n = 24 (AVO). ANCOVA model was used to compare outcomes adjusted for baseline value. *P < 0.05. AVO, Hass avocado group; CTRL, control group.
TABLE 2.
Change of body composition and satiety from baseline to week 121
| CTRL (n = 27) | P (CTRL) | AVO (n = 24) | P (AVO) | P (CTRL vs. AVO) | |
|---|---|---|---|---|---|
| Weight, kg | −2.6 ± 3.6 | <0.001 | −2.3 ± 2.0 | <0.001 | NS |
| BMI, kg/m2 | −0.93 ± 1.26 | <0.001 | −0.84 ± 0.76 | <0.001 | NS |
| Body fat, % | −1.51 ± 1.60 | <0.001 | −1.13 ± 2.25 | 0.004 | NS |
| Visceral adipose tissue, g | −87.4 ± 216 | 0.025 | −81.2 ± 118 | 0.01 | NS |
| Satiety score | −0.45 ± 1.06 | 0.01 | −0.19 ± 0.75 | NS | NS |
Data are means ± SDs. ANCOVA model was used to compare outcomes adjusted for baseline value; P < 0.05. AVO, Hass avocado group; CTRL, control group; NS, not significant.
FIGURE 2.
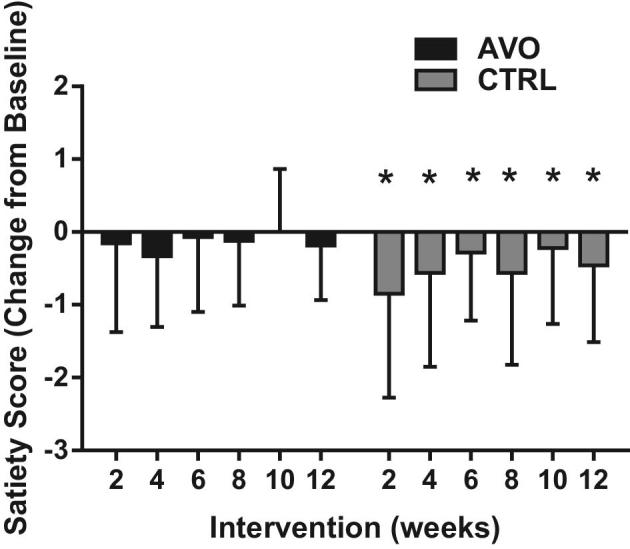
Satiety score changes of participants in the AVO and CTRL groups from baseline to week 12. Data are means ± SDs, n = 27 (CTRL) and n = 24 (AVO). ANCOVA model was used to compare outcomes adjusted for baseline value. *P < 0.05. AVO, Hass avocado group; CTRL, control group.
Serum metabolic and inflammatory markers
In the CTRL group, serum glucose and total cholesterol were decreased significantly at 12 wk compared to baseline (Table 3). The change in serum glucose over time in the CTRL group was significantly different from that in the AVO group. The serum triglyceride concentration was decreased significantly only in the AVO group at the end of the 12-wk dietary intervention compared to baseline, and there was no significant difference between the CTRL and AVO groups (Table 3). Serum cholesterol was also decreased in the AVO group but did not reach statistical significance (Table 3). Serum insulin was not changed significantly in both groups (Table 3). Serum HGF was decreased significantly over time in the AVO group compared with the CTRL group. Inflammatory markers IL-1β (P = 0.085) and CRP (P = 0.074) showed a trend to decrease in the AVO group during the 12-wk intervention, with no change in the CTRL group (Table 3). Other inflammatory markers (IL-6, MCP1, and TNF-α) and adipokines (leptin, adiponectin, resistin, and PAI) were not changed significantly.
TABLE 3.
Change of serum concentration of metabolic and inflammatory markers from baseline to week 121
| Change from baseline | CTRL (n = 27) | P (CTRL) | AVO (n = 24) | P (AVO) | P (CTRL vs. AVO) |
|---|---|---|---|---|---|
| Glucose, mg/dL | −7.52 ± 10.76 | 0.001 | −0.18 ± 10.12 | NS | 0.024 |
| Insulin, pg/mL | 50.1 ± 259.9 | NS | 35.8 ± 144.0 | NS | NS |
| Total cholesterol, mg/dL | −11.1 ± 31.4 | 0.04 | −4.73 ± 23.4 | NS | NS |
| HDL cholesterol, mg/dL | −1.4 ± 9.0 | NS | −1.5 ± 6.1 | NS | NS |
| LDL cholesterol, mg/dL | −10.4 ± 32.5 | NS | −1.1 ± 27.5 | NS | NS |
| Triglyceride, mg/dL | −10.9 ± 39.6 | NS | −25.5 ± 37.4 | 0.001 | NS |
| NGF, pg/mL | 0.4 ± 1.2 | NS | −0.1 ± 0.8 | NS | NS |
| IL-6, pg/mL | 0.24 ± 0.95 | NS | −0.04 ± 1.13 | NS | NS |
| Leptin, ng/mL | −2.1 ± 8.5 | NS | −1.3 ± 7.0 | NS | NS |
| HGF, pg/mL | 4.1 ± 38.5 | NS | −21.4 ± 39.3 | 0.02 | 0.045 |
| MCP-1, pg/mL | 6.3 ± 30.5 | NS | 5.3 ± 25.1 | NS | NS |
| TNF-α, pg/mL | 0.2 ± 0.5 | NS | 0.2 ± 0.6 | NS | NS |
| IL-1β, pg/mL | 0.03 ± 0.30 | NS | −0.10 ± 0.26 | 0.08 | 0.07 |
| CRP, µg/mL | 2.2 ± 13.7 | NS | −5.2 ± 17.2 | 0.085 | 0.074 |
| Adiponectin, µg/mL | 2.0 ± 34.4 | NS | 4.4 ± 61.4 | NS | NS |
| Resistin, ng/mL | −0.5 ± 16.4 | NS | 6.2 ± 32.8 | NS | NS |
| PAI, ng/mL | −10.9 ± 65.5 | NS | −6.6 ± 53.3 | NS | NS |
Data are means ± SDs. ANCOVA model was used to compare outcomes adjusted for baseline value. AVO, Hass avocado group; CRP, C-reactive protein; CTRL, control group; HGF, hepatic growth factor; MCP-1, monocyte chemoattractant protein-1; NGF, nerve growth factor; NS, not significant; PAI, plasminogen activator inhibitor-1.
Plasma fatty acid profile
In Hass avocados, 59% of FAs occur in the form of oleic acid, 11% linoleic acid, and 1% linolenic acid (8). In the current study, we observed a nonsignificant shift in plasma content of FAs with a decrease in palmitic acid and increase in oleic acid in participants consuming 1 Hass avocado daily and the reverse in the CTRL group of an increase in palmitic acid and decrease in oleic acid at 12 wk compared to baseline (Supplemental Table 2). In addition, in the AVO group, linolenic acid was decreased significantly at 12 wk compared to baseline.
Intestinal microbiome
One Hass avocado (136 g) has been reported to contain ∼9.2 g of dietary fiber consisting of 70% insoluble and 30% soluble fiber (8). The inclusion of foods containing dietary fiber has been shown to affect weight loss through its effects on the intestinal microbiota (27, 28). To determine whether specific micro-organisms were associated with weight loss in the CTRL and AVO groups, we assessed the abundance of bacteria in fecal samples collected at baseline and 12 wk. Fecal microbiota composition was analyzed by sequencing the V4 region of the 16S rDNA gene. Although participants in both groups experienced significant weight loss, taxonomic changes at the phylum level of Bacteroidetes and Firmicutes were significantly different in the 2 groups (Table 4). In the CTRL group, the relative proportion of Bacteroidetes was increased, and Firmicutes showed a trend to decrease (P = 0.08), whereas in the AVO group there was no change in Bacteroidetes and a trend to increase in Firmicutes (Table 4). No significant change in other phyla (Actinobacteria, Euryarchaeota, Verucomicrobia, and Proteobacteria) was observed.
TABLE 4.
Changes in gut microbiota phylum composition from baseline to week 12 in the AVO and CTRL groups as percentage of total bacteria count1
| CTRL (n = 27) | AVO (n = 24) | CTRL vs. AVO | |||||
|---|---|---|---|---|---|---|---|
| Baseline | Final | P | Baseline | Final | P | P | |
| Firmicutes | 61.29 ± 11.00 | 57.11 ± 8.76 | 0.084 | 53.91 ± 10.02 | 56.79 ± 9.70 | 0.069 | 0.016 |
| Bacteriodetes | 26.94 ± 9.83 | 32.37 ± 10.57 | 0.053 | 34.88 ± 14.41 | 32.33 ± 12.21 | NS | 0.023 |
| Actinobacteria | 7.24 ± 6.07 | 7.15 ± 6.42 | NS | 7.59 ± 7.86 | 6.71 ± 4.68 | NS | NS |
| Euryarchaeota | 1.76 ± 2.95 | 1.33 ± 1.88 | NS | 1.05 ± 2.42 | 1.08 ± 2.17 | NS | NS |
| Verrucomicrobia | 0.75 ± 1.90 | 0.55 ± 0.98 | NS | 1.23 ± 1.73 | 1.86 ± 2.19 | NS | NS |
| Proteobacteria | 1.09 ± 1.61 | 1.05 ± 1.35 | NS | 0.89 ± 1.22 | 0.86 ± 0.78 | NS | NS |
Data are means ± SDs. ANCOVA model was used to compare outcomes adjusted for baseline value. AVO, Hass avocado group; CTRL, control group; NS, not significant.
Comparing the change in relative abundance of fecal bacteria from baseline to week 12 between the AVO and CTRL groups showed significant differences on the family level for Bacteroidaceae and Erysipelotrichaceae and a trend for Clostridiaceae (P = 0.061) (Table 5). In the AVO group, we observed a significant increase from baseline to week 12 for Veillonellaceae and Sutterellaceae and a trend to increase for Ruminoccocaceae (P = 0.056) and Prevotellaceae (P = 0.08). In the CTRL group, the abundance of Bacteroidaceae and Oxalobacteraceae was increased and that of Oscillatoriales and Lachnospiraceae was decreased significantly from baseline to week 12 (Table 5).
TABLE 5.
Changes in gut microbiota family composition from baseline to week 12 in the AVO and CTRL groups as percentage of total bacteria count1
| CTRL (n = 27) | AVO (n = 24) | CTRL vs. AVO | ||||||
|---|---|---|---|---|---|---|---|---|
| Family | Phyla | Baseline | Final | P | Baseline | Final | P | P |
| Bacteroidaceae | Bacteroidetes | 17.27 ± 11.31 | 21.59 ± 12.36 | 0.046 | 23.37 ± 12.55 | 19.82 ± 10.22 | NS | 0.012 |
| Ruminococcaceae | Firmicutes | 20.03 ± 6.02 | 19.82 ± 5.28 | NS | 18.54 ± 7.33 | 20.79 ± 6.68 | 0.056 | NS |
| Lachnospiraceae | Firmicutes | 16.56 ± 5.89 | 14.50 ± 4.78 | 0.033 | 15.37 ± 4.82 | 14.30 ± 4.00 | NS | NS |
| Clostridiaceae | Firmicutes | 8.77 ± 3.18 | 7.92 ± 3.74 | NS | 8.28 ± 3.42 | 9.56 ± 3.74 | NS | 0.061 |
| Erysipelotrichaceae | Firmicutes | 3.32 ± 4.49 | 2.62 ± 3.68 | NS | 1.98 ± 4.05 | 2.63 ± 4.30 | NS | 0.046 |
| Prevotellaceae | Bacteroidetes | 2.59 ± 5.8 | 2.1 ± 5.2 | NS | 0.25 ± 0.45 | 0.64 ± 1.7 | 0.08 | NS |
| Veillonellaceae | Firmicutes | 0.51 ± 0.69 | 0.85 ± 1.27 | NS | 1.34 ± 3.26 | 1.48 ± 3.33 | 0.023 | NS |
| Sutterellaceae | Proteobacteria | 0.27 ± 0.62 | 0.35 ± 0.92 | NS | 0.14 ± 0.14 | 0.34 ± 0.33 | 0.005 | NS |
| Oxalobacteraceae | Proteobacteria | 0.010 ± 0.020 | 0.150 ± 0.576 | 0.048 | 0.033 ± 0.056 | 0.050 ± 0.102 | NS | NS |
| Oscillatoriales | Cyanobacteria | 0.013 ± 0.041 | 0.007 ± 0.029 | 0.03 | 0.019 ± 0.056 | 0.002 ± 0.005 | NS | NS |
Data are means ± SDs. ANCOVA model was used to compare outcomes adjusted for baseline value. AVO, Hass avocado group; CTRL, control group; NS, not significant.
On the genus level, there were significant differences between the AVO and CTRL groups in Bacteroides, Clostridium, Methanosphaera, and Candidatus Soleaferrea when comparing the change from baseline to week 12 (Table 6). Specifically, in the AVO group we observed significant increases in Dialister, Sutterella, Bilophila, Holdemanella, Herbaspirillum, and Acetivibrio and a decrease in Methanosphaera comparing baseline to week 12 (Table 6). Genus-level changes in the CTRL group showed that Bacteroides was increased significantly and Enterobacter and Faecalicoccus were decreased significantly comparing baseline to week 12 (Table 6).
TABLE 6.
Changes in gut microbiota genus composition from baseline to week 12 in the AVO and CTRL groups as percentage of total bacteria count1
| CTRL (n = 27) | AVO (n = 24) | CTRL vs. AVO | ||||||
|---|---|---|---|---|---|---|---|---|
| Genus | Phyla | Baseline | Final | P | Baseline | Final | P | P |
| Bacteroides | Bacteroidetes | 17.27 ± 11.31 | 21.59 ± 12.36 | 0.043 | 23.37 ± 12.55 | 19.82 ± 10.22 | NS | 0.012 |
| Clostridium | Firmicutes | 8.75 ± 3.17 | 7.87 ± 3.70 | NS | 8.2 ± 3.41 | 9.51 ± 3.72 | NS | 0.05 |
| Dialister | Firmicutes | 0.39 ± 0.61 | 0.61 ± 1.15 | NS | 0.63 ± 1.01 | 0.87 ± 1.31 | 0.005 | NS |
| Sutterella | Proteobacteria | 0.11 ± 0.34 | 0.28 ± 0.93 | NS | 0.05 ± 0.09 | 0.17 ± 0.29 | 0.008 | NS |
| Erysipelatoclostridium | 0.21 ± 0.33 | 0.13 ± 0.21 | 0.059 | 0.12 ± 0.18 | 0.15 ± 0.24 | NS | NS | |
| Bilophila | Proteobacteria | 0.03 ± 0.04 | 0.04 ± 0.05 | NS | 0.04 ± 0.09 | 0.14 ± 0.25 | 0.001 | NS |
| Holdemanella | Firmicutes | 0.72 ± 1.46 | 0.61 ± 1.24 | NS | 0.51 ± 1.10 | 0.66 ± 1.42 | 0.001 | NS |
| Herbaspirillum | Proteobacteria | 0.01 ± 0.02 | 0.14 ± 0.58 | NS | 0.02 ± 0.05 | 0.03 ± 0.10 | 0.052 | NS |
| Methanosphaera | Euryarchaeota | 0.002 ± 0.009 | 0.062 ± 0.316 | NS | 0.053 ± 0.148 | 0.032 ± 0.095 | 0.003 | 0.012 |
| Enterobacter | Proteobacteria | 0.07 ± 0.19 | 0.03 ± 0.13 | 0.044 | 0.02 ± 0.04 | 0.01 ± 0.02 | NS | NS |
| Candidatus Soleaferrea | 0.02 ± 0.02 | 0.03 ± 0.05 | NS | 0.01 ± 0.02 | 0.02 ± 0.01 | 0.06 | 0.04 | |
| Faecalicoccus | Firmicutes | 0.02 ± 0.03 | 0.01 ± 0.02 | 0.026 | 0.02 ± 0.05 | 0.02 ± 0.05 | NS | NS |
| Acetivibrio | Firmicutes | 0.02 ± 0.06 | 0.04 ± 0.12 | NS | 0.00 ± 0.01 | 0.01 ± 0.01 | 0.018 | NS |
Data are means ± SDs. ANCOVA model was used to compare outcomes adjusted for baseline value. AVO, Hass avocado group; CTRL, control group; NS, not significant.
The abundance of several taxa was significantly correlated with body composition and serum metabolic markers. For example, the relative proportion of the phylum Firmicutes (correlation coefficient: −0.3; P = 0.01) and family Enterobacterioceae (correlation coefficient: −0.31; P = 0.028) showed a significant reverse correlation and Bifidobacteriaceae (correlation coefficient: 0.33; P = 0.02) a positive correlation with lean body weight (Figure 3). In addition, reversed correlations with total cholesterol and LDL cholesterol were observed for the phylum of Archaea called Euryarchaeota (correlation coefficient: −0.36, −0.32; P = 0.01, 0.025, respectively); for Methanobacteriaceae, a family in the phylum Euryarchaeota (correlation coefficient: −0.37, 0.32; P = 0.008, 0.021, respectively); and for Clostridiaceae (phylum Firmicutes) (correlation coefficient: −0.48, −0.42; P = 0.0004, 0.003, respectively). For Streptococcaceae (phylum Firmicutes), a reverse correlation was observed for total cholesterol (correlation coefficient: −0.31; P = 0.026). Euryarchaeota (correlation coefficient: −0.45; P = 0.001) and Methanobacteriaceae (correlation coefficient: −0.45; P = 0.001) also showed a reverse correlation to serum CRP (Figure 3). No change in α- and β-diversity was observed (Supplemental Figures2 and 3).
FIGURE 3.
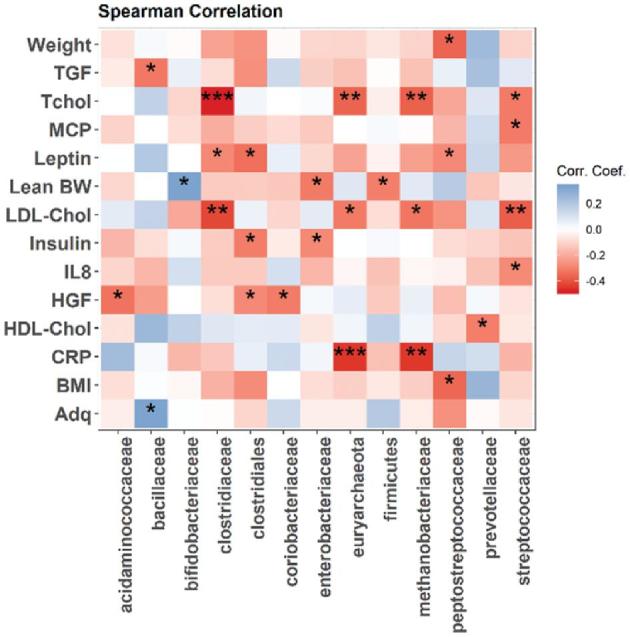
Correlation between intestinal bacteria from phylum and family level to change in weight, body composition, and metabolic and inflammatory markers from baseline to week 12. *P = 0.05, **P = 0.01, ***P = 0.001. Chol, cholesterol; CRP, C-reactive protein; HGF, hepatic growth factor; MCP, monocyte chemoattractant protein; Tchol, total cholesterol; TGF, transforming growth factor.
Discussion
Results of the current study demonstrate that including 1 Hass avocado daily in a hypocaloric diet intervention for 12 wk resulted in similar weight loss as that achieved by consuming a hypocaloric diet without avocado. Total fat and visceral adipose tissue decreased significantly in both groups.
Weight loss in the 2 intervention groups, however, was associated with different metabolic parameters. In the CTRL group, serum glucose was significantly decreased over time compared with the AVO group, whereas no change in serum triglyceride was observed between the groups. In the AVO group, however, a significant decrease in serum triglyceride from baseline to 12 wk was observed. A recent literature review of studies applying low-calorie diets concluded that in general, weight loss through low-calorie diet interventions was associated with lowering of blood glucose and triglyceride (6).
We suggest that the replacement of 1 avocado per day by dietary sources of saturated fat and carbohydrate in the CTRL meal plan might have been responsible for the difference in metabolic response. On average, 1 Hass avocado provides ∼250 kcal, 21 g of fat (76% of energy), 11.8 g of carbohydrate (19% of energy), 2.7 g of protein (4% of energy), and 9.2 g of fiber (8). It has been shown by other investigators that reducing carbohydrate and inclusion of dietary monounsaturated fat and fiber resulted in decreased blood triglyceride concentration (29–31). A previous meta-analysis found a significant decrease in triglyceride, total cholesterol, and LDL cholesterol in individuals consuming Hass avocados, whereas another meta-analysis found a significant increase in HDL cholesterol but no change in other cardiovascular risk factors (32–34). Another meta-analysis concluded that Hass avocado consumption resulted in increased HDL cholesterol but no significant change in other cardiovascular risk factors (34). However, in the current weight-loss study, we did not find significant changes in cholesterol in the AVO group, whereas in the CTRL group fasting total cholesterol was decreased at 12 wk compared to baseline.
In addition, the consumption of 1 Hass avocado daily exhibited significant changes in the composition of the intestinal microbiota. It has been shown previously that consuming a high-fat Western diet compared to a low-fat diet is associated with an increase in the phyla Firmicutes and Actinobacteria and decrease in Bacteroidetes (35). According to Turnbaugh et al. (17), the phyla Firmicutes and Actinobacteria contain the majority of obesity-associated genes in gut microbiota, facilitating increased host energy utilization and absorption from the diet, leading to obesity. The findings of the current study, however, showed that both intervention groups experienced similar weight loss, although in the AVO group, the proportion of Firmicutes showed a trend to increase (P = 0.069), whereas in the CTRL group, we observed trends for Firmicutes to decrease (P = 0.08) and Bacteroidetes to increase (P = 0.053). Other taxa found to be related to diet composition and body weight, such as Prevotella (phylum Bacteroidetes) and Ruminococcus (phylum Firmicutes), have been used in combination with Bacteroides (phylum Bacteroidetes) to categorize individuals into different enterotypes (36). Whereas both Prevotella and Bacteroides are well known as dietary fiber fermenters (37), Prevotella has been found more commonly in vegans, vegetarians, and populations living in rural areas ingesting diets rich in fiber. Bacteroides-dominated microbiota, however, are associated with dietary patterns including plenty of animal protein and fats (37–41). The Prevotella-to-Bacteroides ratio was found to predict success in weight loss (42). In the current study, including 1 Hass avocado daily resulted in a decrease in Bacteroides and trend to increase in Prevotellaceae, a shift in the microbiota to one more characteristic for a dietary pattern of plant-based fiber and fat compared with the CTRL group that experiencing an increase in Bacteroides characteristic for animal protein and fat intake. In the AVO group, in addition to an increase in Prevotella, we also observed an increase in Ruminococcus and Sutterella, which are both related to the fermentation of complex plant polysaccharides and have been shown to be linked to body weight change (43–45). For example, high-fiber intake and the presence of bacteria from the family Ruminococcaceae were associated with lower long-term weight gain (46).
Other bacteria with minor abundance in the fecal samples that increased with Hass avocado consumption included several taxa from the Firmicutes phylum (Dialister, Holdemanella, and Acetivibrio), Proteobacteria phylum (Sutterella, Bilophila, and Herbaspirillum), and Euryarchaeota phylum (Methanosphaera). Several of these bacteria have the capacity to ferment plant fiber. Dialister, for example, was found in higher abundance linked to consumption of dietary fiber from whole-grain or soluble corn fiber (47). Sutterellaceae was increased in in vitro citrus pectin fermentation (45). Bilophila, a bile-tolerant micro-organism, was found in increased abundance associated with consumption of an animal-based diet and milk fat (18, 48). Less is known about the capacity to ferment dietary fiber for the bacteria of minor abundance, such as Holdemanella, Acetivibrio, Herbaspirillium, and Methanosphaera, and the Archaea phylum Euryarchaeota.
Another additional benefit of including 1 Hass avocado daily in the hypocaloric diet was the significant decrease in serum HGF concentration. HGF, a hepatokine, has multiple functions in energy metabolism and inflammation (49). HGF synthesis is upregulated in insulin resistance and nonalcoholic fatty liver disease (50). Increased serum HGF has been associated with type 1 and 2 diabetes, metabolic syndrome, and obesity (51). In recent years, it has been shown that HGF regulates acute and chronic inflammation in a variety of diseases, including inflammatory bowel disease, arthritis, and autoimmune inflammation (52). Therefore, a decrease in serum HGF might be beneficial in reducing insulin resistance, fatty liver disease, and inflammatory conditions. In addition, the current study showed a trend to decrease in serum IL-1β and CRP in the AVO group comparing 12 wk to baseline. Serum CRP concentration has been found elevated during inflammatory conditions such as obesity, cardiovascular disease, diabetes, and infection and was correlated with BMI during weight loss (53–55). In the current study, we observed weight loss in both groups, but serum inflammatory markers decreased only in the AVO group and not in the CTRL group. This difference might be related to the beneficial FA profile of Hass avocados. Fatty acids play an important role in inflammatory processes through selective binding to toll-like receptors (TLR4), which are responsible for recognizing pathogen-associated molecular patterns and stimulating inflammatory responses (56). The observed differential changes in plasma FA concentrations in the opposite direction with an increase in the MUFA (oleic acid) and a decrease in saturated FA (palmitic acid) in the AVO group and reverse changes in the CTRL group might have contributed to the difference in inflammatory response.
Our data also suggest that the higher fat and fiber content of avocados might have contributed to weight loss through maintaining satiety and changing the bacterial composition, leading to a change in energy utilization in the large intestine. These findings are in agreement with those of previous studies that demonstrated that including half a Hass avocado in a lunch meal resulted in increased post-ingestive satiety during a 5-h period in overweight and moderately obese adults and also that including high-fiber foods (either beans or fruits, vegetables, and whole grains) in a hypocaloric diet increased postprandial satiety and reduced hunger while achieving 1.4 kg mean weight loss in 4 wk (11, 12).
Potential limitations of this study are the parallel study design, relative short duration, relative low number of participants, and lack of individual dietary intake information. A crossover study design would eliminate some of the interindividual variability of microbiota composition between the AVO and CTRL groups and provide a direct comparison of the avocado effect on the same microbiota background. The disadvantages of a crossover design are the length of the study (at least 24 wk), increased dropout rate, and decreased compliance. In addition, the time of potential sustaining effects of avocado consumption on the microbiota composition is unknown, and a long washout period is necessary. Enrollment of a larger number of participants might have improved the statistical difference between the 2 groups. Collecting data on dietary intake of the participants would provide better insight into the actual consumption of macronutrients and would be helpful in interpreting the outcome.
In summary, our study demonstrated that including 1 Hass avocado daily in a hypocaloric diet supported weight loss associated with different effects on blood metabolic parameters compared with the CTRL group, suggesting the importance of dietary composition in weight management. Weight loss in the AVO group was associated with a shift in the composition of the intestinal microbiota to a microbial pattern characteristic for plant-based carbohydrate intake and resulted in a decrease in serum concentration of pro-inflammatory and metabolic markers such as HGF, IL-1β, CRP, and triglyceride. Further studies on dietary composition in weight management are warranted.
Supplementary Material
Acknowledgments
The authors’ responsibilities were as follows—SMH, JY, C-HT, DH, and ZL: designed the study; SLW, AR, GT, and IG: conducted the clinical trial; JY, R-PL, and JH: conducted the laboratory experiments; SMH, DH, and ZL: wrote the manuscript; and all authors: assisted with data interpretation and read and approved the final manuscript.
Notes
This study was supported by the Hass Avocado Board.
Author disclosures: SMH, JY, SLW, R-PL, JH, AR, CLC, GT, IG, C-HT, DH, and ZL, no conflicts of interest. The Hass Avocado Board was not involved in designing the study, analyzing the data, or preparing the manuscript.
Supplemental Figures 1–3 and Supplemental Tables 1 and 2 are available from the “Supplementary data” link in the online posting of the article and from the same link in the online table of contents at https://academic.oup.com/cdn/.
Abbreviations used: AVO, Hass avocado group; CRP, C-reactive protein; CTRL, control group; FA, fatty acid; HGF, hepatic growth factor; MCP-1, monocyte chemoattractant protein-1; OTU, operational taxonomic unit; PAI, plasminogen activator inhibitor-1; UCLA, University of California, Los Angeles.
References
- 1. GBD 2015 Obesity Collaborators Afshin A, Forouzanfar MH, Reitsma MB, Sur P, Estep K, Lee A, Marczak L, Mokdad AH, Moradi-Lakeh M et al.. Health effects of overweight and obesity in 195 countries over 25 years. N Engl J Med 2017;377(1):13–27. [DOI] [PMC free article] [PubMed] [Google Scholar]
- 2. Kim SH, Despres JP, Koh KK. Obesity and cardiovascular disease: friend or foe? Eur Heart J 2016;37(48):3560–8. [DOI] [PubMed] [Google Scholar]
- 3. Iyengar NM, Hudis CA, Dannenberg AJ. Obesity and cancer: local and systemic mechanisms. Annu Rev Med 2015;66:297–309. [DOI] [PubMed] [Google Scholar]
- 4. Chobot A, Gorowska-Kowolik K, Sokolowska M, Jarosz-Chobot P. Obesity and diabetes—not only a simple link between two epidemics. Diabetes Metab Res Rev 2018;34(7):e3042. [DOI] [PMC free article] [PubMed] [Google Scholar]
- 5. Wing RR, Lang W, Wadden TA, Safford M, Knowler WC, Bertoni AG, Hill JO, Brancati FL, Peters A, Wagenknecht L et al.. Benefits of modest weight loss in improving cardiovascular risk factors in overweight and obese individuals with type 2 diabetes. Diabetes Care 2011;34(7):1481–6. [DOI] [PMC free article] [PubMed] [Google Scholar]
- 6. Zubrzycki A, Cierpka-Kmiec K, Kmiec Z, Wronska A. The role of low-calorie diets and intermittent fasting in the treatment of obesity and type-2 diabetes. J Physiol Pharmacol 2018;69(5). doi: 10.26402/jpp.2018.5.02. [DOI] [PubMed] [Google Scholar]
- 7. Blaak EE. Carbohydrate quantity and quality and cardio-metabolic risk. Curr Opin Clin Nutr Metab Care 2016;19(4):289–93. [DOI] [PubMed] [Google Scholar]
- 8. Dreher ML, Davenport AJ. Hass avocado composition and potential health effects. Crit Rev Food Sci Nutr 2013;53(7):738–50. [DOI] [PMC free article] [PubMed] [Google Scholar]
- 9. Lu QY, Zhang Y, Wang Y, Wang D, Lee RP, Gao K, Byrns R, Heber D. California Hass avocado: profiling of carotenoids, tocopherol, fatty acid, and fat content during maturation and from different growing areas. J Agric Food Chem 2009;57(21):10408–13. [DOI] [PMC free article] [PubMed] [Google Scholar]
- 10. Li Z, Wong A, Henning SM, Zhang Y, Jones A, Zerlin A, Thames G, Bowerman S, Tseng CH, Heber D. Hass avocado modulates postprandial vascular reactivity and postprandial inflammatory responses to a hamburger meal in healthy volunteers. Food Funct 2013;4(3):384–91. [DOI] [PubMed] [Google Scholar]
- 11. Wien M, Haddad E, Oda K, Sabate J. A randomized 3×3 crossover study to evaluate the effect of Hass avocado intake on post-ingestive satiety, glucose and insulin levels, and subsequent energy intake in overweight adults. Nutr J 2013;12:155. [DOI] [PMC free article] [PubMed] [Google Scholar]
- 12. Turner TF, Nance LM, Strickland WD, Malcolm RJ, Pechon S, O'Neil PM. Dietary adherence and satisfaction with a bean-based high-fiber weight loss diet: a pilot study. ISRN Obesity 2013;2013:915415. [DOI] [PMC free article] [PubMed] [Google Scholar]
- 13. Tilg H, Moschen AR. Microbiota and diabetes: an evolving relationship. Gut 2014;63(9):1513–21. [DOI] [PubMed] [Google Scholar]
- 14. Tuohy KM, Fava F, Viola R “The way to a man's heart is through his gut microbiota”—dietary pro- and prebiotics for the management of cardiovascular risk. Proc Nutr Soc 2014;73(2):172–85. [DOI] [PubMed] [Google Scholar]
- 15. Korpela K, Flint HJ, Johnstone AM, Lappi J, Poutanen K, Dewulf E, Delzenne N, de Vos WM, Salonen A. Gut microbiota signatures predict host and microbiota responses to dietary interventions in obese individuals. PLoS One 2014;9(6):e90702. [DOI] [PMC free article] [PubMed] [Google Scholar]
- 16. Million M, Lagier JC, Yahav D, Paul M. Gut bacterial microbiota and obesity. Clin Microbiol Infect 2013;19(4):305–13. [DOI] [PubMed] [Google Scholar]
- 17. Turnbaugh PJ, Hamady M, Yatsunenko T, Cantarel BL, Duncan A, Ley RE, Sogin ML, Jones WJ, Roe BA, Affourtit JP et al.. A core gut microbiome in obese and lean twins. Nature 2009;457(7228):480–4. [DOI] [PMC free article] [PubMed] [Google Scholar]
- 18. David LA, Maurice CF, Carmody RN, Gootenberg DB, Button JE, Wolfe BE, Ling AV, Devlin AS, Varma Y, Fischbach MA et al.. Diet rapidly and reproducibly alters the human gut microbiome. Nature 2014;505(7484):559–63. [DOI] [PMC free article] [PubMed] [Google Scholar]
- 19. Bagga D, Capone S, Wang HJ, Heber D, Lill M, Chap L, Glaspy JA. Dietary modulation of omega-3/omega-6 polyunsaturated fatty acid ratios in patients with breast cancer. J Natl Cancer Inst 1997;89(15):1123–31. [DOI] [PubMed] [Google Scholar]
- 20. Henning SM, Yang J, Shao P, Lee RP, Huang J, Ly A, Hsu M, Lu QY, Thames G, Heber D et al.. Health benefit of vegetable/fruit juice-based diet: role of microbiome. Sci Rep 2017;7(1):2167. [DOI] [PMC free article] [PubMed] [Google Scholar]
- 21. DeSantis TZ, Hugenholtz P, Larsen N, Rojas M, Brodie EL, Keller K, Huber T, Dalevi D, Hu P, Andersen GL. Greengenes, a chimera-checked 16S rRNA gene database and workbench compatible with ARB. Appl Environ Microbiol 2006;72(7):5069–72. [DOI] [PMC free article] [PubMed] [Google Scholar]
- 22. Caporaso JG, Kuczynski J, Stombaugh J, Bittinger K, Bushman FD, Costello EK, Fierer N, Pena AG, Goodrich JK, Gordon JI et al.. QIIME allows analysis of high-throughput community sequencing data. Nat Methods 2010;7(5):335–6. [DOI] [PMC free article] [PubMed] [Google Scholar]
- 23. Lozupone C, Knight R.. UniFrac: a new phylogenetic method for comparing microbial communities. Appl Environ Microbiol 2005;71(12):8228–35. [DOI] [PMC free article] [PubMed] [Google Scholar]
- 24. Langille MG, Zaneveld J, Caporaso JG, McDonald D, Knights D, Reyes JA, Clemente JC, Burkepile DE, Vega Thurber RL, Knight R et al.. Predictive functional profiling of microbial communities using 16S rRNA marker gene sequences. Nat Biotechnol 2013;31(9):814–21. [DOI] [PMC free article] [PubMed] [Google Scholar]
- 25. Gerhard GT, Ahmann A, Meeuws K, McMurry MP, Duell PB, Connor WE. Effects of a low-fat diet compared with those of a high-monounsaturated fat diet on body weight, plasma lipids and lipoproteins, and glycemic control in type 2 diabetes. Am J Clin Nutr 2004;80(3):668–73. [DOI] [PubMed] [Google Scholar]
- 26. Petersen M, Taylor MA, Saris WH, Verdich C, Toubro S, Macdonald I, Rossner S, Stich V, Guy-Grand B, Langin D et al.. Randomized, multi-center trial of two hypo-energetic diets in obese subjects: high- versus low-fat content. Int J Obes 2006;30(3):552–60. [DOI] [PubMed] [Google Scholar]
- 27. Makki K, Deehan EC, Walter J, Backhed F. The impact of dietary fiber on gut microbiota in host health and disease. Cell Host Microbe 2018;23(6):705–15. [DOI] [PubMed] [Google Scholar]
- 28. Weickert MO, Pfeiffer AFH.. Impact of dietary fiber consumption on insulin resistance and the prevention of type 2 diabetes. J Nutr 2018;148(1):7–12. [DOI] [PubMed] [Google Scholar]
- 29. Foster GD, Wyatt HR, Hill JO, McGuckin BG, Brill C, Mohammed BS, Szapary PO, Rader DJ, Edman JS, Klein S. A randomized trial of a low-carbohydrate diet for obesity. N Engl J Med 2003;348(21):2082–90. [DOI] [PubMed] [Google Scholar]
- 30. DiNicolantonio JJ, O'Keefe JH.. Effects of dietary fats on blood lipids: a review of direct comparison trials. Open Heart 2018;5(2):e000871. [DOI] [PMC free article] [PubMed] [Google Scholar]
- 31. Hannon BA, Thompson SV, Edwards CG, Skinner SK, Niemiro GM, Burd NA, Holscher HD, Teran-Garcia M, Khan NA. Dietary fiber is independently related to blood triglycerides among adults with overweight and obesity. Curr Dev Nutr 2019;3(2):nzy094. [DOI] [PMC free article] [PubMed] [Google Scholar]
- 32. Peou S, Milliard-Hasting B, Shah SA. Impact of avocado-enriched diets on plasma lipoproteins: a meta-analysis. J Clin Lipidol 2016;10(1):161–71. [DOI] [PubMed] [Google Scholar]
- 33. Mensink RP, Zock PL, Kester AD, Katan MB. Effects of dietary fatty acids and carbohydrates on the ratio of serum total to HDL cholesterol and on serum lipids and apolipoproteins: a meta-analysis of 60 controlled trials. Am J Clin Nutr 2003;77(5):1146–55. [DOI] [PubMed] [Google Scholar]
- 34. Mahmassani HA, Avendano EE, Raman G, Johnson EJ. Avocado consumption and risk factors for heart disease: a systematic review and meta-analysis. Am J Clin Nutr 2018;107(4):523–36. [DOI] [PubMed] [Google Scholar]
- 35. Clarke SF, Murphy EF, Nilaweera K, Ross PR, Shanahan F, O'Toole PW, Cotter PD. The gut microbiota and its relationship to diet and obesity: new insights. Gut Microbes 2012;3(3):186–202. [DOI] [PMC free article] [PubMed] [Google Scholar]
- 36. Arumugam M, Raes J, Pelletier E, Le Paslier D, Yamada T, Mende DR, Fernandes GR, Tap J, Bruls T, Batto JM et al.. Enterotypes of the human gut microbiome. Nature 2011;473(7346):174–80. [DOI] [PMC free article] [PubMed] [Google Scholar]
- 37. Chen T, Long W, Zhang C, Liu S, Zhao L, Hamaker BR. Fiber-utilizing capacity varies in Prevotella- versus Bacteroides-dominated gut microbiota. Sci Rep 2017;7(1):2594. [DOI] [PMC free article] [PubMed] [Google Scholar]
- 38. De Filippo C, Cavalieri D, Di Paola M, Ramazzotti M, Poullet JB, Massart S, Collini S, Pieraccini G, Lionetti P. Impact of diet in shaping gut microbiota revealed by a comparative study in children from Europe and rural Africa. Proc Natl Acad Sci USA 2010;107(33):14691–6. [DOI] [PMC free article] [PubMed] [Google Scholar]
- 39. Wu GD, Chen J, Hoffmann C, Bittinger K, Chen YY, Keilbaugh SA, Bewtra M, Knights D, Walters WA, Knight R et al.. Linking long-term dietary patterns with gut microbial enterotypes. Science 2011;334(6052):105–8. [DOI] [PMC free article] [PubMed] [Google Scholar]
- 40. Jiao N, Baker SS, Nugent CA, Tsompana M, Cai L, Wang Y, Buck MJ, Genco RJ, Baker RD, Zhu R et al.. Gut microbiome may contribute to insulin resistance and systemic inflammation in obese rodents: a meta-analysis. Physiol Genomics 2018;50(4):244–54. [DOI] [PubMed] [Google Scholar]
- 41. Sandberg J, Kovatcheva-Datchary P, Bjorck I, Backhed F, Nilsson A. Abundance of gut Prevotella at baseline and metabolic response to barley prebiotics. Eur J Nutr 2018;[Epub ahead of print]. doi: 10.1007/s00394-018-1788-9. [DOI] [PMC free article] [PubMed] [Google Scholar]
- 42. Hjorth MF, Blaedel T, Bendtsen LQ, Lorenzen JK, Holm JB, Kiilerich P, Roager HM, Kristiansen K, Larsen LH, Astrup A. Prevotella-to-Bacteroides ratio predicts body weight and fat loss success on 24-week diets varying in macronutrient composition and dietary fiber: results from a post-hoc analysis. Int J Obes 2019;43(1):149–57. [DOI] [PMC free article] [PubMed] [Google Scholar]
- 43. Flint HJ, Bayer EA.. Plant cell wall breakdown by anaerobic microorganisms from the Mammalian digestive tract. Ann N Y Acad Sci 2008;1125:280–8. [DOI] [PubMed] [Google Scholar]
- 44. La Reau AJ, Meier-Kolthoff JP, Suen G. Sequence-based analysis of the genus Ruminococcus resolves its phylogeny and reveals strong host association. Microbial Genomics 2016;2(12):e000099. [DOI] [PMC free article] [PubMed] [Google Scholar]
- 45. Bang SJ, Kim G, Lim MY, Song EJ, Jung DH, Kum JS, Nam YD, Park CS, Seo DH. The influence of in vitro pectin fermentation on the human fecal microbiome. AMB Express 2018;8(1):98. [DOI] [PMC free article] [PubMed] [Google Scholar]
- 46. Menni C, Jackson MA, Pallister T, Steves CJ, Spector TD, Valdes AM. Gut microbiome diversity and high-fibre intake are related to lower long-term weight gain. Int J Obes 2017;41(7):1099–105. [DOI] [PMC free article] [PubMed] [Google Scholar]
- 47. Fouhse JM, Ganzle MG, Beattie AD, Vasanthan T, Zijlstra RT. Whole-grain starch and fiber composition modifies ileal flow of nutrients and nutrient availability in the hindgut, shifting fecal microbial profiles in pigs. J Nutr 2017;147(11):2031–40. [DOI] [PubMed] [Google Scholar]
- 48. Devkota S, Chang EB.. Interactions between diet, bile acid metabolism, gut microbiota, and inflammatory bowel diseases. Dig Dis 2015;33(3):351–6. [DOI] [PMC free article] [PubMed] [Google Scholar]
- 49. Oliveira AG, Araujo TG, Carvalho BM, Rocha GZ, Santos A, Saad MJA. The role of hepatocyte growth factor (HGF) in insulin resistance and diabetes. Front Endocrinol (Lausanne) 2018;9:503. [DOI] [PMC free article] [PubMed] [Google Scholar]
- 50. Agrawal RP, Sheroan V, Ola V, Sulemani AA, Singh N, Sirohi P, Gothwal S, Meel JK. Hepatocyte growth factor, adiponectin and hepatic histopathology in non-alcoholic steatohepatitis. J Assoc Physicians India 2013;61(11):789–92. [PubMed] [Google Scholar]
- 51. Bancks MP, Bielinski SJ, Decker PA, Hanson NQ, Larson NB, Sicotte H, Wassel CL, Pankow JS. Circulating level of hepatocyte growth factor predicts incidence of type 2 diabetes mellitus: The Multi-Ethnic Study of Atherosclerosis (MESA). Metabolism 2016;65(3):64–72. [DOI] [PMC free article] [PubMed] [Google Scholar]
- 52. Molnarfi N, Benkhoucha M, Funakoshi H, Nakamura T, Lalive PH. Hepatocyte growth factor: A regulator of inflammation and autoimmunity. Autoimmun Rev 2015;14(4):293–303. [DOI] [PubMed] [Google Scholar]
- 53. Sproston NR, Ashworth JJ.. Role of C-reactive protein at sites of inflammation and infection. Front Immunol 2018;9:754. [DOI] [PMC free article] [PubMed] [Google Scholar]
- 54. Yatsuya H, Jeffery RW, Langer SL, Mitchell N, Flood AP, Welsh EM, Jaeb MA, Laqua PS, Crowell M, Levy RL. Changes in C-reactive protein during weight loss and the association with changes in anthropometric variables in men and women: LIFE Study. Int J Obes 2011;35(5):684–91. [DOI] [PMC free article] [PubMed] [Google Scholar]
- 55. Beavers KM, Beavers DP, Newman JJ, Anderson AM, Loeser RF Jr, Nicklas BJ, Lyles MF, Miller GD, Mihalko SL, Messier SP. Effects of total and regional fat loss on plasma CRP and IL-6 in overweight and obese, older adults with knee osteoarthritis. Osteoarthritis Cartilage 2015;23(2):249–56. [DOI] [PMC free article] [PubMed] [Google Scholar]
- 56. Fritsche KL. The science of fatty acids and inflammation. Adv Nutr 2015;6(3):293S–301S. [DOI] [PMC free article] [PubMed] [Google Scholar]
Associated Data
This section collects any data citations, data availability statements, or supplementary materials included in this article.