

Abstract
The auditory cortex of the cat is composed of 13 distinct fields that have been defined on the basis of anatomy, physiology, and behavior. Although an anatomically based hierarchical processing scheme has been proposed in auditory cortex, few functional studies have examined how these areas influence one another. The purpose of the present study was to examine the bidirectional processing contributions between primary auditory cortex (A1) and the nonprimary posterior auditory field (PAF). Multiunit acute recording techniques in eight mature cats were used to measure neuronal responses to tonal stimuli in A1 or PAF while synaptic activity from PAF or A1 was suppressed with reversible cooling deactivation techniques. Specifically, in four animals, electrophysiological recordings in A1 were conducted before, during, and after deactivation of PAF. Similarly, in the other four animals, PAF activity was measured before, during, and after deactivation of A1. The characteristic frequency, bandwidth, and neuronal threshold were calculated at each receptive field collected and the response strength and response latency measures were calculated from cumulative peristimulus time histograms. Two major changes in PAF response properties were observed during A1 deactivation: a decrease in response strength and a reduction in receptive field bandwidths. In comparison, we did not identify any significant changes in A1 neuronal responses during deactivation of PAF neurons. These findings support proposed models of hierarchal processing in cat auditory cortex.
Introduction
Neuroanatomical, physiological, and behavioral studies have identified at least 13 fields that form the cat auditory cortex (Reale and Imig, 1980; Malhotra et al., 2004; Lee and Winer, 2008). Similar to the arrangement of almost all studied mammals, the ensemble of these fields is composed of a centrally located primary auditory region surrounded by associative nonprimary auditory fields (Reale and Imig, 1980; Kaas and Hackett, 2000; Bizley et al., 2005; Polley et al., 2007). Although the response characteristics to simple and complex acoustic signals have been frequently reported for individual cortical areas in the cat, there is a conspicuous lack of studies that have investigated how these areas influence one another (Kitzes and Hollrigel, 1996; Carrasco and Lomber, 2009). Despite the lack of functional reports, models of hierarchical organization have been proposed solely on the basis of neuroanatomical studies (Rouiller et al., 1991). The aim of the present study was to determine whether a functional investigation of pathways between primary and nonprimary auditory fields of the cat supports or refutes the current anatomically based models of hierarchical processing in cat auditory cortex.
The current hierarchical model of cat auditory cortex proposes that the processing of acoustic signals is composed of four levels (Rouiller et al., 1991). In the lowest level of processing, neurons in the primary auditory cortex (A1) and the anterior auditory field (AAF) are activated. The subsequent two stages are dominated by the neuronal response of the secondary auditory cortical area (A2) and ventroposterior auditory field (VPAF). Last, acoustic signals reach the highest level in the model in which neurons in the posterior auditory field (PAF) are engaged. In addition to A1 and PAF being located at opposite ends of the proposed hierarchical model, anatomical studies have shown that the largest extrinsic ipsilateral cortical input to PAF (26%) is derived from A1, whereas its reciprocal pathway provides A1 with only 10% of its extrinsic cortical input (Lee and Winer, 2008). Furthermore, functional studies have revealed that neuronal response latencies are significantly longer in PAF than in A1 (Stecker et al., 2003). These anatomical and functional differences suggest that ascending acoustic information should predominately pass from A1 to PAF neurons.
The purpose of the present study was to investigate the bidirectional flow of acoustic information between A1 and PAF. Based on the well defined anatomical reports of hierarchical processing in cat auditory cortex, we hypothesized that acoustic information would flow from A1 to PAF in a feedforward manner and that relatively little information would flow “backward” from PAF to A1. Our results supported this hypothesis, as deactivation of A1 provoked substantial changes in acoustically evoked neuronal activity in PAF. In contrast, deactivation of PAF did not induce considerable changes in the receptive field properties and response strength of A1 neurons. The results of this investigation support previously proposed hierarchical processing models in cat auditory cortex and demonstrate the differential influences that A1 and PAF exert on one another.
Materials and Methods
Overview.
Acoustically evoked responses were measured from the right auditory cortex of eight domestic adult cats (see Fig. 1A). All procedures were conducted in accordance with the National Research Council's Guidelines for the Care and Use of Mammals in Neuroscience and Behavioral Research (2003) and the Canadian Council on Animal Care's Guide to the Care and Use of Experimental Animals (Olfert et al., 1993) and were approved by the University of Western Ontario Animal Use Subcommittee of the University Council on Animal Care. A detailed description of the methodology used in this study has been published previously (Carrasco and Lomber, 2009). A brief description of the methods is presented below.
Figure 1.
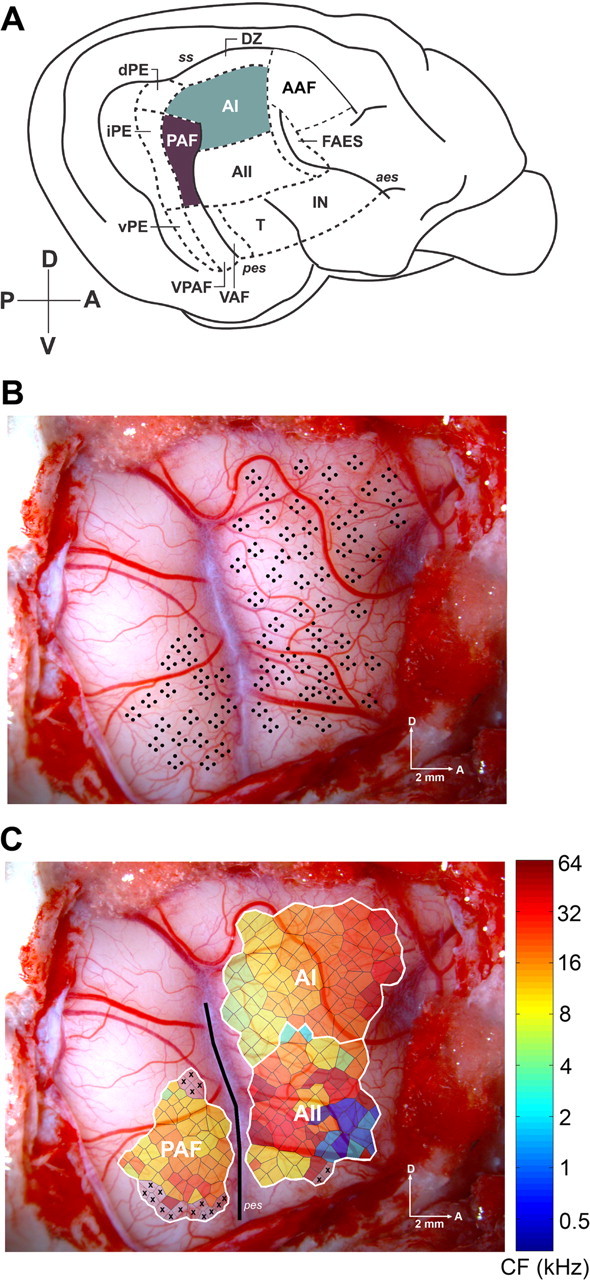
Lateral view of the right hemisphere of the cat cerebral cortex showing the loci examined. A, Schematic drawing of the 13 areas of cat auditory cortex. The highlighted regions illustrate the two areas examined in this study. B, Photomicrograph of the right hemisphere of a cat showing the location of individual microelectrode penetrations and their relationship to cortical vasculature. Each black dot in the figure represents a single recording site. C, Characteristic frequency organization of three auditory cortical fields. The borders (white lines) were defined based on tonotopic organization and latency characteristics. Each polygon represents an estimation of the cortical area with similar response properties as the recorded site. The color of each polygon identifies the characteristic frequency for each recorded site. The posterior ectosylvian sulcus is highlighted with a black line. Abbreviations: VAF, Ventral auditory field; FAES, auditory field of the anterior ectosylvian sulcus; dPE, dorsal posterior ectosylvian area; iPE, intermediate posterior ectosylvian area; vPE, ventral posterior ectosylvian area; IN, insular region; T, temporal region; DZ, dorsal zone. Sulci are indicated in italics: ss, suprasylvian sulcus. D, Dorsal; A, anterior; P, posterior; V, ventral. Scale bar, 2 mm.
Surgical preparation.
Anesthesia was induced with sodium pentobarbital (25 mg/kg, i.v.) (Cheung et al., 2001). Electrocardiogram and blood oxygen concentration were monitored to ensure proper levels of anesthesia and supplemental doses were injected as needed. A rectal probe was used to monitor body temperature. Dexamethasone and atropine (0.03 mg/kg, s.c.) were administered on a 12 h schedule to reduce the chance of edema, as well as respiratory and alimentary secretions, respectively. Animals were hydrated using an infusion pump supplying 2.5% dextrose/half-strength lactated Ringer's solution (4 ml · kg−1 · h−1, i.v.). Intubation was conducted with a cuffed endotracheal tube and respiration was unassisted. The animal was then positioned in a stereotaxic frame. A craniotomy was made over areas A1 and PAF of the right hemisphere. The dura was resected and a layer of silicone oil was applied to the cortex to prevent desiccation. A digital image of the exposed cortical region was taken to maintain a record of the position of each penetration in reference to the cerebral vasculature (see Fig. 1B).
Stimulus generation and presentation.
Recordings took place on an electrically shielded, vibration-free table (Technical Manufacturing Corporation) within a double-walled sound chamber. Acoustic signals were presented in the free-field 15 cm from the left ear, measured at the center of the head, and were digitally generated with a 24 bit digital-to-analog converter at 156 kHz (Tucker-Davis Technologies). Receptive fields were obtained at each recorded site by presenting 2064 pure tones (5 ms rise and fall times, cosine squared gated, 25 ms total duration) in a pseudorandom order chosen from 16 intensities ranging from 0 to 75 dB sound pressure level (SPL) in 5 dB steps, and 129 frequencies in 1/16 octave steps ranging from 250 Hz to 64,000 Hz. Each frequency–intensity combination was presented once at a rate of 2.5 Hz.
Recording procedures.
Parylene-coated tungsten microelectrodes with a 2 × 2 configuration and impedances of 1–2 MΩ at 1000 Hz were used (FHC). The electrodes were lowered ∼1200 μm (layer IV/V) into auditory cortex. To increase the likelihood of consistent laminae recording, all microelectrode penetrations were limited to the gyral surface. Recordings were bandpass filtered (500–5000 Hz), amplified (10,000×), and digitized at 25,000 Hz. In four of the animals, frequency–intensity receptive fields were derived at different locations of auditory cortex to delineate the borders of primary auditory cortex (A1). During these recordings, no cortical deactivation was induced. After a clear distinction of the A1 borders was established based on neuronal response properties (Merzenich et al., 1975; Knight, 1977; Reale and Imig, 1980; Imaizumi et al., 2004), a cooling loop was apposed on the midfrequency bands of A1. This arrangement guaranteed that the cooling loop was located as far as possible from adjacent fields and that the cooling deactivation did not exceed the A1 borders.
In the remaining four animals, cooling loops were placed on PAF (Reale and Imig, 1980; Phillips and Orman, 1984), located caudal and ventral to A1. PAF cryoloops extended from the anterior one-third of the dorsal–posterior ectosylvian gyrus to the fundus of the dorsal one-half of the posterior ectosylvian sulcus (PES). As we have done previously (Malhotra and Lomber, 2007; Lomber and Malhotra, 2008), a heat-shielding compound (SO-FH06; Small Parts) was applied to the anterior side of the PAF loops to keep the cooling deactivation localized to the posterior bank of PES. Neuronal deactivation was assessed by lowering an electrode through the center of the cooling loop into layers IV/V and generating a frequency–intensity receptive field before, during, and after cooling deactivation. After confirmation of neuronal deactivation, receptive fields were derived in A1 during PAF deactivation and in PAF during A1 deactivation for each of the five stages of a cooling cycle: before, transitioning to, during, transitioning out of, and after cooling.
To guarantee that any changes observed were induced by cortical deactivation and not cell death, neuronal activity thresholds were defined before the commencement of a recording cycle and were maintained for all five conditions. Thermal maps were produced at the end of the procedure by lowering a 0.2 mm outer diameter mini-hypodermic probe type T thermocouple (HYP-O; Omega) during an epoch of cooling deactivation to the same locations at which the neuronal activity had previously been measured. The generation of thermal maps was used to demarcate the extent of deactivation.
Reversible cooling deactivation.
Cryoloops of different shapes and sizes were fabricated before each experimental procedure from 23 gauge hypodermic tubing (Lomber et al., 1999). After the electrophysiological demarcation of A1 was completed, an appropriate cryoloop was chosen based on the size and shape of the field. Similarly, PAF cooling loops were prefabricated and chosen based on the size and shape of PES. A copper/constantin microthermistor was attached at the union of the loop. Cooling was achieved by pumping chilled methanol through the lumen of the cryoloop. Loop temperature was monitored, via a wireless thermometer (UWTC-2; Omega). Acoustically evoked activity throughout the full thickness of cortex beneath the cryoloop was eliminated by maintaining the cooling probe at 3°C. This temperature reliably places the 20°C thermocline at the base of layer VI (Lomber et al., 1994, 1999; Lomber, 1999; Chafee and Goldman-Rakic, 2000; Palmer et al., 2007; Nakamoto et al., 2008). Receptive fields at each recording site were collected for each of the five stages of the cooling cycle.
Data analysis.
Caudal and rostral A1 and PAF borders were defined on the basis of tonotopy and latency measures (Reale and Imig, 1980). In contrast, borders orthogonal to A1 were defined on the basis of latency and bandwidth measures (Middlebrooks and Zook, 1983; Schreiner and Cynader, 1984; Stecker et al., 2005). Nonmutual A1 and PAF boundaries were determined using nonresponsive and non-A1/PAF sites. The recorded receptive fields were randomized and analyzed by a blind observer based on (1) characteristic frequency, defined as the tone frequency that evokes a reliable response at the lowest intensity level; (2) threshold, minimum intensity level that evoked a consistent neural response; and (3) bandwidths, receptive field widths above threshold in 5 dB SPL steps. A custom-made program using MatLab (Mathworks) generated a peristimulus time histogram (PSTH) from all the responses to tonal stimulation at each recorded site. The response strength was defined as the maximum number of spikes per second in the PSTH, and the noise level was calculated as the mean spike rate 50 ms before tone presentation. The onset latency was calculated as the time in the PSTH in which evoked neuronal activity reached 2 SDs above noise, peak latency was defined as the time at which the maximum number of driven spikes occurred within the PSTH, and end latency was measured as the time at which evoked activity returned to within 2 SDs of the noise level. To reduce the possibility that the changes observed were a consequence of neuronal death rather than cortical deactivation, recording sites that did not return to at least 60% of their original firing rate were not included in the analysis. All statistical comparisons in this study were conducted with a two-tailed unpaired Student's t test. Characteristic frequency and thermal cortical maps were constructed by generating Voronoi tessellations (see Fig. 1C) (Kilgard and Merzenich, 1998).
Results
The objective of this investigation was to measure the bidirectional processing contributions between A1 and PAF of the cat. The results are divided into four sections. In the first section, the general response characteristics of A1 and PAF neurons are described and compared. Section 2 is devoted to the explanation of the effects of cooling on neuronal activity. Section 3 examines the changes in response properties of PAF neurons induced by A1 cooling deactivation. Last, section 4 describes the changes in response properties of A1 neurons during periods of PAF cooling deactivation.
Comparison of A1 and PAF response properties
All A1 cortices investigated were bounded dorsally by the dorsal zone of auditory cortex (DZ), ventrally by A2, anteriorly by AAF, and posteriorly by PAF and the dorsal posterior ectosylvian area. In contrast, all PAF cortices examined were bounded anterodorsally by A1, ventrally by VPAF, posteriorly by the intermediate posterior ectosylvian area (iPE), and anteriorly by A1 and A2 (Fig. 1A). A clear tonotopic organization was observed in A1 and PAF with the low-frequency representation border of both fields located within the banks of PES. From the banks of PES, A1 extended anteriorly and commonly culminated near the dorsal region of the anterior ectosylvian sulcus in which neurons with high-frequency tuning were encountered. In comparison, PAF extended posteroventrally with high-frequency neurons found near the border with VPAF (Fig. 1C).
Temporal measures
We investigated the multiunit neuronal response latencies of 840 A1 and 268 PAF cortical sites. Consistent with previous reports in the cat, ferret, and rat (Stecker et al., 2003; Bizley et al., 2005; Polley et al., 2007; Pandya et al., 2008), the peak response latency of PAF neurons was significantly longer (p < 0.00001; A1 mean peak response, 18.15 ms; PAF mean peak response, 36.78 ms) than the peak response latency of A1 neurons (Fig. 2A). The difference in evoked neuronal responses revealed that acoustic information generally arrives at A1 before reaching PAF.
Figure 2.

Response properties of A1 and PAF neurons. A, Population PSTHs of 840 A1 and 268 PAF multiunit sites. B, Mean receptive field bandwidths calculated at each of 15 intensities (in decibels SPL) presented above neuronal threshold from seven A1 and four PAF cortices. C, Neuronal threshold measures of A1 and PAF neurons. Color region (purple and green) in A and error bars in B represent ±SEM. The lines in the box plots of C illustrate the lower quartile, median, and upper quartile values. The whiskers from each end of the boxes show the extent of the rest of the data, and outliers are shown with plus (+) signs beyond the ends of the whiskers. In B, *p < 0.01; **p < 0.05.
Bandwidth measures
A property central to the processing of auditory signals is the breadth of tones from the acoustic frequency spectrum that can trigger a neuronal response. Thus, the neuronal bandwidth of A1 and PAF neurons was investigated by measuring the length of each receptive field at 5 dB steps from 5 to 75 dB SPL above neuronal threshold. This analysis yielded a statistically significant (p < 0.05) difference between A1 and PAF neurons predominately at low- and high-intensity levels with PAF neurons displaying wider bandwidth measures (Fig. 2B). Additionally, this measure revealed a monotonic bandwidth increase in both fields investigated. These results indicate that PAF has slightly wider bandwidths at specific regions of the intensity spectrum.
Threshold measures
The neuronal thresholds of A1 and PAF neurons were investigated by identifying the minimum intensity level at which a reliable neuronal response was attainable. These values were then matched and classified based on characteristic frequency and grouped in one of two frequency bins. The low-frequency bin ranged from 1000 to 8000 Hz, and the high-frequency bin ranged from 8000 to 64,000 Hz. No statistically significant differences were observed for threshold measures between matching frequency bins (Fig. 2C). This analysis provides evidence that A1 and PAF cells display comparable neuronal thresholds regardless of frequency tuning properties.
Effects of deactivation on neuronal response
Deactivation assessment
Temperature gradients in auditory cortex were assessed to confirm that changes in response properties were a consequence of neuronal activity suppression in the cooled region, and not a direct effect of cooling deactivation on the recorded field. To minimize the possibility of cooling contaminating regions of PAF during epochs of A1 cooling, loops were placed over the midfrequency region of A1 (Fig. 3A). This placement permitted us to deactivate the majority of A1 without changing the cortical temperature of the adjacent PAF region. To examine the reciprocal pathway, we thermally shielded the anterior side of the PAF loops to keep the cooling deactivation localized on the posterior bank of PES and to prevent any cooling of A1 regions near PES (Fig. 3B). We confirmed the location and degree of cooling deactivation by measuring the extent of cortical cooling and magnitude of neuronal silencing.
Figure 3.

Representative examples of changes in cortical temperature during epochs of cooling deactivation. A, Characteristic frequency representation of primary and nonprimary fields of auditory cortex and location of A1 cooling loop (transparent gray shaded region). B, Characteristic frequency representation of primary and nonprimary fields of auditory cortex and location of PAF cooling loop (solid gray shaded region). C, Cortical temperature during periods of A1 cooling. D, Cortical temperature during periods of PAF cooling. Note that A1 and PAF cooling did not extend into any adjacent cortical regions. Sulci are indicated by thick nonconnected black lines. X, Unresponsive cortical site. Abbreviations are as in Figure 1. Scale bar, 2 mm.
Extent
The extent of deactivation produced by cooling was assessed at the end of each experiment. During an epoch of A1 or PAF deactivation, changes in cortical temperature were measured at the same location of previously conducted electrophysiological recordings. Subsequently, thermal maps were generated to reveal the extent of cortical deactivation (Fig. 3C,D). As illustrated in Figure 3, C and D, deactivation of A1 or PAF was generally contained within the loci of interest and did not extend into adjacent cortical fields. Therefore, we were able to define the cortical region affected by cooling and confirm the coverage of deactivation.
Magnitude
Neuronal deactivation was measured at a site immediately underneath the cooling loop placement. PSTHs and receptive fields were generated during the five phases of the deactivation cycle. This measure provided verification of the complete elimination of neuronal activity at the site of cooling deactivation. A representative example of the effects of cooling on neuronal activity is presented in Figure 4. Figure 4, left, illustrates the changes in response strength, whereas Figure 4, right, shows the magnitude and location of the effects on receptive field structure. It is clear from this measure that neuronal activity before and after deactivation is almost indistinguishable, whereas the neuronal activity during cooling deactivation is completely abolished.
Figure 4.

PSTHs and corresponding receptive fields of an A1 site recorded directly beneath a cryoloop during the five stages of a cooling cycle. Data were collected (1) before the initiation of cooling (A, B), (2) during transitional cooling (C, D), (3) while cooled (E, F), (4) during transitional rewarming (G, H), and (5) during rewarmed epochs (I, J). Note that each square in the grid represents a frequency–intensity combination presented during the recording period. The white squares indicate no spikes during the recording period in response to a tone presentation. Temperatures were measured at the cooling loop thermocouple and indicate the stage of the cooling cycle.
Effects of A1 deactivation on PAF response properties
The quantification of PAF response properties during A1 deactivation revealed two significant changes. First, the response strength of PAF neurons was reduced during epochs of A1 deactivation. Second, a sharpening of receptive field bandwidths was observed at intensity levels <70 dB SPL. In contrast, no significant changes were found in PAF neuronal threshold or latency measures during A1 deactivation.
Response strength
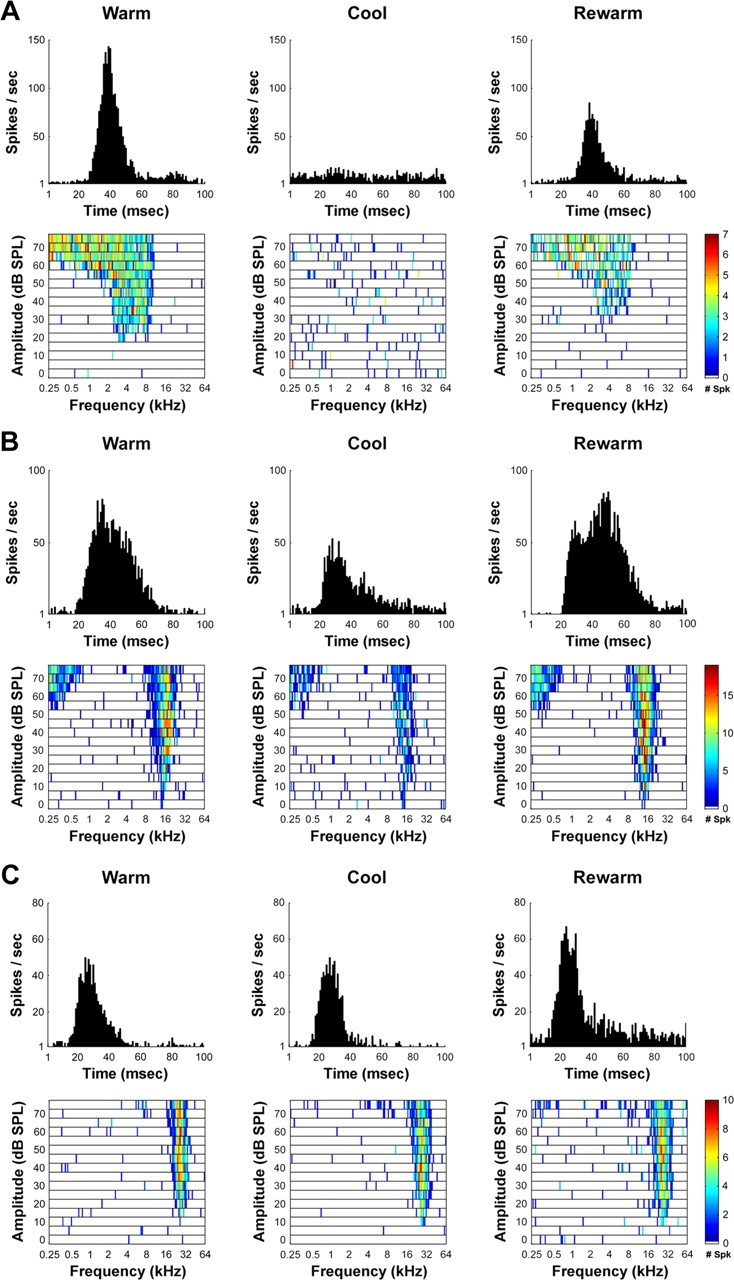
Two analytical approaches were used to quantify the acoustically evoked activity of PAF neurons before, during, and after A1 cooling deactivation. First, individual PSTHs were generated as the cumulative response of neuronal activity to tonal stimuli. A significant decrease (p = 0.018) of 35.11% in peak response strength was revealed during the A1 deactivation phase. Figure 5, A and C, shows the group response strength of PAF neurons in each of the five phases of a recording cycle. Notice the large difference between the peak response during the A1 warm and cool conditions. In a subsequent quantification method, we calculated the cumulative maximum number of spikes per second for each recorded site. The individual and group values are illustrated in Figure 6, A and B. This analysis revealed a significant difference (p = 0.006) in the average of PAF-driven responses before and during epochs of A1 cooling deactivation. Both analytical approaches revealed a statistically significant change of response strength, providing evidence of a substantial modulatory influence of A1 over PAF responses. Although the group analysis of this condition revealed a considerable change, a large variability was observed among individual recordings. Specifically, in 10 of 49 PAF sites examined (20.41%), a large reduction of 66% or more of the original firing rate was recorded during epochs of A1 deactivation (Fig. 7A); in 12 of 49 sites (24.49%), a midsize reduction between 33 and 66% of the original firing rate was measured (Fig. 7B); and in 13 of 49 recorded sites (26.53%), a small change of <33% of the original firing rate was revealed. In the remaining 14 recorded sites, an increase in the peak response was measured (28.57%) (Fig. 7C).
Figure 5.

A, PAF neuronal activity during the five stages of A1 cooling deactivation. B, A1 neuronal activity during the five stages of PAF cooling deactivation. C, Average temperature changes recorded at the cooling loop during A1 and PAF deactivation. The graphs in A and B match the times during which the PSTHs were recorded, as illustrated in C. Note the substantial decrease in PAF activity during A1 deactivation compared with the neuronal activity recorded during the warm and rewarm A1 conditions. Also, note that the activity of A1 neurons recorded before and during PAF cooling deactivation did not significantly differ. The black regions in A and B represent ±SEM.
Figure 6.

Mean peak response strength to tonal stimuli before, during, and after cooling deactivation. A, Response of PAF neurons plotted before (x-axis) and during (y-axis) A1 deactivation with the corresponding least-square regression line plotted as a dashed line. C, Similarly plotted is the peak response strength of A1 neurons during PAF deactivation with the corresponding least-square regression line (dashed line). Average peak response strength of PAF (B) and A1 (D) neurons recorded before, during, and after periods of A1 and PAF cooling deactivation. Note that there is a statistically significant change (p = 0.006) in PAF cells during periods of A1 cooling, but similar changes are not evident in A1 cells during PAF deactivation. Regression line equations are as follows: y = 0.93x + −3.77 (A); y = 0.18x + 26.46 (C). Error bars indicate ±SEM. A1, n = 203; PAF, n = 49.
Figure 7.
Representative changes in acoustically evoked activity of PAF neurons before, during, and after the cooling deactivation of A1. Three main types of changes were observed in PAF receptive fields and PSTHs during the cooling deactivation of A1 as follows. A, Large effects incurred by PAF neurons during A1 deactivation. B, Midsize decrease in PAF neuronal activity during A1 deactivation. C, Small size reduction in activity of PAF neurons during the deactivation of A1 neurons.
Bandwidth
We investigated the changes in PAF bandwidth measures before, during, and after the silencing of A1 activity. The analysis quantified the type and magnitude of influence that A1 activity exerts on PAF bandwidths. Specifically, we measured the bandwidth of each PAF receptive field at 5 dB steps from 5 to 75 dB SPL above neuronal threshold. This analysis revealed a statistically significant decrease (p < 0.05) of bandwidth sizes at multiple amplitude levels (Fig. 8A). The changes observed in PAF bandwidth measures show that certain properties of PAF receptive fields are modulated by A1 activity.
Figure 8.
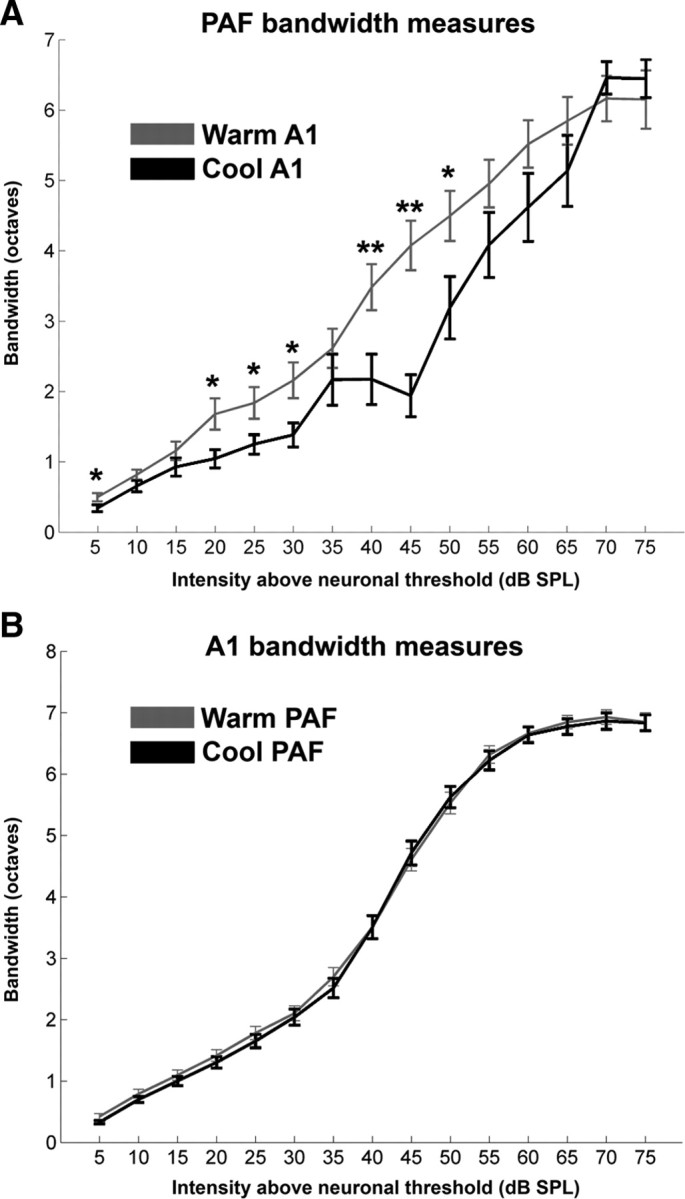
Changes in PAF (A) and A1 (B) mean receptive field bandwidths at 15 intensities (in decibels SPL) above neuronal threshold provoked by cooling deactivation. Note that a uniform decrease of receptive field bandwidth size was observed in PAF neurons during A1 deactivation. In contrast, this change was not seen in A1 sites during PAF deactivation. Error bars indicate ±SEM. A1, n = 203; PAF, n = 49. Shown is statistical significance at *p < 0.05 and **p < 0.01.
Threshold
The neuronal sensitivity of cortical neurons to tonal stimulation was measured. This level was determined to be the minimum intensity (in decibels SPL) needed to reliably produce a neuronal response. On average, the PAF neuronal threshold did not significantly change during periods of A1 deactivation. Before A1 cooling, the average neuronal threshold of PAF neurons was 9.18 (±1.41) dB SPL, and during epochs of A1 deactivation the average PAF neuronal threshold was 10.41 (±1.91) dB SPL. The lack of change of PAF neuronal threshold suggests that A1 may not be involved in the modulation of PAF neuronal sensitivity to acoustic signals.
Response latencies
Three types of latency measures were calculated for each recorded cortical site: onset, peak, and end latencies. This analysis was designed to identify the flow of acoustic information between A1 and PAF based on response timing. A detailed examination of latency measures for each data point revealed that the latency values of most PAF cells [onset, 48.98% (Fig. 9A); peak, 65.31% (B); end, 55.1% (C)] underwent a change of <33% from the original firing rate. The averaged population data of PAF latency measures confirmed that no statistically significant changes were induced during epochs of A1 deactivation (Fig. 9D). This analysis indicates that the timing of PAF cell firing may not be modulated by A1 activity.
Figure 9.

Neuronal latency changes in PAF sites during periods of A1 deactivation. A–C, Changes in onset latency (A), peak latency (B), and end latency (C). PAF latency values are plotted before (x-axis) and during (y-axis) A1 deactivation for each latency measure. D, Summary of mean neuronal changes in PAF latency measures during A1 deactivation. Note that no statistically significant changes in latency measures were observed in PAF neurons during epochs of A1 deactivation. Error bars indicate ±SEM; n = 49.
Effects of PAF deactivation on A1 response properties
Unlike the significant changes observed in PAF response properties during epochs of A1 deactivation, our analysis of A1 response activity did not reveal any major change in the receptive field structure or response strength of A1 neurons during the reversible deactivation of PAF. The results of four measures investigated are provided.
Bandwidth
A monotonic increase in bandwidth measures as a function of intensity was revealed in A1 cells before and after PAF deactivation. However, contrasting the large changes observed in PAF cells during A1 deactivation, no changes in A1 bandwidth measures were revealed during PAF deactivation. Figure 8B illustrates the previous (gray) and during (black) deactivation bandwidth measures of A1 cells. The lack of change implies that PAF does not have a large impact on A1 bandwidth measures.
Threshold
Similar to the lack of change observed in PAF cells during A1 deactivation, the silencing of PAF neuronal activity did not result in significant changes of A1 neuronal thresholds. Before periods of PAF deactivation, the average neuronal threshold of A1 neurons was 12.32 (±0.83) dB SPL and during epochs of PAF deactivation the average A1 neuronal threshold was 12.01 (±0.85) dB SPL. The lack of variations in A1 neuronal thresholds during PAF deactivation suggests that PAF activity does not modulate A1 neuronal sensitivity to acoustic signals.
Response latencies
A comparison of the onset, peak, and end latencies of A1 cells before and during the deactivation of PAF activity was conducted. This analysis revealed that the response timing of most A1 neurons [onset, 61.58% (Fig. 10A); peak, 93.6% (B); end, 90.6% (C)] underwent a change of <33% from the original response time. Comparable with the result observed in individual recordings, the group data for the peak and end measures did not result in a significant change (Fig. 10D). In contrast, the group onset latencies between the two conditions resulted in a statistically significant difference (p = 0.0024). This analysis indicates that the firing timing of A1 cells is not modulated by PAF activity.
Figure 10.

Neuronal latency changes in A1 sites during periods of PAF deactivation. A–C, Changes in onset latency (A), peak latency (B), and end latency (C). A1 latency values are plotted before (x-axis) and during (y-axis) PAF deactivation for each latency measure. D, Summary of mean neuronal changes in A1 latency measures during PAF deactivation. Note that the only statistically significant difference was observed at the onset latency measures. Error bars indicate ±SEM; n = 203. Shown is statistical significance at *p = 0.0024.
Response strength
In contrast to the considerable variations in acoustically evoked activity of PAF neurons during A1 deactivation, no statistically significant changes in A1 evoked responses during PAF deactivation were revealed. Figure 5B illustrates the lack of variation in response activity by showing the grouped data of A1 sites during the five phases of a PAF deactivation cycle. In addition, we conducted an analysis of the cumulative maximum number of spikes per second for each recorded site and found a comparable lack of modulatory influence of PAF deactivation on A1 response activity (Fig. 6C,D). It is important to note, however, that although the group data analysis did not reveal statistically significant changes of A1 activity, variations in response characteristics of individual recording sites were observed. Specifically, in 14 of 203 PAF sites examined (6.9%), a large reduction of 66% or more of the original firing rate was recorded during epochs of PAF deactivation (Fig. 11A); in 37 of 203 sites (18.23%), a midsize reduction between 33 and 66% of the original firing rate was measured (Fig. 11B); and in 85 of 203 recorded sites (41.87%), a small decrease of <33% from the original firing rate was observed. In the remaining 67 sites, an increase in the peak response was measured (33%) (Fig. 11C).
Figure 11.
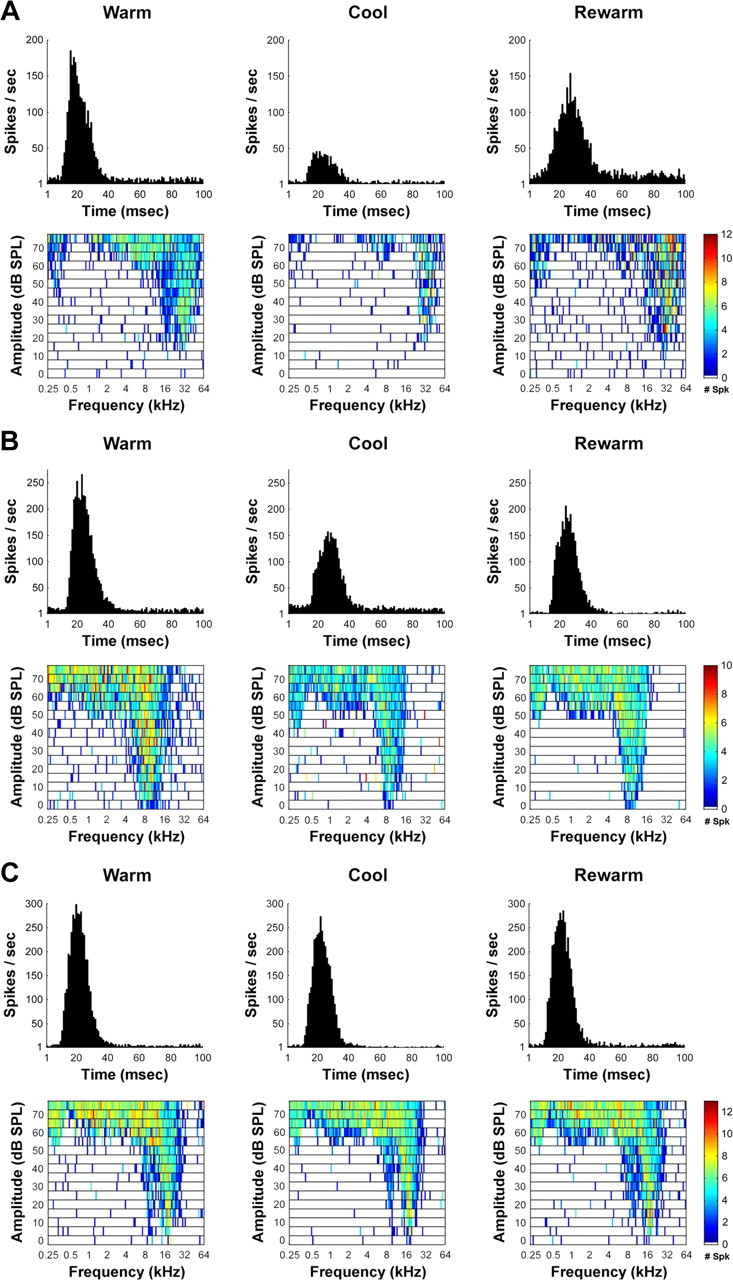
Representative changes in acoustically evoked activity of A1 neurons before, during, and after the cooling deactivation of PAF. Three main types of changes were observed in A1 receptive fields and PSTHs, during the cooling deactivation of PAF. A, Large effects incurred by A1 neurons during PAF deactivation. B, Midsize reduction of A1 neuronal activity during PAF deactivation. C, Small size reduction in activity of A1 neurons during the deactivation of PAF neurons.
Discussion
Comparison with previous investigations
Response properties
The response properties of A1 and PAF neurons investigated in this study are in general agreement with previous reports. First, the cortical organization of characteristic frequencies identified at the recorded sites revealed a tonotopic representation in A1 and PAF with a reversal in frequency gradient at their mutual border (Reale and Imig, 1980). Second, as demonstrated in rat (Pandya et al., 2008) and monkey (Rauschecker et al., 1995; Rauschecker and Tian, 2004; Kusmierek and Rauschecker, 2009), receptive field bandwidths were wider for neurons in PAF than A1. Last, PAF response latencies were considerably longer than A1 measures. This finding is consistent with reports in the rat, ferret, and cat (Stecker et al., 2003; Bizley et al., 2005; Polley et al., 2007; Pandya et al., 2008). Overall, our results fit well with previous reports of response properties of neurons in A1, and regions posterior to A1.
PAF response changes during A1 deactivation
Results of the present study are comparable with reports in the rhesus monkey in which A1 deactivation was shown to abolish the response of posterior auditory cortex [caudomedial (CM) area] neurons (Rauschecker et al., 1997). However, although Rauschecker et al. (1997) reported that tonal stimulation did not drive CM neurons after A1 deactivation, our analysis revealed that PAF responses to tonal stimulation in the cat were significantly impaired, but not completely silenced, by deactivation of A1 neurons. This is an important difference as our results demonstrate that, although tonal signals seem to generally flow from A1 to PAF, the transmission of acoustic information to PAF may not depend solely on A1 activity. Consequently, our results fit well with the model of information processing proposed in the rhesus monkey and provide evidence of a second (parallel processing) pathway that allows tonal information to reach PAF without previous A1 processing.
Contrary to the results of the present investigation and Rauschecker et al. (1997), Kitzes and Hollrigel (1996) failed to demonstrate that the physical removal of cat A1 results in a reduction of response strength in PAF neurons. Interpretation of these results is difficult because the deactivation technique implemented by the investigators resulted in the inability to record from the same neurons before, during, and after A1 removal. In addition, the borders of A1 were not delineated before ablation resulting in a gross anatomical estimation of the location of A1 rather than a physiologically defined demarcation of the region. The technical difficulties encountered in the investigation by Kitzes and Hollrigel (1996) were overcome in the present study through the use of reversible-cooling techniques and physiological cortical mapping before deactivation.
The similarity of the results of the present study with the investigation of the effects of A1 deactivation on area CM activity of the rhesus monkey (Rauschecker et al., 1997) suggests that in Old World monkey and feline species, acoustic signals engage the response of A1 neurons before radiating posteriorly and modulating nonprimary auditory fields.
Direction of information flow
The variations in bandwidth and response magnitude of PAF neurons during A1 deactivation suggest that specific characteristics of acoustic information are exchanged between these two fields. The direction of information flow revealed in our study can be explained on the basis of two functional and anatomical differences between A1 and PAF neurons: first, differences in acoustically evoked neuronal response latencies, and second, unequal reciprocal corticocortical connectivity between the two fields.
Response latencies
One difference between A1 and PAF acoustically evoked activity is the timing at which neurons from both fields reach their maximum firing rate. Although A1 cells display a fast response to tonal stimulation, acoustically evoked PAF response latencies are generally longer with an onset of increased activity that overlaps the latter part of the A1 neuronal response (Fig. 2A). Furthermore, PAF neurons generally reach a peak firing rate subsequent to the termination of the evoked A1 response (Fig. 2A). The observed difference in neuronal response timing properties between A1 and PAF suggests that the direct flow of information between the two fields is likely to pass through A1 before it reaches PAF, because A1 neurons have enough time to interfere with the activity of PAF neurons. Conversely, it is unlikely that PAF activity can have a direct effect on the response properties of A1 neurons since the majority of PAF acoustically evoked activity occurs subsequent to the peak neuronal response latency of A1 neurons (Fig. 2A).
Corticocortical projections
A recent report on corticocortical connectivity in cat auditory cortex revealed unequal reciprocal connections between A1 and PAF (Lee and Winer, 2008). It was shown that AAF is the principal extrinsic input to A1 and that only 10% of A1 extrinsic inputs originate from PAF (Lee and Winer, 2008). In comparison, the principal extrinsic cortical input to PAF (26%) was shown to originate from A1. Although an asymmetry of information exchange between A1 and PAF cannot be concluded from this anatomical dissimilarity, it is reasonable to assume that larger amounts of information are transferred from A1 to PAF than through its reciprocal pathway.
Although the results of the present study can be explained based on response timing and corticocortical connections, it is important to note that we cannot rule out the possible involvement of other direct and indirect factors that may have participated in the observed changes in PAF neuronal responses. The reciprocal connections between the medial geniculate body (MGB) and auditory cortex (Imig and Morel, 1984, 1985; Morel et al., 1987) are a likely source of indirect influence (Scannell et al., 1999). It is plausible that A1 deactivation may have induced changes in the response properties of thalamic neurons and that, as a consequence of these changes, thalamocortical connections provoked the observed variations in PAF neuronal activity. In the future, a complete model of the influence exerted between auditory cortical fields should include a description of the effects of A1 deactivation on MGB neurons.
Comparison with visual and somatosensory reports
Processing of sensory stimulation has been shown to occur in a sequential order [visual (Girard and Bullier, 1989; Girard et al., 1991); somatosensory (Pons et al., 1987)]. Specifically, in the monkey visual system, deactivation of the primary visual cortex (V1) considerably reduces the neuronal activity in areas V2, V3, and V4 (Girard and Bullier, 1989; Girard et al., 1991). These results have been interpreted as proof that neither direct geniculate inputs, nor feedback projections from other cortical areas such as the middle temporal area, are capable of driving V2 neurons in the absence of V1 input. Similarly, the physical removal of S1 has been shown to result in the silencing of SII neurons in macaques (Pons et al., 1987). Collectively, the results in the visual and somatosensory systems reveal that specific regions of sensory cortex may transfer information in a sequential order. However, neither the conclusions of these investigations nor the results of the present study should be interpreted as describing a ubiquitous form of sensory information processing in cortex.
Evidence for the existence of a complex system of acoustic signal processing in auditory cortex has been reported. First, a study in the rhesus monkey revealed that the dependence of area CM on A1 activity is stimulus specific (Rauschecker et al., 1997). In this study, the investigators showed that neuronal activity to tonal, but not complex, acoustic stimulation was abolished in area CM neurons during A1 deactivation. Second, reports in the cat have shown that A1 and AAF process information in parallel and that the deactivation of A1 does not result in considerable variation of neuronal activity in AAF (Carrasco and Lomber, 2009). In addition, functional magnetic resonance imaging studies have provided evidence of the existence of hierarchical organization in human auditory cortex (Wessinger et al., 2001). Consequently, there is now evidence for the existence of a complex system of serial and parallel processing pathways in auditory cortex of the cat, monkey, and humans. The lack of changes observed in A1 activity during PAF deactivation may be interpreted as the inability of feedback projections to affect the response properties of the targeted neurons during the presentation of simple acoustic stimuli. Future experiments should investigate the effects of complex acoustic stimulation on communicative properties between PAF and A1.
Cortical processing streams
In humans (Griffiths et al., 1998; Clarke et al., 2000; Arnott et al., 2004), monkeys (Rauschecker, 1998a,b; Tian et al., 2001), and cats (Lomber and Malhotra, 2008), acoustic functions can be localized in cortical regions specialized for “what” and “where” processing (anterior and posterior auditory cortex, respectively). Electrophysiological studies in monkeys (Rauschecker et al., 1997) and cats (Carrasco and Lomber, 2009; present study) have established that processing in “where” regions of auditory cortex (like PAF) is far more dependent on input from A1 than “what” regions of auditory cortex. The findings of Carrasco and Lomber (2009) also support a model of parallel and independent signal processing being conducted by A1 and anterior auditory cortices (like AAF). Together, these findings support “what” and “where” streams of information in auditory cortex, with “what” processing being more parallel and “where” processing being more serial in nature.
Footnotes
This work was supported in part by grants from the Canadian Institutes of Health Research, the Natural Sciences and Engineering Research Council of Canada, and the Canada Foundation for Innovation.
References
- Arnott SR, Binns MA, Grady CL, Alain C. Assessing the auditory dual-pathway model in humans. Neuroimage. 2004;22:401–408. doi: 10.1016/j.neuroimage.2004.01.014. [DOI] [PubMed] [Google Scholar]
- Bizley JK, Nodal FR, Nelken I, King AJ. Functional organization of ferret auditory cortex. Cereb Cortex. 2005;15:1637–1653. doi: 10.1093/cercor/bhi042. [DOI] [PubMed] [Google Scholar]
- Carrasco A, Lomber SG. Differential modulatory influences between primary auditory cortex and the anterior auditory field. J Neurosci. 2009;29:8350–8362. doi: 10.1523/JNEUROSCI.6001-08.2009. [DOI] [PMC free article] [PubMed] [Google Scholar]
- Chafee MV, Goldman-Rakic PS. Inactivation of parietal and prefrontal cortex reveals interdependence of neural activity during memory-guided saccades. J Neurophysiol. 2000;83:1550–1566. doi: 10.1152/jn.2000.83.3.1550. [DOI] [PubMed] [Google Scholar]
- Cheung SW, Nagarajan SS, Bedenbaugh PH, Schreiner CE, Wang X, Wong A. Auditory cortical neuron response differences under isoflurane versus pentobarbital anesthesia. Hear Res. 2001;156:115–127. doi: 10.1016/s0378-5955(01)00272-6. [DOI] [PubMed] [Google Scholar]
- Clarke S, Bellmann A, Meuli RA, Assal G, Steck AJ. Auditory agnosia and auditory spatial deficits following left hemispheric lesions: evidence for distinct processing pathways. Neuropsychologia. 2000;38:797–807. doi: 10.1016/s0028-3932(99)00141-4. [DOI] [PubMed] [Google Scholar]
- Girard P, Bullier J. Visual activity in area V2 during reversible inactivation of area 17 in the macaque monkey. J Neurophysiol. 1989;62:1287–1302. doi: 10.1152/jn.1989.62.6.1287. [DOI] [PubMed] [Google Scholar]
- Girard P, Salin PA, Bullier J. Visual activity in areas V3a and V3 during reversible inactivation of area V1 in the macaque monkey. J Neurophysiol. 1991;66:1493–1503. doi: 10.1152/jn.1991.66.5.1493. [DOI] [PubMed] [Google Scholar]
- Griffiths TD, Büchel C, Frackowiak RS, Patterson RD. Analysis of temporal structure in sound by the human brain. Nat Neurosci. 1998;1:422–427. doi: 10.1038/1637. [DOI] [PubMed] [Google Scholar]
- Imaizumi K, Priebe NJ, Crum PA, Bedenbaugh PH, Cheung SW, Schreiner CE. Modular functional organization of cat anterior auditory field. J Neurophysiol. 2004;92:444–457. doi: 10.1152/jn.01173.2003. [DOI] [PubMed] [Google Scholar]
- Imig TJ, Morel A. Topographic and cytoarchitectonic organization of thalamic neurons related to their targets in low-, middle-, and high-frequency representations in cat auditory cortex. J Comp Neurol. 1984;227:511–539. doi: 10.1002/cne.902270405. [DOI] [PubMed] [Google Scholar]
- Imig TJ, Morel A. Tonotopic organization in lateral part of posterior group of thalamic nuclei in the cat. J Neurophysiol. 1985;53:836–851. doi: 10.1152/jn.1985.53.3.836. [DOI] [PubMed] [Google Scholar]
- Kaas JH, Hackett TA. Subdivisions of auditory cortex and processing streams in primates. Proc Natl Acad Sci U S A. 2000;97:11793–11799. doi: 10.1073/pnas.97.22.11793. [DOI] [PMC free article] [PubMed] [Google Scholar]
- Kilgard MP, Merzenich MM. Cortical map reorganization enabled by nucleus basalis activity. Science. 1998;279:1714–1718. doi: 10.1126/science.279.5357.1714. [DOI] [PubMed] [Google Scholar]
- Kitzes LM, Hollrigel GS. Response properties of units in the posterior auditory field deprived of input from the ipsilateral primary auditory cortex. Hear Res. 1996;100:120–130. doi: 10.1016/0378-5955(96)00103-7. [DOI] [PubMed] [Google Scholar]
- Knight PL. Representation of the cochlea within the anterior auditory field (AAF) of the cat. Brain Res. 1977;130:447–467. doi: 10.1016/0006-8993(77)90108-1. [DOI] [PubMed] [Google Scholar]
- Kusmierek P, Rauschecker JP. Functional specialization of medial auditory belt cortex in the alert rhesus monkey. J Neurophysiol. 2009;102:1606–1622. doi: 10.1152/jn.00167.2009. [DOI] [PMC free article] [PubMed] [Google Scholar]
- Lee CC, Winer JA. Connections of cat auditory cortex: III. Corticocortical system. J Comp Neurol. 2008;507:1920–1943. doi: 10.1002/cne.21613. [DOI] [PMC free article] [PubMed] [Google Scholar]
- Lomber SG. The advantages and limitations of permanent or reversible deactivation techniques in the assessment of neural function. J Neurosci Methods. 1999;86:109–117. doi: 10.1016/s0165-0270(98)00160-5. [DOI] [PubMed] [Google Scholar]
- Lomber SG, Malhotra S. Double dissociation of “what” and “where” processing in auditory cortex. Nat Neurosci. 2008;11:609–616. doi: 10.1038/nn.2108. [DOI] [PubMed] [Google Scholar]
- Lomber SG, Cornwell P, Sun JS, MacNeil MA, Payne BR. Reversible inactivation of visual processing operations in middle suprasylvian cortex of the behaving cat. Proc Natl Acad Sci U S A. 1994;91:2999–3003. doi: 10.1073/pnas.91.8.2999. [DOI] [PMC free article] [PubMed] [Google Scholar]
- Lomber SG, Payne BR, Horel JA. The cryoloop: an adaptable reversible cooling deactivation method for behavioral or electrophysiological assessment of neural function. J Neurosci Methods. 1999;86:179–194. doi: 10.1016/s0165-0270(98)00165-4. [DOI] [PubMed] [Google Scholar]
- Malhotra S, Lomber SG. Sound localization during homotopic and heterotopic bilateral cooling deactivation of primary and nonprimary auditory cortical areas in the cat. J Neurophysiol. 2007;97:26–43. doi: 10.1152/jn.00720.2006. [DOI] [PubMed] [Google Scholar]
- Malhotra S, Hall AJ, Lomber SG. Cortical control of sound localization in the cat: unilateral cooling deactivation of 19 cerebral areas. J Neurophysiol. 2004;92:1625–1643. doi: 10.1152/jn.01205.2003. [DOI] [PubMed] [Google Scholar]
- Merzenich MM, Knight PL, Roth GL. Representation of cochlea within primary auditory cortex in the cat. J Neurophysiol. 1975;38:231–249. doi: 10.1152/jn.1975.38.2.231. [DOI] [PubMed] [Google Scholar]
- Middlebrooks JC, Zook JM. Intrinsic organization of the cat's medial geniculate body identified by projections to binaural response-specific bands in the primary auditory cortex. J Neurosci. 1983;3:203–224. doi: 10.1523/JNEUROSCI.03-01-00203.1983. [DOI] [PMC free article] [PubMed] [Google Scholar]
- Morel A, Rouiller E, de Ribaupierre Y, de Ribaupierre F. Tonotopic organization in the medial geniculate body (MGB) of lightly anesthetized cats. Exp Brain Res. 1987;69:24–42. doi: 10.1007/BF00247026. [DOI] [PubMed] [Google Scholar]
- Nakamoto KT, Jones SJ, Palmer AR. Descending projections from auditory cortex modulate sensitivity in the midbrain to cues for spatial position. J Neurophysiol. 2008;99:2347–2356. doi: 10.1152/jn.01326.2007. [DOI] [PubMed] [Google Scholar]
- Olfert ED, Cross BM, McWilliam AA. Guide to the care and use of experimental animals. Ottawa, Ontario: Canadian Council on Animal Care; 1993. [Google Scholar]
- Palmer AR, Hall DA, Sumner C, Barrett DJ, Jones S, Nakamoto K, Moore DR. Some investigations into non-passive listening. Hear Res. 2007;229:148–157. doi: 10.1016/j.heares.2006.12.007. [DOI] [PubMed] [Google Scholar]
- Pandya PK, Rathbun DL, Moucha R, Engineer ND, Kilgard MP. Spectral and temporal processing in rat posterior auditory cortex. Cereb Cortex. 2008;18:301–314. doi: 10.1093/cercor/bhm055. [DOI] [PMC free article] [PubMed] [Google Scholar]
- Phillips DP, Orman SS. Responses of single neurons in posterior field of cat auditory cortex to tonal stimulation. J Neurophysiol. 1984;51:147–163. doi: 10.1152/jn.1984.51.1.147. [DOI] [PubMed] [Google Scholar]
- Polley DB, Read HL, Storace DA, Merzenich MM. Multiparametric auditory receptive field organization across five cortical fields in the albino rat. J Neurophysiol. 2007;97:3621–3638. doi: 10.1152/jn.01298.2006. [DOI] [PubMed] [Google Scholar]
- Pons TP, Garraghty PE, Friedman DP, Mishkin M. Physiological evidence for serial processing in somatosensory cortex. Science. 1987;237:417–420. doi: 10.1126/science.3603028. [DOI] [PubMed] [Google Scholar]
- Rauschecker JP. Parallel processing in the auditory cortex of primates. Audiol Neurootol. 1998a;3:86–103. doi: 10.1159/000013784. [DOI] [PubMed] [Google Scholar]
- Rauschecker JP. Cortical processing of complex sounds. Curr Opin Neurobiol. 1998b;8:516–521. doi: 10.1016/s0959-4388(98)80040-8. [DOI] [PubMed] [Google Scholar]
- Rauschecker JP, Tian B. Processing of band-passed noise in the lateral auditory belt cortex of the rhesus monkey. J Neurophysiol. 2004;91:2578–2589. doi: 10.1152/jn.00834.2003. [DOI] [PubMed] [Google Scholar]
- Rauschecker JP, Tian B, Hauser M. Processing of complex sounds in the macaque nonprimary auditory cortex. Science. 1995;268:111–114. doi: 10.1126/science.7701330. [DOI] [PubMed] [Google Scholar]
- Rauschecker JP, Tian B, Pons T, Mishkin M. Serial and parallel processing in rhesus monkey auditory cortex. J Comp Neurol. 1997;382:89–103. [PubMed] [Google Scholar]
- Reale RA, Imig TJ. Tonotopic organization in auditory cortex of the cat. J Comp Neurol. 1980;192:265–291. doi: 10.1002/cne.901920207. [DOI] [PubMed] [Google Scholar]
- Rouiller EM, Simm GM, Villa AE, de Ribaupierre Y, de Ribaupierre F. Auditory corticocortical interconnections in the cat: evidence for parallel and hierarchical arrangement of the auditory cortical areas. Exp Brain Res. 1991;86:483–505. doi: 10.1007/BF00230523. [DOI] [PubMed] [Google Scholar]
- Scannell JW, Burns GA, Hilgetag CC, O'Neil MA, Young MP. The connectional organization of the cortico-thalamic system of the cat. Cereb Cortex. 1999;9:277–299. doi: 10.1093/cercor/9.3.277. [DOI] [PubMed] [Google Scholar]
- Schreiner CE, Cynader MS. Basic functional organization of second auditory cortical field (AII) of the cat. J Neurophysiol. 1984;51:1284–1305. doi: 10.1152/jn.1984.51.6.1284. [DOI] [PubMed] [Google Scholar]
- Stecker GC, Mickey BJ, Macpherson EA, Middlebrooks JC. Spatial sensitivity in field PAF of cat auditory cortex. J Neurophysiol. 2003;89:2889–2903. doi: 10.1152/jn.00980.2002. [DOI] [PubMed] [Google Scholar]
- Stecker GC, Harrington IA, Macpherson EA, Middlebrooks JC. Spatial sensitivity in the dorsal zone (area DZ) of cat auditory cortex. J Neurophysiol. 2005;94:1267–1280. doi: 10.1152/jn.00104.2005. [DOI] [PubMed] [Google Scholar]
- Tian B, Reser D, Durham A, Kustov A, Rauschecker JP. Functional specialization in rhesus monkey auditory cortex. Science. 2001;292:290–293. doi: 10.1126/science.1058911. [DOI] [PubMed] [Google Scholar]
- Wessinger CM, VanMeter J, Tian B, Van Lare J, Pekar J, Rauschecker JP. Hierarchical organization of the human auditory cortex revealed by functional magnetic resonance imaging. J Cogn Neurosci. 2001;13:1–7. doi: 10.1162/089892901564108. [DOI] [PubMed] [Google Scholar]