

Abstract
The planning of goal-directed movements requires sensory, temporal, and contextual information to be combined. Sensorimotor functions are embedded in large neuronal networks, but it is unclear how networks organize their activity in space and time to optimize behavior. Temporal coordination of activity in many neurons within a network, e.g., spike synchrony, might be complementary to a firing rate code, allowing efficient computation with overall less population activity. Here we asked the question whether intensive practice induces long-term modifications in the temporal structure of synchrony and firing rate at the population level. Three monkeys were trained in a delayed pointing task in which the selection of movement direction depended on correct time estimation. The synchronous firing among pairs of simultaneously recorded neurons in motor cortex was analyzed using the “unitary event” technique. The evolution of synchrony in both time, within the trial, and temporal precision was then quantified at the level of an entire population of neurons by using two different quantification techniques and compared with the population firing rate. We find that the task timing was represented in the temporal structure of significant spike synchronization at the population level. During practice, the temporal structure of synchrony was shaped, with synchrony becoming stronger and more localized in time during late experimental sessions, in parallel with an improvement in behavioral performance. Concurrently, the average population firing rate mainly decreased. Performance optimization through practice might therefore be achieved by boosting the computational contribution of spike synchrony, allowing an overall reduction in population activity.
Introduction
The brain processes in parallel sensory, temporal, and contextual information, which has to be combined appropriately to organize a movement. With advance information about movement parameters, such as direction or the moment when to move, movement initiation is faster (Riehle, 2005). Cortical neurons selectively change their activity in relation to previous information about not only spatial (Weinrich et al., 1984; Riehle and Requin, 1989; Riehle, 2005) but also temporal parameters (Lucchetti and Bon, 2001; Leon and Shadlen, 2003; Roux et al., 2003; Janssen and Shadlen, 2005; Genovesio et al., 2006; Renoult et al., 2006). It is widely accepted that sensorimotor functions are based on activity modulations in neuronal networks distributed over various brain structures (Wise, 1984; Tanji and Kurata, 1989; Riehle, 2005). However, it is much less clear how these networks organize dynamically their activity in space and time. The concept of cell assemblies (Hebb, 1949; Aertsen et al., 1986; Gerstein et al., 1989; Abeles, 1991) uses synchrony as an additional dimension to the rate code, suggesting that the system may retrieve much more information from a given neuronal activity pattern (Riehle et al., 1997; Hatsopoulos et al., 1998; Baker et al., 2001; Maldonado et al., 2008; Sakamoto et al., 2008). We have shown that the strength of precise spike synchrony modulates in time, independent of rate modulations (Riehle et al., 1997). Furthermore, the timing of modulation of synchrony and firing rate at the population level in motor cortex suggests that synchrony may be preferentially involved in early preparatory and cognitive processes, whereas rate modulation may rather control movement initiation and execution (Riehle et al., 2000; Grammont and Riehle, 2003).
Several experimental and theoretical studies point to the importance of synchronous spiking activity, in particular in a low firing rate regime (Rudolph and Destexhe, 2003). If spike synchrony and firing rate are independent coding strategies at the population level, can their interplay be altered? In particular, here we ask the question whether the structure of synchrony and rate can be significantly modulated by intensive practice. We trained three monkeys in a task in which the selection of movement direction depended on correct time estimation (Roux et al., 2003, 2006). The activity of simultaneously recorded single neurons in motor cortex was analyzed with the “unitary event” technique (Grün et al., 1999, 2002a,b, 2003). This allows one to determine spike coincidences that violate the assumption of independence of the neurons and insofar are expressions of the activation of a functional cell assembly (Aertsen and Gerstein, 1991). The outcomes were quantified using two different techniques to describe the evolution in both time, within the trial, and temporal precision of significant synchrony.
We found that the timing of the task is represented in the temporal structure of significant spike synchronization at the population level. By practice, the temporal structure of synchrony was shaped. Synchrony became stronger and more localized in time during late experimental sessions, in parallel with a behavioral improvement, whereas the firing rate in the same neurons mainly decreased.
Materials and Methods
Experimental procedures
Behavioral task.
The task was explained in detail in two previous studies (Roux et al., 2003, 2006). Three male rhesus monkeys participated in this study [data from monkey R are partly described by Roux et al. (2003), and single-neuron spiking data from monkeys O and K were recorded on the same electrodes as the local field potentials described by Roux et al. (2006)]. Care and treatment of the animals during all stages of the experiments conformed to the European and French government regulations. The animals were trained to execute movements in two opposite directions from a common center position. On a vertical panel, three touch-sensitive targets with light emitting diodes (diameter of 3 cm) were mounted in a horizontal line, 10 cm apart. The animal self-initiated each trial by touching the center target with the active hand. After a fixed delay (600 ms in monkey O and 500 ms in monkeys K and R), a preparatory signal (PS) was presented.
Both peripheral targets were presented simultaneously as PS, one in red and the other in green. The animal learned to attribute to each color one of two possible delay durations. If the (directionally non-informative) auditory “go” signal occurred after a short delay, the monkey had to select the red target, and after a long delay the green one. Both the laterality of the colored targets and the presentation of the two durations were varied at random with equal probability. In other words, the probability for the go signal to occur after the short delay was 0.5. Once this moment passed and the go signal did not occur, the probability for its occurrence after the long delay turned to 1. The animals learned to discriminate between two delay durations. For monkeys O and R, it was 600 and 1200 ms, and, for monkey K, it was 500 and 1200 ms. Monkey O additionally learned to estimate another pair of durations, 1000 and 1400 ms, after the start of the recording sessions. We call data recorded using the first pattern O1 and the second pattern O2.
Reaction times (RTs) and movement times were limited each to 400 ms in monkey R, 300 ms in monkey O, and 500 ms in monkey K. Movement initiations outside these limits were considered as errors.
Recording techniques.
After learning the task, the animals were prepared for multielectrode recordings in motor cortex of the left hemisphere in monkeys O and R and of the right hemisphere in monkey K, in an area between central sulcus, arcuate sulcus, and precentral dimple covering the hand/arm areas of the primary motor cortex and dorsal premotor cortex. A cylindrical stainless steel recording chamber (inner diameter of 15 mm) was implanted under aseptic conditions and general isoflurane anesthesia (<2.5% in air). A stainless steel T-bar was cemented to the skull to fixate the animal's head during recording sessions. Before and after surgery, antibiotics and analgesics were administered.
To record extracellularly multiple single-neuron activities, a multielectrode, computer-controlled microdrive [monkey R: Reitboeck system (Thomas Recording); monkeys O and K: MT-EPS (Alpha Omega)] was used to transdurally insert up to seven microelectrodes [monkey R: quartz insulated platinum-tungsten electrodes, outer diameter of 80 μm, impedance at 2–5 MΩ at 1000 Hz; monkeys O and K: epoxy-insulated tungsten electrodes (FHC), 0.5–1.2 MΩ at 1000 Hz]. The inter-electrode distance was between 230 and 700 μm; however, because the electrodes were driven independently from each other, their distance in depth varied for each recording. From each electrode, electrical signals were amplified with a gain of 5000–10,000 (MCP+; Alpha Omega) and high-pass filtered, using in-house hardware (active filtering; cutoff frequency of 300 Hz) for selecting action potentials (spikes). Spikes of only one single neuron per electrode were then isolated by using a window discriminator in monkey R or between one and three neurons per electrode (although rarely more than two were discriminated in practice) by using online spike sorting with a template-matching algorithm (MSD; Alpha Omega) (Wörgötter et al., 1986) in monkeys O and K. Sorted spike data along with behavioral events (occurrences of signals and performance of the animal) were stored for offline analysis with a time resolution of 1 kHz.
Data analysis
Unitary event analysis.
Dynamic changes in the temporal relations between the occurrences of spikes in simultaneously recorded pairs of neurons were analyzed offline with Matlab (MathWorks) by an extended version of the unitary event method (Grün, 1996; Grün et al., 2002a). It enables to capture the temporal precision of spike synchronization and does not require cross-trial stationarity (for a detailed description, see Maldonado et al., 2008; Grün, 2009). The unitary event method allows us to detect spike synchronization that occurs in excess compared with a chance synchronization given by the firing rates. The basic operation is to compare the detected coincidence counts [empirical coincidences (Fig. 1C, blue curve)] with the expected number given by the product of the firing probabilities of the involved neurons [predicted coincidences (Fig. 1C, green curve)]. Significance of the empirical coincidence counts is evaluated by calculating the probability of getting such an amount or an even larger one (p value, P), assuming a Poisson distribution with the mean being the predicted number. The larger the number of excess coincidences, the closer P is to 0, and, conversely, the larger the number of lacking coincidences, the closer its complement, 1 − P, is to 0, while P approaches 1. Coincidences that compose an empirical number that surpasses the significance level (p < 0.05 or 0.01) are called unitary events. For a better visualization (compare Fig. 1D), we use a logarithmic function log10[(1 − P)/P] [joint-surprise measure (Grün et al., 2002a) (Fig. 1D)].
Figure 1.
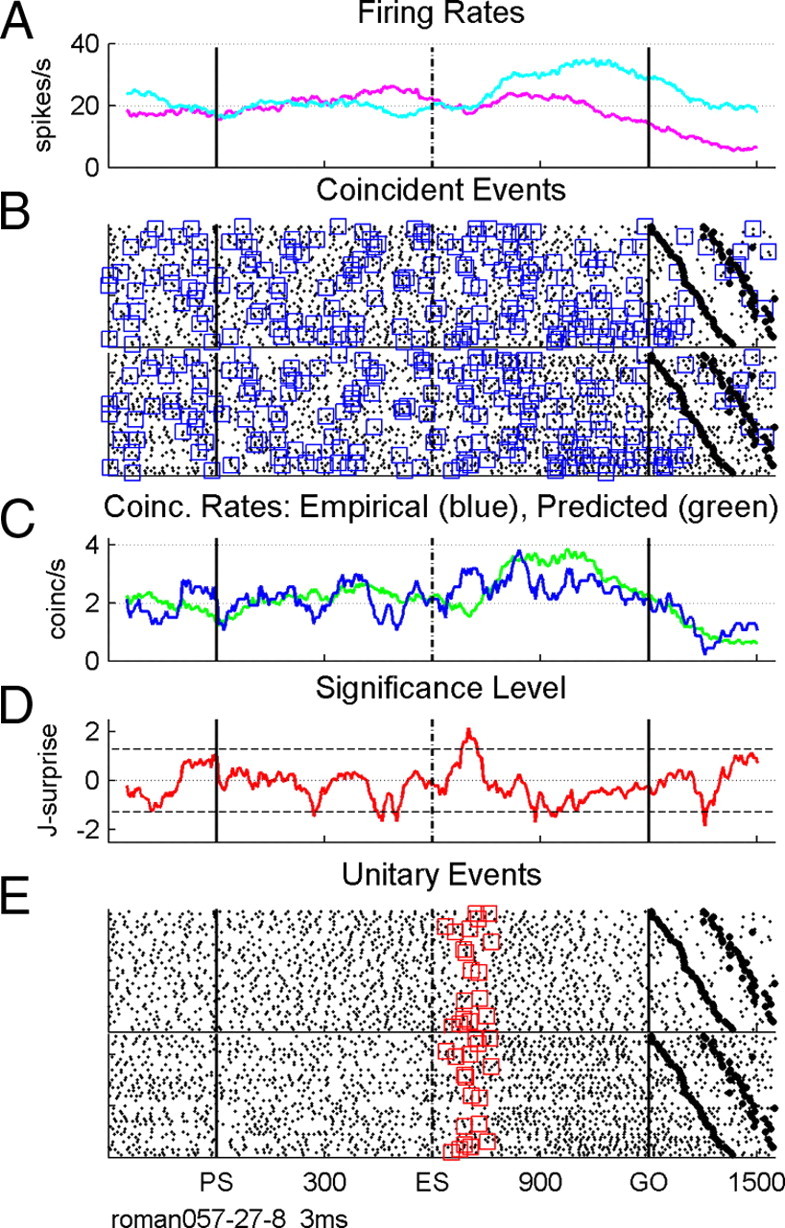
Precise spike synchrony between two simultaneously recorded neurons. A, Firing rate profiles of the two neurons averaged across trials. B, Raster displays and synchronous spikes detected with a precision of 3 ms (blue squares). First range of black large dots after go indicate movement onset, and the second range indicates the end of movement. Trials were arranged according to increasing reaction times from top to bottom. C, Empirical (blue) and predicted (green) coincidence rates. D, Time-resolved statistical significance expressed by the joint-surprise measure. The horizontal dashed lines correspond to a statistical significance of p = 0.05. E, Unitary events (red squares). Time is in milliseconds, starting at PS.
By evaluating the significance of the empirical number of coincidences relative to the expected number, the method properly accounts for chance coincidences based on the firing rates of the neurons. However, if a certain number of excess coincidences, i.e., the difference of the empirical minus the expected number, becomes significant depends not only on its absolute amount but also on the width of the distribution. Because the width of the Poisson distribution, which is used here, becomes larger with its mean, the same amount of excess coincidences may be significant for a small number of expected coincidences but not for a larger number. Thus, in case of large firing rates of both neurons, an even larger amount of excess coincidences is required to become unitary events.
To account for nonstationarity of the firing rates in time, the evaluation of unitary events is performed in a sliding window of 100 ms duration that is shifted along the data (Grün et al., 2002b), here in steps of 5 ms. Within each window, the expected number of coincidences is calculated as the sum of the trial-by-trial expectancies each as the product of the marginal probabilities of firing (Grün et al., 2003). This procedure considers differences in firing rates across trials and therefore accounts for nonstationarities across trials. A window identified to contain significantly more coincidences than expected by chance contains a combination of chance coincidences and the excess coincidences. Unfortunately, there is no way to distinguish individual excess coincident events from chance coincidences.
Coincidences of different temporal widths are accounted for by the “multiple shift” approach (Grün et al., 1999). It treats the data in their (original) high time resolution (1 ms) but allows one to search for coincidences with various coincidence widths. Technically, coincident spikes are detected (see Fig. 1B) by shifting the spike trains against each other in steps of the time resolution (here 1 ms) over the range of the maximal coincidence width of interest (here from 1 to 10 ms). The numbers of exact coincidences (i.e., within a time bin of the time resolution of the data, here 1 ms) are then summed over all shifts (and trials) and are compared with the appropriate expected number, which is corrected for the number of shifts taken.
To obtain the significance (joint-surprise) for a certain range of coincidence widths only, we restrict the evaluation of empirical coincidences that result from a specific range of shifts between spike trains, i.e., from ± the smallest to ± the largest selected coincidence width. For example, if we are interested in the coincidences of a temporal width of a minimum of 3 ms and a maximum of 6 ms, we sum the results of the shifts from ±3 to ±6 ms and compare the result with the predicted number for a zero shift multiplied by the respective number of shifts (here 8) (Grün et al., 1999, their Eq. 15).
Only neurons were selected for analysis that reached the following criteria: (1) a lowest firing rate of more than seven spikes per second (cf. Roy et al., 2000), (2) neurons that constitute pairs that were recorded from different electrodes, (3) a minimum of 20 trials per condition (usually between 40 and 55 trials), and (4) neurons whose coefficient of variation (CV) did not fall below 0.2, i.e., neurons that fire very regularly were discarded from the analysis because they run the risk to produce false positives (Grün, 2009, their Fig. 7C). All these criteria were applied to each behavioral condition. As a consequence, for one single pair of neurons, not all criteria were necessarily reached in all behavioral conditions so that the sample size is smaller than the number of selected pairs times the number of behavioral conditions.
Figure 7.
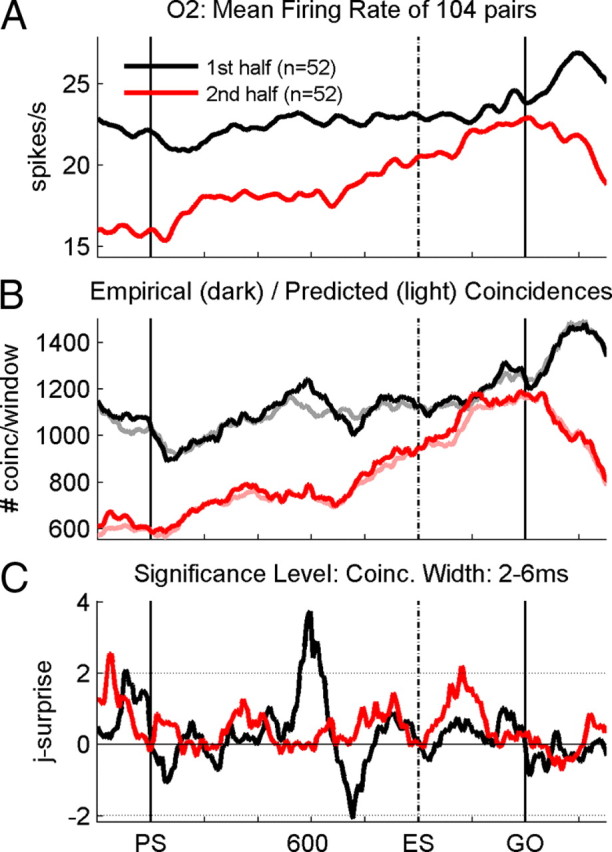
Quantification of population synchrony. A, Average firing rate profiles obtained during the first (black line) and second (red line) halves of recording sessions in monkey O2. B, Numbers of empirical (dark lines) and predicted (light lines) coincidences determined as the sum of the trial-by-trial numbers in each sliding window and for each pair of neurons for coincidence widths between 2 and 6 ms, during the first (black lines) and second (red lines) halves of sessions. C, Joint-surprise function calculated for the difference between the total empirical and predicted numbers of coincidences in each sliding window. The horizontal dotted lines correspond to a significance level of p = 0.01.
Quantification of spike synchrony at the population level.
To quantify significant synchronous spiking activity at the population level, we use two methods. One extracts the strength of the significance of spike correlation of the whole population of pairs, whereas the other extracts the percentage of pairs that yield significant synchronization on the level of the individual pairs.
To extract the strength of the significance of the synchronization of all pairs in one particular behavioral condition, we determine the trial-by-trial empirical and predicted numbers of coincidences in each sliding window for each neuron pair as described in the preceding section. Instead of calculating the significance of the difference of empirical and predicted numbers on a pair-by-pair level, we here first sum the respective numbers from all pairs and then evaluate the significance. Specifically, for each sliding window, we sum the trial-by-trial empirical numbers of all neuron pairs yielding a total empirical number. Similarly, we sum the calculated trial-by-trial expectancies across all pairs of neurons yielding a total predicted number. The significance of the difference of these two measures is then evaluated by calculating the joint-surprise measure as described for a single pair. Performing this at each position of the sliding window, we get a time-dependent joint-surprise function of the whole population of pairs (see Figs. 7, 8).
Figure 8.

Same analysis as in Figure 7 for all three monkeys (R, O1, and K, left, middle, and right columns, respectively) showing the average firing rates (A), the total counts of empirical and predicted coincidences (B), and the synchrony (C) expressed by the joint-surprise. For monkey R, synchrony was analyzed for coincidence widths between 2 and 3 ms, for monkey O1 between 2 and 6 ms, and for monkey K between 2 and 8 ms. Black lines, First half of recording sessions; red lines, second half of sessions.
To quantify the percentage of pairs of neurons that exhibit statistically significant synchronous activity, we perform the unitary event analysis for each neuron pair before pooling across the population for each behavioral condition. For each pair, the content of the joint-surprise vector is reduced to a binary vector by assigning a 1 to the center bin of the analysis window if the data within the window are significantly correlated (p < 0.05) or a 0 if not. The bin width of the resulting vector is 5 ms, corresponding to the offset shift of the sliding analysis window.
Our interest is to quantify the fraction of neuron pairs exhibiting a co-occurrence of significant correlation in certain time periods, in which we do not require the significant correlation to occur in the very same time bins. Therefore, we integrate the information about the presence of significant correlation in a sliding (5 ms shifts) time window (“integration window”) corresponding to the typical jitter in the time of occurrence of unitary event periods across neuron pairs typically observed (50–200 ms) (Riehle et al., 2000). Within each window, we count the number of 1 values, indicating a significant window (in short: significant bins), and test whether the count is significant compared with the distribution of counts obtained for spike trains without spike correlation. We construct the distribution for each neuron pair, for each position of the sliding integration window, from 1000 surrogate datasets obtained by dithering the original spike times by ±40 ms (Date et al., 1999; Pazienti et al., 2008). Again, the window position is marked by 1 if the outcome is significant and by 0 otherwise. Finally, averaging this measure bin by bin over all neuron pairs yields the time-resolved percentage of significantly correlated pairs. The analysis is performed separately for different allowed coincidence widths, resulting in a two-dimensional simultaneous display of the time dependence (horizontal axis) and the precision (vertical axis) of correlation in the population [see Figs. 3A–C, 5A, smoothed with a Savitzky–Golay filter (second-order polynomial) of a width of 19 bins].
Figure 3.

A–C, Time-resolved quantification of statistically significant synchronous activity for each monkey. Data are quantified for different coincidence widths (from 1 to 10 ms) in long trials, and the result is expressed as the percentage (see color bar at the right) of significant (p < 0.05) synchrony in the total population of pairs of neurons. The size of the sliding integration windows for detecting the presence of synchrony (see Material and Methods) were 50 ms for monkeys R and O1 and 200 ms in monkey K, optimized for detecting the coexpression in time of significant synchrony across pairs. D–F, Average firing rate profiles (in spikes per second) of the same neurons analyzed for synchrony in A–C. Time is in milliseconds, starting at PS.
Figure 5.

Learning a new temporal pattern. A, Time-resolved quantification of statistically significant synchronous activity in all sessions recorded in monkey O2, sliding integration window of 100 ms. For details, see Figure 3A–C. B, Mean firing rate of the neurons presented in A. C, D, Improvement of behavioral performance through recording sessions that were analyzed in A and B. C, Mean reaction times obtained in individual recording sessions. D, Percentages of errors per recording session.
Results
Behavioral performance
We recorded the activity of multiple single neurons in the arm/hand areas of the primary motor and dorsal premotor cortex of three monkeys, monkeys R, O, and K. In monkey O, two behavioral timing conditions (O1 and O2) were presented at random in separate sessions (see Materials and Methods). In this study, we analyzed exclusively the data recorded in long delay trials, because this allowed us to test synchronous spiking activity and firing rate in relation to both movement preparation and signal expectancy. In long trials, a signal was expected at the end of the short delay [expected signal (ES)], which might have occurred with a probability of 0.5 (Roux et al., 2003, 2006). Once the signal did not occur, the conditional probability that a go signal will occur at the end of the long delay switched to 1.
Behavioral results are presented in Table 1. Percentages of error trials and mean RTs were averaged across all selected recording sessions. RTs in long trials were much shorter than those in short trials (p ≪ 0.0001, t test), as expected by the higher probability for the go signal to occur (for details, see Roux et al., 2003, 2006). We determined the percentage of errors in each recording session. Three main types of errors could be distinguished: anticipations (movement onset before the go signal), directional errors (going to the wrong target but after go signal), and starting the movement later than the allowed epoch after the go signal (see Materials and Methods). Distributions of single trial RTs are presented by Roux et al. (2006). We established a systematic decrease of errors through the recording sessions by means of a linear regression and obtained correlation coefficients, which were statistically significant (p < 0.05) in monkeys O1, O2, and K. The error rate of monkey R was very low already during the initial sessions, and no improvement could be detected. We also found a systematic reduction of mean RTs across all selected recording sessions in monkeys R, O2, and K, as well as a decrease in RT variability determined by the SD of RTs, in monkeys R and K. In conclusion, all monkeys improved significantly their performance during the recording sessions.
Table 1.
Behavioral results during the selected recording sessions
| Monkey |
||||
|---|---|---|---|---|
| R | O1 | O2 | K | |
| Selected (recorded)sessions | 26 (75) | 18 (42) | 19 (31) | 14 (38) |
| % errors | 6.7 | 7.8 | 17.2 | 45 |
| RT (ms) long trials | 167 | 135 | 188 | 248 |
| RT (ms) short trials | 266 | 185 | 227 | 275 |
| r (p) of errors | −0.22 (0.28) | −0.49 (0.03) | −0.48 (0.05) | −0.51 (0.02) |
| r (p) RT | −0.5 (0.008) | −0.19 (0.4) | −0.47 (0.05) | −0.55 (0.01) |
| r (p) SD RT | −0.49 (0.009) | 0.071 (0.77) | 0.018 (0.94) | −0.56 (0.01) |
Detection of precise spike synchrony in pairs of simultaneously recorded neurons
To describe the dynamics of synchronous spiking activity and its statistical significance, we made use of the unitary event analysis (see Materials and Methods). The method is applied with two important additions compared with the original unitary event version described by Grün (1996) (see also Grün at al., 2002a). First, coincidences of a certain temporal jitter are evaluated not by exclusive binning but by the “multiple shift” approach, which has a higher sensitivity (Grün et al., 1999). Second, the predicted number of coincident spikes is determined on a trial-by-trial basis, which takes into account nonstationarity of firing across trials (Grün et al., 2003). Still some criteria (described in Materials and Methods) have to be fulfilled by the datasets to enable reliable estimation of the significance of the synchrony. Table 2 shows the numbers of neurons, the number of datasets, and the number of sessions included in the analysis after the selection process. The number of datasets is larger than the number of pairs of neurons, because each pair is analyzed separately in each behavioral condition (i.e., movement direction). Because we analyze only the data recorded in long trials, only two conditions are considered for each neuron pair, i.e., rightward and leftward movements. However, for some pairs of neurons, only one movement direction is taken into account, because, for instance, too few spikes occur in one or both neurons in the other direction. Each pair of neurons analyzed during a particular behavioral condition is considered as an individual dataset and called “pair” in the following.
Table 2.
Dataset
| Monkey |
||||
|---|---|---|---|---|
| R | O1 | O2 | K | |
| Selected (recorded) neurons | 66 (209) | 53 (138) | 56 (120) | 36 (131) |
| Datasets (“pairs”) | 87 | 88 | 104 | 51 |
| Selected (recorded) sessions | 26 (75) | 18 (42) | 19 (31) | 14 (38) |
Figure 1 illustrates the unitary event technique on the basis of an example of two simultaneously recorded neurons in long trials in one behavioral condition. Figure 1A shows the mean firing rates of the two neurons, averaged across 47 correctly performed trials. In Figure 1B, the spiking activity is shown for each neuron in each behavioral trial, trials being arranged according to increasing reaction times (large black dots after go signal). Coincident spikes are marked by blue squares detected in each trial with an allowed temporal precision of up to 3 ms. Many such precise synchronous spike events occur during the entire length of the trial. Figure 1C indicates the coincidence rates in coincidences per second for the empirical coincidences (in blue), corresponding to the rate of the blue squares in B, and the predicted coincidences (in green) by taking into account the trial-by-trial instantaneous firing rates of the two neurons (see Materials and Methods). The joint-surprise illustrates the time-resolved significance of the comparisons of the empirical number of coincidences given their predicted numbers performed in sliding windows of 100 ms width (Fig. 1D). Positive values of the joint-surprise indicate more coincidences than expected and negative values less than expected, whereas values at zero indicate as many coincidences as expected. Coincident spikes are marked as unitary events (Fig. 1E, red squares) if they occur within a window containing significantly (p < 0.05, top dashed line in D) more coincidences than expected by chance. The example shown in Figure 1 illustrates the presence of significantly more coincidences just after the moment when a go signal was expected to occur at the end of a short delay (i.e., ES, expected go signal).
Controls concerning the significance of synchrony
We performed a control analysis to rule out that specific features in the trial-by-trial firing rate profiles of the neurons or the spike train structures would induce by chance the dynamically modulated synchrony as illustrated in Figure 1. To test this, we generated artificial independent spike trains with the same trial-by-trial firing rate profiles as the original neuronal data and analyzed them in the same way as done with the original data. We first estimated trial by trial the instantaneous firing rate profiles of both neurons shown in Figure 1 using the convolution technique proposed by Nawrot et al. (1999) with a triangular kernel of a width of 50 ms. Based on these rate profiles, we simulated inhomogeneous point processes to generate the parallel but independent spike trains. The processes are chosen as rate-modulated gamma processes with different constant shape parameters (Fig. 2A: κ1 and κ2 = 1, Poisson; Fig. 2B: κ1 and κ2 = 4; Fig. 2C: κ1 = 3 and κ2 = 5, chosen according to the CV2 calculated from the data presented in Fig. 1; see Fig. 2D). On sets of simulated parallel spike trains for all the trials, we again applied the unitary event analysis with the same parameters as chosen for the analysis of the original neuronal data (100 ms sliding window, shifts of 5 ms, coincidence width of 3 ms). For each shape parameter, this procedure is repeated 1000 times yielding as many joint-surprise curves. Their mean per bin ± the 95% confidence limits are illustrated in Figure 2A–C (red solid and dashed curves, respectively) and compared with the joint-surprise of original data (black curves). Clearly, the artificial independent data of the same firing rate profiles as the original data do not show a systematic deviation of the joint-surprise from statistical independence. Processes with a coefficient of variation measured from the data as the local measure CV2 averaged over the preparatory period (Holt et al., 1996; Ponce-Alvarez et al., 2009) do not indicate any systematic deviation from statistical independence and, in particular, do not explain the time course of the original joint-surprise (Fig. 2C). We repeated these controls for all neuron pairs in the four datasets included in this study (coincidence width of 3 ms) and found only 6 of 393 periods with significant synchrony according to the unitary event analysis, across all pairs, that could be explained by the simulated, independent data. This result is consistent with our former studies in which we found that the unitary event analysis behaves rather conservative for non-Poisson spike trains (Pipa et al., 2007; Grün, 2009). To show the range of the variability of spike timing of all 290 neurons, we calculated their CV2 during the delay period from PS to go and plotted a distribution of all average CV2 measures in Figure 2E.
Figure 2.

A–C, Controls based on simulated data using the firing rate profiles of the neurons presented in Figure 1. They show in solid black the joint-surprise function already shown in Figure 1D. Red curves illustrate statistics (solid indicate mean; dashed indicates 95% confidence limit) of joint-surprise curves resulting from 1000 simulations of independent, parallel spike trains generated as rate-modulated gamma processes based on the rate profiles estimated from the single trials. A, Poisson processes. B, C, Gamma processes with identical (B, κ = 4) and different (C, κ = 3 and 5) shape factors, assumed to be constant throughout the trial. Their choice in C is based on the estimated coefficient of variation (CV2) for the same pair of neurons (D) and is in the typical range of the whole population of neurons analyzed (E). E, Distribution of the CV2 values estimated as the average CV2 during the delay period from PS to GO, for all neurons.
Task timing and synchrony
In a first step of our analysis, we quantified the percentages of pairs containing statistically significant synchronous spiking activity for each of the three monkeys. For each coincidence width between 1 and 10 ms, the percentage of pairs of neurons having significantly (p < 0.05) more spike coincidences than expected by chance was determined in a time-resolved manner. Note, for simplicity, we will use the term “synchrony” for the occurrence of statistically significant synchronous spikes (unitary events). As can be seen in Figure 1B, coincident spikes were detected throughout the entire trial, and their number depends on the instantaneous firing rate of the evaluated neurons. However, the moments in time in which significantly more coincidences occurred than expected were strongly task related and varied from pair to pair. To analyze neuronal activity during the instructed delay, trials were aligned to go signal occurrence.
Figure 3A–C shows that the percentage of neuron pairs being significantly synchronized increased systematically at particular moments in time as a function of the task requirements, and this in a similar way for the three monkeys. A first peak is visible around the occurrence of the PS, and a second one at the beginning of the second half of the long delay after the ES did not occur. The main difference between the monkeys is that the delay of the increase in spike synchrony after ES increased from monkeys R to K (Fig. 3A–C).
In monkeys R and K, synchrony increased strongly around the PS, partially preceding the signal. This possibly reflects the animals' capacity to anticipate its occurrence (the delay preceding PS was of a fixed duration). Interestingly, the epochs of increased synchrony in monkey K after PS and the ES is of longer duration than in the two other monkeys. This could be linked to the more ample response time tolerated for this monkey (500 ms compared with 300 and 400 in monkeys O and R, respectively), requiring less timing accuracy for preparing and executing the movements (i.e., by using an adaptive strategy to the temporal requirements concerning movement execution). In correspondence with this idea, in monkeys R and O1, a narrower integration window (50 ms) was optimal for the time-resolved quantification of the amount of synchrony across pairs recorded in the different sessions, at different moments in time, compared with monkey K, in which a 200 ms integration window was optimal.
Synchrony and firing rate
Next we asked whether there is a relationship between the modulations of the firing rate and the significant synchrony of the same neurons at the population level. Note that, for calculating unitary events, the instantaneous firing rate of each of the two neurons is taken into account and thus modulation of the firing rates is not expected to have any influence on statistically significant synchrony (see Materials and Methods). The fact that the predicted and the empirical coincidence rates differ (Fig. 1C) clearly shows the different nature of these two measures. Figure 3D–F shows the mean firing rates of the same neurons that are considered in the population analysis for synchrony. The temporal structure of synchrony, presented in Figure 3A–C, can by no means be predicted from the temporal structure of the mean firing rate of the same neurons. In addition, whereas the temporal structure of synchrony was similar for all three monkeys, the mean population firing rate modulated differently.
This observation is also verified by directly correlating the time courses of the joint-surprise function (Fig. 1D) and the firing rate of the neurons of the pair (Fig. 1A) by calculating a correlation coefficient between the two. The distribution of correlation coefficients calculated in the same way for all neuron pairs of the three monkeys (n = 226) and for all coincidence widths is shown in Figure 4. Correlation coefficients are broadly distributed around 0, indicating no overall preference of positive or negative correlations between firing rate and significant spike synchrony. The majority (45%) of the neurons show no correlation between firing rate and spike synchrony, 33% of the neurons show a statistically significant (p < 0.01) negative correlation, and 22% a significant positive correlation. There is therefore no systematic relation between the modulation of the firing rate and the modulation of the strength of neuronal interaction.
Figure 4.

Correlation of firing rate profiles and the time-dependent strength of neuronal interaction expressed by the joint-surprise. From each pair of neurons, we calculate for each coincidence width two correlation coefficients, by pairing the firing rate of each neuron of a pair with the joint-surprise resulting from the pair. The distribution results from all correlation coefficients of all pairs and of the various coincidence widths (1–10 ms). Additional evaluation based on the significance (p < 0.01) of the correlation coefficients yields three populations: 33% of the neurons are negatively correlated, 22% are positively correlated, and 45% were not correlated.
Learning to estimate new delay durations
We trained each monkey in a particular temporal pattern to estimate the duration of each of the two possible delays. In monkeys R and O, this pattern was 600 and 1200 ms, whereas in monkey K, it was 500 and 1200 ms. Note that the precise estimation of the delay duration was necessary to correctly select the target and thus movement direction. After learning the first pattern (600–1200 ms, O1), monkey O was trained to learn a second pattern (1000–1400 ms, O2). During learning, monkey O had to continue to perform in the first pattern (O1) so that, during each recording day, both temporal patterns were presented in separate sessions, the order of sessions being randomly selected each day.
Learning to estimate two delay durations to discriminate them from each other takes a long time, at least several weeks of daily training (Roux et al., 2006). The good performance in discriminating the original two delays was a result of an intensive daily practice long before the neuronal recording sessions started. In monkey O, however, we introduced the second temporal pattern only after the start of the recording sessions, to study the neuronal activity involved in learning processes. Was there any trace in neuronal activity related to the original temporal pattern (O1) in the O2 sessions? If yes, was it modified or did it disappear with time, indicating the progress in learning the new pair of durations and larger flexibility in switching between the duration pairs? Figure 5A shows the percentage of significant synchrony for coincidence widths of 1–10 ms of 104 pairs of neurons recorded in monkey O2. There is again a clear temporal structure of synchrony. However, it is particularly intriguing to see that an increase in synchrony occurs around 600 ms after PS, at the moment at which a go signal was expected in the old temporal pattern, with a maximum for coincidence widths between 3 and 6 ms, in addition to increases in synchrony around and after the new ES. In parallel, the mean firing rate of the same neurons progressively increased throughout the delay from PS to movement onset without any particular dynamics (Fig. 5B). Furthermore, we observed an important improvement of behavioral performance throughout the recording sessions. First, reaction times decreased significantly by ∼40 ms from the first to the last recording session (Fig. 5C) (r = −0.47; p < 0.05), and second, the percentage of errors decreased from ∼25 to <10% (Fig. 5D) (r = −0.48; p < 0.05). Figure 6 shows two examples of individual recording sessions: one while starting to learn pattern O2 (Fig. 6A) and another a few weeks later (Fig. 6B). In Figure 6A, there was a strong increase in significant synchrony around 600 ms, the moment in which a go signal might have occurred if the monkey would perform in the old temporal pattern (O1), although the monkey performed correctly the new task (note that only correct trials were analyzed). In Figure 6B, however, the two neurons synchronized significantly their activity around the new ES.
Figure 6.

Two examples of significant synchrony between the spiking activities of two neurons with a coincidence precision of 4 ms at the beginning of training in the new temporal pattern (A) and a precision of 2 ms a few weeks later (B) for monkey O2. For more details, see Figure 1.
We then searched for neuronal correlates of learning by splitting the population data into two subpopulations, each one containing 52 pairs of neurons and being recorded during 3 consecutive weeks of performance in temporal pattern O2. Instead of quantifying the percentage of pairs of neurons synchronizing significantly their activity at a given moment in time, we here describe the dynamics of the strength of synchronous spiking activity for the entire population of neurons. This is done by summing the empirical coincidence counts, on the one hand, and the predicted number of coincidences, on the other hand, from the single trials and all neuron pairs window by window and evaluating the joint-surprise of these two measures (see Materials and Methods). This way of quantifying synchrony captures the strength of synchrony across the entire population of pairs of neurons and not only the percentage of significantly synchronized pairs of neurons in which a fixed significance level was applied. For this quantification, we only considered coincidences of a temporal precision between 2 and 6 ms at which we find the main contribution of spike synchrony (compare Fig. 5A) and therefore included in the sums all coincidences detected at the various coincidence widths. The resulting empirical and predicted number of coincidences are shown in Figure 7B for each subpopulation of pairs. The shape of the resulting curves follows approximately that of the mean firing rates (Fig. 7A). Both firing rate and the number of coincidences are typically lower for the population recorded during the second half of the sessions than those recorded during the first half. The significance of the empirical coincidence counts, as indicated by the joint-surprise (Fig. 7C), clearly indicates that, during the first half of the sessions (black), there were significantly more coincidences than expected by chance at the moment of the expected occurrence of the go signal in the old temporal pattern. The joint-surprise exceeds by far the 1% significance level (dotted line) around 600 ms after PS. However, in the second half of the sessions (red), synchrony is now at the very same moment in time at chance level but reaches the significance level later during the delay, after the time of the expected signal in the new temporal pattern.
Long-term effects of practice on synchrony
As described above, all monkeys improved their task performance by practice, reducing reaction times and/or error rates across sessions (see Table 1). We were now interested in how these behavioral improvements may be reflected in the neuronal activity and, in particular, in the interaction between neurons. We therefore studied the effect of practice in all three monkeys. For this purpose, we split the sessions in population data containing either the first and or the second halves of the recordings sessions of each monkey, as done for monkey O in pattern O2. Figure 8A shows the mean firing rates separately for the first (black) and second (red) halves of the sessions for monkeys R, O1, and K, in the left, middle, and right columns, respectively. Figure 8B indicates, for the respective two populations, the empirical (dark) and predicted (light) number of coincidences, and finally Figure 8C illustrates, for each monkey, the strength of synchrony (joint-surprise) for the two populations. The striking result is that synchrony increased and became more structured with practice (Fig. 8C), whereas the firing rates mainly decreased (Fig. 8A). In particular, synchrony increases strongly in relation to signal expectancy. Indeed, in the first half of the sessions, synchrony never reaches the significance level of p < 0.01 (dotted lines), whereas during the second half, it largely exceeds this level. In addition, in monkey R (Fig. 8, left column), we find a total inversion of the resulting synchrony around ES: in the first half of the sessions, there was less synchrony than expected by chance (although not reaching the significance level), whereas in the second half, a high amount of excess synchrony is found at this particular moment in time. During the remaining time in the delay period, the joint-surprise is close to zero in both populations, reflecting that coincidences are occurring at chance level. Thus, our results reveal an increase of spike synchrony with task practice at behaviorally relevant moments in time.
Discussion
The reflection of task timing in synchrony
Our data clearly demonstrate that the timing of a delayed reaching task is represented in the temporal structure of significant spike synchronization at the population level, similarly for the three monkeys. Note that the criteria for selecting neurons for our analysis did not include any task-related properties, such as timing, directional, or motor selectivity.
What does it mean that there is temporal structure in synchrony? We used two different methods for quantifying the data. First, we calculated for each monkey in a time-resolved manner the percentage of pairs of neurons whose spiking activity was significantly synchronized. Second, we calculated the significance of the difference between the total numbers of empirical and predicted coincidences, as determined in single trials for all pairs of neurons. Both methods allowed us to describe the dynamics of synchrony and their significance. However, the two methods provide different information about population synchrony.
The first method reports the percentage of significant pairs of neurons at any time during the trial but does not indicate the strength of synchrony as revealed in individual pairs of neurons (compare Fig. 1D). Each pair of neurons contributes with the same weight in this quantification, independent of the total amount of synchronous events and its strength of synchrony. Significant synchrony is detected by evaluating for each position of the sliding window whether or not the number of empirical coincidences exceeds significantly (p < 0.05) the predicted number. Although the unitary event method is quite strict in the avoidance of false positives that may be induced as a result of nonstationarities of the firing rates in time and across trials or other features of the spike trains (cf. Grün, 2009), we still may get a number of windows being falsely assigned as significant simply attributable to the chosen significance level of 5%. However, our population results of significant synchrony argue strongly against a mere false-positive result. If the latter would be true, significant synchrony should be detected anywhere in time and across the population with equal probability. However, we find an increase in the number of pairs that exhibit significant synchrony at a level that is beyond the level expected by chance only at specific moments in time during the task.
The alternative measure that evaluates rather the strength of synchrony of the entire population of pairs are in accordance with the former results. Here, the statistics was not performed on individual pairs of neurons, but the empirical coincidence counts were first summed across all pairs and then compared with the sum of the pair-by-pair and trial-by-trial numbers predicted. It provides a measure for the dynamics of neuronal interaction within the entire population of neurons. The result of this analysis clearly shows a relation to the behavioral context of the task.
Both quantification methods consistently lead to the striking result that the peak of population synchrony appeared in all monkeys at approximately the same moment in time (Figs. 3A–C, 8), i.e., ∼100–200 ms after the expected occurrence of a go signal (ES). This systematic increase in synchrony is not related to an external signal but must be internally driven by the estimation of the elapsed time during the trial. Because the behavioral output in this task was strictly tied to the task timing, the improved performance by practice suggests an improved estimation of the moment in time of signal occurrence (Riehle et al., 1997, 2000; Grammont and Riehle, 2003). It is thus tempting to speculate that the increase in synchrony related to this specific moment reflects a cognitive state, an internal representation of (the non-appearance of) an expected event. Alternatively, it could be related to a shift in the cognitive state necessary for movement reprogramming, because the time of go signal also indicates movement direction in this task (Sakamoto et al., 2008).
Synchrony, behavioral performance, and learning
Learning effects in motor cortical areas have mainly been studied on short timescales ranging over tens of trials within a behavioral session (Mitz et al., 1991; Hund-Georgiadis and von Cramon, 1999; Li et al., 2001; Paz et al., 2003, 2005) or a few consecutive daily sessions (Laubach et al., 2000; Cohen and Nicolelis, 2004) by analyzing the firing rate of single neurons or populations of neurons (for long-term studies, see Schieber, 2002; Matsuzaka et al., 2007). Here we study precise synchrony in relation to the slow continuous improvement in performance during several months of daily recordings. Our data clearly show that the dynamics of synchrony is shaped during learning of a new temporal pattern of the task (Fig. 7). The time of occurrence of spike synchrony shifts during practice to the new time of the expected signal. Furthermore, synchrony generally became more structured with practice (Fig. 8), increasing locally in time in relation to the expected go signal during late sessions, exceeding by far the significance level of 1% in the second half of sessions (Fig. 8C). Our findings suggest a clear relationship between the increase of population synchrony in relation to ES and the improvement in behavioral performance.
Synchrony and firing rate
It has been proposed that synchrony and firing rate may be involved in different processing types (Riehle et al., 1997; Grammont and Riehle, 1999, 2003; Baker et al., 2001; Sakamoto et al., 2008; Tsujimoto et al., 2008). Transient synchrony, strengthened by learning, has been suggested to facilitate interstructural communication (Paz et al., 2007) or to promote the transition between different cognitive states determined by firing rate modulations (Grammont and Riehle, 1999). Our results show that synchrony changes across sessions in two ways: its strength increases and it becomes more structured in time within the trial. Concurrently, the mean firing rate of the whole population of neurons decreases, particularly in epochs of increased synchrony after the expected signal (Fig. 8). This leaves us with the question of whether these opposing changes of the population firing rate and population synchrony is also present in a pair-by-pair basis. Our results, however, reveal that correlation of the time courses of the firing rate of the individual neurons of a pair and their strength of synchrony do not show any systematic relationship (Fig. 4). The relationship between the numbers of positively, negatively, and not correlated neurons remains constant across sessions and is almost identical in all three monkeys (data not shown here).
The learning process may potentiate specific connections within the network and depress others. One can speculate that, because of these long-term modifications of the network, the processing of information could be achieved with an overall lower network activity, resulting in a global decrease in firing rate, as observed here. It has been shown in an in vivo study that hundreds of highly correlated inputs are required to discharge a pyramidal neuron reliably (Destexhe and Paré, 1999) as proposed by Abeles (1982a) in a theoretical study. The spiking threshold of a cortical pyramidal neuron is highly dynamic and inversely correlated with the precision of synaptic input correlation (Azouz and Gray, 2000). Similarly, Softky and Koch (1993) (see also Salinas and Sejnowski, 2002) noticed that synchronized inputs produced higher firing rates than uncorrelated inputs. Furthermore, modeling studies showed that coincidence detection appears to be a highly efficient operating mode during low input activity (Rudolph and Destexhe, 2003) (see also Abeles, 1982b; Aertsen et al., 1996; Bernander et al., 1991; Softky, 1995). In this context, Destexhe and Paré (1999) suggest that intense network activity maintains pyramidal cells in an idle state during which they are ready to respond to brief changes in correlation within hundreds of their inputs. A change of correlation, or synchrony, seems thus to be the most efficient manner to carry information in these conditions (Destexhe and Paré, 1999; Hô et al., 2000). These findings (along with others) demonstrate the importance of synchronous spiking activity, particularly in a low firing rate regime.
In summary, we recorded the activity of motor cortical neurons of three monkeys during the performance of a delayed reaching task. All neurons that satisfied the selection criteria for our analysis were included in the analysis, regardless of any apparent involvement in the task. We thus assume that our samples are representative of the overall motor cortical activity during task performance. By separating the data of each monkey into sets of early and late recording session, we observe systematic changes in synchrony and firing rate in the neuronal populations, which are similar for all monkeys. In particular, as behavioral performance improved with practice, the temporal profile of precise synchrony was shaped, closely tied to the task context, along with a reduction in the overall firing rate. Improved efficacy in neuronal networks, leading to optimized behavioral performance, might therefore be achieved by improving precise spike synchrony, allowing an overall reduction in network activity. Altogether, our results provide a unique behavioral and neuronal correlate gathering the different functional properties one might attribute to synchrony as an independent coding strategy and provide strong evidence for a complementarity of synchrony and firing rate at the level of neuronal populations.
Footnotes
This work was supported by the French government (ACI Cognitique “Variability & Invariants,” STIC-Santé, Grant ANR-05-NEUR-045-01), European Union Grant 15879 “Facets” (S.R.), Bundesministerium für Bildung und Forschung Grant 01GQ0420 to the Bernstein Center for Computational Neuroscience Freiburg (S.R.), and the Mexican government (Consejo Nacional de Ciencia y Technología, to A.P.-A.). We thank Moshe Abeles, Thomas Brochier, Ralph Meier, and Elizabeth B. Torres for helpful comments on various versions of this manuscript. We gratefully thank Markus Diesmann for valuable discussions, Michael Denker and Hideaki Shimazaki for support in computing issues, and Marc Martin for animal welfare.
References
- Abeles M. Local cortical circuits: an electrophysiological study. Berlin: Springer; 1982a. [Google Scholar]
- Abeles M. Role of cortical neuron: integrator or coincidence detector? Isr J Med Sci. 1982b;18:83–92. [PubMed] [Google Scholar]
- Abeles M. Corticonics: neural circuits of the cerebral cortex. Cambridge, UK: Cambridge UP; 1991. [Google Scholar]
- Aertsen A, Gerstein GL. Dynamic aspects of neuronal cooperativity: fast stimulus-locked modulations of effective connectivity. In: Krüger J, editor. Neuronal cooperativity. Berlin: Springer; 1991. pp. 52–67. [Google Scholar]
- Aertsen A, Gerstein G, Johannesma P. From neuron to assembly: neuronal organization and stimulus representation. In: Palm G, Aertsen A, editors. Brain theory. Berlin: Springer; 1986. pp. 7–24. [Google Scholar]
- Aertsen A, Diesmann M, Gewaltig MO. Propagation of synchronous spiking activity in feedforward neural networks. J Physiol (Paris) 1996;90:243–247. doi: 10.1016/s0928-4257(97)81432-5. [DOI] [PubMed] [Google Scholar]
- Azouz R, Gray CM. Dynamic spike threshold reveals a mechanism for synaptic coincidence detection in cortical neurons in vivo. Proc Natl Acad Sci U S A. 2000;97:8110–8115. doi: 10.1073/pnas.130200797. [DOI] [PMC free article] [PubMed] [Google Scholar]
- Baker SN, Spinks R, Jackson A, Lemon RN. Synchronization in monkey motor cortex during a precision grip task. I. Task-dependent modulation in single-unit synchrony. J Neurophysiol. 2001;85:869–885. doi: 10.1152/jn.2001.85.2.869. [DOI] [PubMed] [Google Scholar]
- Bernander O, Douglas RJ, Martin KA, Koch C. Synaptic background activity influences spatiotemporal integration in single pyramidal cells. Proc Natl Acad Sci U S A. 1991;88:11569–11573. doi: 10.1073/pnas.88.24.11569. [DOI] [PMC free article] [PubMed] [Google Scholar]
- Cohen D, Nicolelis MAL. Reduction of single-neuron firing uncertainty by cortical ensembles during motor skill learning. J Neurosci. 2004;24:3574–3582. doi: 10.1523/JNEUROSCI.5361-03.2004. [DOI] [PMC free article] [PubMed] [Google Scholar]
- Date A, Bienenstock E, Geman S. A statistical technique for the detection of fine temporal structure in multi-neuronal spike trains. Soc Neurosci Abstr. 1999;25:1411. [Google Scholar]
- Destexhe A, Paré D. Impact of network activity on the integrative properties of neocortical pyramidal neurons in vivo. J Neurophysiol. 1999;81:1531–1547. doi: 10.1152/jn.1999.81.4.1531. [DOI] [PubMed] [Google Scholar]
- Genovesio A, Tsujimoto S, Wise SP. Neuronal activity related to elapsed time in prefrontal cortex. J Neurophysiol. 2006;95:3281–3285. doi: 10.1152/jn.01011.2005. [DOI] [PMC free article] [PubMed] [Google Scholar]
- Gerstein GL, Bedenbaugh P, Aertsen MH. Neural assemblies. IEEE Trans Biomed Eng. 1989;36:4–14. doi: 10.1109/10.16444. [DOI] [PubMed] [Google Scholar]
- Grammont F, Riehle A. Precise spike synchronization in monkey motor cortex involved in preparation for movement. Exp Brain Res. 1999;128:118–122. doi: 10.1007/s002210050826. [DOI] [PubMed] [Google Scholar]
- Grammont F, Riehle A. Spike synchronization and firing rate in a population of motor cortical neurons in relation to movement direction and reaction time. Biol Cybern. 2003;88:360–373. doi: 10.1007/s00422-002-0385-3. [DOI] [PubMed] [Google Scholar]
- Grün S. Unitary joint-events in multiple-neuron spiking activity. Frankfurt am Main: Verlag Harri Deutsch; 1996. [Google Scholar]
- Grün S. Data-driven significance estimation for precise spike correlation. J Neurophysiol. 2009;101:1126–1140. doi: 10.1152/jn.00093.2008. [DOI] [PMC free article] [PubMed] [Google Scholar]
- Grün S, Diesmann M, Grammont F, Riehle A, Aertsen A. Detecting unitary events without discretization of time. J Neurosci Methods. 1999;94:67–79. doi: 10.1016/s0165-0270(99)00126-0. [DOI] [PubMed] [Google Scholar]
- Grün S, Diesmann M, Aertsen A. “Unitary events” in multiple single-neuron activity. I. Detection and significance. Neural Comput. 2002a;14:43–80. doi: 10.1162/089976602753284455. [DOI] [PubMed] [Google Scholar]
- Grün S, Diesmann M, Aertsen A. “Unitary events” in multiple single-neuron activity. II. Non-stationary data. Neural Comput. 2002b;14:81–119. doi: 10.1162/089976602753284464. [DOI] [PubMed] [Google Scholar]
- Grün S, Riehle A, Diesmann M. Effect of cross-trial nonstationarity on joint-spike events. Biol Cybern. 2003;88:335–351. doi: 10.1007/s00422-002-0386-2. [DOI] [PubMed] [Google Scholar]
- Hatsopoulos NG, Ojakangas CL, Paninski L, Donoghue JP. Information about movement direction obtained from synchronous activity of motor cortical neurons. Proc Natl Acad Sci U S A. 1998;95:15706–15711. doi: 10.1073/pnas.95.26.15706. [DOI] [PMC free article] [PubMed] [Google Scholar]
- Hebb DO. The organization of behavior. New York: Wiley; 1949. [Google Scholar]
- Hô N, Kröger H, Destexhe A. Consequences of correlated synaptic bombardment on the responsiveness of neocortical pyramidal neurons. Neurocomputing. 2000;32–33:155–160. [Google Scholar]
- Holt GR, Softky WR, Koch C, Douglas RJ. Comparison of discharge variability in vitro and in vivo in cat visual cortex neurons. J Neurophysiol. 1996;75:1806–1814. doi: 10.1152/jn.1996.75.5.1806. [DOI] [PubMed] [Google Scholar]
- Hund-Georgiadis M, von Cramon DY. Motor-learning-related changes in piano players and non-musicians revealed by functional magnetic-resonance signals. Exp Brain Res. 1999;125:417–425. doi: 10.1007/s002210050698. [DOI] [PubMed] [Google Scholar]
- Janssen P, Shadlen MN. A representation of the hazard rate of elapsed time in macaque area LIP. Nat Neurosci. 2005;8:234–241. doi: 10.1038/nn1386. [DOI] [PubMed] [Google Scholar]
- Laubach M, Wessberg J, Nicolelis MAL. Cortical ensemble activity increasingly predicts behaviour outcomes during learning of a motor task. Nature. 2000;405:567–571. doi: 10.1038/35014604. [DOI] [PubMed] [Google Scholar]
- Leon MI, Shadlen MN. Representation of time by neurons in the posterior parietal cortex of the macaque. Neuron. 2003;38:317–327. doi: 10.1016/s0896-6273(03)00185-5. [DOI] [PubMed] [Google Scholar]
- Li CS, Padoa-Schioppa C, Bizzi E. Neuronal correlates of motor performance and motor learning in the primary motor cortex of monkeys adapting to an external force field. Neuron. 2001;30:593–607. doi: 10.1016/s0896-6273(01)00301-4. [DOI] [PubMed] [Google Scholar]
- Lucchetti C, Bon L. Time-modulated neuronal activity in premotor cortex of macaque monkeys. Exp Brain Res. 2001;141:254–260. doi: 10.1007/s002210100818. [DOI] [PubMed] [Google Scholar]
- Maldonado P, Babul C, Singer W, Rodriguez E, Berger D, Grün S. Synchronization of neuronal responses in primary visual cortex of monkeys viewing natural images. J Neurophysiol. 2008;100:1523–1532. doi: 10.1152/jn.00076.2008. [DOI] [PubMed] [Google Scholar]
- Matsuzaka Y, Picard N, Strick PL. Skill representation in the primary motor cortex after long-term practice. J Neurophysiol. 2007;97:1819–1832. doi: 10.1152/jn.00784.2006. [DOI] [PubMed] [Google Scholar]
- Mitz AR, Godschalk M, Wise SP. Learning-dependent neuronal activity in the premotor cortex: activity during the acquisition of conditional motor associations. J Neurosci. 1991;11:1855–1872. doi: 10.1523/JNEUROSCI.11-06-01855.1991. [DOI] [PMC free article] [PubMed] [Google Scholar]
- Nawrot M, Aertsen A, Rotter S. Single-trial estimation of neuronal firing rates: from single-neuron spike trains to population activity. J Neurosci Methods. 1999;94:81–92. doi: 10.1016/s0165-0270(99)00127-2. [DOI] [PubMed] [Google Scholar]
- Paz R, Boraud T, Natan C, Bergman H, Vaadia E. Preparatory activity in motor cortex reflects learning in local visuomotor skills. Nat Neurosci. 2003;6:882–890. doi: 10.1038/nn1097. [DOI] [PubMed] [Google Scholar]
- Paz R, Natan C, Boraud T, Bergman H, Vaadia E. Emerging patterns of neuronal responses in supplementary and primary motor areas during sensorimotor adaptation. J Neurosci. 2005;25:10941–10951. doi: 10.1523/JNEUROSCI.0164-05.2005. [DOI] [PMC free article] [PubMed] [Google Scholar]
- Paz R, Bauer EP, Paré D. Learning-related facilitation of rhinal interactions by medial prefrontal inputs. J Neurosci. 2007;27:6542–6551. doi: 10.1523/JNEUROSCI.1077-07.2007. [DOI] [PMC free article] [PubMed] [Google Scholar]
- Pazienti A, Maldonado PE, Diesmann M, Grün S. Effectiveness of systematic spike dithering depends on the precision of cortical synchronization. Brain Res. 2008;1225:39–46. doi: 10.1016/j.brainres.2008.04.073. [DOI] [PubMed] [Google Scholar]
- Pipa G, Riehle A, Grün S. Validation of task-related excess of spike coincidences based on NeuroXidence. Neurocomputing. 2007;70:2064–2068. [Google Scholar]
- Ponce-Alvarez A, Kilavik BE, Riehle A. Comparison of local measures of spike time irregularity and relating variability to firing rate in motor cortical neurons. J Comput Neurosci. 2009 doi: 10.1007/s10827-009-0158-2. [DOI] [PubMed] [Google Scholar]
- Renoult L, Roux S, Riehle A. Time is a rubberband: neuronal activity in monkey motor cortex in relation to time estimation. Eur J Neurosci. 2006;23:3098–3108. doi: 10.1111/j.1460-9568.2006.04824.x. [DOI] [PubMed] [Google Scholar]
- Riehle A. Preparation for action: one of the key functions of the motor cortex. In: Riehle A, Vaadia E, editors. Motor cortex in voluntary movements: a distributed system for distributed functions. Boca Raton, FL: CRC; 2005. pp. 213–240. [Google Scholar]
- Riehle A, Requin J. Monkey primary motor and premotor cortex: single-cell activity related to prior information about direction and extent of an intended movement. J Neurophysiol. 1989;61:534–549. doi: 10.1152/jn.1989.61.3.534. [DOI] [PubMed] [Google Scholar]
- Riehle A, Grün S, Diesmann M, Aertsen A. Spike synchronization and rate modulation differentially involved in motor cortical function. Science. 1997;278:1950–1953. doi: 10.1126/science.278.5345.1950. [DOI] [PubMed] [Google Scholar]
- Riehle A, Grammont F, Diesmann M, Grün S. Dynamical changes and temporal precision of synchronized spiking activity in monkey motor cortex during movement preparation. J Physiol (Paris) 2000;94:569–582. doi: 10.1016/s0928-4257(00)01100-1. [DOI] [PubMed] [Google Scholar]
- Roux S, Coulmance M, Riehle A. Context-related representation of timing processes in monkey motor cortex. Eur J Neurosci. 2003;18:1011–1016. doi: 10.1046/j.1460-9568.2003.02792.x. [DOI] [PubMed] [Google Scholar]
- Roux S, Mackay WA, Riehle A. The pre-movement component of motor cortical local field potentials reflects the level of expectancy. Behav Brain Res. 2006;169:335–351. doi: 10.1016/j.bbr.2006.02.004. [DOI] [PubMed] [Google Scholar]
- Roy A, Steinmetz PN, Niebur E. Rate limitations of unitary event analysis. Neural Comput. 2000;12:2063–2082. doi: 10.1162/089976600300015060. [DOI] [PubMed] [Google Scholar]
- Rudolph M, Destexhe A. Tuning neocortical pyramidal neurons between integrators and coincidence detectors. J Comput Neurosci. 2003;14:239–251. doi: 10.1023/a:1023245625896. [DOI] [PubMed] [Google Scholar]
- Sakamoto K, Mushiake H, Saito N, Aihara K, Yano M, Tanji J. Discharge synchrony during the transition of behavioral goal representations encoded by discharge rates of prefrontal neurons. Cereb Cortex. 2008;18:2036–2045. doi: 10.1093/cercor/bhm234. [DOI] [PMC free article] [PubMed] [Google Scholar]
- Salinas E, Sejnowski TJ. Integrate-and-fire neurons driven by correlated stochastic input. Neural Comput. 2002;14:2111–2155. doi: 10.1162/089976602320264024. [DOI] [PMC free article] [PubMed] [Google Scholar]
- Schieber MH. Training and synchrony in the motor system. J Neurosci. 2002;22:5277–5281. doi: 10.1523/JNEUROSCI.22-13-05277.2002. [DOI] [PMC free article] [PubMed] [Google Scholar]
- Softky WR. Simple codes versus efficient codes. Curr Opin Neurobiol. 1995;5:239–247. doi: 10.1016/0959-4388(95)80032-8. [DOI] [PubMed] [Google Scholar]
- Softky WR, Koch C. The highly irregular firing of cortical cells is inconsistent with temporal integration of random EPSPs. J Neurosci. 1993;13:334–350. doi: 10.1523/JNEUROSCI.13-01-00334.1993. [DOI] [PMC free article] [PubMed] [Google Scholar]
- Tanji J, Kurata K. Changing concepts of motor areas of the cerebral cortex. Brain Dev. 1989;11:374–377. doi: 10.1016/s0387-7604(89)80019-1. [DOI] [PubMed] [Google Scholar]
- Tsujimoto S, Genovesio A, Wise SP. Transient neuronal correlations underlying goal selection and maintenance in prefrontal cortex. Cereb Cortex. 2008;18:2748–2761. doi: 10.1093/cercor/bhn033. [DOI] [PMC free article] [PubMed] [Google Scholar]
- Weinrich M, Wise SP, Mauritz KH. A neurophysiological study of the premotor cortex in the rhesus monkey. Brain. 1984;107:385–414. doi: 10.1093/brain/107.2.385. [DOI] [PubMed] [Google Scholar]
- Wise SP. The nonprimary motor cortex and its role in the cerebral control of movement. In: Edelman G, Gall WE, Cowan WH, editors. Dynamic aspects of neocortical function. New York: Wiley; 1984. pp. 525–555. [Google Scholar]
- Wörgötter F, Daunicht WJ, Eckmiller R. An on-line spike form discriminator for extracellular recordings based on an analog correlation technique. J Neurosci Methods. 1986;17:141–151. doi: 10.1016/0165-0270(86)90067-1. [DOI] [PubMed] [Google Scholar]