

Abstract
The spine apparatus is an essential component of dendritic spines of cortical and hippocampal neurons, yet its functions are still enigmatic. Synaptopodin (SP), an actin-binding protein, is tightly associated with the spine apparatus and it may play a role in synaptic plasticity, but it has not yet been linked mechanistically to synaptic functions. We studied endogenous and transfected SP in dendritic spines of cultured hippocampal neurons and found that spines containing SP generate larger responses to flash photolysis of caged glutamate than SP-negative ones. An NMDA-receptor-mediated chemical long-term potentiation caused the accumulation of GFP-GluR1 in spine heads of control but not of shRNA-transfected, SP-deficient neurons. SP is linked to calcium stores, because their pharmacological blockade eliminated SP-related enhancement of glutamate responses, and release of calcium from stores produced an SP-dependent increase of GluR1 in spines. Thus, SP plays a crucial role in the calcium store-associated ability of neurons to undergo long-term plasticity.
Keywords: GluR1, dendritic spines, synaptopodin, spine apparatus, LTP, glutamate uncaging
Introduction
Synaptopodin (SP), an actin-binding protein found in renal podocytes and in dendritic spines of telencephalic neurons (Mundel et al., 1997; Deller et al., 2000) is tightly associated with the spine apparatus (Deller et al., 2000). This complex membranous structure extends from the dendritic smooth endoplasmic reticulum into the spine neck to form a unique organelle (Spacek, 1985). Studies using mice homozygous for a targeted disruption of the SP gene (SP-deficient mice) indicate that SP plays an important role in the formation of the spine apparatus, because the latter is absent in SP-deficient mice (Deller et al., 2003). These experiments also link SP to the regulation of synaptic plasticity, in that SP-deficient mice demonstrate an impaired ability to express long-term potentiation (LTP) in vitro and in vivo, as well as deficits in spatial memory tasks (Deller et al., 2003; Jedlicka et al., 2008a). By the same token, SP expression is enhanced after tetanic stimulation, an effect that is assumed to underlie a transition from short to long-term potentiation (Yamazaki et al., 2001; Fukazawa et al., 2003). We demonstrated recently that rats exposed to an acute swim stress expressed a rapid increase in SP-density specifically in the dorsal hippocampus (Vlachos et al., 2008). Thus, dynamic changes of SP are expected to play a role in enhanced memory formation in the behaving animal.
The suggestion that SP constitutes an actin/actinin-binding/regulatory protein (Mundel et al., 1997; Asanuma et al., 2005; Kremerskothen et al., 2005; Faul et al., 2008; Okubo-Suzuki et al., 2008) indicates that it may serve a direct role in shaping spines and/or linking the actin cytoskeleton with synaptic membrane proteins. Still, a mechanistic link between SP and synaptic plasticity has not yet been established.
Strikingly, only a subset of spines contains SP and a spine apparatus (Spacek and Harris, 1997; Bas Orth et al., 2005) and it is not clear to which extent these spines differ from neighboring ones which lack SP. We have now used cultured hippocampal neurons transfected with a GFP-tagged SP to compare properties of SP(+) and SP(−) spines, focusing on morphological and functional mechanisms underlying long-term synaptic plasticity. We found a striking correlation between the presence of SP and glutamate functions at rest and after induction of synaptic plasticity. Furthermore, our data indicate that an increase of GluR1 in dendritic spines is affected by intracellular calcium stores that are associated with SP in the same spines. These experiments reveal that SP plays a crucial role in the calcium store-associated ability of neurons to undergo long-term plasticity of glutamate receptors and, thus, establish a mechanistic link between SP and synaptic plasticity.
Materials and Methods
Cultures.
Animal handling was done in accordance with the guidelines published by the Institutional Animal Care and Use Committee of the Weizmann Institute and with the Israeli National guidelines on animal care. Cultures were prepared as detailed elsewhere (Goldin et al., 2001). Briefly, rat pups were decapitated on the day of birth (P0), and their brains were removed and placed in a chilled (4°C), oxygenated Leibovitz L15 medium (Gibco) enriched with 0.6% glucose and gentamicin (Sigma; 20 μg/ml). Hippocampal tissue was mechanically dissociated after incubation with trypsin (0.25%) and DNAase (50 μg/ml), and passed to the plating medium consisting of 5% heat-inactivated horse serum (HS), 5% fetal calf serum, and B-27 (1 μl/1 ml) prepared in minimum essential medium (MEM) Earl salts (Gibco), enriched with 0.6% glucose, gentamicin (20 μg/ml), and 2 mm GlutaMax (Gibco) (enriched MEM). Approximately 105 cells in 1 ml of medium were plated in each well of a 24-well plate, onto a hippocampal glial feeder layer which was grown on the glass for 2 weeks before the plating of the neurons (Papa et al., 1995). Additionally cells were placed on 30 mm bottom glass windowed Petri dishes for repetitive imaging over days. Cells were left to grow in the incubator at 37°C, 5% CO2 for 4 d, at which time the medium was changed to 10% HS in enriched MEM, plus a mixture of 5′-fluoro-2-deoxyuridine/uridine (FUDR) (Sigma; 20 μg and 50 μg/ml, respectively), to block glial proliferation. The medium was replaced 4 d later by 10% HS in MEM and no further changes were made until cultures were used for experimentation.
Transfection.
Transfection was conducted with cells at 13–15 d in vitro (DIV). A Lipofectamine 2000 (Invitrogen) mix was prepared at 1.2 μl/well with 50 μl/well OptiMEM (Invitrogen), and incubated for 5 min at room temperature. This was mixed with 1.5 μg/well total DNA in 50 μl/well OptiMEM, and incubated for 15 min at room temperature. The mix was then added to the culture wells, and allowed to incubate for 4–6 h before a change of medium. In most cases, at least several neurons were transfected. In these experiments SP-short subcloned into pEGFP-C1 (BD Biosciences, Clontech) (Asanuma et al., 2005, 2006) was used. For morphological analysis a DsRed plasmid was cotransfected with the SP construct. Cotransfected cells displayed no apparent differences in morphology, spine density and survival compared with GFP-only transfected cells. The distribution and pattern of the expression of the SP plasmid were similar to those of the endogenous SP. GFP-GluR1, shRNA for SP and a scrambled control sequence (see RNA interference) were transfected as described above. Cotransfection efficiency for several plasmids using this method is nearly 100%. Experiments were conducted routinely at 3–7 d after transfection. Cultures were used at the same age for comparisons.
RNA interference.
Knock down of SP expression was achieved using the pSUPER vector (OligoEngine) harboring short-hairpin RNA (shRNA) inserts. Three different sequences (see Fig. 4 B) containing 19 nt corresponding to the rat synaptopodin gene were annealed, subcloned into BglII/HindIII sites of the vector and verified by sequencing. Two of the three shRNAs targeted three prime untranslated regions (3′-UTRs) of rat SP. These 3′-UTRs were not effective against transfected SP (coding sequence only). For control, the pSUPER vector containing a 19 nt scrambled sequence with no significant homology to any other mammalian gene was used (Asanuma et al., 2005). Both the SP-shRNA plasmids and the vector containing the scrambled sequence were transfected along with dsRed-, GFP-, SP-, and/or GluR1-expressing vectors using Lipofectamine 2000. A small minority of cells was transfected in these experiments (<0.01%).
Figure 4.

SP-shRNAs reduce expression of endogenous and transfected SP in PC12 cells and hippocampal neurons. A, B, For knocking down SP expression, three different shRNA sequences containing 19 nt corresponding to the rat synaptopodin gene were cloned into the pSUPER vector. One shRNA (variant 1) was targeting to the cds, the other two shRNAs (variant 2 and 3) were targeting 3′ untranslated regions (3′-UTRs) of rat synaptopodin. For control, a 19 nt scrambled sequence with no significant homology to any other mammalian gene was used. C, All constructed shRNAs significantly reduced endogenous SP expression in PC12 cells as demonstrated by Western blot analysis. D, shRNA variant 1 was also effective in reducing transfected SP (expressing cds only), whereas the 3′UTR-shRNAs (variants 2 and 3) did not affect cotransfected SP. E, Similar results could be obtained in hippocampal neurons. All transfected shRNAs significantly reduced the number of SP(+) spines [p < 0.001; arrowhead point to SP(+) spines]. The attempt to rescue the effects of shRNAs with cotransfected SP demonstrated results comparable to those seen in PC12 cells; only shRNA variant 1 could not be rescued by cotransfected SP (p = 0.36). Scale bar, 2 μm. F, Spine head size (p > 0.31), spine length (p > 0.78), and spine density (p > 0.7) were not different [n = 10 cells transfected with a scrambled control sequence, n = 31 shRNA-transfected cells, n = 11 cells cotransfected with SP(cds)].
PC12 cells and Western blot analysis.
shRNAs were initially tested in a SP expressing cell line (PC12) derived from a pheochromocytoma of the rat adrenal medulla. PC12 cells were cultured in DMEM supplemented with 10% heat-inactivated fetal calf serum, 5% HS, 100 U/ml penicillin and 100 μg/ml streptomycin. Experiments were performed in NGF-untreated cells. Cells were transfected using Lipofectamine 2000. Two days after transfection, a PC12 cytoplasmic lysate (20 mm Tris, 500 mm NaCl, 0.5% CHAPS, 5 mm EDTA, pH 7.5) was subjected to Western blot analysis. A portion of 90 μg of lysate was loaded onto 10% SDS–polyacrylamide gels. Proteins were separated at 120 V and blotted to nitrocellulose membranes (Whatman; Protean BA 83, 2 mm) in Towbin buffer (25 mm Tris, 192 mm glycine, 20% methanol (v/v) and 0.01% SDS) at 18V for 50 min. Blots were incubated with Odyssey Blocking Buffer (LI-COR) at room temperature for 2 h, followed by a polyclonal rabbit anti-SP antiserum (Synaptic Systems; 1:1000, Odyssey Blocking Buffer diluted with 0.5 m Tris buffered saline 1:1, 0.1% Tween20) overnight at 4°C. Blots were thoroughly washed and subsequently incubated with an IRDye800CM conjugated goat anti-rabbit antibody (LI-COR; 1:10,000) for 1 h. To assure equal loading of the samples, membranes were incubated with a monoclonal mouse anti-GAPDH antibody for 1 h (Santa Cruz; 1:5000), detected with an IRDye680 conjugated goat anti-mouse antibody (LI-COR, 1:10,000). The Odyssey Infrared Imaging System (LI-COR) was used for visualizations.
Immunostaining and imaging.
For immunostaining, cover glasses bearing transfected primary hippocampal cells were washed briefly with standard extracellular solution (NaCl 129 mm, KCl 4 mm, MgCl2 1 mm, CaCl2 2 mm, glucose 10 mm and HEPES 10 mm). Cultures were then fixed with 4% paraformaldehyde and 4% sucrose in 0.1 m PBS, pH 7.4, for 20 min, and washed with PBS thoroughly. Cultures were incubated for 1 h with 10% normal goat serum (NGS) in 0.1% Triton X-100 containing PBS to reduce unspecific staining and subsequently incubated for 24 h at 4°C in rabbit anti-SP antibody (SE-19, Sigma; 1:1000, 10% bovine serum albumin, 0.1% Triton X-100 in PBS), in rabbit anti-GluR1 antibody (Millipore; AB 1504, 1:200, 10% goat serum in PBS), or rabbit anti-RYR1 antibody (gift from Dr. Shoshan-Barmatz BGU, Israel, 1:250, 10% goat serum in PBS) (Shoshan-Barmatz et al., 2007). Cultures were incubated for 1 h with Alexa 568-labeled or Alexa 633-labeled goat anti-rabbit antibody (Invitrogen; 1:200, 10% bovine serum albumin, 0.1% Triton X-100). Coverslips were washed again, transferred onto glass slides and mounted for visualization with anti-fading mounting medium. For double-immunolabeling cultures were incubated in a mixture of rabbit anti-synaptopodin antibody and mouse anti-synaptophysin antibody (Millipore; MAB 5258, 1:1000). After washing, sections were incubated first with anti-rabbit secondary antibody, washed again, and then incubated with anti-mouse secondary antibody. In all cases, secondary and tertiary dendritic segments were visualized. Confocal image stacks were recorded using a Zeiss LSM 510 laser-scanning microscope, a Zeiss 40× oil-immersion objective lens [1.3 numerical aperture (NA)] and 4× scan zoom. Detector gain and amplifier were initially set to obtain pixel densities within a linear range. Up to 25 images were recorded per stack. All images in this study were sampled at a rate more than two times the ideal Nyquist rate.
Electrophysiology and imaging.
Cultures were placed in the recording chamber, controlled by an automated X-Y stage (Luigs and Neumann). Transfected cells were imaged thereafter on the stage of an upright Zeiss PASCAL confocal microscope using an Olympus 63× water-immersion lens (0.9 NA) and 2× scan zoom. Standard recording medium contained NaCl (129 mm), KCl (4 mm), MgCl2 (1 mm), CaCl2 (2 mm), glucose (10 mm), HEPES (10 mm), TTX (0.0005 mm), and bicuculline (0.02 mm); pH was adjusted to 7.4 with NaOH, and osmolarity to 320 mOsm with sucrose. Neurons were recorded with a patch pipette containing K-gluconate or CsCl (140 mm), NaCl (2 mm), HEPES (10 mm), Na-GTP (0.3 mm), Mg-ATP (2 mm), phosphocreatine (10 mm), pH 7.4 having a resistance of 6–10 MΩ. Signals were amplified with Axopatch 200A (Axon Instruments), and were stored on IBM PC. Data were analyzed off-line using pCLAMP software (Molecular Devices).
Glutamate uncaging.
Flash photolysis of caged molecules was performed as described elsewhere (Korkotian and Segal, 2007). Briefly, a UV laser (New Wave; air cooled Nd:YAG), emitting 355 nm, 4 ns light flashes, was focused through the water-immersion objective lens (Olympus; 63×, 0.9 NA) into a spot of <1 μm2. The UV spot was localized using a parallel red laser light, as detailed elsewhere (Korkotian and Segal, 2007). UV pulses at 1 Hz could be applied repeatedly without noticeable tissue damage. Caged glutamate (Tocris; MNI-caged glutamate) prepared from frozen stock solutions, was used in the recording medium at a final concentration of 0.2–0.5 mm.
Long-term time-lapse imaging.
For live imaging cultures cotransfected with GFP-SP and DsRed on 30 mm bottom glass windowed Petri dishes were used. Individual secondary and tertiary segments were viewed repetitively from 18 to 20 DIV cells for 3 d (24 h interval) with a Zeiss LSM 510 laser scanning confocal microscope. During imaging the incubating medium was replaced with warm (37°C) standard recording medium containing 0.1 mm Trolox (Sigma). A 40× objective lens (1.3 NA) and 1× scan zoom was used to identify individual cells in the culture. In addition coordinates from the automated X-Y stage were used to identify imaged neurons at the subsequent time points. Image stacks of a given dendritic segment were captured with 4× scan zoom. Epifluorescent illumination of living cells was avoided to minimize phototoxic damage. After imaging, the recording medium was replaced with the original incubating medium. Cultures were kept in the incubator between imaging sessions.
Chemical LTP.
APV (50 μm) was added to hippocampal cultures at 18–19 DIV for 2 d before the experiment. The conditioning protocol involved replacing the standard medium containing Mg2+ (1 mm), Ca2+ (2 mm), APV (50 μm) with a conditioning medium containing glycine (200 μm), Ca2+ (3 mm), and no APV or Mg2+ for 5 min. After replacement of the standard APV and Mg2+-containing medium, cultures were placed back in the incubator for another 90 min before imaging. For control, cultures were treated as above except that standard APV-containing medium was used throughout.
Calcium imaging and local caffeine application.
Cultures were incubated for 1 h in x-Rhod2 A.M. (2 μm) containing recording medium. A caffeine-containing patch pipette (5 mm) was positioned close to individually identified dendritic segments of a SP-transfected neuron. Responses to local pressure application of caffeine in neighboring SP(+) and SP(−) spines of the same dendritic segment were imaged using an upright Zeiss PASCAL confocal microscope equipped with a Olympus, 63×, 0.9 NA, water-immersion objective lens. Images were obtained at high speed for detecting rapid changes in [Ca2+]i (100 ms/frame, 256 × 256 pixel, 8× scan zoom). The distance between the caffeine containing pipette and individual dendritic spines was carefully controlled and similar for all dendritic segments.
Digital illustrations.
Confocal image stacks were exported as two-dimensional (2D) projections from the Zeiss LSM image browser and stored as TIFF files. Three-dimensional (3D) surface-rendered images were generated with Imaris software (Bitplane; e.g., Fig. 3 C). Figures were prepared using Photoshop CS2 graphics software. Image brightness and contrast were adjusted.
Figure 3.

The presence of SP in spines correlates with the quantity and efficacy of glutamate receptors (GluR) of the AMPA type, but not of the NMDA type. A, B, Immunostaining for GluR1 clusters demonstrates a higher mean fluorescent intensity in SP(+) spines (arrows) compared with SP(−) spines (arrowhead) (50.6 ± 4.2 and 34.2 ± 2.1 fluorescence intensity units, respectively; n = 4 cultures, 9 segments, 295 spines; p < 0.05). Scale bar, 1 μm. C, Uncaging of glutamate applied near the head of individual spines (circles) that are positive for transfected GFP-SP (yellow in colocalization with the DsRed signal) produces a larger amplitude of inward current compared with SP(−) spines. The 3D reconstruction demonstrates the subcellular localization of SP. The inset illustrates the 2D projection of the original confocal image stack. Scale bar, 5 μm. Traces of inward current, generated at the flash (arrow) demonstrate the difference between SP(+) (blue trace) and SP(−) spines. D, SP(+) spines show a 2.5-fold larger amplitude of inward current when compared with spines lacking SP (p < 0.02; n = 6 cultures; 7 cell, 47 SP(+) spines, 44 SP(−) spines). Spine size was not different in the two groups as determined by measuring the maximum cross-sectional area and spine length (p > 0.674 and 0.238, respectively). E, Current responses evoked by uncaging of glutamate near the head of a SP(+) spine, with the cell membrane held at different membrane potentials from −80 to +40 mV. The emergence of a slow component at the depolarizing potentials is evident. F, Current-voltage relations for the fast component, peaking at 2–3 ms after the flash, and for the slow component, peaking at 200 ms after the flash, and representing the NMDA component of the response to glutamate. G, An illustration of the response of a cell to flash photolysis of caged glutamate near a spine, recorded in the presence of 50 μm APV, with the cell held at −60 and +50 mV. The slow component of the response is completely blocked. H, Sample illustrations of responses of cells held at −60 and +50 mV to flash photolysis of caged glutamate near an SP(+) and an SP(−) spine, illustrating a “silent synapse.” I, J, Group data [n = 19 SP(+) spines and 17 SP(−) spines] in three different experiments (n = 5 cells, paired recording), demonstrating a significant difference when recorded at resting potential (J) and a lack of difference when recorded at +50 mV.
Quantification and analysis.
Immunostained cultures were analyzed on 3D image stacks of dendritic segments using the Zeiss LSM image browser to navigate through the stacks. To optimally demonstrate the subcellular localization of labeled structures, selected images were processed by 3D surface rendering (Imaris Software, Bitplane). Fluorescence measurements were made by producing a 2D projection of a given segment and measuring the size of cross-sectional area as well as the length of individual dendritic spines. Fluorescence intensity was calculated using the Image-J software package (available from http://rsb.info.nih.gov/ij). Measurements were made in a double blind procedure by an independent observer to assure unbiased observations. In the time-lapse imaging experiments individual SP(+) and SP(−) spines were followed over time by examining the stacks of dendritic segments manually in Zeiss LSM image browser. Electrophysiological data were analyzed with pClamp 8 software. Statistical comparisons were made using t tests, ANOVA, or Wilcoxon–Mann–Whitney test, as the case may be, in Matlab, KaleidaGraph, and Origin software. In each experiment, three to six cultures were used per group.
Results
Distribution of synaptopodin in cultured hippocampal neurons
Transfected GFP-SP puncta were visible in most cotransfected neurons, imaged between 18 and 22 d in vitro (n = 3 cultures, 12 segments, 509 spines). The cross-sectional area of these puncta was in general <0.5 μm2 and they were associated most prevalently with the proximal base of the spine head. In cases in which the spines were “stubby” (i.e., lacked a distinct spine neck), the puncta were located between the spine head and the parent dendrite (Fig. 1 A,B, arrowhead). Altogether, ∼30% of the spines contained a clearly discernable SP cluster, similar to values found in vivo (Bas Orth et al., 2005).
Figure 1.
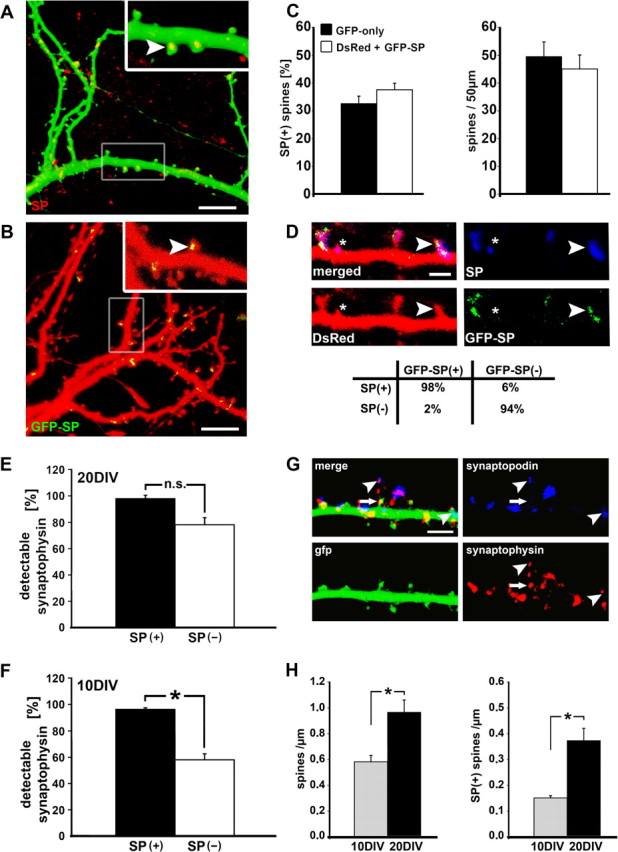
Distribution of synaptopodin (SP) puncta in dendritic spines of cultured hippocampal neurons. A, The position of SP (arrowhead) is indicated in 20 DIV cultured hippocampal neurons transfected with GFP (green) for visualizing the morphology and immunostained for native SP (red). A punctate pattern can be observed in which SP is mainly associated with the spine neck, but also with the head and base of spines. Scale bar, 10 μm. B, A similar distribution is seen in neurons cotransfected with DsRed and GFP-SP. Scale bar, 10 μm. C, Neither spine density nor the proportion of SP-positive spines is different between the two groups (GFP-only: n = 4 cultures, 16 segment, 778 spines; DsRed and GFP-SP: n = 3 cultures, 12 segments, 509 spines). D, In 98% of spines positive for GFP-SP, there was also immunostaining for SP, and 94% of cases spines negative for GFP-SP were also negative when immunostained for SP. This indicates that the distribution of GFP-SP matches the expression of endogenous SP (n = 3 cultures, 9 segments, 352 spines). Scale bar, 1 μm. E, In mature cultures (20 DIV), the vast majority of spines are associated with the presynaptic marker synaptophysin (88 ± 6.3%). There was no significant difference (NS) between SP(+) and SP(−) spines at 20 DIV (p > 0.061; n = 5 cultures, 20 segments, 1061 spines). F, In younger cultures (10 DIV), fewer SP(−) spines were adjacent to synaptophysin puncta (59.1 ± 4.5%) compared with SP(+) spines, which still demonstrated the same probability to be associated with synaptophysin (95 ± 1.9%, p < 0.001; n = 4 cultures, 16 segments, 820 spines). G, Double immunostaining for SP (blue) and synaptophysin (red) in GFP-transfected cells (green) at 20 DIV. Arrowheads point at areas where SP is associated with synaptophysin. The arrow highlights an SP(−) spine in association with synaptophysin. Scale bar, 5 μm. H, While cultures mature, an increase in spine density (p < 0.001) is accompanied by more SP(+) spines (p < 0.001). These results indicate that SP is associated with mature spines. Data are represented in this and the following figures as the mean ± SEM.
Before addressing the functional relevance of SP, a critical issue concerns the relationship between transfected and endogenous SP. Does the distribution of transfected SP reflect the distribution of endogenous SP or is it an artifact of the transfection procedure and the ubiquitous promoter used in these plasmids? To address this issue, we immunostained fixed cultured neurons for SP. This was done in several variations, including the staining of the GFP-SP transfected neurons, and staining of endogenous SP in DsRed-only transfected neurons. A nearly complete overlap between the transfected SP puncta and the immunostaining for them was found; 94% of spines negative for GFP-SP were found to be also negative for immunostained SP (Fig. 1 D) (n = 3 cultures, 9 segments, 352 spines). These results demonstrate that the distribution of the transfected SP closely matches the distribution of native SP.
In a separate experiment, native SP-clusters were quantified in GFP-transfected cells using immunofluorescence. The results were similar, in that ∼35% of the spines contained native SP puncta, indicating that the transfection neither modified the ratio of SP(+) and SP(−) spines nor modified spine density (Fig. 1 C) (spine density: p > 0.35; SP(+) spines: p > 0.46) and that the transfected SP assumed the same position in the neurons as the native one. Corroborating results were reported in SP-deficient mice, where the density distribution of spines was not different from that of normal controls (Deller et al., 2003). Thus, the expression of GFP-tagged SP does not affect spine distribution and can be used to study the functions of SP in spines of cultured hippocampal neurons.
Assuming that SP is found in mature and functional synapses (Mundel et al., 1997; Czarnecki et al., 2005), we examined whether SP(+) spines are more likely to be associated with a synaptophysin-positive presynaptic terminal than SP(−) spines. The results are shown in Figure 1 E–H. In mature neurons (20 DIV) most of the spines (88 ± 6.3%) were touched by a synaptophysin punctum, and in that respect, there was no significant difference between SP(+) and SP(−) spines (Fig. 1 E). In all of the following experiments, neurons between 18 and 22 DIV were used. Thus, we conclude that any differences observed between SP(+) and SP(−) spines is not caused by differences in innervation between the two spine populations.
On the other hand, there was a marked difference between SP(+) and SP(−) spines in younger neurons (10 DIV), in that the former had a higher tendency to be associated with a presynaptic terminal (Fig. 1 F,G). Although cultures developed between 10 and 20 DIV, an increase in spine density was accompanied by a higher amount of SP(+) spines (p < 0.001) (Fig. 1 H). These observations indicate that SP is associated with mature spines and that synaptic innervations may contribute to the targeting and maintenance of SP in dendritic spines. The results are consistent with studies which show lamina-specific alterations in the distribution of SP in the hippocampus after denervation (Deller et al., 2006) and after synaptic stimulation (Roth et al., 2001; Yamazaki et al., 2001; Fukazawa et al., 2003).
Synaptopodin correlates with spine head size
SP puncta were found in stubby, mushroom or even long spines, such that a clear correlation between classes of spines and SP could not be established. We then measured spine head size of SP(+) and SP(−) spines in the same sample of neurons. Strikingly, whereas there was no difference in spine neck length between the two groups (Fig. 2 B), head cross-sectional area was twice as large in SP(+) as it was in SP(−) spines (Fig. 2 C). This difference, studied in a random sample of 162 transfected [61% SP(−) and 39% SP(+)] and 101 nontransfected immunolabeled [70% SP(−) and 30% SP(+)] spines was highly significant. There was no significant difference between the groups of transfected and endogenous SP (Fig. 2 A–C). Thus, although SP could be found in different classes of spines (long, stubby, mushroom), when comparing heads of spines, the presence of SP was more prevalent in spines with a larger head.
Figure 2.

Distribution of SP puncta is correlated with changes in spine head size. A, Illustrations of immunostained endogenous SP (blue) and transfected SP puncta (green) in dendrites and spines of DsRed-labeled neurons (red). Scale bars, 5 μm. Bottom, silhouette frame of the dendrite and spines to clarify the view of the staining. B, For both GFP-SP-transfected (right) and endogenous (left) SP-containing spines, no significant difference in spine length was observed; p > 0.82 (left) and p > 0.23 (right). C, Maximum cross-sectional area of the spine head is twice as large in the SP(+) spines as in the SP(−) spines; p < 0.001. D, Time-lapse imaging of individual segments over a period of 3 d (19–22 DIV) demonstrates the dynamics of individual SP clusters entering (arrow) and leaving (arrowhead) dendritic spines. SP can change its position within individual spines. A case of SP dropping into the dendrite is highlighted with an asterisk. Scale bar, 5 μm. The boxed area is shown at higher magnification on the right. Scale bar, 2 μm. E, Analysis of changes in spine head size over time in spines losing or gaining SP reveals that SP is associated with changes in spine head size (n = 5 cultures, p < 0.002) (see also movie, available at www.jneurosci.org as supplemental material).
The relationship between SP and spine head size was also analyzed dynamically using time-lapse imaging of the same dendritic segments over several days (Fig. 2 D,E) (n = 5 cultures, 5 segments, 50 μm per segment analyzed, 152 spines). Interestingly, SP puncta could be identified entering and leaving spines, as well as changing positions within the spine head/neck (Fig. 2 D). We examined changes in spine head size in the subset of spines that became positive for SP (26 spines in n = 5 cultures) and in those that had lost SP (24 spines in n = 5 cultures) during several days of imaging. Under these conditions presence of SP was highly correlated with changes in spine head size (Fig. 2 E).
Synaptopodin is associated with enhanced GluR function in dendritic spines
Because SP was associated with a larger spine head size, it was predicted that the presence of SP in spines should correlate with the density of GluR1-clusters and function, as a correlation between head size and GluR1-density has been shown previously (Matsuzaki et al., 2001, 2004). Indeed, immunostaining for GluR1-clusters revealed a higher mean fluorescence intensity in SP(+) spines compared with SP(−) spines in the same neurons (Fig. 3 A,B).
To examine the functional consequences of the observed differences in GluR1 intensity we resorted to flash photolysis of caged glutamate near individual dendritic spines. The 18–22-DIV-old neurons cotransfected with GFP-SP and DsRed for visualization of the morphology were patch-clamped, and current responses to flash photolysis of caged glutamate applied near spine heads were recorded at the soma (n = 6 cultures; 7 cells; 47 SP(+) spines; 44 SP(−) spines; four consecutive responses averaged per spine). For every neuron, glutamate was uncaged along the dendrites (Fig. 3 C) in which SP(+) spines were interdigitated with SP(−) spines. Size-matched SP(+) and SP(−) spines were chosen for these experiments (Fig. 3 D) (cross-sectional area, p > 0.674; spine length, p > 0.238). Strikingly, under these conditions, the currents generated by glutamate uncaging near SP(+) spines were twice as large as those generated near SP(−) spines (Fig. 3 D). Thus, the presence of SP in spines is associated with larger responses to glutamate which does not simply reflect a difference in spine size.
To estimate the relative contribution of different glutamate receptor subtypes to the current generated by flash photolysis of caged glutamate near spine heads, a subset of neurons were recorded with CsCl containing pipettes to allow a better control of membrane currents at depolarized potentials. The responses of neurons to flash photolysis of caged glutamate were then recorded at different holding potentials and showed typical voltage dependence (Fig. 3 E). A fast component of the response had near linear current/voltage relations, and a slow response which was highly voltage dependent, and was very large at depolarized potentials (Fig. 3 H,F). This slow component was eliminated by the presence of APV (50 μm) (Fig. 3 G), indicating that it is mediated by NMDA receptor (NMDA-R) activation. As seen before, the responses of this subset of neurons to uncaging of glutamate at resting potential (−60 mV) was more than twice as large in the SP(+) spines as they were in the SP(−) spines (Fig. 3 I). On the other hand, the responses of both groups of spines to glutamate evoked at +50 mV were about the same, indicating comparable NMDA-R-mediated currents in SP(−) and SP(+) spines, respectively (Fig. 3 J). A subset of SP(−) spines in these experiments (n = 5 of 17 spines) which did not respond at all at the resting membrane potential but showed a large response at +50 mV can be considered as “silent synapses” containing mainly NMDA-R but not GluR1 receptors. Thus, the presence of SP in spines correlates with the function of GluRs of the AMPA type, but not of the NMDA type.
Reducing the expression of SP by shRNA
Three different shRNA sequences containing 19 nt corresponding to the rat synaptopodin gene were cloned into the pSUPER vector. One shRNA (Fig. 4, variant 1) was targeting to the coding sequence of SP (cds), the other two shRNAs (variant 2 and 3) were targeting 3′-UTRs of rat synaptopodin. For control a 19 nt scrambled sequence with no significant homology to any other mammalian gene was used (Asanuma et al., 2005). All constructed shRNAs significantly reduced endogenous SP expression in PC12 cells as demonstrated by Western blot analysis (Fig. 4 C,D). Similar results were obtained in hippocampal neurons; all transfected shRNAs significantly reduced the amount of SP(+) spines. The attempt to rescue the effects of shRNAs with cotransfected SP demonstrated comparable results as seen in PC12 cells; only shRNA variant 1 could not be rescued by cotransfected SP.
Transient activation of NMDA-R regulates formation of synaptopodin clusters in spines
A transient (5 min) intense activation of synaptic NMDA-R has been reported to produce a long-lasting increase in excitatory postsynaptic current magnitudes recorded between pairs of neurons in culture (Ivenshitz and Segal, 2006) and to enhance the delivery of GluR1-clusters into dendritic spine heads (Korkotian and Segal, 2007). We examined the effect of chemical LTP (cLTP) on SP puncta in dendritic spine heads using immunostaining for endogenous SP in GFP-transfected cells (Fig. 5 A). As reported before (Korkotian and Segal, 2007), chronic (2 d) blockade of NMDA-R using APV caused a significant reduction in spine density (p < 0.001) without affecting the proportion of SP(+) spines (Fig. 5 E). Interestingly, a significantly larger amount of SP-puncta could be found in the dendritic shaft after the pretreatment with APV. Ninety minutes after exposure to the conditioning medium, there was a significant and selective increase in the density of SP(+) spines in cells exposed to the conditioning medium and not in those treated with APV only (medium exchange without transient activation of NMDA-R) (Fig. 5 D,E), whereas there was no significant difference in total spine density (Fig. 5 B). It remains unclear whether NMDA-Rs regulate the accumulation of SP in spines or regulate the maintenance of spines that contain SP (but see movie demonstrating delivery of SP into a dendritic spine, available at www.jneurosci.org as supplemental material). The findings are congruent with the reported activity-dependent upregulation of SP which has been described in vivo (Fukazawa et al., 2003) and demonstrate an activity-dependent regulation of SP in individual spines.
Figure 5.
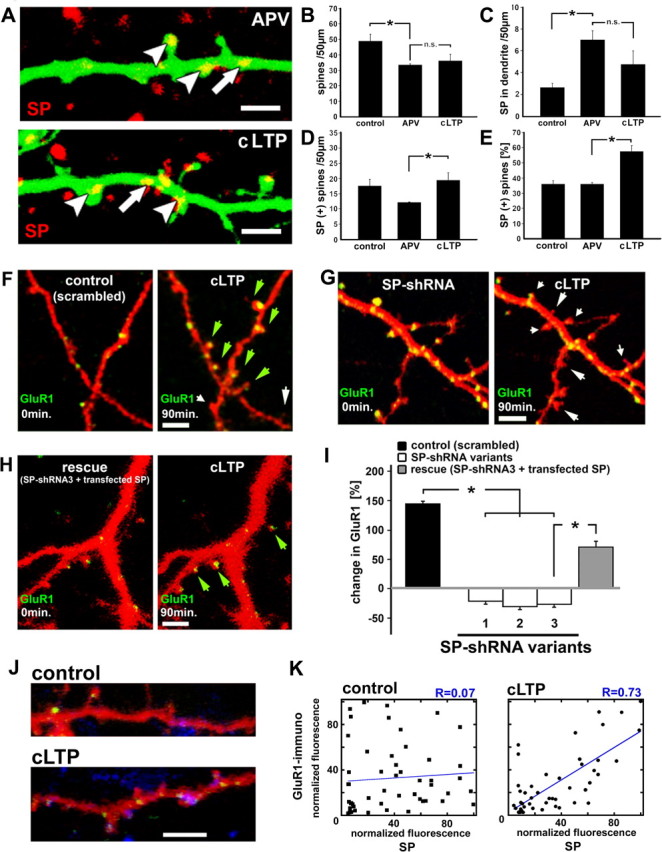
SP shRNA-transfected neurons demonstrate reduced accumulation of GluR1-clusters in spine heads after the induction of LTP. A–E, A transient activation of synaptic NMDA-Rs (cLTP) causes an increase in the number of SP(+) spines within 90 min (untreated controls: n = 4 cultures, 16 segments, 778 spines; APV: n = 4 cultures, 16 segments, 531 spines; cLTP: n = 3 cultures, 12 segments, 353 spines). Arrowheads point at SP(+) spines, and the arrows highlight endogenous SP in the dendrite. Scale bar, 2 μm. B–E, In APV-treated cultures, a decrease in spine density (B; p < 0.001) is accompanied by more SP puncta located in the dendrite compared with control cultures (C; p < 0.001). LTP causes a significant increase in the number of SP(+) spines (D, E; p < 0.04), although changes in spine density are negligible (B; p > 0.31). SP in the dendrite is not reduced back to control levels after the induction of LTP (C). F–I, Effects of cLTP on dendritic spines and GluR1 clusters are illustrated for neurons transfected with (F) a scrambled control vector, (G) shRNA for SP, and (H) with a 3′UTR-shRNA and SP (for rescue), before (left) and 90 min after (right) cLTP induction (GFP-GluR1 is yellow when colocalized with DsRed). Green arrows indicate the formation of new spines with a GluR1 cluster, white arrows indicate shrinkage or disappearance of spines, and short arrows indicate disappearance of GluR1 clusters. Scale bars, 2 μm. I, Changes in fluorescence intensity of GFP-GluR1 clusters in individual spine heads were measured in four control neurons (transfected with the scrambled plasmid), in 15 shRNA-transfected neurons (n = 5 cells per group), and in 4 neurons transfected with 3′UTR-shRNA and SP (one cell per glass). There was a marked increase in GluR1 fluorescence after the conditioning protocol. In contrast, the shRNA-transfected neurons demonstrated a decrease in GluR1 fluorescence 90 min after cLTP induction. Remarkably, in the group of neurons transfected with 3′UTR-shRNA and SP, GluR1 fluorescence was back to scrambled control levels, which were significantly different from the levels in shRNA-transfected cells. J, Colocalization of SP-transfected (green) and GluR1-immunoreactive (blue) dendrites in control (top) and LTP-treated culture (bottom). Scale bar, 3 μm. K, Summary of quantification of colocalized GluR1-immunoreactive and SP-fluorescent puncta in control (n = 5 cells, 50 spines) and cLTP-treated neurons (n = 6 cells, 50 spines), demonstrating the lack of correlation in the control, and a highly significant (r = 0.73, p < 0.01) correlation between SP fluorescence and GluR1.
The role of synaptopodin in the accumulation of GluR1-clusters in the spine head
We then used the conditioning protocol in cultures to examine whether SP is causally involved in the accumulation of GluR1-clusters in spine heads. To this end, we compared neurons that were triply transfected with shRNA for SP, GFP-GluR1 and DsRed (for imaging morphology) with neurons that were transfected with a scrambled shRNA-plasmid, GFP-GluR1 and DsRed. Three different shRNAs were used in this set of experiments to exclude unspecific off-target effects. Two of the three shRNAs were targeting 3′-UTRs of rat SP, thus allowing a rescue of the shRNA-effects by using a transfected SP plasmid expressing the coding sequence only (cds) (Fig. 4).
After this verification that SP-shRNA is indeed effective in suppressing SP expression, and that the phenotype can be rescued, we proceeded with the main experiment: Neurons that were pretreated with APV were imaged before and 90 min after cLTP-induction. Changes in fluorescence intensity of GFP-GluR1-clusters in individual spine heads were measured (Fig. 5 I). In four experiments, four control neurons (transfected with the scrambled plasmid) were compared with 15 shRNA-transfected neurons (1 cell per dish). The results of the control group were similar to those reported before (Korkotian and Segal, 2007). There was a marked increase in GluR1 fluorescence after the conditioning protocol, whereas shRNA-transfected neurons failed to demonstrate an increase in GluR1 fluorescence 90 min after cLTP induction. The difference between the scrambled and shRNA-transfected neurons was highly significant (p < 0.001) (Fig. 5 I). Remarkably, in an additional group of neurons transfected with 3′UTR-shRNA and SP (coding sequence only; attempt to rescue the cells from the effects of shRNA) GluR1 fluorescence after cLTP-induction revealed control levels (n = 4 cells, one cell per dish).
Finally, in another series of experiments the native post hoc immunostained GluR1 was quantified and compared with transfected SP in the same set of spines, between control and cells that underwent cLTP. A clear correlation was found in the latter but not in the former group, such that a high SP fluorescence was correlated with high fluorescence of native GluR1 (Fig. 5 K). This result further supports the correlation between native GluR1 and SP, indicating that the correlation is not restricted to transfected GluR1.
These results link activity-dependent increase of SP after LTP-induction (Yamazaki et al., 2001; Fukazawa et al., 2003) and defects of SP-deficient mice in LTP-induction (Deller et al., 2003; Jedlicka et al., 2008a), indicating that SP plays a critical role in NMDA-R dependent increase in GluR1-clusters in individual dendritic spines.
Synaptopodin affects dendritic spine plasticity via its interaction with calcium stores
We next examined possible downstream pathways for mediation of SP effects on NMDA-R driven accumulation of GluR in dendritic spines. SP is associated with the spine apparatus, which is seen as a local extension of the smooth endoplasmic reticulum (Spacek, 1985). Although no direct experimental evidence exists on this issue, the spine apparatus has been implicated in regulating calcium kinetics in dendritic spines (Fifkova et al., 1983). Previous studies with cultured hippocampal neurons and organotypic slice cultures suggested that calcium released from internal stores is responsible for a large part of synaptically evoked calcium transients (Korkotian and Segal, 1998; Emptage et al., 1999), which can trigger different forms of synaptic plasticity (Segal, 2005). For that reason, the relation between SP and internal calcium stores and their effect on GluR1 accumulation was examined.
In the hippocampus, ryanodine receptors (RyR) are present throughout the endoplasmic reticulum in spines and dendrites, whereas inositol trisphosphate receptors (IP3R) are believed to exist mainly in dendritic shafts (Sharp et al., 1993; Korkotian and Segal, 1998). SP puncta were therefore first colocalized with immunofluorescent RyR in dendritic spines (Fig. 6; see also supplemental Fig. 1B, available at www.jneurosci.org as supplemental material). Spines that were stained for RyR, also contained SP puncta, either transfected or native, and vice versa (Fig. 6 A,C) Interestingly, in most cases the fluorescence signal for RyR did not completely overlap with SP puncta, but both signals were found adjacent to and touching each other within the same spines. In addition RyR tended to accumulate in larger spine heads (Fig. 6 D), as was also the case for SP (Fig. 2).
Figure 6.

SP is coupled to ryanodine receptors (RyR). A, Association between SP (green) and RyR (blue) in DsRed-transfected neurons. Both signals were frequently found adjacent to and touching each other within the same spines (see also supplemental Fig. 1, available at www.jneurosci.org as supplemental material). Arrowheads point at SP(+) spines. Scale bars, 2 μm. B, SP-shRNA-transfected neurons express fewer spine-associated RyR compared with cells transfected with a scrambled RNA plasmid (n = 3 cells per group; p < 0.001). The effects of shRNA variant 1, targeting the coding sequence of SP, cannot be rescued with cotransfected SP (cds only). C, D, RyR are more prevalent in SP(+) than in SP(−) spines (n = 6 cells, 101 spines; p < 0.01). D, No difference in spine length between RyR-positive [RyR(+)] and RyR-negative [RyR(−)] spines was seen (p > 0.895). The presence of RyR was associated with a larger spine head size (p < 0.02). E–H, Pulsed application of caffeine caused a transient rise of [Ca2+]i, nearer to SP puncta than more remote from them. Red indicates x-Rhod staining for imaging of [Ca2+]i, green GFP-SP. E, Raw image (top) and a subtracted image (bottom), indicating loci where x-Rhod shows enhanced fluorescence after exposure to caffeine. F, Regions of interest drawn near and remote from SP puncta. G, Illustration of responses to five consecutive pulse applications of caffeine; the individual traces correspond in color to those circled in F. H, Summary diagram of the time course of calcium changes near and remote from SP puncta in 48 dendrite/spine segments. The difference between the groups is highly significant (p < 0.001). These results demonstrate that SP is correlated with a larger calcium transient in response to caffeine.
Second, there was a significant reduction in spine-localized RyR in SP-shRNA-transfected neurons compared with scrambled transfected controls (n = 3 cells per group) (Fig. 6 B). Moreover, in neurons cotransfected with 3′UTR-shRNA and the SP plasmid (cds) the amount of RYR(+) spines was back to control levels. Cotransfection of SP and the shRNA targeting the cds of SP served then as a negative control for the rescue experiment (Fig. 6 B). These results indicate that SP could be instrumental in recruiting a source of calcium containing RyR in dendritic spines.
To examine the functionality of the detected RyR we used topical pulsed application of the RyR agonist caffeine, which has been shown to cause a transient elevation of [Ca2+]i in dendritic spines (Korkotian and Segal, 1999). We measured [Ca2+]i changes near and away from SP puncta in 48 dendritic segments in three different experiments (Fig. 6 E–H). In these experiments calcium variations were measured with the red calcium sensor x-Rhod-AM. The results indicate that the presence of SP puncta in the vicinity of the caffeine-containing pipette was associated with a highly significant, 60% increase in magnitude of [Ca2+]i response to caffeine, compared with regions of spines and dendrites remote from a SP punctum. Comparable results were obtained by using pulse application of ryanodine at low concentration (5 μm; see below). The presence of thapsigargin (0.5 μm) blocked the calcium response to pulse application of caffeine, indicating that caffeine activates calcium stores, as suggested before (Korkotian and Segal, 1999). Together, these results indicate that SP tightly couples to RyR containing intracellular calcium stores.
We have recently demonstrated that an increase in intracellular calcium concentration within individual spines is sufficient to elevate GluR1 in the spines (Korkotian and Segal, 2007). Therefore the ability of pulsed application of caffeine to cause calcium-dependent increase in GluR1 in dendritic spine heads was examined (Fig. 7). These experiments were conducted with neurons that were triply transfected with DsRed, GFP-GluR1, and either shRNA for SP or a scrambled control RNA. After pulse application of caffeine (5 mm, one 100 ms pulse every 10 s, for 10 min) there was a significant increase in GluR1 fluorescence in the spines of cells transfected with the scrambled control plasmids (n = 27 spines in 5 different cells). Strikingly, there was no effect on GluR1 fluorescence in the cells transfected with the two types of shRNA (27 spines in four cells each) (Fig. 7 D). The difference among the three groups was highly significant (p < 0.01). In a fourth group of neurons transfected with the same 3′UTR-shRNA plus the SP plasmid for a rescue experiment, the GluR1 fluorescence that was reduced in the SP-shRNA-transfected neurons was now back to control levels (Fig. 7 D). A subset of cultures was fixed and immunostained post hoc for SP (Fig. 7 F). The results confirmed that the increased GluR1 signal in spine heads was correlated with the presence of SP in these spines. Moreover, when caffeine puffs were applied in cells pretreated with thapsigargin (0.5 μm; depleting internal stores), an increase in GluR1 was blocked in the SP(+) spines (Fig. 7 E). In addition, pulse application of ryanodine (5 μm, one 100 ms pulse every 30 s, for 20 min) mimicked the effects of caffeine on GluR1 (Fig. 7 G).
Figure 7.
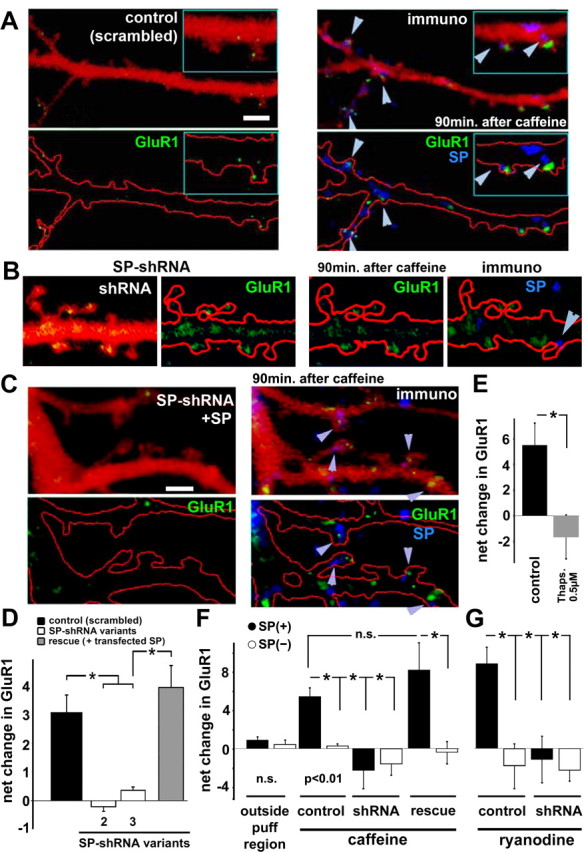
Caffeine causes accumulation of GluR1 in spines via SP-associated calcium surges. Pulsed application of caffeine caused a rise of GluR1 fluorescence in spines of control (transfected with a scrambled shRNA sequence) but not in shRNA-transfected neurons. A–C, Shown are dendrites of cells transfected with DsRed for imaging morphology. Red outline is drawn to ease identification of the puncta. Before (left) and 90 min after (right) the pulsed application of caffeine, immunostained for SP to indicate that the same spines that demonstrated an increase in florescence intensity of GluR1 puncta (green arrowheads) are also endowed with SP (blue). Scale bar, 2 μm. B, Same as A, but in a cell transfected with shRNA for SP. An actual reduction in the fluorescent intensity of GluR1 puncta is evident. C, Same as A, except that the cell was transfected with a 3′-UTR shRNA and with SP, in an attempt to rescue the effects of shRNAs on the accumulation of GluR1 in spines. D, Summary diagram of the changes in GluR1 fluorescence (in arbitrary units) before and after exposure to caffeine. Highly significant differences are seen between scrambled controls and shRNA-transfected neurons (p < 0.0002; n = 5 cells in the scrambled control group, n = 4 cells each in the other three groups, 27 spines in each group). E, The net increase in GluR1 fluorescence following exposure to caffeine was blocked by the presence of thapsigargin in the imaging medium (3 cells, 20 spines per group, p < 0.006). F, A subset of cultures was fixed and immunostained post hoc for SP. The analysis was made separately for SP(+) and SP(−) spines [each group contains at least 12 spines, except for the shRNA group, which only contained 4 SP(+) spines]. The results clearly indicated that the caffeine-induced rise in GluR1 fluorescence was restricted to SP(+) spines. G, Pulse application of 5 μm ryanodine, as with caffeine, could produce an SP(+)-selective rise in GluR1 fluorescence, and this too, was absent in shRNA-transfected neurons [control SP(+), 10 spines; SP(−), 15 spines, 2 cells; shRNA, 9 SP(+), 18 SP(−), 3 cells].
The interaction between RyR and SP was then examined using ryanodine at a concentration that blocks RyR (100 μm) and with cyclopiazonic acid (CPA) (25 μm) which inhibits the SERCA pumps and depletes internal calcium stores (Meldolesi, 2001). In cultures that were incubated with 100 μm ryanodine or 25 μm CPA for 90 min, there was a 40% reduction of GFP-GluR1 in dendritic spines (Fig. 8 A–D). This effect was striking in spines with a large head (cross-sectional area ≥0.65 μm, cutoff chosen according to the mean difference in spine head size between SP(+) and SP(−) spines, and RYR(+) and RYR(−) spines, respectively) and was not seen in untreated controls.
Figure 8.
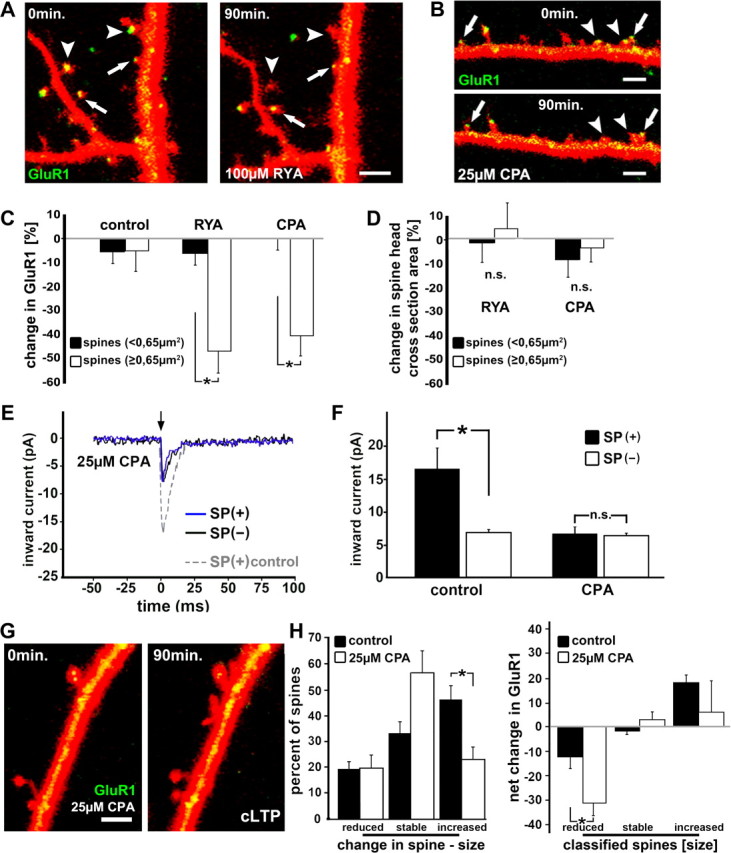
SP recruits RyR containing calcium stores to regulate GluR1 in dendritic spines. A, B, The density of GFP-GluR1 in DsRed-transfected cells is reduced after 90 min of exposure to 100 μm ryanodine or 25 μm CPA in spines with large heads (arrowheads) but not in spines with smaller heads (arrows), respectively. Scale bar, 1 μm. C, D, Summary diagram demonstrating the reduction of GFP-GluR1 fluorescent intensity in big spines in the presence of ryanodine or CPA (n = 5 cultures per group, five segments, one cell per culture; p < 0.01). Spine head size was not altered after 90 min in ryanodine or CPA (p > 0.2). E, Trace illustrations of inward current, generated at the flash (arrow; glutamate uncaging) demonstrate responses of SP(+) (blue trace) and SP(−) spines after 90 min of treatment with 25 μm CPA. Note the larger responses of an SP(+) spine under control conditions (gray dotted trace). F, The responses to the uncaging of glutamate in SP(+) spines is reduced down to the level seen in SP(−) spines after treatment with CPA (n = 4 cultures; four cells; 30 SP(+) spines; 26 SP(−) spines; four consecutive responses averaged per spine). G, H, The cLTP induction protocol was applied in CPA-treated cultures (25 μm) cotransfected with GFP-GluR1 and DsRed. Scale bar, 1 μm. Changes in spine size as well as changes in GluR1 fluorescence were compared before and 90 min after the induction of LTP. CPA-treated neurons (n = 4 cell, 180 spines) did not express a rise in GluR1 after the induction of LTP (p > 0.39), and significantly fewer spines were expanded after the induction of cLTP (H; p < 0.005).
We examined the functional relevance of the GluR1 reduction after CPA treatment using flash photolysis of caged glutamate near individual spines. Strikingly, the differences between SP(+) and SP(−) spines in the responses to uncaging of glutamate, seen in control cells, was absent in CPA-treated cells (Fig. 8 E,F), indicating that depletion of internal stores causes a reduction in GluR specifically in SP(+) spines. These observations demonstrate that SP is associated with RyR, which in turn regulate intracellular calcium levels and, consequently, the accumulation of GluR1-clusters into dendritic spine heads (Hayashi et al., 2000; Meldolesi, 2001; Shi et al., 2001; Malinow and Malenka, 2002; Boehm et al., 2006; Korkotian and Segal, 2007; Wang et al., 2008).
To examine whether blockade of calcium stores in the cultured neurons will affect their ability to undergo plastic changes after cLTP, we conducted the conditioning experiment in cells exposed to CPA (Fig. 8 G,H). Neurons pretreated with CPA were imaged before and 90 min after cLTP-induction. Changes in spine morphology as well as fluorescence intensity of GFP-GluR1 clusters in individual spine heads were measured. The spines were grouped into three categories: those reduced in size, those that did not change (stable), and those that increased their size. Based on this classification changes in GFP-GluR1 were analyzed in individual spines of the three groups (Fig. 8 H). In four experiments, seven control neurons were compared with four CPA-treated neurons. The results of the control group were similar to those reported before (Korkotian and Segal, 2007); there was a marked increase in the size of the spines after the conditioning protocol and only a small number of spines were reduced in size. Concomitantly, a marked increase in GluR1 fluorescence was observed in the group of expanding spines. In contrast, the CPA-treated neurons expressed a much lower proportion of expanding spines, and there was no significant change in the intensity of GluR1 fluorescence in these spines (Fig. 8 H).
Together, these experiments clearly indicate that by recruiting a RYR containing calcium store to the spine compartment SP is instrumental in a calcium dependent increase in GluR1 in dendritic spines.
Synaptopodin interaction with the actin network of the spines
Activity-dependent changes in the actin cytoskeleton and its associated proteins play a central role in synaptic plasticity (Cingolani and Goda, 2008). SP contains an actin/actinin binding domain (Asanuma et al., 2005), which may be related to its strategic position in the spine, and be associated with the ability to influence trafficking of GluR1 into and out of the spine head. At present, however, data on SP/actin interactions in neurons are scarce and most of our knowledge is based on observations from non-neuronal cell lines (Asanuma et al., 2005, 2006; Kremerskothen et al., 2005; Faul et al., 2008; Okubo-Suzuki et al., 2008), which makes it difficult to draw conclusions concerning its role in synaptic plasticity. We examined the interaction between SP and filamentous actin in its role in calcium dependent accumulation of GluR1 in dendritic spines, using the F-actin depolymerizing toxin latrunculin A. This drug has been shown to stop motility of dendritic spines and cause their eventual collapse (Korkotian and Segal, 2001; Richards et al., 2004). We first confirmed that latrunculin depolymerizes actin in our testing conditions, and indeed the rhodamine-phalloidin staining of dendritic spines, indicating the presence of F-actin, was markedly suppressed by the drug (Fig. 9 A). We then hypothesized that if SP is delivered to the spine neck through its binding to filamentous actin, the blockade of actin polymerization by latrunculin A might cause a retraction of SP-puncta from spine necks. We therefore compared distributions of SP puncta before and 2–2.5 h after exposure to latrunculin (20 μm, 4 cells, 145 spines) in hippocampal neurons, cotransfected with GFP-SP and Ds-Red. SP did not disappear from most spines where it was detected before exposure to the toxin (Fig. 9 A), Furthermore, the spines endowed with SP puncta were less likely to change their morphology, disappear or elongate, compared with SP-negative spines, in the same dendritic segments (Fig. 9 B) (137 spines in three cells examined). This indicates that although SP may be linked to the actin network, its strategic position in the spine neck is not affected by the polymerized state of actin.
Figure 9.

Integrity of F-actin is critical for SP-mediated caffeine-induced increase in GluR1 in spine. A, Latrunculin causes a large reduction in rhodamine-phalloidin staining of F-actin. Top, Control neuron transfected with GFP for imaging morphology, and stained with phalloidin, which labels primarily dendritic spines. Bottom, 2 h of exposure to latrunculin produced a highly significant reduction in phalloidin staining (bar graph below, averages of 50 spines sampled from five cells each). Scale bar, 5 μm. B, In the same dendritic segment, transfected with GFP-SP and DsRed for morphology, imaged before (top) and after (bottom) 2.5 h of exposure to latrunculin A (20 μm). Green arrowheads point to persistent spines; white arrowheads point to modified (removed, elongated) spines. C, Summary diagram of the proportion of persistence among SP(+) and SP(−) spines, indicating a clear correlation between the persistence of spines and the presence of SP puncta. D, E, Latrunculin does not affect the ability of caffeine to induce a rise of [Ca2+]i in dendrites and spines. D, Consecutive responses of the same dendritic segment to a pulse application of caffeine applied before, 1.5 h, and 2 h after exposure to latrunculin. E, Averaged responses of five fields in two cells to caffeine, before and 2.5 h after the onset of exposure to latrunculin. F–H, Exposure of control (F) and latrunculin-treated (H) cultures to caffeine causes a change in GluR1 puncta, such that in the control there is a rise in spine GluR1 fluorescence (green arrowheads), while in the toxin-exposed culture the density of GluR1 was reduced significantly. In both F and H cultures, the three images were taken before (left), after 1.5 h of caffeine (middle), and in retrospective immunocytochemistry (immuno) for SP (blue arrowheads) (right). G, The difference between control and latrunculin-treated cultures was highly significant.
We then examined whether F-actin is involved in the calcium rise produced by pulsed application of caffeine. Once again, cultures were exposed to latrunculin for 2.5 h, and the changes in [Ca2+]i in response to pulsed application of caffeine were compared before and after exposure to the toxin (Fig. 9 C) (2 cells, 5 fields, 24 measurements). There was no apparent effect of latrunculin on calcium transients evoked by caffeine under these conditions (Fig. 9 D).
After these initial experiments, the role of F-actin in the caffeine-induced, calcium-dependent accumulation of GluR1 in dendritic spine heads was examined. In 60 control spines monitored in three neurons transfected with GFP-GluR1 and DsRed, caffeine produced a rise in GluR1 staining of dendritic spine heads (Fig. 9 F), as seen before. This effect was totally reversed by the presence of latrunculin, which in fact, caused a net reduction in GluR1 fluorescence in 60 spines studied in three cells after pulse application of caffeine (Fig. 9 G).
These experiments indicate that SP may exert its facilitatory action on accumulation of GluR1 in dendritic spine heads by enhancing store-associated [Ca2+]i rise, to activate calcium dependent, F-actin-mediated accumulation of GluR1 in spine heads (Fig. 10). This is a dynamic process, and a reduction in [Ca2+]i surge, by the calcium store antagonist CPA, by ryanodine at high concentration (100 μm), or the shRNA to SP may in fact lead to a reduction of GluR1 in spine heads.
Figure 10.

Schematic illustration summarizing the experimental data. Transient synaptic activation of NMDA-Rs causes an accumulation of SP in dendritic spines, an increase in spine head volume, and the accumulation of AMPA-Rs. SP regulates the presence of RyR in the spine neck. In turn, these receptors regulate calcium release from internal stores, which is a crucial step in postsynaptic spine plasticity.
Discussion
The present experiments demonstrate that SP accumulates in strategic locations at the base of the head of some dendritic spines in cultured hippocampal neurons. Although it is not associated with a specific class of spines (stubby, mushroom, long), SP is more prevalent in spines with a large head that are innervated by synaptophysin-containing terminals. The presence of SP in spines correlates with the presence and efficacy of functional GluRs of the AMPA type, but not of the NMDA type and its presence is upregulated by a transient activation of the NMDA-R that causes a long lasting potentiation of synaptic connectivity (Ivenshitz and Segal, 2006).
SP has been associated with the spine apparatus, a membranous extension of the dendritic smooth endoplasmic reticulum. This neuronal organelle is found in a subpopulation of spines of telencephalic neurons (Spacek, 1985; Spacek and Harris, 1997) and, interestingly, its regional distribution pattern mirrors the expression pattern of SP (Mundel et al., 1997; Deller et al., 2000, 2002). Using immunogold-EM analysis, SP-immunoreactivity was found in close association with the spine apparatus (Deller et al., 2000, 2003). A critical role of SP in the formation of spine apparatus has been demonstrated in studies using a synaptopodin-deficient mouse, where the spine apparatus was absent (Deller et al., 2003). The involvement of the spine apparatus in the functional properties of the spine is still enigmatic, and a role in local protein synthesis, as well as in regulation of intracellular calcium concentrations have been suggested (Burgoyne et al., 1983; Fifkova et al., 1983; Pierce et al., 2000), consistent with the association of endoplasmic reticulum with calcium stores (Meldolesi, 2001).
The existence of a spine apparatus in cultured neurons has not yet been clearly established (M. Frotscher, personal communication). Nevertheless, cultured neurons obviously contain endogenous SP and both the transfected variant and the endogenous SP are highly localized in specific locations in the spine, coincident with the distribution in vivo. Thus the in vitro system used in the present study makes it possible to study the role of SP in spine function and glutamatergic neurotransmission regardless of its participation in the construction of a spine apparatus.
Thus far, SP has been shown to bind actin and α-actinin-2 (Mundel et al., 1997; Asanuma et al., 2005, 2006; Kremerskothen et al., 2005) and through these interactions it may contribute to the maintenance of the structure of the spine, which is highly dependent on polymerized actin (Fischer et al., 1998; Fukazawa et al., 2003). In fact, it has been suggested that SP orchestrates cell motility via Rho-A signaling (Asanuma et al., 2006). Because spine motility via Rho signaling is likely to be associated with spine head plasticity (Fischer et al., 2000; Pilpel and Segal, 2004; Korkotian and Segal, 2007), SP could provide a link between the actin cytoskeleton, growth of spine head volume and synaptic GluRs. However, the strategic and restricted location of SP, at the base of the spine head, indicates that it does not serve merely as a binding protein for the ubiquitous actin cytoskeleton but if at all, may link actin to calcium stores, which have a more restricted localization in the spine. In support of this, our results indicate that when actin polymerization was disrupted by latrunculin, SP did not disappear; on the contrary, spines that are endowed with SP are more resistant to the disrupting effect of the toxin.
Transient activation of the cultured neuronal network using a conditioning protocol that produces LTP causes a rather rapid increase in SP staining in dendritic spines. In previous studies a massive activation of intact tissue using kainic acid caused an increase in SP mRNA in the somata of hippocampal neurons (Roth et al., 2001). Likewise, tetanic stimulation which produces LTP caused a rise in SP mRNA in the dentate gyrus of the intact animal (Yamazaki et al., 2001). These results indicate that SP may react to enhanced activation of neurons in two phases: The first one involves the rapid delivery of SP molecules, potentially from the dendritic shaft into dendritic spines, and the second one involves translation of new SP-mRNA in the nucleus, de novo synthesis of SP in the soma and subsequent transport of SP into the dendrites.
The present results indicate that NMDAR-mediated network activation results in an increase in SP-staining which is accompanied by a rise of GluR1 fluorescence at the spine heads. Using a SP knock-down approach, we could demonstrate that neither of these changes took place in SP-shRNA-transfected neurons, suggesting that SP is crucial for the formation of the functional and structural changes in the affected spines. Thus, we conclude that SP plays an important role in the regulation of GluR1-related synaptic plasticity.
The vehicle through which SP asserts its action on plastic properties of neurons is not entirely clear and most of our current knowledge is based on studies in non-neuronal cell lines, making it difficult to draw any conclusions on its role in synaptic plasticity. On one hand, SP has been associated with the actin cytoskeleton and actin-regulatory proteins (Mundel et al., 1997; Asanuma et al., 2005), which suggest a role for SP in spine motility as well as GluR trafficking and anchoring (Wyszynski et al., 1997, 1998) but on the other hand, it has been hypothesized to be related to regulation of calcium stores (Deller et al., 2007; Jedlicka et al., 2008b), which are also associated with synaptic plasticity (Fitzjohn and Collingridge, 2002). Our results clearly link SP with calcium stores, immunolabeled with RyR. Not only that the two proteins colocalize within individual spines, but a marked reduction in SP, using the knockdown approach, also reduced spine RyR staining. Pulsed application of RYR-agonists (caffeine or ryanodine at low concentration) induced SP-associated calcium release and caused accumulation of GluR1 in SP(+) spines. Furthermore, blocking internal calcium stores (ryanodine at high concentration) or depleting stores with CPA, suppresses the association of SP-containing puncta with a larger response to glutamate. In addition to these effects, CPA which blocks RyR stores prevented plasticity of GluR1 evoked by conditioning, as seen in SP-shRNA-treated cells. Thus, we hypothesize that SP recruits RYR-related calcium store. These receptors in turn regulate calcium release from stores, which is a crucial step in postsynaptic spine plasticity (Fig. 9).
The strategic positioning of SP-related calcium stores could play a critical role in calcium dependent synaptic plasticity. Interestingly only a subset of dendritic spines contain SP and in this respect SP associated calcium stores might serve as modular calcium signaling units regulating synaptically evoked spine calcium independently of calcium pulses at neighboring synapses. Apparently this concept should provide highly compartmentalized and locally regulated calcium signals. Moreover, the exact positioning of such a store within individual spines and its relation to spine geometry could have direct effects on shaping and segregating calcium transients, perhaps affecting the propagation of calcium waves from spines into dendritic shafts and vice versa. Further work will be needed to clarify the role of such a localized internal source of calcium. Our time-lapse imaging data clearly indicate that SP-puncta change their position within individual spines, suggesting that their strategic positioning could play a role in spine/synapse plasticity.
Our results also indicate that the accumulation of GluR1 in spines after caffeine-induced release of calcium from stores is dependent on the integrity of F-actin. The presence of latrunculin, which causes depolymerization of F-actin and suppression of spine motility, did not block caffeine-induced calcium rise, but did block accumulation of GluR1 in spine heads. These results concur with previous observations on the relations between F-actin and motility of membrane-bound GFP (Richards et al., 2004) and are in line with a recent study demonstrating calcium dependent MyosinVb associated recycling of AMPA receptors (AMPA-Rs) on the activation of NMDA-R (Wang et al., 2008). However, further work will be needed to determine downstream mechanisms that mediate an increase in GluR on calcium release from SP-associated stores.
The results also confirm a recent suggestion on the role of SP in stability of F-actin (Okubo-Suzuki et al., 2008). In that study exogenous SP in Ptk2 cells suppressed staurosporin-dependent disruption of F-actin stress fibers. The authors conclude that SP maintained the observed activity-dependent enlargement of dendritic spines in hippocampal neurons by stabilizing F-actin. Likewise, our data demonstrate that SP(−) spines were modified or eliminated by latrunculin, the ones bearing SP were less affected morphologically by the toxin, indicating that SP may protect F-actin from destruction in neurons.
The effect of CPA (25 μm), and SP-shRNA to reduce density of GluR1 in the spine head is interesting indeed, and concur with the possibility that these agents produce a lower calcium transient, which is assumed to be associated with the generation of long-term depression (LTD) of synaptic responses (Cummings et al., 1996). CPA treatment affected predominantly SP(+) spines, suggesting that a modulation of calcium release from internal stores might be instrumental in controlling the strength of specific synapses at SP(+) spines. It is yet to be determined whether indeed these drugs convert LTP to LTD in other testing conditions [e.g., in the dentate gyrus of the hippocampus, where 37% of spines are SP(+)] (Bas Orth et al., 2005). Nonetheless, these results may resolve the controversy between the suggestion that calcium stores play a major role in synaptic calcium transients (Emptage et al., 1999) and the inability to detect such involvement (Kovalchuk et al., 2000): CPA causes removal of GluR1 from synapses, which may cause a reduction in synaptic responses after 1 h of incubation with the drug, independent of its effect on the calcium transients mediated by release of calcium from stores.
Finally, although the results presented in this study clearly indicate a link between SP and glutamate functions in dendritic spines, they do not address directly the possible mechanism for regulation of GluR1 functions by SP, which may involve altered trafficking of the receptor to the synapse, its synthesis, degradation or removal from the synapse. These mechanisms are subject for further investigations.
Regardless of its role in regulation of GluR1 function, SP seems to be associated with regulation of calcium in the synapse. Hence future work on the role of internal calcium stores in synaptic plasticity must take SP and its unique localization at the base of the spine head into consideration. Accordingly these findings offer a new perspective in the still controversial link between calcium stores, spine calcium handling machinery and long-term plasticity in pyramidal neurons.
Footnotes
This work was supported by German–Israeli Foundation Grant 827/04, by an Israel Science Foundation grant (768/06), and by a grant from the Deutsche Forschungsgemeinschaft (DE 551/8-1). We thank Varda Greenberger for production and maintenance of the cultures, Dr. P. Mundel for kindly providing the synaptopodin plasmid, Dr. A. Bershadsky for the gift of latrunculin, Dr. V. Shoshan-Barmatz for the antibody for ryanodine receptor, and Dr. M. Frotscher for comments on this manuscript.
References
- Asanuma K, Kim K, Oh J, Giardino L, Chabanis S, Faul C, Reiser J, Mundel P. Synaptopodin regulates the actin-bundling activity of alpha-actinin in an isoform-specific manner. J Clin Invest. 2005;115:1188–1198. doi: 10.1172/JCI23371. [DOI] [PMC free article] [PubMed] [Google Scholar]
- Asanuma K, Yanagida-Asanuma E, Faul C, Tomino Y, Kim K, Mundel P. Synaptopodin orchestrates actin organization and cell motility via regulation of RhoA signalling. Nat Cell Biol. 2006;8:485–491. doi: 10.1038/ncb1400. [DOI] [PubMed] [Google Scholar]
- Bas Orth C, Vlachos A, Del Turco D, Burbach GJ, Haas CA, Mundel P, Feng G, Frotscher M, Deller T. Lamina-specific distribution of synaptopodin, an actin-associated molecule essential for the spine apparatus, in identified principal cell dendrites of the mouse hippocampus. J Comp Neurol. 2005;487:227–239. doi: 10.1002/cne.20539. [DOI] [PubMed] [Google Scholar]
- Boehm J, Kang MG, Johnson RC, Esteban J, Huganir RL, Malinow R. Synaptic incorporation of AMPA receptors during LTP is controlled by a PKC phosphorylation site on GluR1. Neuron. 2006;51:213–225. doi: 10.1016/j.neuron.2006.06.013. [DOI] [PubMed] [Google Scholar]
- Burgoyne RD, Barron J, Geisow MJ. Cytochemical localisation of calcium binding sites in adrenal chromaffin cells and their relation to secretion. Cell Tissue Res. 1983;229:207–217. doi: 10.1007/BF00217893. [DOI] [PubMed] [Google Scholar]
- Cingolani LA, Goda Y. Actin in action: the interplay between the actin cytoskeleton and synaptic efficacy. Nat Rev Neurosci. 2008;9:344–356. doi: 10.1038/nrn2373. [DOI] [PubMed] [Google Scholar]
- Cummings JA, Mulkey RM, Nicoll RA, Malenka RC. Ca2+ signaling requirements for long-term depression in the hippocampus. Neuron. 1996;16:825–833. doi: 10.1016/s0896-6273(00)80102-6. [DOI] [PubMed] [Google Scholar]
- Czarnecki K, Haas CA, Bas Orth C, Deller T, Frotscher M. Postnatal development of synaptopodin expression in the rodent hippocampus. J Comp Neurol. 2005;490:133–144. doi: 10.1002/cne.20651. [DOI] [PubMed] [Google Scholar]
- Deller T, Merten T, Roth SU, Mundel P, Frotscher M. Actin-associated protein synaptopodin in the rat hippocampal formation: localization in the spine neck and close association with the spine apparatus of principal neurons. J Comp Neurol. 2000;418:164–181. doi: 10.1002/(sici)1096-9861(20000306)418:2<164::aid-cne4>3.0.co;2-0. [DOI] [PubMed] [Google Scholar]
- Deller T, Haas CA, Deissenrieder K, Del Turco D, Coulin C, Gebhardt C, Drakew A, Schwarz K, Mundel P, Frotscher M. Laminar distribution of synaptopodin in normal and reeler mouse brain depends on the position of spine-bearing neurons. J Comp Neurol. 2002;453:33–44. doi: 10.1002/cne.10362. [DOI] [PubMed] [Google Scholar]
- Deller T, Korte M, Chabanis S, Drakew A, Schwegler H, Stefani GG, Zuniga A, Schwarz K, Bonhoeffer T, Zeller R, Frotscher M, Mundel P. Synaptopodin-deficient mice lack a spine apparatus and show deficits in synaptic plasticity. Proc Natl Acad Sci U S A. 2003;100:10494–10499. doi: 10.1073/pnas.1832384100. [DOI] [PMC free article] [PubMed] [Google Scholar]
- Deller T, Bas Orth C, Vlachos A, Merten T, Del Turco D, Dehn D, Mundel P, Frotscher M. Plasticity of synaptopodin and the spine apparatus organelle in the rat fascia dentata following entorhinal cortex lesion. J Comp Neurol. 2006;499:471–484. doi: 10.1002/cne.21103. [DOI] [PubMed] [Google Scholar]
- Deller T, Orth CB, Del Turco D, Vlachos A, Burbach GJ, Drakew A, Chabanis S, Korte M, Schwegler H, Haas CA, Frotscher M. A role for synaptopodin and the spine apparatus in hippocampal synaptic plasticity. Ann Anat. 2007;189:5–16. doi: 10.1016/j.aanat.2006.06.013. [DOI] [PubMed] [Google Scholar]
- Emptage N, Bliss TV, Fine A. Single synaptic events evoke NMDA receptor-mediated release of calcium from internal stores in hippocampal dendritic spines. Neuron. 1999;22:115–124. doi: 10.1016/s0896-6273(00)80683-2. [DOI] [PubMed] [Google Scholar]
- Faul C, Donnelly M, Merscher-Gomez S, Chang YH, Franz S, Delfgaauw J, Chang JM, Choi HY, Campbell KN, Kim K, ReiserJ, Mundel P. The actin cytoskeleton of kidney podocytes is a direct target of the antiproteinuric effect of cyclosporine A. Nat Med. 2008;14:931–938. doi: 10.1038/nm.1857. [DOI] [PMC free article] [PubMed] [Google Scholar]
- Fifkova E, Markham JA, Delay RJ. Calcium in the spine apparatus of dendritic spines in the dentate molecular layer. Brain Res. 1983;266:163–168. doi: 10.1016/0006-8993(83)91322-7. [DOI] [PubMed] [Google Scholar]
- Fischer M, Kaech S, Knutti D, Matus A. Rapid actin-based plasticity in dendritic spines. Neuron. 1998;20:847–854. doi: 10.1016/s0896-6273(00)80467-5. [DOI] [PubMed] [Google Scholar]
- Fischer M, Kaech S, Wagner U, Brinkhaus H, Matus A. Glutamate receptors regulate actin-based plasticity in dendritic spines. Nat Neurosci. 2000;3:887–894. doi: 10.1038/78791. [DOI] [PubMed] [Google Scholar]
- Fitzjohn SM, Collingridge GL. Calcium stores and synaptic plasticity. Cell Calcium. 2002;32:405–411. doi: 10.1016/s0143416002001999. [DOI] [PubMed] [Google Scholar]
- Fukazawa Y, Saitoh Y, Ozawa F, Ohta Y, Mizuno K, Inokuchi K. Hippocampal LTP is accompanied by enhanced F-actin content within the dendritic spine that is essential for late LTP maintenance in vivo . Neuron. 2003;38:447–460. doi: 10.1016/s0896-6273(03)00206-x. [DOI] [PubMed] [Google Scholar]
- Goldin M, Segal M, Avignone E. Functional plasticity triggers formation and pruning of dendritic spines in cultured hippocampal networks. J Neurosci. 2001;21:186–193. doi: 10.1523/JNEUROSCI.21-01-00186.2001. [DOI] [PMC free article] [PubMed] [Google Scholar]
- Hayashi Y, Shi SH, Esteban JA, Piccini A, Poncer JC, Maloniw R. Driving AMPA receptors into synapses by LTP and CamKII: requirement of GluR1 and PD domain interaction. Science. 2000;287:2262–2267. doi: 10.1126/science.287.5461.2262. [DOI] [PubMed] [Google Scholar]
- Ivenshitz M, Segal M. Simultaneous NMDA-dependent long-term potentiation of EPSCs and long-term depression of IPSCs in cultured rat hippocampal neurons. J Neurosci. 2006;26:1199–1210. doi: 10.1523/JNEUROSCI.2964-05.2006. [DOI] [PMC free article] [PubMed] [Google Scholar]
- Jedlicka P, Schwarzacher SW, Winkels R, Kienzler F, Frotscher M, Bramham CR, Schultz C, Bas Orth C, Deller T. Impairment of in vivo theta-burst long-term potentiation and network excitability in the dentate gyrus of synaptopodin-deficient mice lacking the spine apparatus and the cisternal organelle. Hippocampus. 2008a doi: 10.1002/hipo.20489. [DOI] [PubMed] [Google Scholar]
- Jedlicka P, Vlachos A, Schwarzacher SW, Deller T. A role for the spine apparatus in LTP and spatial learning. Behav Brain Res. 2008b;192:12–19. doi: 10.1016/j.bbr.2008.02.033. [DOI] [PubMed] [Google Scholar]
- Korkotian E, Segal M. Fast confocal imaging of calcium released from stores in dendritic spines. Eur J Neurosci. 1998;10:2076–2084. doi: 10.1046/j.1460-9568.1998.00219.x. [DOI] [PubMed] [Google Scholar]
- Korkotian E, Segal M. Release of calcium from stores alters the morphology of dendritic spines in cultured hippocampal neurons. Proc Natl Acad Sci U S A. 1999;96:12068–12072. doi: 10.1073/pnas.96.21.12068. [DOI] [PMC free article] [PubMed] [Google Scholar]
- Korkotian E, Segal M. Spike-associated fast contraction of dendritic spines in cultured hippocampal neurons. Neuron. 2001;30:751–758. doi: 10.1016/s0896-6273(01)00314-2. [DOI] [PubMed] [Google Scholar]
- Korkotian E, Segal M. Morphological constraints on calcium dependent glutamate receptor trafficking into individual dendritic spine. Cell Calcium. 2007;42:41–57. doi: 10.1016/j.ceca.2006.11.006. [DOI] [PubMed] [Google Scholar]
- Kovalchuk Y, Eilers J, Lisman J, Konnerth A. NMDA receptor-mediated subthreshold Ca(2+) signals in spines of hippocampal neurons. J Neurosci. 2000;20:1791–1799. doi: 10.1523/JNEUROSCI.20-05-01791.2000. [DOI] [PMC free article] [PubMed] [Google Scholar]
- Kremerskothen J, Plaas C, Kindler S, Frotscher M, Barnekow A. Synaptopodin, a molecule involved in the formation of the dendritic spine apparatus, is a dual actin/alpha-actinin binding protein. J Neurochem. 2005;92:597–606. doi: 10.1111/j.1471-4159.2004.02888.x. [DOI] [PubMed] [Google Scholar]
- Malinow R, Malenka RC. AMPA receptor trafficking and synaptic plasticity. Annu Rev Neurosci. 2002;25:103–126. doi: 10.1146/annurev.neuro.25.112701.142758. [DOI] [PubMed] [Google Scholar]
- Matsuzaki M, Ellis-Davies GC, Nemoto T, Miyashita Y, Iino M, Kasai H. Dendritic spine geometry is critical for AMPA receptor expression in hippocampal CA1 pyramidal neurons. Nat Neurosci. 2001;4:1086–1092. doi: 10.1038/nn736. [DOI] [PMC free article] [PubMed] [Google Scholar]
- Matsuzaki M, Honkura N, Ellis-Davies GC, Kasai H. Structural basis of long-term potentiation in single dendritic spines. Nature. 2004;429:761–766. doi: 10.1038/nature02617. [DOI] [PMC free article] [PubMed] [Google Scholar]
- Meldolesi J. Rapidly exchanging Ca2+ stores in neurons: molecular, structural and functional properties. Prog Neurobiol. 2001;65:309–338. doi: 10.1016/s0301-0082(01)00004-1. [DOI] [PubMed] [Google Scholar]
- Mundel P, Heid HW, Mundel TM, Kruger M, Reiser J, Kriz W. Synaptopodin: an actin-associated protein in telencephalic dendrites and renal podocytes. J Cell Biol. 1997;139:193–204. doi: 10.1083/jcb.139.1.193. [DOI] [PMC free article] [PubMed] [Google Scholar]
- Okubo-Suzuki R, Okada D, Sekiguchi M, Inokuchi K. Synaptopodin maintains the neural activity-dependent enlargement of dendritic spines in hippocampal neurons. Mol Cell Neurosci. 2008;38:266–276. doi: 10.1016/j.mcn.2008.03.001. [DOI] [PubMed] [Google Scholar]
- Papa M, Bundman MC, Greenberger V, Segal M. Morphological analysis of dendritic spine development in primary hippocampal neurons. J Neurosci. 1995;15:1–11. doi: 10.1523/JNEUROSCI.15-01-00001.1995. [DOI] [PMC free article] [PubMed] [Google Scholar]
- Pierce JP, van Leyen K, McCarthy JB. Translocation machinery for synthesis of integral membrane and secretory proteins in dendritic spines. Nat Neurosci. 2000;3:311–313. doi: 10.1038/73868. [DOI] [PubMed] [Google Scholar]
- Pilpel Y, Segal M. Activation of PKC induces rapid morphological plasticity in dendrites of hippocampal neurons via Rac and Rho-dependent mechanisms Eur. J Neurosci. 2004;19:3151–3164. doi: 10.1111/j.0953-816X.2004.03380.x. [DOI] [PubMed] [Google Scholar]
- Richards DA, de Paola V, Caroni P, Gahwiler BH, McKinney RA. AMPA receptor activation regulates the diffusion of a membrane marker in parallel with dendritic spine motility in the mouse hippocampus. J Physiol. 2004;558:503–512. doi: 10.1113/jphysiol.2004.062091. [DOI] [PMC free article] [PubMed] [Google Scholar]
- Roth SU, Sommer C, Mundel P, Kiessling M. Expression of synaptopodin, an actin-associated protein, in the rat hippocampus after limbic epilepsy. Brain Pathol. 2001;11:169–181. doi: 10.1111/j.1750-3639.2001.tb00389.x. [DOI] [PMC free article] [PubMed] [Google Scholar]
- Segal M. Dendritic spines and long term plasticity. Nat Rev Neurosci. 2005;6:277–284. doi: 10.1038/nrn1649. [DOI] [PubMed] [Google Scholar]
- Sharp AH, McPherson PS, Dawson TM, Aoki C, Campbell KP, Snyder SH. Differential immunohistochemical localization of inositol 1,4, 5-trisphosphateand ryanodine-sensitive Ca2+ release channels in rat brain. J Neurosci. 1993;13:3051–3063. doi: 10.1523/JNEUROSCI.13-07-03051.1993. [DOI] [PMC free article] [PubMed] [Google Scholar]
- Shi S, Hayashi Y, Esteban JA, Malinow R. Subunit-specific rules governing AMPA receptor trafficking to synapses in hippocampal pyramidal neurons. Cell. 2001;105:331–343. doi: 10.1016/s0092-8674(01)00321-x. [DOI] [PubMed] [Google Scholar]
- Shoshan-Barmatz V, Zakar M, Shmuelivich F, Nahon E, Vardi N. Retina expresses a novel variant of the ryanodine receptor. Eur J Neurosci. 2007;26:3113–3125. doi: 10.1111/j.1460-9568.2007.05931.x. [DOI] [PubMed] [Google Scholar]
- Spacek J. Three-dimensional analysis of dendritic spines. II. Spine apparatus and other cytoplasmic components. Anat Embryol (Berl) 1985;171:235–243. doi: 10.1007/BF00341418. [DOI] [PubMed] [Google Scholar]
- Spacek J, Harris KM. Three-dimensional organization of smooth endoplasmic reticulum in hippocampal CA1 dendrites and dendritic spines of the immature and mature rat. J Neurosci. 1997;17:190–203. doi: 10.1523/JNEUROSCI.17-01-00190.1997. [DOI] [PMC free article] [PubMed] [Google Scholar]
- Vlachos A, Maggio N, Segal M. Lack of correlation between synaptopodin expression and the ability to induce LTP in the rat dorsal and ventral hippocampus. Hippocampus. 2008;18:1–4. doi: 10.1002/hipo.20373. [DOI] [PubMed] [Google Scholar]
- Wang Z, Edwards JG, Riley N, Provance DW, Karcher R, Li XD, Davison IG, Ikebe M, Mercer JA, Kauer JA, Ehlers MD. Myosin Vb mobilizes recycling endosomes and AMPA receptors for postsynaptic plasticity. Cell. 2008;135:535–548. doi: 10.1016/j.cell.2008.09.057. [DOI] [PMC free article] [PubMed] [Google Scholar]
- Wyszynski M, Lin J, Rao A, Nigh E, Beggs AH, Craig AM, Sheng M. Competitive binding of alpha-actinin and calmodulin to the NMDA receptor. Nature. 1997;385:439–442. doi: 10.1038/385439a0. [DOI] [PubMed] [Google Scholar]
- Wyszynski M, Kharazia V, Shanghvi R, Rao A, Beggs AH, Craig AM, Weinberg R, Sheng M. Differential regional expression and ultrasctructural localization of alpha-actinin-2, a putative NMDA receptor-anchoring protein, in rat brain. J Neurosci. 1998;18:1383–1392. doi: 10.1523/JNEUROSCI.18-04-01383.1998. [DOI] [PMC free article] [PubMed] [Google Scholar]
- Yamazaki M, Matsuo R, Fukazawa Y, Ozawa F, Inokuchi K. Regulated expression of an actin-associated protein, synaptopodin, during long-term potentiation. J Neurochem. 2001;79:192–199. doi: 10.1046/j.1471-4159.2001.00552.x. [DOI] [PubMed] [Google Scholar]