

Abstract
Astrocytes in different brain regions display variable functional properties. In the hippocampus, astrocytes predominantly express time- and voltage-independent currents, but the underlying ion channels are not well defined. This ignorance is partly attributable to abundant intercellular coupling of these cells through gap junctions, impeding quantitative analyses of intrinsic membrane properties. Moreover, distinct types of cells with astroglial properties coexist in a given brain area, a finding that confused previous analyses. In the present study, we investigated expression of inwardly rectifying (Kir) and two-pore-domain (K2P) K+ channels in astrocytes, which are thought to be instrumental in the regulation of K+ homeostasis. Freshly isolated astrocytes were used to improve space-clamp conditions and allow for quantitative assessment of functional parameters. Patch-clamp recordings were combined with immunocytochemistry, Western blot analysis, and semiquantitative transcript analysis. Comparative measurements were performed in different CA1 subregions of astrocyte-targeted transgenic mice. While confirming weak Ba2+ sensitivity in situ, our data demonstrate that in freshly isolated astrocytes, the main proportion of membrane currents is sensitive to micromolar Ba2+ concentrations. Upregulation of Kir4.1 transcripts and protein during the first 10 postnatal days was accompanied by a fourfold increase in astrocyte inward current density. Hippocampal astrocytes from Kir4.1−/− mice lacked Ba2+-sensitive currents. In addition, we report functional expression of K2P channels of the TREK subfamily (TREK1, TREK2), which mediate astroglial outward currents. Together, our findings demonstrate that Kir4.1 constitutes the pivotal K+ channel subunit and that superposition of currents through Kir4.1 and TREK channels underlies the “passive” current pattern of hippocampal astrocytes.
Introduction
Astrocytes play a key role in the uptake of K+ and neurotransmitters, thereby modulating synaptic and neurovascular signaling (Volterra and Meldolesi, 2005; Haydon and Carmignoto, 2006). Inwardly rectifying K+ (Kir) channels aid redistribution of K+ across glial membranes (Walz, 2000; Kofuji and Newman, 2004). In the CNS, Kir4.1 is specifically localized to astrocytes, oligodendrocytes, and retinal Müller cells (Takumi et al., 1995; Ishii et al., 1997; Kofuji et al., 2000; Poopalasundaram et al., 2000; Li et al., 2001; Neusch et al., 2001; Ishii et al., 2003; Olsen et al., 2006). Immunohistochemistry suggested preferred location of Kir4.1 on astroglial processes ensheathing synapses and blood vessels (Higashi et al., 2001). In astrocytes and Müller cells, Kir4.1 may assemble with Kir5.1, which confers pH sensitivity to the channels (Pessia et al., 1996; Tanemoto et al., 2000; Casamassima et al., 2003; Hibino et al., 2004).
Increasing evidence suggests that astrocytes comprise a heterogeneous cell population, with functional properties varying between brain regions. In the hippocampus, distinct types of cells with astroglial properties coexist. Hippocampal astrocytes (also termed GluT cells or passive cells) possess prominent time- and voltage-independent currents and, in contrast to cortical astrocytes (Lalo et al., 2006, 2008) or Bergmann glia (Clark and Barbour, 1997), display glutamate transporters but no ionotropic glutamate and ATP receptors (Steinhäuser et al., 1994; Zhou and Kimelberg, 2001; Matthias et al., 2003; Jabs et al., 2007). Astrocytes in the hippocampus are characterized by abundant coupling through gap junctions (Wallraff et al., 2004). Recent studies suggested that Kir4.1 is the major subunit mediating resting currents in Müller cells (Kofuji et al., 2000) and astrocytes in the spinal cord (Olsen et al., 2006) and brainstem (Neusch et al., 2005). However, contrary findings have been reported from the hippocampus. Here, the low sensitivity of astrocytic currents to Ba2+ and lacking inward rectification of the Ba2+-sensitive component led to the idea that K+ subunits other than Kir4.1 (e.g., two-pore-domain channels) (Päsler et al., 2007) substantially add to the cells' almost linear I/V relationships commonly observed in whole-cell recordings in situ (Wallraff et al., 2004; Djukic et al., 2007). To further investigate this issue, we addressed the developmental regulation of Kir4.1 and expression of K2P channels in murine hippocampal astrocytes by combining immunohistochemistry, Western blot analysis, single-cell reverse transcription (RT)-PCR, and patch-clamp analysis. We used transgenic mice possessing fluorescence labeling of astrocytes without and with Kir4.1 deletion. To improve recording conditions and allow for quantitative evaluation of membrane properties, freshly isolated astrocytes were used.
Materials and Methods
Tissue preparation for electrophysiology.
Mice [transgenic human glial fibrillary acidic protein/enhanced green fluorescent protein (Tg(hGFAP/EGFP)) mice (Nolte et al., 2001); Kir4.1−/− mice (Kofuji et al., 2000) interbred with Tg(hGFAP/EGFP) mice; C57BL6J mice] of postnatal day 1 (P1) to P60 were anesthetized and killed by decapitation; their brains were dissected and washed, and the hemispheres were cut into 200-μm-thick slices in frontal orientation using a Vibratome (VT 1000S; Leica Microsystems). Slice preparation was performed at 6°C in Ca2+-free HEPES-buffered external solution. Subsequently, slices were stored for at least 30 min in artificial CSF gassed by carbogen at room temperature (pH 7.4). Acutely isolated cells were obtained from slices after protease treatment as described previously (Matthias et al., 2003). Although suspended astrocytes retain the majority of their processes, it is likely that some distant tips are shorn off during isolation.
Recording setup and Ba2+ application.
Recordings were obtained at P9–P12 (designated as P9) if not stated otherwise. Membrane currents were measured with the patch-clamp technique in the whole-cell configuration in situ as well as in freshly isolated cells. Current signals were amplified (EPC-7 or EPC-9 amplifier; HEKA), filtered at 3 and 10 kHz, and sampled at 10 and 100 kHz by an interface connected to a computer system, which also served as a stimulus generator. The resistance of the patch pipettes was 4 MΩ (borosilicate glass; Malsfeld). Capacitance and series resistance compensation (40–50%) were used to improve voltage-clamp control. Input resistance was determined by stepping the membrane from −70 to −60 mV. In slices, Ba2+ was added to the bath perfusion. K+ channel blockers and modulators were applied to freshly isolated cells by transferring the cells with a tube electrode to different solutions (Seifert and Steinhäuser, 1995). The bath solution contained (in mm) 150 NaCl, 5 KCl, 2 MgCl2, 2 CaCl2, 10 HEPES, and 10 glucose, pH 7.4. The pipette solution was composed of (in mm) 130 KCl, 0.5 CaCl2, 2 MgCl2, 5 BAPTA, 10 HEPES, and 3 Na2-ATP, pH 7.25. Recordings were obtained at room temperature. All reagents were purchased from Sigma unless otherwise stated. Arachidonic acid (AA) was suspended in DMSO (20 mm), aliquoted, and added to the bath solution immediately before use (final concentration of DMSO was 0.05%)
Immunohistochemistry.
Mice were anesthetized with xylazine and ketamine and perfused intracardially with 4% paraformaldehyde (PFA)/PBS. Dissected brains were fixed overnight in 4% PFA/PBS at 4°C and cryoprotected in 30% sucrose. The brains were sliced into 50-μm-thick coronal sections. Endogenous peroxidase activity was quenched with 3% H2O2/PBS (1 h at room temperature), and slices were then incubated in 5% normal goat serum (NGS)/PBS for 1 h. The primary antibody (rabbit anti-Kir4.1; 1:200; Alomone Labs) was applied together with 0.3% Triton X-100 overnight at 4°C. After wash, horseradish peroxidase-conjugated goat anti-rabbit IgG was applied for 30 min (room temperature; 1:100 in 5% NGS/PBS). After wash, slices were incubated in Alexa Fluor 488-conjugated tyramide, diluted 1:100 in H2O2/amplification buffer according to the supplier's instruction (10 min at room temperature; Invitrogen). NeuroTrace 640/660 Nissl staining was performed (1:10 in PBS; Invitrogen) for 5 min (room temperature) according to the manufacturer's protocol. After wash in PBS, Vectashield mounting medium was applied, and slices were covered with coverslips.
For immunofluorescence double labeling, subsequent to fluorescence-conjugated tyramide, the second primary antibody was applied (mouse anti-GFAP; 1:100 in PBS; 3 h at room temperature). After wash, Alexa Fluor 594-conjugated goat anti-mouse antibody (1:200; Invitrogen) was applied (3 h at room temperature). After wash, the slices were mounted and covered. Multilabel immunofluorescence was visualized with confocal fluorescence microscopy (Fluoview FV1000; Olympus) at 10 and 60× magnifications.
Western blot.
Whole hippocampi of mice at different ages (C57BL/6J: P3, P10, P21, P42, P60; Kir4.1−/−: P10) were homogenized in dissection buffer containing (in mm) 10 Tris-Cl, 250 sucrose, 2 Pefabloc (Roche). Homogenates were centrifuged at 11,000 × g for 10 min at 4°C to harvest membrane fractions. The pellet was resuspended in 2 vol of radioimmunoprecipitation assay buffer containing 50 mm Tris, 150 mm KCl, 1% Nonidet P-40, 1% sodium deoxycholate, 0.1% SDS, 1 mm EDTA, and 1 mm Pefabloc to dissolve membrane proteins. Undissolved components were removed by another centrifugation step at 1000 × g (2 min, 4°C). Protein concentration of the supernatant was determined by the copper/bicinchonic acid test using bovine serum albumin as a standard (Sigma). Equal amounts of protein were heated for 10 min at 45°C in SDS buffer containing 10 mm β-mercaptoethanol. Proteins were separated in 10% SDS-PAGE and blotted on polyvinylidene fluoride membranes. Blotted proteins were detected by means of immunolabeling using rabbit anti-Kir4.1 (1:400; Sigma) and goat anti-β-actin antibodies (1:250; Abcam), respectively (1 h at room temperature). Secondary antibodies were horseradish peroxidase-conjugated IgGs (1:5000; 20 min at room temperature; Dianova). Western blots were detected with a chemiluminescence assay (ECL reagent; GE Healthcare). After development of Roentgen films, protein bands were quantified with a CCD camera using AlphaEase software (Alpha Innotech).
Single-cell RT-PCR.
Single-cell transcript analysis was performed as reported previously (Seifert et al., 1997; Matthias et al., 2003). Briefly, after recording (isolated cells), the cell at the tip of the pipette was transferred to a separate dish to be washed with fresh bath solution. The cell was aspirated into the recording pipette under microscopic control, and the cell content and ∼3 μl of the pipette solution were expelled into a reaction tube containing 3 μl of DEPC-treated water. The reaction tube was frozen and stored at −80°C.
To prevent amplification of genomic DNA, RT-PCR was preceded by DNase treatment. Therefore, DNase mastermix containing first-strand buffer (Invitrogen), dithiothreitol (DTT; 10 mm), dNTPs (4× 250 μm; Applied Biosystems), RNasin (20 U; Promega), random hexamer primers (50 μm; Roche), and RNase-free DNaseI (10 U; Roche) were added to the frozen cell content in the reaction tube. The reaction mix (∼10 μl) was covered with freshly aliquoted paraffin oil and incubated at 37°C (30 min), and DNaseI was heat inactivated at 95°C (5 min). Subsequently, reverse transcriptase (SuperscriptIII; 100 U; Invitrogen) and RNase inhibitor (20 U) were added, and the RT reaction was started (37°C, 1 h).
A multiplex two-round single-cell PCR was performed with primers for Kir2.x, Kir4.1, and Kir5.1 or for Kir4.1 together with K2P channel primers (Table 1) (Schröder et al., 2002). The first PCR was performed after adding PCR buffer, MgCl2 (2.5 mm), and primers (200 nm each) to the RT product (final volume, 50 μl). After denaturation, 5 U of Taq polymerase (Invitrogen) was added. Forty-five cycles were performed (denaturation at 94°C, 25 s; annealing at 49°C, 2 min for the first five cycles and 45 s for the remaining cycles; extension at 72°C, 25 s; final elongation at 72°C, 7 min). An aliquot (3 μl) of the PCR product was used as a template for the second PCR (35 cycles; annealing at 54°C, 2 min for the first 5 cycles and 45 s for the remaining cycles) using nested primers (Table 1). The conditions were the same as described for the first round, but dNTPs (4× 50 μm) and Platinum Taq polymerase (2.5 U; Invitrogen) were added. Products were identified with gel electrophoresis using a molecular weight marker (ΦX174 HincII digest; Eurogentec).
Table 1.
Primers for single-cell RT-PCR and sqRT-PCR
| Gene | Sequence | Position | Product length | GenBank accession number |
|---|---|---|---|---|
| Kir4.1 | se 5′-TATCAGAGCAGCCACTTCACCTTC | −32 | 570 bp | NM_020269 |
| as 5′-GGATCGTCTCGGCCCTCTTCTTAG | 515 | |||
| Kir4.1 (nested) | se 5′-TTCACCTTCGAGCCAAGATGACG | −11 | 338 bp | |
| as 5′-AGGCGTGTGGTTGGCAGGAG | 302 | |||
| Kir5.1 | se 5′-TGCAGATACTTACAGCCGACCAT | −136 | 407 bp | NM_010604 |
| as 5′-GGAGCCAAATATCAACCAGGAGA | 248 | |||
| Kir5.1 (nested) | se 5′-CAGCCGACCATTGGACTGAG | −124 | 344 bp | |
| as 5′-ACATATGGCGCCACTTGGTATC | 199 | |||
| sq Kir4.1 | se 5′-TTTATCAGAGCAGCCACTT | −34 | 72 bp | NM_020269 |
| as 5′-GTCGTCTGACTGTAATAG | 21 | |||
| sq Kir4.1 (probe) | se FAM-5′-CCTTCGAGCCAAGATGACGTCGGTCGCTA-TAMRA | −13 | ||
| TWIK1 | se 5′-GGCATCCCGTTCACCCTCCTCT | 421 | 471 bp | NM_008430 |
| as 5′-GTCGTGCTCCATGATGTGAACCAG | 868 | |||
| TWIK1 (nested) | se 5′-AGCCGCCGTGTTCTCTGT | 597 | 272 bp | |
| as 5′-GGTCTTCGTCCTTGTCTTTCTTC | 846 | |||
| TREK1 | se 5′-CAGCAAATAGTGGCAGCAATAAAC | 310 | 373 bp | NM_010607 |
| as 5′-CCGCAGGGAGAGCCACAAAGAGGA | 659 | |||
| TREK1 (nested) | se 5′-TCACTGGGACCTCGGAAGC | 375 | 282 bp | |
| as 5′-CAGCCAAACAGGATGAAGATGA | 635 | |||
| TREK2 | se 5′-ATCTTTGGGATCCCGCTTTTT | 556 | 166 bp | NM_029911 |
| as 5′-AGCCAGCCAAGATGAAGAGAATC | 699 | |||
| TREK2 (nested) | se 5′-GATCCCGCTTTTTGGTTTCT | 564 | 126 bp | |
| as 5′-ACCCGGATCTTGGTCTGG | 672 | |||
| TRAAK | se 5′-CTCGGGGACCATCATCACTACCAT | 291 | 256 bp | NM_008431 |
| as 5′-CAGGCAGCCGATCAGCAGGAAGA | 524 | |||
| TRAAK (nested) | se 5′-TGCCGGGCGTCTCTTTTGTATCTT | 345 | 159 bp | |
| as 5′-ACCAGCCCCGGTGGCACAT | 485 |
se, Sense primer; as, antisense primer; sq, primers and probe for sqRT-PCR analysis. Position 1 is the first nucleotide of the initiation codon. The Kir4.1 TaqMan probe was labeled with FAM (6-carboxyfluorescein; 5′ end) and TAMRA (6-carboxytetramethylrhodamine; 3′ end). All Kir and K2P sense and antisense primers are located on different exons, respectively.
As a positive control, RT-PCR for single cells and for total RNA from mouse brain were run in parallel. To test for the efficiency of DNA degradation, PCR was performed without SuperscriptIII reverse transcriptase. Negative controls were performed using distilled water or bath solution for RT-PCR.
Cell harvesting and preparation of brain tissue for semiquantitative RT-PCR.
Harvesting of cellular RNA from brain slices was performed as reported previously (Schröder et al., 2002). Briefly, the cell content was harvested by applying negative pressure to the pipette while retaining the gigaohm seal resistance between pipette tip and membrane. The flow of the cytoplasm into the pipette was controlled via a CCD camera (C-5405; Hamamatsu Photonics). The cell on top of the pipette was lifted above the slice and completely harvested in the flow of the bath solution under visual control. Only single cells without any adherent tissue debris were selected for analysis. Four to five cells were pooled in the same tube (see above; final volume, ∼10 μl) for semiquantitative RT-PCR (sqRT-PCR) analysis. Oligo(dT)25-linked Dynabeads (Dynal) were used to isolate mRNA from cytoplasmic content. Lysis buffer (20 μl) and Dynabeads suspended in lysis buffer (10 μl) were added to the reaction tube. After wash (50 μl), the beads with adherent mRNA were suspended in water (20 μl), frozen, and stored at −80°C until sqRT-PCR.
Tissue samples were isolated from 200-μm-thick coronal brain slices. By using a stereo microscope, the CA1 region was isolated with a small scalpel, by removing strata pyramidale and oriens. For regional comparison, in some cases the radiatum of the CA1 region was separated from the lacunosum-moleculare; otherwise, combined radiatum plus lacunosum-moleculare samples underwent sqRT-PCR analysis. By P3, the entire CA1 region was used because separation of pyramidal layer and oriens was not possible. At each developmental stage, at least three mice from different litters were used, and at least three sections were investigated in each mouse. Total RNA was isolated from tissue samples with Trizol (Invitrogen) and dissolved in 10 μl of DEPC-treated water. Genomic DNA was removed by DNase treatment in a mixture containing PCR buffer, 2.5 mm MgCl2, 10 mm DTT (all from Invitrogen), 20 U of DNaseI (Roche), and 40 U of RNase inhibitor (final volume, 20 μl; incubation at 37°C for 30 min; Promega). Subsequently, mRNA was isolated using oligo(dT)25-linked Dynabeads (Dynal), and beads with the adherent mRNA were suspended in DEPC-treated water (20 μl), frozen, and stored at −80°C.
sqRT-PCR.
RT-PCR was performed as a single enzyme procedure using recombinant Thermus thermophilus (rTth) DNA polymerase (TaqMan EZ RT-PCR kit; Applied Biosystems). The reaction volume was 12.5 μl. The reaction mixture contained TaqMan EZ buffer, 3× 300 μm dNTPs (dATP, dCTP, dGTP), 600 μm dUTP, 3 mm Mn(OAc)2, 1.25 U of rTth DNA polymerase, and 0.125 U of uracil-N-glycosylase. For Kir4.1 sqRT-PCR analysis, 100 nm fluorogenic TaqMan probe and 300 nm of each primer was added (Table 1). For β-actin detection and quantification, a TaqMan probe/primer mix was used (Applied Biosystems). For sqRT-PCR analysis of cell pools, aliquots of 4 μl of mRNA were added to each tube. Investigating developmental changes of Kir4.1 expression with mRNA from tissue samples, 0.5 μl of mRNA was added. RT-PCRs for Kir4.1 and β-actin were run in parallel tubes for each sample, respectively. Negative controls (water) and positive controls (mRNA from mouse brain) were also performed in each run. Samples were incubated at 50°C (2 min), and first-strand synthesis was performed at 60°C (20 min). After denaturation (95°C, 5 min), 50 or 60 cycles were performed (denaturation at 94°C, 15 s; primer annealing and extension at 59°C, 60 s). Fluorescence intensity was read out during each annealing/extension step.
Data analysis.
Total membrane conductance was determined according to the following equation:
where I−130 mV (I+20 mV) is the membrane current at −130 and +20 mV, respectively. VR is the resting membrane potential.
The rectification index (RI) of Ba2+- and quinine-sensitive currents was determined by comparing the chord conductance of blocker-sensitive currents at −40 and −130 mV (5 mm [Ko]+; Eq. 2a) or +20 and −70 mV (50 mm [K+]o; Eq. 2b) according to the following:
where I is the amplitude of Ba2+-sensitive currents at +20, −40, −70, and −130 mV, respectively, and Erev its extrapolated reversal potential.
The KD for Ba2+ was determined according to the following equation:
where g−130 mV,Ba is the total membrane conductance at −130 mV at the respective Ba2+ concentration [Ba2+], g−130 mV,control is the membrane conductance before Ba2+ application, KD is the concentration at half-maximal conductance inhibition at −130 mV, and nH is the Hill coefficient.
The Kir4.1/β-actin gene expression ratio was determined by comparing CT values of the target gene with those of the reference gene, β-actin. The relative quantification of different genes was determined according to the following equation:
 |
where Y is the amount of the PCR product, X is the input copy number, E is the efficiency of amplification, and CT is the cycle number at threshold. According to Equation 4, the fluorescence intensity, Rn, which is proportional to Y, was determined at each cycle. By quantification of Kir4.1, gene expression against that of β-actin CT was determined for each gene at the same Rn, and the difference in input copy number was estimated according to Equation 5:
The amplification efficiency was 1.93 for Kir4.1 and 1.97 for β-actin (supplemental Fig. 1, available at www.jneurosci.org as supplemental material).
Results
Ba2+-sensitive inward currents in hippocampal astrocytes in situ
GluT cells in the hippocampus of Tg(hGFAP/EGFP) mice were identified according to their morphological and functional properties as reported previously (Matthias et al., 2003; Wallraff et al., 2004; Jabs et al., 2005). These cells resemble the “passive cells” first described in the hippocampus of wild-type mice (Steinhäuser et al., 1992, 1994) and can be considered bona fide gray matter astrocytes.
Previous work has revealed that currents through gap junctions add to the passive membrane conductance of astrocytes (Blomstrand et al., 2004). Actually, a 30% decline of astrocytic membrane conductance was observed when the recordings were obtained at low pH or in bath solutions containing low bicarbonate concentrations (i.e., conditions known to inhibit currents through gap junctions) (Wallraff et al., 2006). After preincubation (30 min) of slices in a solution supplemented with 100 μm carbenoxolone (Cbx), a blocker of gap junctions and connexin hemichannels, bath application of Ba2+ (100 μm) reduced the membrane conductance by 54.0 ± 13.6% (−130 mV; n = 6), increased input resistance, and shifted VR from −71.9 ± 1.6 to −61.0 ± 4.1 mV compared with the Cbx control (Fig. 1; Table 2). The I/V relationship of Ba2+-sensitive currents displayed weak inward rectification (RI, 0.66 ± 0.09) (Fig. 1A2,B), with a reversal potential Erev = −84.1 ± 5.4 mV, which was close to EK (−82.3 mV).
Figure 1.

Block of membrane currents of astrocytes in situ by Ba2+ in the presence of Cbx (100 μm). A1, Membrane currents were elicited in the whole-cell mode by depolarization and hyperpolarization between −160 and +20 mV (1; 10 mV increments; holding potential, −70 mV; dashed line, zero current). After adding 100 μm Ba2+ to the bath, currents were reduced (2). A2, Ba2+-sensitive currents were determined by subtracting respective current families (1–2). Ba2+-sensitive currents (inset) reversed at −88.5 mV. B, The averaged I/V relationship of Ba2+ (100 μm)-sensitive currents obtained in the presence of Cbx of six astrocytes (mean ± SD). In each cell, data were normalized to maximum inward currents.
Table 2.
Resting membrane potential and input resistance of astrocytes in situ under control conditions and after adding Ba2+
| Age | Resting potential (mV) | Input resistance (MΩ) |
|---|---|---|
| P9, control | −71.9 ± 3.4 (n = 10) | 38.7 ± 17.0 (n = 10) |
| P9, 100 μm Cbx | −71.9 ± 1.6 (n = 6) | 44.2 ± 17.5 (n = 6) |
| P9, 100 μm Cbx, 100 μm BaCl2 | −61.0 ± 4.1a (n = 6) | 93.3 ± 49.8a (n = 6) |
| P9, Kir4.1−/− | −39.1 ± 9.8b (n = 9) | 143.0 ± 82.4b (n = 9) |
| P9, Kir4.1−/−, 100 μm BaCl2 | −38.3 ± 10.1 (n = 9) | 140.5 ± 54.3 (n = 9) |
Data were obtained from hGFAF/EGFP mice and from Kir4.1−/− mice crossed with hGFAP/EGFP mice. Cell numbers are given in parentheses.
aIn the presence of Cbx (100 μm; 30 min preincubation), Ba2+ significantly affected resting potential and input resistance.
bIn addition, resting potential and input resistance of astrocytes in control versus Kir4.1−/− mice differed significantly.
Hence, a significant proportion of the voltage- and time-independent currents of astrocytes apparently were insensitive to submillimolar Ba2+ concentration. However, membrane current analysis in astrocytes in situ is not only compromised by gap junction coupling but also by the limited special and temporal voltage-clamp control caused by the extensive branching of these cells. It has also to be considered that addition of Ba2+ to slices increases the extracellular K+ concentration (Heinemann et al., 2000), which disturbs quantification of astrocyte K+ currents in situ. Therefore, to improve recording conditions and address the question to what extent currents through Kir channels contribute to the intrinsic membrane conductance of astrocytes, further investigation was performed with freshly isolated cells.
Properties of inwardly rectifying currents in freshly isolated hippocampal astrocytes
After acute isolation, brightly fluorescent astrocytes with extended branching were selected for recording. In addition, astrocytic identity was confirmed by evoking glutamate transporter currents (data not shown) (Matthias et al., 2003). Ba2+ profoundly reduced both inward and outward currents in these cells (Fig. 2A,B) and caused a positive shift of VR (Table 3). At −130 mV, membrane conductance declined by 67.3 ± 12.9% (n = 9), 75.5 ± 12.8% (n = 9), and 78.2 ± 12.4% (n = 8) at 10 μm, 100 μm, and 1 mm Ba2+, respectively (Fig. 2C). Currents blocked by 100 μm Ba2+ reversed at −75.4 ± 6.5 mV (n = 9) (i.e., close to EK) (Fig. 2D). The corresponding I/V curves normalized to maximal inward currents indicated intermediate rectification (RI, 0.58 ± 0.13). To determine the potency of Ba2+ at blocking membrane currents in astrocytes, the membrane conductance was determined at −130 mV in solutions with increasing Ba2+ concentrations (10 nm to 100 μm). Half-maximal inhibition of the conductance occurred at a Ba2+ concentration of 7.1 ± 3.2 μm (n = 7) (Fig. 2E). The Hill coefficient amounted to nH = 0.7 ± 0.1.
Figure 2.

Ba2+ sensitivity of freshly isolated astrocytes. A, Membrane currents were elicited as described in Figure 1. The bottom panel shows the responses after washout of Ba2+. B1–B3, Current responses after increasing concentrations of Ba2+. Ba2+-sensitive currents (bottom) were determined by subtracting current traces obtained in Ba2+ from those before Ba2+ application at respective voltages. C, Membrane conductance in control and Ba2+-containing solution was determined at −130 mV according to Equation 1, and Ba2+-sensitive fractions were determined at different concentrations of the blocker. D, Mean I/V relationships of blocker-sensitive currents in 0.01 mm Ba2+ (diamonds; n = 9), 0.1 mm Ba2+ (circles; n = 9), and 1 mm Ba2+ (triangles; n = 8). In each cell, data were normalized to maximum inward current. E, Mean dose–inhibition curve of membrane conductance (n = 7). Half-maximal inhibition occurred at a Ba2+ concentration of 7.1 ± 3.2 μm, with a Hill coefficient of nH = 0.7 ± 0.1. Data in C–E are given as mean ± SD; cell numbers are in parentheses.
Table 3.
Cell capacitance, resting membrane potential, and input resistance of isolated astrocytes under control conditions and after addition of BaCl2
| Age | Cell capacitance (pF) | RMP (mV) | Input resistance (MΩ) | RMP (mV) 10 μm BaCl2 | RMP (mV) 100 μm BaCl2 | RMP (mV) 1 mm BaCl2 |
|---|---|---|---|---|---|---|
| P3 | 14.2 ± 6.2 (n = 9) | −59.6 ± 9.2 (n = 9) | 288 ± 109b (n = 9) | −46.7 ± 15.0 (n = 7) | −39.6 ± 12.2a (n = 9) | −23.0 ± 6.1a (n = 5) |
| P10 | 10.3 ± 4.3 (n = 10) | −65.0 ± 6.4 (n = 10) | 98 ± 69 (n = 10) | −54.7 ± 10.0a (n = 9) | −42.3 ± 8.7a (n = 9) | −25.1 ± 7.9a (n = 8) |
| P10 (at pH 6.5) | 15.0 ± 6.9 (n = 12) | −60.8 ± 4.9 (n = 12) | 63 ± 51 (n = 12) | −41.0 ± 9.8a (n = 12) | ||
| P10 Kir4.1−/− | 31.0 ± 17.0c (n = 10) | −23.6 ± 6.8c (n = 10) | 417 ± 359c (n = 10) | −26.8 ± 7.5d (n = 8) | −24.7 ± 9.4d (n = 10) | −20.9 ± 6.1 (n = 9) |
RMP, Resting membrane potential. Data were obtained from hGFAF/EGFP mice and Kir4.1 knock-out mice crossed with hGFAP/EGFP mice. Cell numbers are given in parentheses.
aSignificant changes after BaCl2 application at P10 and P3, respectively.
bSignificant higher input resistance at P3 compared with P10 mice.
cCell capacitance, RMP, and input resistance were significantly different between hGFAP/EGFP mice and Kir4.1−/− mice at P10.
dThe RMP of astrocytes from Kir4.1−/− mice in 10 and 100 μm BaCl2 solution was significantly depolarized to those of wild-type GFAP/EGFP mice in Ba2+ solution, compared the same column, respectively.
pH sensitivity of inward currents in isolated astrocytes
Next, we tested the pH sensitivity of inward currents in astrocytes. For comparison, the Ba2+ sensitivity was tested in the same cell. Previous work has demonstrated coexpression of Kir4.1 together with Kir5.1 in astrocytes and Müller cells (Ishii et al., 2003; Hibino et al., 2004), and the subunit Kir5.1 was shown to confer high pH sensitivity to Kir4.1 channels. Activity of heteromeric Kir4.1/Kir5.1 channels is significantly reduced by acidic pH (Tanemoto et al., 2000; Xu et al., 2000). In contrast, inward currents in retinal Müller glial cells are highly pH sensitive because of the expression of acid-sensitive two-pore-domain K+ channels (Skatchkov et al., 2006).
Astrocytes were exposed to acidic bath solution (pH 6.5), and then 100 μm Ba2+ was added to the same solution (supplemental Fig. 2A,B, available at www.jneurosci.org as supplemental material). Under these conditions, the membrane conductance declined by 7.5 ± 6.5% (n = 12; pH 6.5; −130 mV) and 70.3 ± 12.2% (n = 12; pH 6.5 with 100 μm Ba2+ added) compared with control currents at pH 7.4 (supplemental Fig. 2C, available at www.jneurosci.org as supplemental material). Treatment of cells with acidic pH did not shift VR (ΔVR = 2.1 ± 2.7 mV) (Table 3), whereas channel block by 100 μm Ba2+ led to a depolarization by 22.0 ± 8.8 mV (Table 3). Comparing current densities at −130 mV, in a given cell the pH-sensitive component amounted only to 3% of the Ba2+-sensitive component (supplemental Fig. 2D, available at www.jneurosci.org as supplemental material). Ba2+-sensitive currents displayed an Erev of −75 ± 5.6 mV (RI, 0.69 ± 0.16; n = 12). The small pH-sensitive component also reversed close to EK (reversal at −81 ± 10 mV).
Kir transcript analysis in astrocytes of the hippocampus
Previous data suggested abundant expression of Kir4.1 in glial cells of the CNS (Takumi et al., 1995; Poopalasundaram et al., 2000; Hibino et al., 2004; Olsen et al., 2006). In the hippocampus, complex glial cells weakly express Kir4.1 (Schröder et al., 2002), but the identity of inward currents in astrocytes of that brain region has not been resolved yet. To investigate which Kir subunits are expressed by hippocampal astrocytes, patch-clamp analysis was combined with postrecording single-cell RT-PCR. Kir4.1 transcripts were found in all cells tested (n = 39). All astrocytes coexpressed Kir4.1 together with AQP4 (n = 11; data not shown), an astroglial water channel (Nagelhus et al., 2004; Dibaj et al., 2007). Transcripts encoding Kir5.1 were rarely found. Six of 33 cells (18%) expressed Kir5.1, either with Kir4.1 (n = 4 of 16) or with AQP4 (n = 2 of 17) (Fig. 3). Coexpression of subunits of the Kir2.0 family together with Kir4.1 was tested in 26 astrocytes. Kir2.3 transcripts were found in half the Kir4.1-positive cells, Kir2.1 was found in six cells (23%), and Kir2.2 was found in eight cells (31%). Nine Kir4.1-positive cells (35%) were devoid of Kir2.0 transcripts. In summary, among the constitutively active Kir channels (Kir2.1–Kir2.3, Kir4.1, Kir5.1), only Kir4.1 showed invariable expression in hippocampal astrocytes, whereas transcripts for the other subunits were only occasionally present (Fig. 3).
Figure 3.
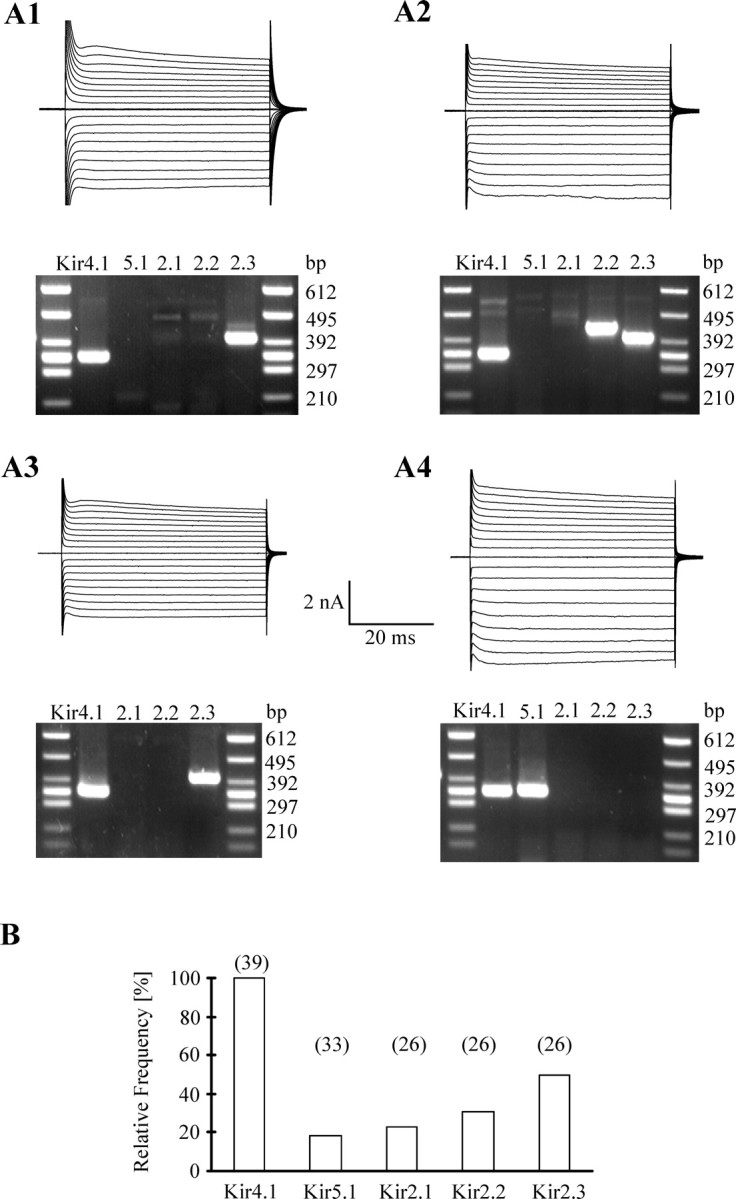
Analysis of Kir expression in single astrocytes. A1–A4, Cells were depolarized and hyperpolarized by 90 mV (10 mV increments) from a holding potential of −60 mV (A2) or −70 mV (A1, A3, A4). After recording, the cell content was harvested, and RT-PCR was performed. Kir4.1 was coexpressed with other Kir subunits as shown in the agarose gels below the respective current pattern. The expected product lengths were 338 bp for Kir4.1, 344 bp for Kir5.1, 408 bp for Kir2.1, 437 bp for Kir2.2, and 401 bp for Kir2.3. B, Summary of Kir detection in single astrocytes. The number of cells tested is given in parentheses.
Upregulation of Kir4.1 protein expression in hippocampal astrocytes during postnatal development
To corroborate expression of Kir4.1 protein in hippocampal astrocytes, immunohistochemistry was applied. Specificity of the commercially available Kir4.1 antibody was tested by staining hippocampal slices from Kir4.1−/− mice, which lacked Kir4.1 immunoreactivity (Fig. 4A; supplemental Fig. 3A, available at www.jneurosci.org as supplemental material). In wild-type mice aged P3–P42, Kir4.1/GFAP-positive cells were found in strata radiatum, lacunosum-moleculare, and oriens of the CA1 region as well as in the stratum moleculare and the hilus of the dentate gyrus (Fig. 4B–D; supplemental Fig. 3B–D, available at www.jneurosci.org as supplemental material). In the pyramidal layer of the CA1 region and the granular layer of the dentate gyrus, only Kir4.1-positive fibers were discerned, whereas the somata (labeled by Nissl staining) were Kir4.1 negative (supplemental Fig. 3B–D, available at www.jneurosci.org as supplemental material). Perinatally (P3), the number of GFAP-positive cells in the hippocampus was very low (Fig. 4B). Together, these data indicated astroglial localization of Kir4.1 and a developmental upregulation of this protein in the postnatal hippocampus.
Figure 4.
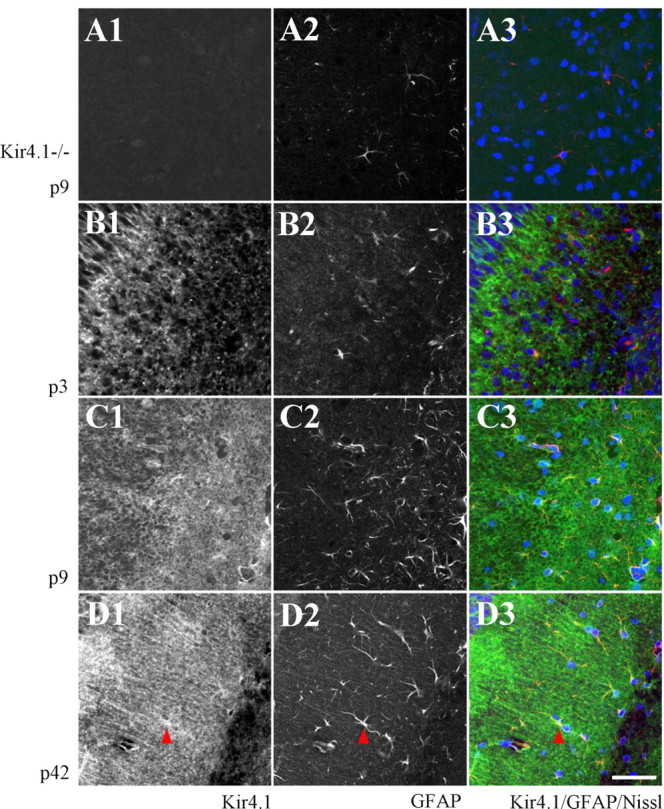
Confocal analysis of colabeling of Kir4.1 and GFAP in strata radiatum and lacunosum-moleculare of the developing CA1 region. A1, Kir4.1 immunoreactivity was absent in Kir4.1−/− mice. A2, GFAP staining in the same section. A3, The merge along with Nissl staining (blue; GFAP is in red). B–D, Kir4.1 immunoreactivity (B1, C1, D1), GFAP staining (B2, C2, D2), and the merge along with Nissl counterstaining (B3, C3, D3) at P3, P9, and P42 as indicated (Kir4.1, green). Red arrowheads (D) indicate colocalization of Kir4.1 and GFAP. Scale bar, 50 μm. In the top left, part of the pyramidal layer is visible.
Quantification of developmental Kir4.1 regulation by real-time RT-PCR and Western blot
To confirm the immunofluorescence data and to quantify the developmental increase in Kir4.1, real-time RT-PCR was performed with mRNA isolated from whole hippocampal slices. The “housekeeping” gene β-actin served as an internal standard. Figure 5A compares amplification curves of Kir4.1 and β-actin mRNA from the CA1 region at P3 and P21. At P3, more PCR cycles were necessary to reach a given threshold level, indicating a lower initial Kir4.1 copy number compared with P21. To get a quantitative measure, the threshold cycle differences, ΔCT, between Kir4.1 and β-actin were determined in individual samples, and the gene ratios, Kir4.1/β-actin, were calculated according to Equation 5. At P3, the Kir4.1/β-actin mRNA ratio was 1:134 (0.00748 ± 0.0022; n = 12), whereas at P21, the ratio amounted to 1:24 (0.0391 ± 0.0189; n = 10), indicating a sixfold increase in Kir4.1 transcript content during that period (Fig. 5B). The differences in mRNA expression ratio between P1 and P10–P60 and between P3 and P10–P60 were significant (one-way ANOVA, Tukey's post hoc test, p < 0.01). A plateau of Kir4.1 mRNA levels in the CA1 region of the hippocampus was already reached at P10 (Fig. 5B).
Figure 5.

Developmental regulation of Kir4.1 mRNA and protein in the CA1 region. A, Amplification plots for Kir4.1 (squares) and β-actin (triangles) of two mRNA samples were obtained using real-time sqRT-PCR. mRNA was analyzed from mice at P3 (open symbols) and P21 (filled symbols). The difference in threshold cycles (ΔRn; taken at the dashed line) at P3 was larger than that at P21. B, The corresponding gene expression ratio, Kir4.1/β-actin, was determined according to Equation 5 and blotted against age. Mean and SD were obtained at P1 and P3 (12 samples each) and at P10, P21, P42, and P60 (10 samples each). The increase in Kir4.1 expression between P1 or P3 and the other time points was significant (*). C1, Roentgen films of Western blot analysis of Kir4.1 tetramers (∼160 kDa) and β-actin (42 kDa). Protein content of lysates prepared from whole hippocampi was analyzed at the ages indicated. The β-actin signal served as a loading control (60 μg of protein each). C2, Absence of Kir4.1 protein in Kir4.1−/− mice compared with wild type (P10; β-actin served as a control). D, The optical density (OD) of Kir4.1 tetramer signals was corrected with respect to β-actin for each sample. Subsequently, OD values were normalized to Kir4.1 at P42. The plot shows mean values of six mice. Differences between P3 and P10–P60 (*), P10 and P42–P60 (#), and P21 and P42–P60 (§) were statistically significant.
Next we compared the developmental regulation of Kir4.1 transcripts within different CA1 subareas. Between P10 and P60, individual strata radiatum and lacunosum-moleculare were isolated and analyzed separately. Between P21 and P60, the Kir4.1/β-actin ratio of the stratum lacunosum-moleculare exceeded that of the radiatum threefold to fourfold, whereas no differences were found at P10 (Student's t test, p < 0.05) (supplemental Fig. 4A,B,D, available at www.jneurosci.org as supplemental material).
To analyze Kir4.1 expression in single cells, the cytoplasm of four or five astrocytes was harvested and pooled, mRNA was isolated, and real-time sqRT-PCR was performed as described above. In P3 astrocytes, the Kir4.1/β-actin ratio amounted to 1:14 (0.0719 ± 0.0652; n = 6 cell pools) and increased 2.5-fold at later ages (P12–P43, 0.1850 ± 0.0822, n = 8; one-way ANOVA, Tukey's post hoc test, p < 0.05) (supplemental Fig. 4C,D, available at www.jneurosci.org as supplemental material).
Postnatal changes in Kir4.1 protein content displayed a time course similar to the developmental switch in transcript expression (Fig. 5C,D). Membrane fractions (i.e., receptor tetramers; n = 6) (Fig. 5C1) were analyzed by Western blot under denaturing conditions. Blots were analyzed separately (seven mice at each age), and gel loading was calibrated to β-actin. Before quantitative evaluation, specificity of the putative Kir4.1 monomer and tetramer bands was tested using Kir4.1−/− mice. In these mice, no signals were observed at 43 and 160 kDa, respectively (Fig. 5C2). After calibration of gray levels of Kir4.1 with respect to the β-actin signal of the same sample, Kir4.1 optical densities obtained at different ages were normalized to the P42 value. A significant increase in Kir4.1 protein was observed between P3 and P60 (Fig. 5D) (one-way ANOVA, Tukey's post hoc test, p < 0.01). Compared with P3, Kir4.1 tetramer protein increased 13- and 40-fold at P12 and P42, respectively (Fig. 5C1,D).
Inwardly rectifying currents in astrocytes from perinatal mouse hippocampus
Both antibody staining and transcript analysis indicated weak expression of Kir4.1 perinatally and profound upregulation between P3 and P12. For functional characterization of astrocytes between P1 and P3 (designated as P1), freshly isolated EGFP-positive cells with typical extended processes lacking ionotropic glutamate receptor responses were selected. Notably, the current patterns of these immature cells displayed strong outward rectification, as opposed to the more linear or inwardly rectifying current phenotype observed beyond P9 (compare Figs. 2, 3, 6). Although the resting membrane potential of perinatal astrocytes was similar to P9 astrocytes, a significantly higher input resistance was noted at P1 (Table 3), which was attributable to much smaller K+ inward current (Fig. 6A,E). In Ba2+-containing solutions, the inward conductance at −130 mV was reduced by the same amount as in P9 astrocytes (10 μm Ba2+, by 68.8 ± 7.2%, n = 7; 100 μm Ba2+, by 75.5 ± 8.7%, n = 9; 1 mm Ba2+, by 77.0 ± 8.3%, n = 5) (Fig. 6C; see also Fig. 2C). Similarly, the RI value (0.65 ± 0.19; n = 9) and Vrev (−68.6 ± 6.5 mV) of currents sensitive to 100 μm Ba2+ did not differ from P9 cells (compare Fig. 2D). However, the amplitude of Ba2+-sensitive inward currents was smaller in perinatal astrocytes. This is illustrated in Figure 6E, which compares the Ba2+ (100 μm)-sensitive current densities of P1 and P9 astrocytes. At −130 mV, the current density of perinatal astrocytes reached only 26.7% of the cells at P9.
Figure 6.

Ba2+ sensitivity of membrane currents of freshly isolated astrocytes at P1. A, Membrane currents were evoked as described in Figure 1. B1–B3, Ba2+-sensitive currents were isolated by subtracting current families obtained in Ba2+ from those before Ba2+ application at corresponding voltages (bottom; scale bar, 200 pA). C, Membrane conductance in control and Ba2+ solutions was determined at −130 mV according to Equation 1, and Ba2+-sensitive fractions were determined at different concentrations of the blocker (cell numbers are in parentheses). D, I/V relationships of Ba2+-sensitive currents in 0.01 mm Ba2+ (diamonds; n = 8), 0.1 mm Ba2+ (circles; n = 9), and 1 mm Ba2+ (triangles; n = 5). Data were normalized to respective maximum inward currents. E, Comparison of Ba2+-sensitive current densities (100 μm) at P9 (n = 9; taken from Fig. 2; open circles) and P1 (n = 9; filled circles). Current densities of the two curves differed significantly between −150 and −100 mV and between −60 and +20 mV (*). Data in C–E are given as mean ± SD.
Astrocytes from Kir4.1−/− mice lack Ba2+-sensitive inward currents
To confirm that Kir4.1 mediates the bulk of Ba2+-sensitive inward current in hippocampal astrocytes, Kir4.1−/− mice were used. To facilitate identification of astrocytes in Kir4.1−/− mice, the latter were crossed with Tg(hGFAP/EGFP) mice, and the offspring were characterized by genotyping. Cells were freshly isolated from the hippocampus. Kir4.1−/−;EGFP-positive astrocyte cells with prominent processes were selected and analyzed in the whole-cell mode. At P9, these cells displayed outwardly rectifying current patterns (Fig. 7A) and high-input resistances and strongly depolarized resting membrane potentials, resembling age-matched control cells recorded in 1 mm Ba2+ solution (Table 3). Application of Ba2+ to astrocytes from Kir4.1−/−;Tg(hGFAP/EGFP) mice failed to block inward currents and did not change VR (Table 3; Fig. 7B,C).
Figure 7.

Lack of Ba2+-sensitive currents in astrocytes freshly isolated from Kir4.1−/−;Tg(hGFAP/EGFP) mice (P9). A, Membrane currents were evoked as described in Figure 1. B1, B2, Ba2+ did not affect inward currents. Bottom panels show the Ba2+-sensitive components at higher resolution (scale bar, 500 pA). C, The mean I/V relationship of Ba2+ (100 μm)-sensitive current densities of 10 astrocytes obtained from the CA1 region of Kir4.1−/−;Tg(hGFAP/EGFP) mice (filled circles; data taken after 50 ms). For comparison, Ba2+ (100 μm)-sensitive currents at P9 (n = 9; open circles; taken from Fig. 2) were depicted.
To confirm that Ba2+-sensitive inward currents are also abolished in Kir4.1−/− astrocytes in situ, EGFP-positive cells were recorded in acute hippocampal brain slices of Kir4.1−/−;Tg(hGFAP/EGFP) mice. As expected, these slice recordings revealed depolarized VR values and higher input resistances compared with control cells from Tg(hGFAP/EGFP) mice (Table 2). Bath application of Ba2+ (100 μm) to Kir4.1−/− astrocytes in situ did not affect resting potential, input resistance (Table 2), or K+ current amplitudes (Fig. 8). The resting potential of Kir4.1−/− astrocytes was more depolarized compared with wild-type astrocytes after Cbx incubation and Ba2+ block, indicating that the Kir blocker probably failed to completely inhibit K+ resting currents in situ.
Figure 8.

Astrocytes in Kir4.1−/−;Tg(hGFAP/EGFP) mice (P9) in situ lack Ba2+-sensitive currents. A, Membrane currents before (left) and in the presence of (right) Ba2+ (100 μm) were elicited as described in Figure 1. B, The Ba2+-sensitive component was isolated through a subtraction protocol. C, Mean (9 cells) I/V relationships were determined before (filled triangles) and during (open circles) application of Ba2+ (100 μm). D, The membrane was repetitively clamped between −160 and +100 mV for 100 ms, separated by 100 ms (holding potential, −70 mV; see inset), and 100 μm Ba2+ was added via the bath as indicated, confirming that Ba2+ had no effect on current amplitudes.
Expression of two-pore-domain K+ (K2p) channels by hippocampal astrocytes?
So far, our experiments demonstrate that the membrane conductance of hippocampal astrocytes is mainly, although not exclusively, mediated by Kir4.1 channels. It has been suggested that astrocytes also express K2P channels. To test for functional expression of K2P channels, the inhibitors quinine and bupivacaine (200 μm each) (Lesage and Lazdunski, 2000) were applied to isolated astrocytes. Quinine led to a profound reduction of inward and outward currents (supplemental Fig. 5A, available at www.jneurosci.org as supplemental material) and significantly depolarized the membrane (shift of VR from −66.7 ± 2.9 to −29.2 ± 21.5 mV; n = 7). The quinine-sensitive current fraction amounted to 63 ± 13% (at −130 mV), which was similar to the Ba2+-sensitive component of isolated astrocytes determined at the same age (compare Fig. 2C). Quinine-sensitive currents reversed at −71.2 ± 2.9 mV and displayed slight outward rectification (RI, 1.18 ± 0.23; n = 7). In contrast, the local anesthetic bupivacaine did not affect VR in the same cells (−59.7 ± 11.0 mV; n = 7) while reducing the membrane conductance by 35.8 ± 18% (−130 mV). Bupivacaine-sensitive currents reversed at −72.6 ± 4.6 mV and showed outward rectification (RI, 1.44 ± 0.72; n = 7) (supplemental Fig. 5B, available at www.jneurosci.org as supplemental material). Since both blockers, quinine and bupivacaine, significantly reduced inward currents, presumably through block of Kir channels, Ba2+ (100 μm) was applied before the K2P channel blockers. Under these conditions, bupivacaine and quinine decreased transient outward currents, mimicking the effect of 4-aminopyridine (4-AP; 4 mm) (supplemental Fig. 6, available at www.jneurosci.org as supplemental material). Hence, to isolate putative quinine- and bupivacaine-sensitive K2P currents in hippocampal astrocytes, coapplication of Ba2+ and 4-AP is necessary.
In the presence of Ba2+ (100 μm) and 4-AP (4 mm), application of quinine (200 μm) decreased the membrane conductance by 61 ± 10% (+20 mV) and 31 ± 10% (−130 mV; n = 9), respectively (Fig. 9B1–B3). Quinine caused an additional depolarization, shifting VR from −55.2 ± 9.8 mV (in the presence of Ba2+ and 4-AP) to −44.4 ± 12.2 mV (n = 9). The quinine sensitive current showed outward rectification, as predicted for open channels by the Goldman-Hodgkin-Katz equation. In the same cells, Erev of Ba2+-sensitive currents mediated by Kir4.1 was −74.7 ± 6.8 mV (RI, 0.76 ± 0.16; n = 9), whereas quinine-sensitive, presumed K2P channel-mediated currents (i.e., recorded in the presence of Ba2+ and 4-AP) reversed at −66.8 ± 12.9 mV. The latter displayed pronounced outward rectification (RI, 2.28 ± 1.50; n = 9). Bupivacaine (200 μm), in the presence of Ba2+ and 4-AP, neither changed VR nor membrane conductance (n = 7) (Fig. 9B4).
Figure 9.

Isolation of quinine-sensitive currents in isolated astrocytes. A, Currents were activated between −150 and +30 mV (holding potential, −60 mV; VR = −68 mV). The dashed line indicates zero current. B1–B3, Ba2+ (100 μm), 4-AP (4 mm), and quinine (200 μm) were consecutively applied to the same cell. Bottom panels show the Ba2+-sensitive (B1), 4-AP-sensitive (B2), and quinine-sensitive (B3) currents. B4, After washout of quinine, bupivacaine (200 μm) was applied to the same cell, indicating that bupivacaine and 4-AP blocked almost the same currents (B2–B4). C, The mean I/V relationship of Ba2+-sensitive (triangles) and quinine-sensitive (diamonds) currents. Data were taken 50 ms after stimulus onset and normalized to maximum inward (Ba2+) or outward current amplitudes (quinine) obtained in each individual cell (n = 9). Note the weak inward rectification of Ba2+-sensitive currents while quinine currents were outwardly rectifying. D, Estimation of the relative fraction of currents sensitive to Ba2+, Ba2+ plus 4-AP, and Ba2+ plus 4-AP plus quinine. Membrane conductance was determined at +20 and −130 mV and averaged (n = 9; mean ± SD). E1, E2, In high-[K+]o solution supplemented with Ba2+ (100 μm) and 4-AP (4 mm), quinine (200 μm) decreased membrane currents. F, Mean I/V relationship of quinine-sensitive currents (solutions as in E), normalized to maximum current in each cell (n = 5). Note that in high-K+ solution, quinine-sensitive currents lost outward rectification and reversed close to EK (−24.1 mV).
We determined the relative reduction of membrane conductance when consecutively applying Ba2+, 4-AP, and quinine to the same cell. At +20 mV, Ba2+ decreased the membrane conductance by 56.9 ± 16.1% (data taken 50 ms after stimulus onset). The addition of 4-AP to the Ba2+-containing solution led to an additional decrease of ∼15.9% (total decrease of 72.8 ± 6.3%), and quinine blocked another 16.2% (total decrease of 89 ± 4.5%; n = 9; residual membrane conductance, 11 ± 4.5%). At −130 mV, Ba2+ decreased the conductance by 80.7 ± 11.6%. 4-AP had almost no effect (additional decrease of 0.7%), whereas addition of quinine led to a total decrease of 89.1 ± 5.5% (residual membrane conductance, 10.9 ± 5.5%) (Fig. 9D). To test for the K+ selectivity of quinine-sensitive, presumed K2P channels, the extracellular K+ concentration was increased to 50 mm. In the presence of Ba2+ and 4-AP, quinine-sensitive currents reversed at −22.9 ± 1.1 mV (n = 5) (i.e., close to the K+ equilibrium potential; −24.1 mV). The I/V relationship of the corresponding conductance was almost linear (RI, 1.12 ± 0.13).
The shape of the I/V relationship of quinine-sensitive currents, the insensitivity of membrane currents to acid pH (compare supplemental Fig. 2, available at www.jneurosci.org as supplemental material), and the small effects of bupivacaine suggested expression of TREK family K2P channels (Goldstein et al., 2001) in hippocampal astrocytes. TREK-mediated currents are potentiated by polyunsaturated fatty acids such as AA and by volatile anesthetics (e.g., halothane) (for review, see Honoré, 2007). To substantiate the hypothesis that the cells under study express TREK channels, AA (10 μm) was applied to isolated astrocytes, subsequent to adding Ba2+ (100 μm), 4-AP (4 mm), and tetraethylammonium (TEA) (10 mm) to the bath. Application of AA (duration ≤2 min) increased the membrane currents to 172 ± 38% (+20 mV; range, 125–250%; n = 8) (Fig. 10A,B). AA increased outwardly rectifying currents (RI, 1.78 ± 1.00; [K+]o = 5 mm) with Erev = −66.7 ± 16.5 mV (n = 8). In 50 mm K+-containing bath solution, Erev shifted to −25.3 ± 3.2 mV (RI, 1.29 ± 0.23; n = 5) (Fig. 10C–E). The potentiating effect of AA was reversible and blocked by quinine (200 μm; data not shown). Halothane (5 mm, 1 min; in the presence of Ba2+, 4-AP, and TEA) also exerted a potentiating effect. Membrane currents increased to 142 ± 79 and 149 ± 58% at +20 and −130 mV, respectively (n = 5; data not shown). Together, these data suggested that astrocytes in the hippocampus express K2P family members, presumably TREK1 and/or TREK2.
Figure 10.

Hippocampal astrocytes express functional TREK channels. A, B, In the presence of Ba2+ (100 μm), 4-AP (4 mm), and TEA (10 mm), AA (10 μm; 1 min) increased membrane currents (stimulus protocol as in Fig. 9; dotted lines indicate zero current at −70 mV). AA-sensitive currents are shown to the right (B − A). C, D, The blockers used in A and B were applied in high-[K+]o solution. AA (10 μm) led to a current increase. E, Mean I/V relationships of AA-induced currents (diamonds, 5 mm [K+]o, n = 8; triangles, 50 mm [K+]o, n = 5). Data were taken 50 ms after stimulus onset. F, Analysis of Kir and K2P transcripts in single astrocytes. After recording (−160 to +20 mV; holding potential, −70 mV), the cytoplasm was harvested, and multiplex RT-PCR was performed. Agarose gels show PCR products for K2P and Kir4.1 channels. The expected product lengths were 338 bp for Kir4.1, 282 bp for TREK1, 126 bp for TREK2, and 272 bp for TWIK1.
To further corroborate this hypothesis and identify K2P subunits expressed by hippocampal astrocytes, postrecording multiplex single-cell RT-PCR was performed. All astrocytes tested expressed Kir4.1 (n = 43). Coexpression of subunits of the TREK family together with Kir4.1 was tested in 28 cells. TREK1 was found in 61% (n = 17 of 28) of the astrocytes, whereas 23% (3 of 13) of the Kir4.1-positive cells contained mRNA encoding TREK2. Some cells (n = 2 of 13) coexpressed TREK1, TREK2, and Kir4.1. In addition, a majority (67%) of Kir4.1-positive astrocytes contained TWIK1 transcripts (n = 14 of 21). In contrast, transcripts for TRAAK were never found (0 of 9) (Fig. 10F). Hippocampal astrocytes from Kir4.1−/− mice also expressed TWIK1 and TREK1 transcripts (64% each; n = 11) and displayed AA (10 μm)-sensitive currents (data not shown).
Discussion
Despite the fact that astrocytes are increasingly recognized as communication partners of neurons (Volterra and Meldolesi, 2005; Haydon and Carmignoto, 2006), the intrinsic biophysical properties of these cells are poorly understood. Thus, although it is known for many years that the astrocytic membrane in situ is dominated by prominent resting currents (Steinhäuser et al., 1992), the composition of ion channels mediating this “passive” current phenotype is not well defined. Part of this ignorance is attributable to the fact that astrocytes are abundantly coupled, giving rise to a significant intercellular conductance (Blomstrand et al., 2004; Wallraff et al., 2006) impeding quantitative analyses of intrinsic astrocytic currents. The matter is further complicated since astrocytes in different brain regions display variable functional properties (Clark and Barbour, 1997; Matthias et al., 2003; Lalo et al., 2006, 2008; Jabs et al., 2007). Using freshly isolated cells to improve space-clamp conditions, we show here that the majority of inward currents in hippocampal astrocytes are mediated by Kir4.1 and that these cells also express functional K2P channels.
Developmental and spatial regulation of Kir4.1
Single-cell transcript analysis and protein measurements in the CA1 region indicated strong upregulation of Kir4.1 during early postnatal development, which was accompanied by increasing Ba2+-sensitive inward currents. Notably, in perinatal astrocytes, the small Kir currents were sufficient to stabilize VR close to EK, which is different to retinal Müller cells (Bringmann et al., 1999, 2000).
Beyond P10, Kir4.1 mRNA in the hippocampus was higher in stratum lacunosum-moleculare compared with the radiatum. The radiatum harbors most of the CA1 excitatory input, whereas only 20% of pyramidal cell synapses are located in the lacunosum-moleculare (Megias et al., 2001). At the same time, the lacunosum-moleculare is the region with the highest density of perfused microvessels in the hippocampus (Gerhart et al., 1991; Shimada et al., 1992). Kir4.1 is highly expressed around synapses and blood vessels (Higashi et al., 2001; Hibino et al., 2004), and colocalized AQP4 and Kir4.1 channels in astrocytic endfeet touching microvessels mediate coupled transport of K+ and water (Nagelhus et al., 2004; Dibaj et al., 2007). The finding of a concerted developmental increase of AQP4 and Kir4.1 in astrocytes and Müller cells further supports their critical involvement in brain water regulation, K+ homeostasis, and volume regulation (Wen et al., 1999; Wurm et al., 2006). Accordingly, lysis of the perivascular AQP4/Kir4.1 complex perturbs K+ homeostasis and promotes epilepsy (Eid et al., 2005).
The localization of Kir4.1 at processes wrapping synapses and blood vessels led to the concept of glial K+ spatial buffering (Orkand, 1986). This concept has been confirmed in the retina (K+ siphoning) (Newman and Reichenbach, 1996), whereas knowledge of other brain areas remained limited (Holthoff and Witte, 2000). A recent study, using transgenic mice with genetic deletion of Cx30 and Cx43 in astrocytes, provided evidence that spatial K+ buffering is also operative in gray matter (Wallraff et al., 2006). Presumably, astrocytes in the radiatum use indirect coupling to evacuate K+ into the microvasculature.
Pathological impact of Kir4.1 regulation in astrocytes
In the present study, the pivotal role of Kir4.1 channels in constituting the membrane conductance of developing astrocytes in the hippocampus was confirmed using constitutive Kir4.1−/− mice. Astrocytes of these mice lacked Ba2+-sensitive currents and displayed depolarized VR. Conditional knock-out of Kir4.1 also led to astrocyte depolarization, inhibition of K+ and glutamate uptake, and enhanced short-term synaptic potentiation (Djukic et al., 2007).
Astrocyte dysfunction is increasingly recognized as an important factor in the pathogenesis of neurological disorders (Seifert et al., 2006). Reduced astroglial Kir currents were observed under various pathological conditions [e.g., after entorhinal cortex lesion (Schröder et al., 1999), cortical dysplasia (Bordey et al., 2001), and traumatic and ischemic brain injury (D'Ambrosio et al., 1999; Köller et al., 2000); in Cu/Zn SOD (superoxide dismutase)-1 mutant mice, a model for familial amyotrophic lateral sclerosis (Kaiser et al., 2006); and in neurosurgical specimens from epilepsy patients (Bordey and Sontheimer, 1998; Hinterkeuser et al., 2000)]. Impaired function of glutamate uptake may add to pathological effects of Kir loss in astrocytes (Kucheryavykh et al., 2007). Notably, transient opening of the blood–brain barrier is sufficient for focal epileptogenesis, probably because of astroglial albumin uptake triggering downregulation of Kir4.1 (Ivens et al., 2007).
Astrocytic Kir4.1 channels become Ca2+ permeable at low extracellular K+ concentrations. Thus, under conditions of local K+ undershoot attributable to enhanced Na+/K+ ATPase activity, Kir4.1 channels potentially trigger Ca2+ oscillations and gliotransmitter release, which might exacerbate pathological conditions (Dallwig et al., 2000; Hartel et al., 2007).
Passive current pattern of astrocytes
Based on initial recordings in acute hippocampal brain slices, glial cells with predominating passive and “complex” current patterns have been distinguished (Steinhäuser et al., 1994), and later work has established that passive cells represent bona fide astrocytes whereas complex cells constitute a different cell type (termed GluR cells or NG2 glia) (Matthias et al., 2003; Wigley et al., 2007). However, it is still unclear which ion channel(s), in addition to Kir4.1, underlies the passive currents of astrocytes in the hippocampus. Currents through gap junctions contribute to the overall conductance, but even after genetical deletion of coupling the passive current phenotype remained (Wallraff et al., 2006).
Interestingly, whole-cell recordings from freshly isolated astrocytes often disclosed time- and voltage-dependent currents (see also Matthias et al., 2003), which were obviously masked by the much larger passive currents activated in slice recordings. Perinatally, however, even slice recordings frequently reveal complex current patterns in astrocytes (data not shown). Accordingly, early in development (i.e., before P12), the whole-cell current pattern cannot be used as a reliable criterion to distinguish astrocytes from GluR cells or NG2 glia. Similar observations have been made in rat hippocampus (Zhou et al., 2006).
Expression of K2P channels by hippocampal astrocytes
It has been suggested that K2P channels mediate part of the passive astroglial membrane conductance. Astrocytes of hippocampus and cerebellum express TASK1 protein (Kindler et al., 2000; Millar et al., 2000; Kanjhan et al., 2004; Rusznak et al., 2004; Kim et al., 2007), but so far evidence of functional expression of acid- and bupivacaine-sensitive TASK channels in these cells is lacking. The present study also failed at finding effects of bupivacaine after inhibiting Kir- and 4-AP-sensitive voltage-gated currents. Moreover, acid pH had only small effects on astrocyte currents, and the I/V relationship of this pH-sensitive component rather indicated weak pH dependence of Kir channels. The conclusion that hippocampal astrocytes lack TASK channels is in line with Päsler et al. (2007), who did not observe bupivacaine-sensitive K+ uptake. Bupivacaine-sensitive, presumed TASK channel-mediated currents were described in Müller cells (Skatchkov et al., 2006).
In the present study, quinine-sensitive K+ currents were identified that displayed outwardly rectifying I/V relationships as predicted for open channels from the Goldman-Hodgkin-Katz relationship. In the presence of Ba2+, TEA, and 4-AP (i.e., blockers of Kir and voltage-gated K+ channels), AA and halothane reversibly increased presumed K2P currents. Potentiation was blocked by quinine. In high K+ solution, Erev of AA− or halothane-sensitive currents shifted as expected for K+-permeable channels. Together, this indicated functional expression of TREK-like channels (Patel et al., 1998). Previous work using cultured astrocytes reported TREK-like currents that were sensitive to quinine and polyunsaturated fatty acids (Gnatenco et al., 2002; Ferroni et al., 2003). To further confirm expression of K2P channels in acute hippocampal astrocytes, single-cell RT-PCR was performed. Using primers recognizing Kir4.1 together with K2P subunits, we found that most cells expressed TREK whereas TRAAK was lacking, which was consistent with our functional analyses. In addition, many astrocytes contained mRNAs for TWIK1. These channels are highly sensitive to Ba2+ (IC50 = ∼100 μm) and quinine (IC50 = ∼50 μm) (Lesage et al., 1996). However, since TWIK1 channels show inward rectification and because no Ba2+ sensitivity was observed in astrocytes from Kir4.1−/− mice (although astrocytes from these mice displayed unchanged TWIK1 transcript expression), it is unlikely that TWIK1 channels substantially contribute to the current pattern of astrocytes in the CA1 region of the hippocampus.
In conclusion, our data suggest that astrocytes express K2P channels of the TREK family. Assuming that they are expressed at distant processes or endfeet and subject to modulation by endogenously released AA, TREK channels might serve the fine tuning of K+ homeostasis at the neurovascular interface (Mulligan and MacVicar, 2004). The present study suggests that the apparently ohmic whole-cell current pattern of astrocytes results from the superposition of several components, including Kir currents, 4-AP-sensitive voltage-gated currents, and currents through K2P channels. Using independent methodological approaches, our findings substantiate that Kir4.1 constitutes a pivotal subunit mediating inward currents in hippocampal astrocytes. In addition, it provides the first quantitative comparative evaluation of Kir4.1 expression in the CA1 subfield and its regulation during postnatal development. Improved knowledge of basic astrocyte physiology is necessary for a better understanding of the neuron–glia cross talk in the normal and diseased brain.
Footnotes
This work was supported by the Deutsche Forschungsgemeinschaft (SFB/TR3, TP C1; SPP1172, SE774/3-2) and the European Community (FP7-202167 NeuroGLIA). We thank P. Kofuji for providing Kir4.1−/− mice, T. Erdmann and I. Fiedler for excellent technical assistance, and U. Heinemann for comments on this manuscript.
References
- Blomstrand F, Venance L, Siren AL, Ezan P, Hanse E, Glowinski J, Ehrenreich H, Giaume C. Endothelins regulate astrocyte gap junctions in rat hippocampal slices. Eur J Neurosci. 2004;19:1005–1015. doi: 10.1111/j.0953-816x.2004.03197.x. [DOI] [PubMed] [Google Scholar]
- Bordey A, Sontheimer H. Properties of human glial cells associated with epileptic seizure foci. Epilepsy Res. 1998;32:286–303. doi: 10.1016/s0920-1211(98)00059-x. [DOI] [PubMed] [Google Scholar]
- Bordey A, Lyons SA, Hablitz JJ, Sontheimer H. Electrophysiological characteristics of reactive astrocytes in experimental cortical dysplasia. J Neurophysiol. 2001;85:1719–1731. doi: 10.1152/jn.2001.85.4.1719. [DOI] [PubMed] [Google Scholar]
- Bringmann A, Biedermann B, Reichenbach A. Expression of potassium channels during postnatal differentiation of rabbit Muller glial cells. Eur J Neurosci. 1999;11:2883–2896. doi: 10.1046/j.1460-9568.1999.00706.x. [DOI] [PubMed] [Google Scholar]
- Bringmann A, Francke M, Pannicke T, Biedermann B, Kodal H, Faude F, Reichelt W, Reichenbach A. Role of glial K+ channels in ontogeny and gliosis: a hypothesis based upon studies on Muller cells. Glia. 2000;29:35–44. doi: 10.1002/(sici)1098-1136(20000101)29:1<35::aid-glia4>3.0.co;2-a. [DOI] [PubMed] [Google Scholar]
- Casamassima M, D'Adamo MC, Pessia M, Tucker SJ. Identification of a heteromeric interaction that influences the rectification, gating, and pH sensitivity of Kir4.1/Kir5.1 potassium channels. J Biol Chem. 2003;278:43533–43540. doi: 10.1074/jbc.M306596200. [DOI] [PubMed] [Google Scholar]
- Clark BA, Barbour B. Currents evoked in Bergmann glial cells by parallel fibre stimulation in rat cerebellar slices. J Physiol. 1997;502:335–350. doi: 10.1111/j.1469-7793.1997.335bk.x. [DOI] [PMC free article] [PubMed] [Google Scholar]
- Dallwig R, Vitten H, Deitmer JW. A novel barium-sensitive calcium influx into rat astrocytes at low external potassium. Cell Calcium. 2000;28:247–259. doi: 10.1054/ceca.2000.0153. [DOI] [PubMed] [Google Scholar]
- D'Ambrosio R, Maris DO, Grady MS, Winn HR, Janigro D. Impaired K+ homeostasis and altered electrophysiological properties of post-traumatic hippocampal glia. J Neurosci. 1999;19:8152–8162. doi: 10.1523/JNEUROSCI.19-18-08152.1999. [DOI] [PMC free article] [PubMed] [Google Scholar]
- Dibaj P, Kaiser M, Hirrlinger J, Kirchhoff F, Neusch C. Kir4.1 channels regulate swelling of astroglial processes in experimental spinal cord edema. J Neurochem. 2007;103:2620–2628. doi: 10.1111/j.1471-4159.2007.04979.x. [DOI] [PubMed] [Google Scholar]
- Djukic B, Casper KB, Philpot BD, Chin LS, McCarthy KD. Conditional knock-out of Kir4.1 leads to glial membrane depolarization, inhibition of potassium and glutamate uptake, and enhanced short-term synaptic potentiation. J Neurosci. 2007;27:11354–11365. doi: 10.1523/JNEUROSCI.0723-07.2007. [DOI] [PMC free article] [PubMed] [Google Scholar]
- Eid T, Lee TS, Thomas MJ, Amiry-Moghaddam M, Bjornsen LP, Spencer DD, Agre P, Ottersen OP, De Lanerolle NC. Loss of perivascular aquaporin 4 may underlie deficient water and K+ homeostasis in the human epileptogenic hippocampus. Proc Natl Acad Sci U S A. 2005;102:1193–1198. doi: 10.1073/pnas.0409308102. [DOI] [PMC free article] [PubMed] [Google Scholar]
- Ferroni S, Valente P, Caprini M, Nobile M, Schubert P, Rapisarda C. Arachidonic acid activates an open rectifier potassium channel in cultured rat cortical astrocytes. J Neurosci Res. 2003;72:363–372. doi: 10.1002/jnr.10580. [DOI] [PubMed] [Google Scholar]
- Gerhart DZ, Djuricic B, Drewes LR. Quantitative immunocytochemistry (image analysis) of glucose transporters in the normal and postischemic rodent hippocampus. J Cereb Blood Flow Metab. 1991;11:440–448. doi: 10.1038/jcbfm.1991.85. [DOI] [PubMed] [Google Scholar]
- Gnatenco C, Han J, Snyder AK, Kim D. Functional expression of TREK-2 K(+) channel in cultured rat brain astrocytes. Brain Res. 2002;931:56–67. doi: 10.1016/s0006-8993(02)02261-8. [DOI] [PubMed] [Google Scholar]
- Goldstein SA, Bockenhauer D, O'Kelly I, Zilberberg N. Potassium leak channels and the KCNK family of two-P-domain subunits. Nat Rev Neurosci. 2001;2:175–184. doi: 10.1038/35058574. [DOI] [PubMed] [Google Scholar]
- Hartel K, Singaravelu K, Kaiser M, Neusch C, Hulsmann S, Deitmer JW. Calcium influx mediated by the inwardly rectifying K+ channel Kir4.1 (KCNJ10) at low external K+ concentration. Cell Calcium. 2007;42:271–280. doi: 10.1016/j.ceca.2006.12.004. [DOI] [PubMed] [Google Scholar]
- Haydon PG, Carmignoto G. Astrocyte control of synaptic transmission and neurovascular coupling. Physiol Rev. 2006;86:1009–1031. doi: 10.1152/physrev.00049.2005. [DOI] [PubMed] [Google Scholar]
- Heinemann U, Gabriel S, Jauch R, Schulze K, Kivi A, Eilers A, Kovacs R, Lehmann TN. Alterations of glial cell function in temporal lobe epilepsy. Epilepsia. 2000;41(Suppl 6):S185–S189. doi: 10.1111/j.1528-1157.2000.tb01579.x. [DOI] [PubMed] [Google Scholar]
- Hibino H, Fujita A, Iwai K, Yamada M, Kurachi Y. Differential assembly of inwardly rectifying K+ channel subunits, Kir4.1 and Kir5.1, in brain astrocytes. J Biol Chem. 2004;279:44065–44073. doi: 10.1074/jbc.M405985200. [DOI] [PubMed] [Google Scholar]
- Higashi K, Fujita A, Inanobe A, Tanemoto M, Doi K, Kubo T, Kurachi Y. An inwardly rectifying K(+) channel, Kir4.1, expressed in astrocytes surrounds synapses and blood vessels in brain. Am J Physiol Cell Physiol. 2001;281:C922–C931. doi: 10.1152/ajpcell.2001.281.3.C922. [DOI] [PubMed] [Google Scholar]
- Hinterkeuser S, Schröder W, Hager G, Seifert G, Blümcke I, Elger CE, Schramm J, Steinhäuser C. Astrocytes in the hippocampus of patients with temporal lobe epilepsy display changes in potassium conductances. Eur J Neurosci. 2000;12:2087–2096. doi: 10.1046/j.1460-9568.2000.00104.x. [DOI] [PubMed] [Google Scholar]
- Holthoff K, Witte OW. Directed spatial potassium redistribution in rat neocortex. Glia. 2000;29:288–292. doi: 10.1002/(sici)1098-1136(20000201)29:3<288::aid-glia10>3.0.co;2-8. [DOI] [PubMed] [Google Scholar]
- Honoré E. The neuronal background K2P channels: focus on TREK1. Nat Rev Neurosci. 2007;8:251–261. doi: 10.1038/nrn2117. [DOI] [PubMed] [Google Scholar]
- Ishii M, Horio Y, Tada Y, Hibino H, Inanobe A, Ito M, Yamada M, Gotow T, Uchiyama Y, Kurachi Y. Expression and clustered distribution of an inwardly rectifying potassium channel, KAB-2/Kir4.1, on mammalian retinal Muller cell membrane: their regulation by insulin and laminin signals. J Neurosci. 1997;17:7725–7735. doi: 10.1523/JNEUROSCI.17-20-07725.1997. [DOI] [PMC free article] [PubMed] [Google Scholar]
- Ishii M, Fujita A, Iwai K, Kusaka S, Higashi K, Inanobe A, Hibino H, Kurachi Y. Differential expression and distribution of Kir5.1 and Kir4.1 inwardly rectifying K+ channels in retina. Am J Physiol Cell Physiol. 2003;285:C260–C267. doi: 10.1152/ajpcell.00560.2002. [DOI] [PubMed] [Google Scholar]
- Ivens S, Kaufer D, Flores LP, Bechmann I, Zumsteg D, Tomkins O, Seiffert E, Heinemann U, Friedman A. TGF-beta receptor-mediated albumin uptake into astrocytes is involved in neocortical epileptogenesis. Brain. 2007;130:535–547. doi: 10.1093/brain/awl317. [DOI] [PubMed] [Google Scholar]
- Jabs R, Pivneva T, Huttmann K, Wyczynski A, Nolte C, Kettenmann H, Steinhauser C. Synaptic transmission onto hippocampal glial cells with hGFAP promoter activity. J Cell Sci. 2005;118:3791–3803. doi: 10.1242/jcs.02515. [DOI] [PubMed] [Google Scholar]
- Jabs R, Matthias K, Grote A, Grauer M, Seifert G, Steinhauser C. Lack of P2X receptor mediated currents in astrocytes and GluR type glial cells of the hippocampal CA1 region. Glia. 2007;55:1648–1655. doi: 10.1002/glia.20580. [DOI] [PubMed] [Google Scholar]
- Kaiser M, Maletzki I, Hulsmann S, Holtmann B, Schulz-Schaeffer W, Kirchhoff F, Bahr M, Neusch C. Progressive loss of a glial potassium channel (KCNJ10) in the spinal cord of the SOD1 (G93A) transgenic mouse model of amyotrophic lateral sclerosis. J Neurochem. 2006;99:900–912. doi: 10.1111/j.1471-4159.2006.04131.x. [DOI] [PubMed] [Google Scholar]
- Kanjhan R, Anselme AM, Noakes PG, Bellingham MC. Postnatal changes in TASK-1 and TREK-1 expression in rat brain stem and cerebellum. Neuroreport. 2004;15:1321–1324. doi: 10.1097/01.wnr.0000127462.15985.dc. [DOI] [PubMed] [Google Scholar]
- Kim DS, Kim JE, Kwak SE, Choi HC, Song HK, Kimg YI, Choi SY, Kang TC. Up-regulated astroglial TWIK-related acid-sensitive K(+) channel-1 (TASK-1) in the hippocampus of seizure-sensitive gerbils: a target of anti-epileptic drugs. Brain Res. 2007;1185:346–358. doi: 10.1016/j.brainres.2007.09.043. [DOI] [PubMed] [Google Scholar]
- Kindler CH, Pietruck C, Yost CS, Sampson ER, Gray AT. Localization of the tandem pore domain K+ channel TASK-1 in the rat central nervous system. Mol Brain Res. 2000;80:99–108. doi: 10.1016/s0169-328x(00)00136-4. [DOI] [PubMed] [Google Scholar]
- Kofuji P, Newman EA. Potassium buffering in the central nervous system. Neuroscience. 2004;129:1045–1056. doi: 10.1016/j.neuroscience.2004.06.008. [DOI] [PMC free article] [PubMed] [Google Scholar]
- Kofuji P, Ceelen P, Zahs KR, Surbeck LW, Lester HA, Newman EA. Genetic inactivation of an inwardly rectifying potassium channel (Kir4.1 subunit) in mice: phenotypic impact in retina. J Neurosci. 2000;20:5733–5740. doi: 10.1523/JNEUROSCI.20-15-05733.2000. [DOI] [PMC free article] [PubMed] [Google Scholar]
- Köller H, Schroeter M, Jander S, Stoll G, Siebler M. Time course of inwardly rectifying K+ current reduction in glial cells surrounding ischemic brain lesions. Brain Res. 2000;872:194–198. doi: 10.1016/s0006-8993(00)02434-3. [DOI] [PubMed] [Google Scholar]
- Kucheryavykh YV, Kucheryavykh LY, Nichols CG, Maldonado HM, Baksi K, Reichenbach A, Skatchkov SN, Eaton MJ. Downregulation of Kir4.1 inward rectifying potassium channel subunits by RNAi impairs potassium transfer and glutamate uptake by cultured cortical astrocytes. Glia. 2007;55:274–281. doi: 10.1002/glia.20455. [DOI] [PubMed] [Google Scholar]
- Lalo U, Pankratov Y, Kirchhoff F, North RA, Verkhratsky A. NMDA receptors mediate neuron-to-glia signaling in mouse cortical astrocytes. J Neurosci. 2006;26:2673–2683. doi: 10.1523/JNEUROSCI.4689-05.2006. [DOI] [PMC free article] [PubMed] [Google Scholar]
- Lalo U, Pankratov Y, Wichert SP, Rossner MJ, North RA, Kirchhoff F, Verkhratsky A. P2X1 and P2X5 subunits form the functional P2X receptor in mouse cortical astrocytes. J Neurosci. 2008;28:5473–5480. doi: 10.1523/JNEUROSCI.1149-08.2008. [DOI] [PMC free article] [PubMed] [Google Scholar]
- Lesage F, Lazdunski M. Molecular and functional properties of two-pore-domain potassium channels. Am J Physiol Renal Physiol. 2000;279:F793–F801. doi: 10.1152/ajprenal.2000.279.5.F793. [DOI] [PubMed] [Google Scholar]
- Lesage F, Reyes R, Fink M, Duprat F, Guillemare E, Lazdunski M. Dimerization of TWIK-1 K+ channel subunits via a disulfide bridge. EMBO J. 1996;15:6400–6407. [PMC free article] [PubMed] [Google Scholar]
- Li LY, Head V, Timpe LC. Identification of all inward rectifier potassium channel gene expressed in mouse cortical astrocytes. Glia. 2001;33:57–71. doi: 10.1002/1098-1136(20010101)33:1<57::aid-glia1006>3.0.co;2-0. [DOI] [PubMed] [Google Scholar]
- Matthias K, Kirchhoff F, Seifert G, Hüttmann K, Matyash M, Kettenmann H, Steinhäuser C. Segregated expression of AMPA-type glutamate receptors and glutamate transporters defines distinct astrocyte populations in the mouse hippocampus. J Neurosci. 2003;23:1750–1758. doi: 10.1523/JNEUROSCI.23-05-01750.2003. [DOI] [PMC free article] [PubMed] [Google Scholar]
- Megias M, Emri Z, Freund TF, Gulyas AI. Total number and distribution of inhibitory and excitatory synapses on hippocampal CA1 pyramidal cells. Neuroscience. 2001;102:527–540. doi: 10.1016/s0306-4522(00)00496-6. [DOI] [PubMed] [Google Scholar]
- Millar JA, Barratt L, Southan AP, Page KM, Fyffe REW, Robertson B, Mathie A. A functional role for the two-pore domain potassium channel TASK-1 in cerebellar granule neurons. Proc Natl Acad Sci U S A. 2000;97:3614–3618. doi: 10.1073/pnas.050012597. [DOI] [PMC free article] [PubMed] [Google Scholar]
- Mulligan SJ, MacVicar BA. Calcium transients in astrocyte endfeet cause cerebrovascular constrictions. Nature. 2004;431:195–199. doi: 10.1038/nature02827. [DOI] [PubMed] [Google Scholar]
- Nagelhus EA, Mathiisen TM, Ottersen OP. Aquaporin-4 in the central nervous system: cellular and subcellular distribution and coexpression with KIR4.1. Neuroscience. 2004;129:905–913. doi: 10.1016/j.neuroscience.2004.08.053. [DOI] [PubMed] [Google Scholar]
- Neusch C, Rozengurt N, Jacobs RE, Lester HA, Kofuji P. Kir4.1 potassium channel subunit is crucial for oligodendrocyte development and in vivo myelination. J Neurosci. 2001;21:5429–5438. doi: 10.1523/JNEUROSCI.21-15-05429.2001. [DOI] [PMC free article] [PubMed] [Google Scholar]
- Neusch C, Papadopoulos N, Müller M, Maletzki I, Winter SM, Hirrlinger J, Handschuh M, Bähr M, Richter DW, Kirchhoff F, Hülsmann S. Lack of the Kir4.1 channel subunit abolishes K+ buffering properties of astrocytes in the ventral respiratory group: impact on extracellular K+ regulation. J Neurophysiol. 2005;95:1843–1852. doi: 10.1152/jn.00996.2005. [DOI] [PubMed] [Google Scholar]
- Newman E, Reichenbach A. The Muller cell: a functional element of the retina. Trends Neurosci. 1996;19:307–312. doi: 10.1016/0166-2236(96)10040-0. [DOI] [PubMed] [Google Scholar]
- Nolte C, Matyash M, Pivneva T, Schipke CG, Ohlemeyer C, Hanisch UK, Kirchhoff F, Kettenmann H. GFAP promoter-controlled EGFP-expressing transgenic mice: a tool to visualize astrocytes and astrogliosis in living brain tissue. Glia. 2001;33:72–86. [PubMed] [Google Scholar]
- Olsen ML, Higashimori H, Campbell SL, Hablitz JJ, Sontheimer H. Functional expression of Kir4.1 channels in spinal cord astrocytes. Glia. 2006;53:516–528. doi: 10.1002/glia.20312. [DOI] [PMC free article] [PubMed] [Google Scholar]
- Orkand RK. Glial-interstitial fluid exchange. Ann N Y Acad Sci. 1986;481:269–272. doi: 10.1111/j.1749-6632.1986.tb27157.x. [DOI] [PubMed] [Google Scholar]
- Päsler D, Gabriel S, Heinemann U. Two-pore-domain potassium channels contribute to neuronal potassium release and glial potassium buffering in the rat hippocampus. Brain Res. 2007;1173:14–26. doi: 10.1016/j.brainres.2007.07.013. [DOI] [PubMed] [Google Scholar]
- Patel AJ, Honoré E, Maingret F, Lesage F, Fink M, Duprat F, Lazdunski M. A mammalian two pore domain mechano-gated S-like K+ channel. EMBO J. 1998;17:4283–4290. doi: 10.1093/emboj/17.15.4283. [DOI] [PMC free article] [PubMed] [Google Scholar]
- Pessia M, Tucker SJ, Lee K, Bond CT, Adelman JP. Subunit positional effects revealed by novel heteromeric inwardly rectifying K+ channels. EMBO J. 1996;15:2980–2987. [PMC free article] [PubMed] [Google Scholar]
- Poopalasundaram S, Knott C, Shamotienko OG, Foran PG, Dolly JO, Ghiani CA, Gallo V, Wilkin GP. Glial heterogeneity in expression of the inwardly rectifying K+ channel, Kir4.1, in adult rat CNS. Glia. 2000;30:362–372. doi: 10.1002/(sici)1098-1136(200006)30:4<362::aid-glia50>3.0.co;2-4. [DOI] [PubMed] [Google Scholar]
- Rusznak Z, Pocsai K, Kovacs I, Por A, Pal B, Biro T, Szucs G. Differential distribution of TASK-1, TASK-2 and TASK-3 immunoreactivities in the rat and human cerebellum. Cell Mol Life Sci. 2004;61:1532–1542. doi: 10.1007/s00018-004-4082-3. [DOI] [PMC free article] [PubMed] [Google Scholar]
- Schröder W, Hager G, Kouprijanova E, Weber M, Schmitt AB, Seifert G, Steinhäuser C. Lesion-induced changes of electrophysiological properties in astrocytes of the rat dentate gyrus. Glia. 1999;28:166–174. [PubMed] [Google Scholar]
- Schröder W, Seifert G, Hüttmann K, Hinterkeuser S, Steinhäuser C. AMPA receptor-mediated modulation of inward rectifier K(+) channels in astrocytes of mouse hippocampus. Mol Cell Neurosci. 2002;19:447–458. doi: 10.1006/mcne.2001.1080. [DOI] [PubMed] [Google Scholar]
- Seifert G, Steinhäuser C. Glial cells in the mouse hippocampus express AMPA receptors with an intermediate Ca2+ permeability. Eur J Neurosci. 1995;7:1872–1881. doi: 10.1111/j.1460-9568.1995.tb00708.x. [DOI] [PubMed] [Google Scholar]
- Seifert G, Rehn L, Weber M, Steinhäuser C. AMPA receptor subunits expressed by single astrocytes in the juvenile mouse hippocampus. Mol Brain Res. 1997;47:286–294. doi: 10.1016/s0169-328x(97)00059-4. [DOI] [PubMed] [Google Scholar]
- Seifert G, Schilling K, Steinhauser C. Astrocyte dysfunction in neurological disorders: a molecular perspective. Nat Rev Neurosci. 2006;7:194–206. doi: 10.1038/nrn1870. [DOI] [PubMed] [Google Scholar]
- Shimada M, Akagi N, Goto H, Watanabe H, Nakanishi M, Hirose Y, Watanabe M. Microvessel and astroglial cell densities in the mouse hippocampus. J Anat. 1992;180:89–95. [PMC free article] [PubMed] [Google Scholar]
- Skatchkov SN, Eaton MJ, Shuba YM, Kucheryavykh YV, Derst C, Veh RW, Wurm A, Iandiev I, Pannicke T, Bringmann A, Reichenbach A. Tandem-pore domain potassium channels are functionally expressed in retinal (Muller) glial cells. Glia. 2006;53:266–276. doi: 10.1002/glia.20280. [DOI] [PubMed] [Google Scholar]
- Steinhäuser C, Berger T, Frotscher M, Kettenmann H. Heterogeneity in the membrane current pattern of identified glial cells in the hippocampal slice. Eur J Neurosci. 1992;4:472–484. doi: 10.1111/j.1460-9568.1992.tb00897.x. [DOI] [PubMed] [Google Scholar]
- Steinhäuser C, Jabs R, Kettenmann H. Properties of GABA and glutamate responses in identified glial cells of the mouse hippocampal slice. Hippocampus. 1994;4:19–36. doi: 10.1002/hipo.450040105. [DOI] [PubMed] [Google Scholar]
- Takumi T, Ishii T, Hori Y, Morishige K-I, Takahashi N, Yamada M, Yamashita T, Kiyama H, Sohmiya K, Nakanishi S, Kurachi Y. A novel ATP-dependent inward rectifier potassium channel expressed predominantly in glial cells. J Biol Chem. 1995;270:16339–16346. doi: 10.1074/jbc.270.27.16339. [DOI] [PubMed] [Google Scholar]
- Tanemoto M, Kittaka N, Inanobe A, Kurachi Y. In vivo formation of a proton-sensitive K+ channel by heteromeric subunit assembly of Kir5.1 with Kir4.1. J Physiol. 2000;525:587–592. doi: 10.1111/j.1469-7793.2000.00587.x. [DOI] [PMC free article] [PubMed] [Google Scholar]
- Volterra A, Meldolesi J. Astrocytes, from brain glue to communication elements: the revolution continues. Nat Rev Neurosci. 2005;6:626–640. doi: 10.1038/nrn1722. [DOI] [PubMed] [Google Scholar]
- Wallraff A, Odermatt B, Willecke K, Steinhäuser C. Distinct types of astroglial cells in the hippocampus differ in gap junction coupling. Glia. 2004;48:36–43. doi: 10.1002/glia.20040. [DOI] [PubMed] [Google Scholar]
- Wallraff A, Kohling R, Heinemann U, Theis M, Willecke K, Steinhäuser C. The impact of astrocytic gap junctional coupling on potassium buffering in the hippocampus. J Neurosci. 2006;26:5438–5447. doi: 10.1523/JNEUROSCI.0037-06.2006. [DOI] [PMC free article] [PubMed] [Google Scholar]
- Walz W. Role of astrocytes in the clearance of excess extracellular potassium. Neurochem Int. 2000;36:291–300. doi: 10.1016/s0197-0186(99)00137-0. [DOI] [PubMed] [Google Scholar]
- Wen H, Nagelhus EA, Amiry-Moghaddam M, Agre P, Ottersen OP, Nielsen S. Ontogeny of water transport in rat brain: postnatal expression of the aquaporin-4 water channel. Eur J Neurosci. 1999;11:935–945. doi: 10.1046/j.1460-9568.1999.00502.x. [DOI] [PubMed] [Google Scholar]
- Wigley R, Hamilton N, Nishiyama A, Kirchhoff F, Butt AM. Morphological and physiological interactions of NG2-glia with astrocytes and neurons. J Anat. 2007;210:661–670. doi: 10.1111/j.1469-7580.2007.00729.x. [DOI] [PMC free article] [PubMed] [Google Scholar]
- Wurm A, Pannicke T, Iandiev I, Wiedemann P, Reichenbach A, Bringmann A. The developmental expression of K+ channels in retinal glial cells is associated with a decrease of osmotic cell swelling. Glia. 2006;54:411–423. doi: 10.1002/glia.20391. [DOI] [PubMed] [Google Scholar]
- Xu HX, Cui NR, Yang ZJ, Qu ZQ, Jiang C. Modulation of Kir4.1 and Kir5.1 by hypercapnia and intracellular acidosis. J Physiol. 2000;524:725–735. doi: 10.1111/j.1469-7793.2000.00725.x. [DOI] [PMC free article] [PubMed] [Google Scholar]
- Zhou M, Kimelberg HK. Freshly isolated hippocampal CA1 astrocytes comprise two populations differing in glutamate transporter and AMPA receptor expression. J Neurosci. 2001;21:7901–7908. doi: 10.1523/JNEUROSCI.21-20-07901.2001. [DOI] [PMC free article] [PubMed] [Google Scholar]
- Zhou M, Schools GP, Kimelberg HK. Development of GLAST(+) astrocytes and NG2(+) glia in rat hippocampus CA1: mature astrocytes are electrophysiologically passive. J Neurophysiol. 2006;95:134–143. doi: 10.1152/jn.00570.2005. [DOI] [PubMed] [Google Scholar]