

Abstract
In teleost fish, the Mauthner (M) cell, a large reticulospinal neuron in the brainstem, triggers escape behavior. Spinal commissural inhibitory interneurons that are electrotonically excited by the M-axon have been identified, but the behavioral roles of these neurons have not yet been addressed. Here, we studied these neurons, named CoLo (commissural local), in larval zebrafish using an enhancer-trap line in which the entire population of CoLos was visualized by green fluorescent protein. CoLos were present at one cell per hemi-segment. Electrophysiological recordings showed that an M-spike evoked a spike in CoLos via electrotonic transmission and that CoLos made monosynaptic inhibitory connections onto contralateral primary motoneurons, consistent with the results in adult goldfish. We further showed that CoLos were active only during escapes. We examined the behavioral roles of CoLos by investigating escape behaviors in CoLo-ablated larvae. The results showed that the escape behaviors evoked by sound/vibration stimuli were often impaired with a reduced initial bend of the body, indicating that CoLos play important roles in initiating escapes. We obtained several lines of evidence that strongly suggested that the impaired escapes occurred during bilateral activation of the M-cells: in normal larvae, CoLo-mediated inhibitory circuits enable animals to perform escapes even in these occasions by silencing the output of the slightly delayed firing of the second M-cell. This study illustrates (1) a clear example of the behavioral role of a specialized class of interneurons and (2) the capacity of the spinal circuits to filter descending commands and thereby produce the appropriate behavior.
Introduction
For detailed functional analyses of particular types of neurons in the CNS, a key is to reproducibly identify the class of neuron during investigation. This has been difficult, particularly in vertebrates, because many types of neurons are present and often intermingled. The situation, however, is being overcome with the ability to visualize specific classes of neurons by green fluorescent protein (GFP). This has worked well in zebrafish for functional analyses of several classes of neurons (Kimura et al., 2006). Recent advances in the generation of enhancer/gene trap lines in this species (Kawakami, 2005) provide more chances to obtain useful transgenic fish. This report describes the use of an enhancer trap line for functional analyses of a class of commissural interneurons that plays an important role in escape behavior.
During sudden stimuli, fish perform an escape, which starts with a rapid bend of the body to one side. Mauthner (M) cells, a bilateral pair of large reticulospinal neurons in the brainstem, play an important role in initiating an escape: a single spike in one of the M-cells triggers an escape toward the contralateral side (Nissanov et al., 1990; Eaton et al., 2001; Korn and Faber, 2005). During Mauthner-triggered escapes, motoneurons on the side of the escape bend are activated, while those on the opposite side are almost simultaneously inhibited (Yasargil and Diamond, 1968). This suggested the presence of commissural inhibitory neurons that were instantaneously activated by the M-spike via electrical synapses (Diamond, 1971). These interneurons were subsequently identified by electrophysiological studies in goldfish (Fetcho and Faber, 1988) and by electron-microscopic studies in tench (Yasargil and Sandri, 1990).
However, several questions still remain. First, it remains elusive whether these neurons are present in larval fish. Second, the activity of these neurons during a different behavior, such as swimming, has not been clarified. This relates to an important general question, namely, to what extent is interneuron activity shared in different behaviors? Third, and most importantly, the functional roles of these neurons have not been shown. It remains unclear whether the fast inhibition mediated by these neurons plays a critical role in escape behavior.
We have addressed these issues by taking advantage of an enhancer trap line in which the entire population of these interneurons, named CoLo (commissural local), is visualized by GFP. We show that CoLos are present in the early larval stage at the rate of one cell per hemisegment and that CoLos fire specifically at the early phase of escape behavior. We further show that CoLos play a very important role in escape behavior. The present study strongly suggests that coactivation of both of the M-cells occurs during sound/vibration stimuli and that CoLo-mediated inhibitory circuits play a pivotal role in allowing animals to perform escapes in these occasions by silencing the output of the slightly delayed firing of the second M-cell. This study provides a compelling case for dedicated spinal interneurons and their behavioral role in the vertebrate spinal cord.
Materials and Methods
Animals.
Zebrafish adults, embryos, and larvae were maintained at 28.5°C. Experiments were performed at room temperature (23–28°C). All procedures were performed in compliance with the guidelines approved by the animal care and use committees of the National Institutes of Natural Sciences, the University of Tokyo, and Nagoya University. Animals were staged according to hours postfertilization (hpf) or days postfertilization (dpf).
Enhancer trap screening.
The Tol2-based enhancer trap construct, T2KHG, was used for establishing enhancer trap lines (Nagayoshi et al., 2008). The T2KHG construct contained the zebrafish hsp70 promoter (Halloran et al., 2000) and the gfp gene. The Tol-056 enhancer trap line identified in screening was outcrossed to the wild type for several generations and was used in experiments as a heterozygous condition.
Electroporation of rhodamine–dextran into single cells.
Single-cell labeling with rhodamine–dextran (3000 molecular weight; Invitrogen) by electroporation was performed essentially as described previously (Bhatt et al., 2004).
Antibody and in situ hybridization staining.
Antibody and in situ hybridization staining were performed as described previously (Higashijima et al., 2004a,c; Kimura et al., 2006). To detect neuronal connexin (Cx35/36), we used monoclonal anti-Cx35 (MAB3045; Millipore Bioscience Research Reagents) raised against recombinant fusion protein of perch Cx35 (Pereda et al., 2003). The cyanine 5-conjugated F(ab′)2 fragment of donkey anti-mouse IgG (Jackson ImmunoResearch) was used as a secondary antibody.
Neurobiotin staining.
Neurobiotin (Vector Laboratories) was loaded into M-cells by a standard patch-clamp method (see below). Whole-cell situations were maintained for at least 1 h. Positive current pulses were periodically injected through the pipette to facilitate dye loading. Animals were then fixed overnight with 4% paraformaldehyde in PBS. After the fixation, samples were first treated with VECTASTAIN Elite ABC kit (Vector Laboratories), and then the signal was visualized using a TSA kit with Alexa Fluor 647 (Invitrogen) according to the instructions of the manufacturer.
Electrophysiology.
Patch-clamp and ventral root (VR) recordings were performed as described previously (Higashijima et al., 2004c; Kimura et al., 2006) with some modifications. Recordings were mainly performed using 3 dpf (3.0–3.6 dpf) and 4 dpf (4.0–4.6 dpf) larvae. Larvae were immobilized by soaking them in the neuromuscular blocker α-bungarotoxin (0.1 mg/ml in distilled water; Sigma) or d-tubocuarine (0.1 mg/ml in distilled water; Sigma) for 5–15 min and then pinned through the notochord to a Sylgard-coated, glass-bottomed dish with short pieces of fine tungsten pins. Animals were then covered with extracellular recording solution that contained the following (in mm): 134 NaCl, 2.9 KCl, 1.2 MgCl2, 2.1 CaCl2, 10 HEPES, and 10 glucose, adjusted to pH 7.8 with NaOH. For the animals that were immobilized with d-tubocuarine, the same reagent at a concentration of 0.01 mm was added to the recording solution throughout the experiments. The skin covering body segments 11–15 was removed with a pair of forceps. Collagenase (0.03%; Sigma) in a recording solution was then applied to the preparation for 5–15 min. While animals were in the collagenase solution, muscle fibers of the skinless region were carefully removed manually with a pair of forceps. CoLos were recorded in this region (segments 11–15). For paired recording between Mauthner and CoLo cells, the forebrain region was pierced with tungsten pins such that the head showed near-vertical orientation. The skin covering the hindbrain was removed using a pair of forceps. Then, neuronal tissues overlying the M-cell were removed by a pair of forceps for easier patch electrode access to the M-cell. Because this procedure could have damaged the neuronal circuits surrounding the M-cell, we used it only for paired recording between M-cells and CoLos. For paired recording between VR and the CoLo neuron, the skin covering the rostral region of the trunk body (segments 5–10) was removed. VR recordings were made in this region (typically, segments 6–9). Therefore, VR recording sites were always rostral to the patch electrode recording site. For paired recording between CoLo neurons (bottom side) and primary motoneurons (top side), neuronal tissues overlying CoLos were carefully removed with a pair of forceps for easier access to a patch electrode to the CoLo neuron. Removal of the neuronal tissues was restricted to a small region. Care was taken not to damage the middle to ventral region of the spinal cord, because primary motoneurons to be recorded were located there. Targeting of electrodes to primary motoneurons was made based on their location (middle region of the spinal cord) and their large soma size. Because axons of CoLos are short, primary motoneurons located near the recorded CoLos were targeted. After the recordings, identities of primary motoneurons were verified by their torn axons at the lateral edge of the ventral spinal cord.
The preparations were observed using a 40× water-immersion objective (numerical aperture, 0.8) on an upright microscope (BX51WI; Olympus) fitted with differential interference contrast (DIC) optics. To elicit fictive locomotion, a stimulation bipolar electrode was placed near the otolith. For the VR and CoLo neuron recordings, the electrode was placed on the bottom side, such that the motor activities associated with escapes would occur on the top side where the VR and CoLo neuron recordings were made. For the CoLo neuron and primary motoneuron recordings, the electrode was placed on the top side, because the recorded CoLo neuron was located on the bottom side. A stimulus strength of 7–20 V for a duration of 0.2–1.0 ms was used to elicit fictive motor behavior. Two types of constant voltage stimulators were used: model DS2 (Digitimer) and model 2100 (A-M Systems). For preparations older than 4 dpf, fictive locomotion was also elicited by changing the illumination intensity. Auditory stimulations, which were used to elicit escapes in behavioral experiments (see below), were not applied in electrophysiological experiments, because auditory stimulations strong enough to elicit escapes would abolish patch recordings.
Electrodes for VR recordings were pulled from borosilicate glass (model GC150TF-7.5, inner diameter of 1.17 mm, outer diameter of 1.5 mm; Harvard Apparatus) on a model P-97 micropipette puller (Sutter Instruments). Electrodes with a tip diameter of 15–30 mm were filled with the extracellular recording solution. Patch electrodes were pulled from borosilicate glass (model GC150F-7.5, inner diameter of 0.86 mm, outer diameter of 1.5 mm; Harvard Apparatus) on the same puller. Resistance of the electrodes was 15–25 MΩ for CoLo neuron and primary motoneuron recordings, whereas it was 6–15 MΩ for Mauthner cell recordings. We used two different patch solutions, one containing (in mm), 120.7 K-gluconate, 4.3 KCl, 2.4 MgCl2, 10 HEPES, 10 EGTA, and 4 Na2ATP, adjusted to pH 7.2 with KOH, and the other containing a higher concentration of chloride (in mm: 110 K-gluconate, 15 KCl, 2 MgCl2, 10 HEPES, 10 EGTA, and 4 Na2ATP, adjusted to pH 7.2 with KOH). The calculated chloride reversal potential of the former solution was −70 mV, whereas the latter was −51 mV. The calculated liquid junction potentials for which we corrected were 15 and 14 mV, respectively. The vast majority (>90%) of our recordings were made with the former solution. All data presented in the figures were obtained using this solution. Electrophysiological recordings were performed using MultiClamp700B amplifiers and digitized with Digidata1322A or Digidata1440A (all equipment was from Molecular Devices). Neurons were labeled with 0.005% Alexa Fluor 594 hydrazide (Invitrogen) in patch solution. In some experiments, 0.2% Neurobiotin (Vector Laboratories) was included in the patch solution. After the recordings, fluorescent images were acquired with a CCD camera (XC-ES51; Sony) and a frame grabber (LG3; Scion) or a FV300 confocal unit (Olympus). Pharmacological reagents used were as follows: 10 μm CNQX (Tocris Cookson), 50 μm d-AP-5 (Tocris Cookson), 100 μm mecamylamine (Sigma), and 1 μm carbenoxolone (Sigma). Latency of synaptic responses was measured from the peak of the presynaptic spike to the onset of the responses.
Average spike numbers per escape were calculated using the values of five independent escapes. Only those trials in which CoLo spikes occurred were analyzed. In some cells, data were available for less than five successful trials. In these cases, average spike numbers from all the successful trials were used for the calculation.
Laser ablation.
Laser ablation of Mauthner and CoLo neurons was performed using a MicroPoint pulsed nitrogen laser (Photonic Instruments), with an Axioscope FS upright microscope and a 40× (numerical aperture, 0.8) water-immersion objective lens (Zeiss). This system allowed the selective targeting of GFP-labeled cells that were ablated by a short series of laser pulses. For M-cell ablation, embryos heterozygous for both Tol-056 and Tol-026 were used. In the Tol-026 enhancer trap line, GFP was expressed in the M-cells and other neurons in the hindbrain. GFP expression in the M-cells was apparent in 30 hpf larvae. We performed M-cell ablation at this stage, because 30 hpf embryos showed less intense pigmentation, which made laser ablation of M-cells easier. Successful ablation was confirmed by the absence of GFP fluorescence in the corresponding region 1 d after the laser treatment. For the ablation of CoLos, animals at 2.2–2.5 dpf were used. Ablation of CoLos at older stages sometimes resulted in the degeneration of M-axons. Because CoLos are connected to the M-axon via gap junctions, the death of a large number of CoLos appeared to have negative effects on the health of the M-axons if the ablation was made in older larvae. Ablation of CoLos at ∼2.2–2.5 dpf did not cause this problem. Ablation of CoLos was confirmed by observing the degeneration of the cells under DIC optics.
Behavioral analyses.
Larvae at the age of 5 dpf (5.3–5.8 dpf) were used for behavioral analyses. A custom-made sound/vibration stimulation apparatus was used to elicit fast escapes. The apparatus was made of a quadrilateral transparent plastic sheet (75 × 180 × 2.0 mm height), to which an audio speaker (cone diameter, 75 mm) was attached with screws. A glass Petri dish 45 mm in diameter was tightly attached to the plastic sheet with dental wax. Sponge rubber was attached to the four corners of the bottom of the apparatus. The apparatus was set on a dissecting microscope table using double-sided sticky tape that was applied to the sponge rubber. Water was poured into the dish (∼9 mm in height), and a larva was placed in the dish; larvae were examined individually. A stimulation wave (10 ms duration of 500 Hz sine waveform; five cycles) was generated by a function generator (FG-281; TEXIO), amplified by an audio amplifier, and delivered to the speaker. Amplitude of the sound was such that it was ∼90 dB when measured at a distance of 15 cm. The acceleration amplitude of the apparatus associated with the stimulus was ∼80 m/s2 in the vertical dimension. In this condition, larvae showed fast escape responses (latency, <15 ms) with >80% probability. Sequential images of larval locomotion (every 1 ms) were captured with high-speed digital cameras mounted on the dissection microscope. Two types of cameras were used. One was a VCC-1000 (Digimo) with 256 × 256 pixels, and the other was a Fastcam Ultima 1024 (Photron) with 1024 × 512 pixels. The function generator and the high-speed camera were triggered by a transistor–transistor logic stimulation pulse. Latency was defined as the time between the onset of the sound pulse (arrival of the trigger signal) and the beginning of body movement. Responses with latency shorter than 15 ms were analyzed. Successive trials were separated by at least 2 min. The image field of the camera was set near the center of the dish. Larvae that stayed still in this image field were the subjects of the trials. Some larvae seldom came to the center of the dish; for these larvae, we were unable to perform many trials. Consequently, the number of trials performed for each larva was variable. In a minority of cases, larvae started spontaneous movements before the arrival of sound/vibration stimuli. These trials were excluded from the data analyses.
The body shapes of the larvae in the captured images were analyzed with BohBoh (BohBoh Software), a motion tracker/shape analyzer originally developed for the analysis of flagellar or ciliar beating (Baba and Mogami, 1985; Shiba et al., 2005; Wood et al., 2005). The higher-resolution images captured with the Fastcam Ultima 1024 (1024 × 512 pixels) were used for the analyses. The midline of the larval body in each image was semiautomatically traced with quasi-evenly spaced points. In our experiments, magnification of the microscope was set such that the body length corresponded to ∼300 pixels in the captured image. Because the software draws approximately one point per pixel, the midline of the body was traced with ∼300 drawn points. BohBoh software was used to calculate length and curvature using the drawn points. Images at a time point of 6 ms after the onset of the movement were chosen for curvature analyses. For curvature calculation at each position, drawn points covering ∼10% of the body length were used. For example, for calculation of the curvature at midbody (position 0.5), drawn points covering positions 0.45–0.55 were used.
Calcium imaging.
Calcium imaging of M-cells was performed as described previously (O'Malley et al., 1996; Takahashi et al., 2002; Kohashi and Oda, 2008). Briefly, M-cells were labeled with a fluorescent Ca2+ indicator, Calcium Green dextran (3000 or 10,000 molecular weight; Invitrogen) by injecting the dye into the spinal cord of 4 or 5 dpf wild-type larvae. After the injection, larvae were allowed to recover in 10% HBSS for >5 h. Larvae at the age of 5.3–5.8 dpf were then mounted on low-melting point agarose (1.5%; Nacalai Tesque) in glass-bottomed 35 mm plastic dishes in an upright position. Larvae were mounted in a near-vertical position, such that the left and right M-cells were in approximately the same focal plane during the subsequent observations. The preparation was overlain with HBSS (10%) to a water height of 3–4 mm. The dish was then attached to the sound/vibration stimulation apparatus (described above) with an orientation such that the head faced toward the audio speaker. The setting was placed on a BX51WI upright microscope equipped with a FV300 confocal unit (Olympus). A 40× water-immersion objective (numerical aperture, 0.8) was used for the observations. M-cells were illuminated with a 488 nm argon laser, and sequential confocal images (at ∼400 ms intervals) were taken with a fully open pinhole. A trigger signal, generated by the confocal scanner, was used to deliver a time-locked sound/vibration stimulation to the specimen. The stimulation was applied near the beginning of the eighth frame (2.8 s after the initiation of the first frame scan). M-cells were placed near the center of the scanning field in the Y dimension. Considering the ∼400 ms of scanning time per frame, the center of the field in each frame was scanned ∼200 ms after the initiation of scanning. We added this time delay for timescaling. After Ca2+ imaging with the sound/vibration stimuli, d-tubocurarine was added to the solution (final concentration, 0.1 mg/ml) to immobilize the larvae. Then, fluorescence responses associated with antidromic (AD) spikes were examined as described previously (Kohashi and Oda, 2008). For illustration purposes, the images were smoothed to reduce pixel-to-pixel noise. All quantification, however, was performed on the raw data. Line-scan experiments were performed as described by O'Malley et al. (1996). For the quantification of line-scan experiments, fluorescence intensity change associated with AD spikes (from +100 to +250 ms) was averaged, and this averaged value was used for normalization. Smoothing of images was not performed for the presentation of the line-scan experiment.
Results
Tol-056 enhancer trap line labels a specific class of commissural neurons, CoLos
The Tol-056 enhancer trap line was identified in our enhancer trap screening for transgenic zebrafish in which GFP was expressed in a limited number of CNS neurons. In the hindbrain, intense GFP expression was observed in the pair of M-cells (Fig. 1 A). GFP expression in the M-cell was initiated at ∼2.2 dpf, and the intense labeling was maintained for at least 5 dpf. In the spinal cord, GFP fluorescence was observed in the M-axons (Fig. 1 B). In addition, two classes of neurons were positive for GFP. One was the Kolmer–Agduhr neurons located near the bottom of the spinal cord (Roberts and Clarke, 1982; Higashijima et al., 2004b). The other class of neurons, located in a lateral region of the spinal cord (Fig. 1 B, arrows), were the focus of the present study. As described below, they are commissural neurons with relatively short axons, leading us to refer to them as CoLo neurons. Several other cells also weakly expressed GFP in the spinal cord. The significant difference in fluorescent intensity, however, made the CoLos clearly apparent.
Figure 1.

GFP expression in the Mauthner cells and CoLo neurons in the Tol-056 enhancer trap line. A, Dorsal view of a 4 dpf larva. Rostral is to the top (the same for all subsequent figures of dorsal views). Stacked image of confocal optical sections. GFP expression is present in a pair of Mauthner cells in the hindbrain. B, Lateral view of the spinal cord of a 4 dpf larva. Dorsal is to the top, and rostral to the left (the same for all subsequent figures of lateral views). Stacked image of confocal optical sections. GFP expression is present in the M-axon, Kolmer–Agduhr neurons (arrowheads), and CoLo neurons (arrows). C, Lateral view of the spinal cord of a 3.5 dpf larva. Diagonal dashed lines demarcate segment boundaries. Hash marks indicate basis for numerical position measurements (labeled under the CoLo neurons). D, Plot of the number of CoLo neurons versus their position. Three segments of the rostral region (segments 6–8; red bar) and three of the caudal region (segments 16–18; blue bar) were examined from 10 fish at 3.5 dpf (30 segments were examined for each region). Total CoLo cell numbers for each region are 36 (S6–S8) and 34 (S16–S18). E, Double in situ hybridization of gfp and glyt2 in a 3 dpf larva. The gfp-positive CoLo neuron was also positive for glyt2.
GFP fluorescence in CoLos became discernable at ∼40 hpf and was present for at least 5 dpf. We first examined the location and distribution of CoLos. CoLos were located in a near-fixed position along the dorsoventral axis (Fig. 1 B,C): ∼70% of the distance from the bottom of the spinal cord. In the rostral two-thirds of the spinal cord (segments 1–20), CoLos were present at the rate of approximately one CoLo per hemisegment throughout the stage we examined (supplemental Fig. 1A; see also supplemental Fig. 4A, available at www.jneurosci.org as supplemental material) (note that, in Fig. 1 B, CoLos on both sides of the spinal cord are shown in the confocal stacked image). Furthermore, CoLos tended to be present in a regularly spaced manner at their preferential position within a segment (Fig. 1 C). Quantitative analyses using 3.5 dpf larvae showed that the regular distribution pattern was stricter in the rostral region of the spinal cord than in the caudal region (Fig. 1 D). In farther caudal regions (caudal to the 20th segment), CoLo distribution became more sparse, and, ultimately, there were no CoLos near the tail (this was also true in 4.5 dpf larvae).
We examined the neurotransmitter property of CoLos by performing dual in situ hybridization with gfp and markers of neurotransmitter properties (Higashijima et al., 2004a). The result, as shown in Figure 1 E, indicated that CoLos were positive for glycine transporter2 (glyt2), strongly suggesting that CoLos are glycinergic inhibitory neurons.
We then examined the morphology of CoLo neurons by loading rhodamine–dextran or Alexa Fluor 594 into individual CoLo neurons through electroporation (Bhatt et al., 2004; Kimura et al., 2006) or whole-cell recordings, respectively. We have observed >100 CoLos, and essentially all of these had the same morphological features throughout the stages examined (2–4 dpf). CoLos had a simple, spherical soma (Fig. 2 A–D) (the morphologies of the CoLo neurons shown in Fig. 2, A and B, are also provided in supplemental Movies 1 and 2, respectively, available at www.jneurosci.org as supplemental material). The somata were located in the most superficial region of the cell layer of the spinal cord. In cross sections, tiny dendritic processes that extended toward the superficial mantle layer were occasionally observed (Fig. 2 D, thin arrow). From the ventral side of the soma, a thin axon came out and extended ventrally (Fig. 2 A–D). After encountering the M-axon on its dorsal side (Fig. 2 D, fat arrowhead), the CoLo axon thickened and crossed the spinal cord by taking a route dorsal to the M-axon (Fig. 2 D, thick arrow). On the contralateral side, the robust CoLo axon mainly descended and ran along the contralateral M-axon (Fig. 2 E), sending off several collaterals (Figs. 2 A,B,E). In ∼70% of CoLos, a relatively short ascending axonal branch, which also ran near the M-axon, was observed (Fig. 2 A). The axonal length of the CoLo neurons on the contralateral side (the total length of descending and ascending branches) was short: ∼1.1–1.2 body segments (supplemental Fig. 1B, available at www.jneurosci.org as supplemental material).
Figure 2.
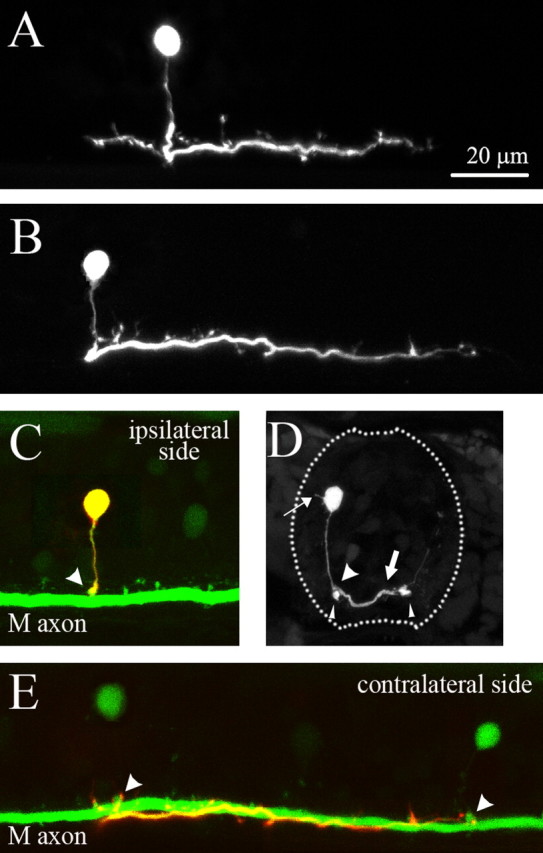
Morphology of CoLo neurons. Rhodamine–dextran was loaded to individual CoLo neurons by electroporation. A, A confocal stacked image of a CoLo neuron at 3 dpf. B, A confocal stacked image of a CoLo neuron at 4 dpf. C, The same sample as the one shown in B. Only the optical sections on the ipsilateral side are stacked. Green indicates GFP signal, whereas red indicates rhodamine signal. Because the rhodamine-labeled CoLo neuron also had GFP, the CoLo neuron is indicated by a yellow signal. The arrowhead indicates the contact sites between the M-axon and the CoLo axon. The contact sites are evident as lumps of GFP signal. The lumps are more clearly visible in E. D, A cross section. The thin arrow shows a dendritic process. The slim arrowheads show the M-axons. The thick arrow shows a CoLo axon crossing the spinal cord. The fat arrowhead indicates the contact site between the CoLo axon and M-axon. E, The same sample as the one shown in B. Only the optical sections on the contralateral side are stacked. The two green cells are CoLo neurons on the contralateral side (different from the rhodamine-labeled CoLo neuron). The arrowheads indicate the contact sites between the M-axon and the axons of the contralateral CoLos. The contact sites are evident as lumps of GFP signal. Processes from the rhodamine-labeled CoLo axon appear to terminate near the contact sites.
CoLos were not observed in our previous survey of glycinergic neurons in larval zebrafish (Higashijima et al., 2004b), presumably attributable to their short axons, which were difficult to reveal by retrograde filling. However, studies for investigating spinal neuronal circuits of M-cells in adult goldfish and tench have revealed a similar morphological type of cells: commissural inhibitory neurons that receive gap junctional inputs from the M-axon (Yasargil and Sandri, 1987; Fetcho and Faber, 1988; Fetcho, 1990; Yasargil and Sandri, 1990). This leads us to speculate that CoLos are zebrafish homologs of these commissural neurons.
Gap junctional inputs from the M-axon drive CoLo spikes
To investigate whether CoLo neurons receive direct inputs from the M-cell, we performed paired recordings between M-cells and the contralateral CoLos (Fig. 3). Recordings were obtained in eight pairs (six at 3 dpf and two at 4 dpf). In all the pairs, connections were present. Figure 3 B–F shows a representative example. Firing the M-cell with a somatic current injection produced short-latency depolarizing responses in the CoLo (Fig. 3 C). For each pair, the latencies of the responses were very short and constant (<0.1 ms of SD for each pair) (Fig. 3 D). The depolarization responses showed very steep rises and sharp peaks (Fig. 3 C,D). Then the membrane voltage slowly returned to the baseline. The presence of sharp peaks is consistent with the idea that the responses were mediated by electrotonic synapses. These responses could be either subthreshold electrical PSPs or spikes that were instantaneously evoked by electrical PSPs; as will be described later, the latter was the case. The small spike amplitude (ranging from 6 to 16 mV, depending on pairs) was likely the result of the spike-initiating region being located a relatively long distance from the recording site at the soma. We speculate that spikes were initiated near the contact site between the M-axon and the CoLo axon.
Figure 3.
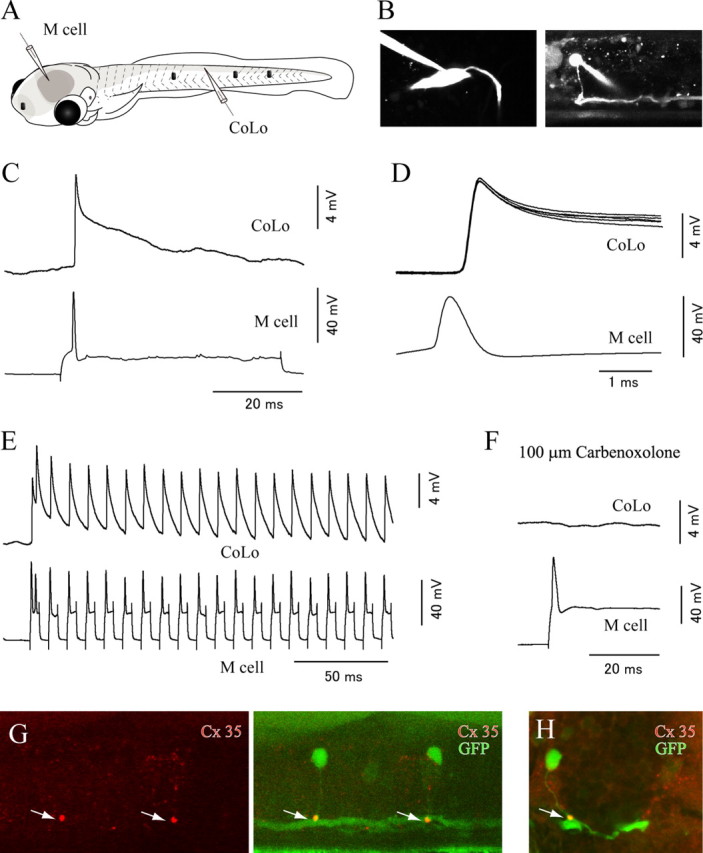
The Mauthner cell makes electrical synapses onto CoLo neurons. A, A schematic illustration of the paired patch recordings between an M-cell and a CoLo neuron. The black dots represent tungsten holding pins. B, Images of the M-cell (left) and the CoLo neuron (right) after the electrophysiological recordings shown in C–F. Larva at 4 dpf. C, The current-evoked spike of the M-cell led to a fast and sharp depolarizing response (∼10 mV in amplitude) in the CoLo neuron. This sharp depolarizing response represents a spike in the CoLo neuron (see Fig. 5 and Results). D, Five superimposed traces of CoLo spikes evoked by M-cell spikes. The traces show short, constant latency spikes. Only one spike in the M-cell is shown for simplicity. Traces of voltage responses in the CoLo neuron are aligned with the peak of the spikes in the M-cell. E, Responses of the CoLo neuron on 100 Hz spikes of the M-cell. CoLo spikes perfectly followed M-spikes with the same amplitude in each spike. F, Response of the CoLo neuron was eliminated after treatment with 100 μm Corbenoxolone (a gap junction blocker) for 15 min. G, Lateral view of immunostaining with Cx35. A stacked image of confocal optical sections. The left shows staining of Cx35, whereas the right shows a merged image of Cx35 and GFP. The intense Cx35 signals (arrows) are observed at the contact sites between CoLo axons and the M-axon. H, A cross section. The arrow shows an intense signal of Cx35.
To further demonstrate that the spikes were driven by electrotonic synapses, M-spikes were elicited at a frequency of 100 Hz, at which responses by chemical synapses would likely be diminished. In the two cases tested, the spikes of CoLos faithfully followed the M-spikes with the same amplitudes (Fig. 3 E). We also tested pharmacology. Application of a mixture of CNQX, AP-5, and mecamylamine, which would block chemical excitatory transmission, had no effect on the sharp CoLo responses (n = 2) (supplemental Fig. 2, available at www.jneurosci.org as supplemental material). Instead, the responses became negligible after the application of the gap junction blocker carbenoxolone (n = 2) (Fig. 3 F). These results indicated that spiking activities of CoLos were driven by the M-cell spikes via electrotonic synapses. This establishes that CoLos are indeed zebrafish homologs of Mauthner-driven commissural neurons that were previously identified in adult goldfish and tench.
Gap junctions in CNS electrotonic synapses are known to be mainly composed of neuron-specific connexin (Cx36 in the case of mammals) (Rash et al., 2001). We investigated whether neuronal connexin was present near the contact site between the M-axon and the CoLo axon by performing immunostaining with a monoclonal antibody against perch Cx35, which is a fish homolog of mammalian Cx36 (O'Brien et al., 1998; Pereda et al., 2003). As expected, intense signals were observed at the contact site between the M-axon and the CoLo axon (Fig. 3 G,H). This strongly suggests that these labeled spots were the sites of Mauthner–CoLo electrical synapses. Among all the immunostained signals in the spinal cord, the staining intensity of the Mauthner–CoLo synapses was by far the strongest (Fig. 3 G).
Next, we investigated whether dye coupling between the M-axon and the CoLo neuron could be observed. For this purpose, Neurobiotin, a small molecule that often passes through gap junctions, was loaded into the M-cells by whole-cell recordings, and subsequently the samples were processed for Neurobiotin staining (Fig. 4 A,B). In the spinal cord, one of the M-axons was labeled (Fig. 4 B, arrow). In addition, CoLos located on the side of the labeled M-axon were labeled (Fig. 4 B), indicating that Neurobiotin passed through the gap junctions of the Mauthner–CoLo synapses. We observed midbody segments (around segments 8–15) from six larvae (3 dpf), and the results showed that the Neurobiotin-labeled cells perfectly overlapped with GFP-labeled CoLos (total number of cells examined, >30). This indicates that the entire population of CoLos was visualized in the Tol-056 line.
Figure 4.

Dye coupling between the Mauthner cell and CoLo neurons. Neurobiotin was loaded into one of the M-cells in a 3 dpf larva, and the sample was processed for Neurobiotin staining. A, In the hindbrain, one of the M-cells along with its axon shows Neurobiotin staining (red signal). B, In the spinal cord, CoLo neurons as well as the M-axon (arrow) show Neurobiotin staining, indicating that the CoLo cells are connected to the Mauthner axon via gap junctions.
CoLos make monosynaptic inhibitory connections onto contralateral primary motoneurons
In adult goldfish, CoLo-corresponding neurons make monosynaptic inhibitory connections onto contralateral primary motoneurons (Fetcho, 1990). To investigate whether the same connections were present in larval zebrafish, we performed paired recordings between CoLos and contralateral primary motoneurons using 3 dpf larvae.
Recordings were obtained in four pairs, and, in three of the four, direct connections were observed (in the one case with no connection, the CoLo axon did not reach the primary motoneuron). A representative example is shown in Figure 5, in which the CoLo neuron and the primary motoneuron were recorded in a current-clamp and a voltage-clamp mode, respectively. The firing threshold of the CoLo neuron with current injections into the soma was high: >50 mV of depolarization at the recording site was usually needed to reach the threshold (Fig. 5 C), consistent with the idea that the spike was initiated away from the soma. After reaching the threshold, the CoLo showed a single, small-amplitude spike (Fig. 5 C, thin arrow), which evoked outward current in the primary motoneuron (Fig. 5 C, thick arrow). Considering the −50 mV of holding potential in our recordings, this outward current most likely corresponds to an IPSC (the calculated chloride reversal potential of the recording solution was −70 mV). The latencies of the responses were very short (<0.2 ms for all three pairs) and constant (<0.1 ms of SD for each pair) (Fig. 5 D). These unusually short latencies for chemical transmissions (usually >0.5 ms) probably reflect (1) the proximity of the recorded primary motoneuron from the spike-initiation site of the CoLo (CoLo–Mauthner contact site) and (2) the time delay of spike detection, caused by back-propagation of a spike to the CoLo soma. The short and constant latency responses, in any case, indicate that the connections were monosynaptic. We thus conclude that CoLos make monosynaptic inhibitory connections onto contralateral primary motoneurons. The results also provide supportive evidence that the small-amplitude, sharp responses recorded in the CoLo somata represented spikes.
Figure 5.

Paired recording between the CoLo neuron and the primary motoneuron. A, A schematic illustrates the paired recording shown in B–F. The recording was made using a 3 dpf larva. A stimulation electrode was placed near the ear on the top side. One patch electrode was placed targeting the primary motoneuron (PM) on the top side, whereas the other patch electrode was placed targeting the CoLo neuron on the bottom side. The black dots represent tungsten holding pins. B, The pictures show images of the recorded cells. Montages were made to show the morphology of each cell. The left shows the morphology of a primary motoneuron. The arrow shows its torn axon at the edge of the spinal cord. The image of a CoLo soma located on the opposite side of the spinal cord is superimposed for the comparison of relative locations of the two cells. The right shows the morphology of the CoLo neuron. C, In this experiment, and the experiments shown in D–F, the CoLo neuron was recorded in a current-clamp mode, whereas the primary motoneuron was recorded in a voltage-clamp mode with the holding potential at −50 mV. The chloride reversal potential calculated with the experimental condition is −70 mV. The left shows that there was no response in the primary motoneuron when the depolarizing pulse in the CoLo was below threshold, whereas the right shows that, during a current pulse above the threshold, an evoked CoLo spike (thin arrow) leads to an IPSC in the primary motoneuron (thick arrow). D, Five superimposed traces of IPSCs in the primary motoneuron. The traces show short, constant latency IPSCs. Only one spike in the CoLo neuron is shown for simplicity. E, Responses of the CoLo neuron and the primary motoneuron during an escape trial. An electrical stimulation was applied at the time point marked by the asterisk. With a short latency from the stimulus, the CoLo neuron expressed several successive spikes (labeled as “spikes”). These spikes likely correspond to the activity associated with an escape (Fig. 6). The primary motoneuron received IPSCs during the escape. The timing of the earliest IPSC (arrow) coincides with the first CoLo spike. The timing of the second IPSC (dot) does not coincide with any of the CoLo spikes. F, Five superimposed traces of IPSCs in the primary motoneuron and spikes in the CoLo neuron. In all traces, the timings of the earliest IPSCs (arrow) perfectly coincide with those of the first CoLo spikes. Subsequently, the primary motoneuron received IPSCs at various timings (dots) that are not related to CoLo spikes.
In the experiment shown in Figure 5, fictive escapes were elicited by applying electrical stimulations around the ear. We expected that these stimulations would activate the auditory nerves and that this in turn would activate the M-cell. In addition to the M-cell, other reticulospinal neurons that are important for initiating escape behavior could also be activated (O'Malley et al., 1996; Kohashi and Oda, 2008). Stimulations were applied to the contralateral side of the recorded CoLo neuron so that that side of the recorded CoLo neuron would initiate escape (Fig. 5 A). CoLos often showed several successive spikes during escapes (“spikes” in Fig. 5 E) (see the following section for more details). The amplitude of each spike (∼10 mV) was comparable with that obtained in paired recordings between M-cells and CoLos. Not all of the CoLo spikes evoked IPSCs in the primary motoneuron. However, as far as the first spikes were concerned, IPSCs were reliably observed (Fig. 5 E,F, arrows). Failures of synaptic responses for the subsequent successive spikes were likely attributable to synaptic fatigues. The IPSCs that CoLo spikes evoked (Fig. 5 F, arrow) corresponded to the earliest synaptic responses that the contralateral primary motoneurons received during escapes. This is consistent with the following idea: the M-spike, which was likely to be the earliest descending input arriving on the side of escape (Casagrand et al., 1999; Eaton et al., 2001), evoked a CoLo spike via an electrotonic synapse with a minimal delay, and this in turn provided the earliest inhibition onto the contralateral primary motoneuron (Yasargil and Diamond, 1968; Diamond, 1971; Fetcho, 1991). After these earliest IPSCs, the primary motoneuron received several IPSCs (Fig. 5 E,F, dots) that were unrelated to CoLo spikes, suggesting that this later inhibition came from different sources.
We have shown that primary motoneurons are direct synaptic targets of CoLos. Previous studies in adult goldfish have suggested that other neurons are also postsynaptic targets of CoLos. Namely, all the known postsynaptic targets of the M-cell, including CoLos, were shown to receive very fast inhibition on the contralateral M-spike (Fetcho and Faber, 1988), strongly suggesting that CoLos make inhibitory connections onto all the postsynaptic targets of the M-cell. Our anatomical evidence supports the view that contralateral CoLo neurons are also direct synaptic targets of CoLos. As shown in Figure 2 E, axonal collaterals of the CoLo were frequently observed near the contact sites of the M-axon and the CoLo axons of its contralateral counterparts (Fig. 2 E, arrowheads). This suggests that CoLo neurons inhibit their contralateral counterparts near the Mauthner–CoLo electrical synapses.
CoLos are active only during escapes
We examined firing patterns of CoLos during fictive locomotion by performing CoLo neuron recordings with recordings from peripheral motor nerves (VR) (Fig. 6 A). The purpose of the experiments was (1) to examine firing patterns of CoLos during escapes and (2) to examine whether CoLos were active during swimming. The latter issue was especially important because this has not been addressed in previous studies in adult goldfish (Fetcho and Faber, 1988; Fetcho, 1990, 1991).
Figure 6.

Activity of the CoLo neurons during fictive locomotion. A, A schematic illustrates the recordings shown in B–G. In B–G, the top of each panel shows the VR recording, whereas the bottom shows the whole-cell recording of the CoLo neuron. B, C, Recordings in a 3 dpf larva. Electrical stimulations were applied at the time points marked by asterisks (the same for D–F). During stimulations, VR activity occurred with short latencies from the stimuli (labeled as “escape”). This VR activity likely corresponds to the initial escape bend. During the escapes, the CoLo neuron expressed successive spikes (the neuron fired 3 times in B and C). After the escapes, rhythmic VR activity corresponding to swimming occurred. The cell did not fire during the swimming phase. Instead, the cell received inhibition during swimming. This inhibition is clearly seen in C (dots), where the recording was performed in a depolarized condition with a constant positive current injection. D–G, Recordings in a 4 dpf larva. D, E, During stimulation, an escape occurred (labeled as “escape”). E shows a close-up view of D during the escape. The CoLo neuron fired twice in this trial. The cell did not fire during the swimming phase. F, An escape trial was made during the recording of a depolarized condition. Close-up view. After the escape, the cell received inhibition (dots). G, VR activity during spontaneous swimming. The recording was performed in a depolarized condition. The cell received inhibition during swimming (dots).
Recordings were obtained from 25 CoLos (1 at 2 dpf, 11 at 3 dpf, 12 at 4 dpf, and 1 at 5 dpf). Representative examples are shown in Figure 6, B and C (3 dpf larva) and D–G (4 dpf larva). During electrical stimulation near the contralateral ear (asterisks in each panel), VR activities with short latencies from the stimuli were often elicited (marked by “escape” in each panel). These activities likely corresponded to the initial bend associated with escapes. In the early phase of these initial VR activities, CoLos often showed successive spikes (marked by “spikes” in each panel). The first spike in the CoLos always preceded the VR activity (easily seen in the magnified view of Fig. 6 E,F). This is consistent with the idea that CoLos, whose activities were driven via electrical synapses from the M-axon, fired earlier than motoneurons during escapes (the sites of VR recordings were always rostral to those of CoLo recordings, and therefore, the preceding firing of CoLos was not attributable to rostrocaudal shift of motor activity). Nineteen of 25 CoLos fired during at least one stimulation trial. There were age-dependent changes in the number of CoLo spikes per escape. Younger animals tended to show more spikes (an average of 2.79 ± 1.15 for 11 cells at 3 dpf vs an average of 1.52 ± 0.60 for 8 cells at 4 dpf).
We then examined activities of CoLos during swimming. The escape behaviors were usually followed by rhythmic VR activities that corresponded to swimming. CoLo spikes were not observed during this swimming phase (Fig. 6 B–D). For each CoLo neuron, at least five swimming episodes were elicited with electrical stimulations, but we did not observe any CoLo spikes except for those corresponding to the initial bend of escapes. This was true not only for swimming elicited by electrical stimulations but also for spontaneous swimming (Fig. 6 G) and for light-flash-elicited swimming (data not shown). Thus, we concluded that CoLos were not active during swimming. On the contrary, CoLos received inhibition during swimming. This inhibition was apparent when recordings were made in depolarized conditions with constant positive current injections (chloride reversal potential, −70 mV) (Fig. 6 C,F,G, dots).
While this paper was in preparation, Liao and Fetcho (2008) independently identified CoLos and examined their firing patterns during three types of behaviors: swimming, struggling and escape. They reported that the firing activity of CoLos was only observed during escapes. Our results presented here are consistent with their results.
Behavioral experiments: the role of CoLos during bilateral activation of the M-cells
Based on our dye-coupling evidence, we were confident that the entire population of CoLo neurons was visualized in the Tol-056 fish. This enabled us to examine the behavioral roles of these cells by specifically ablating them by laser. CoLos were expected to play roles in escapes triggered by Mauthner spikes. Therefore, we focused our analyses on sound/vibration-elicited escapes (Fig. 7 A), because M-cells have been shown to play a major role in escapes evoked by acoustic-vestibular stimulations in larval zebrafish (Burgess and Granato, 2007; Kohashi and Oda, 2008).
Figure 7.
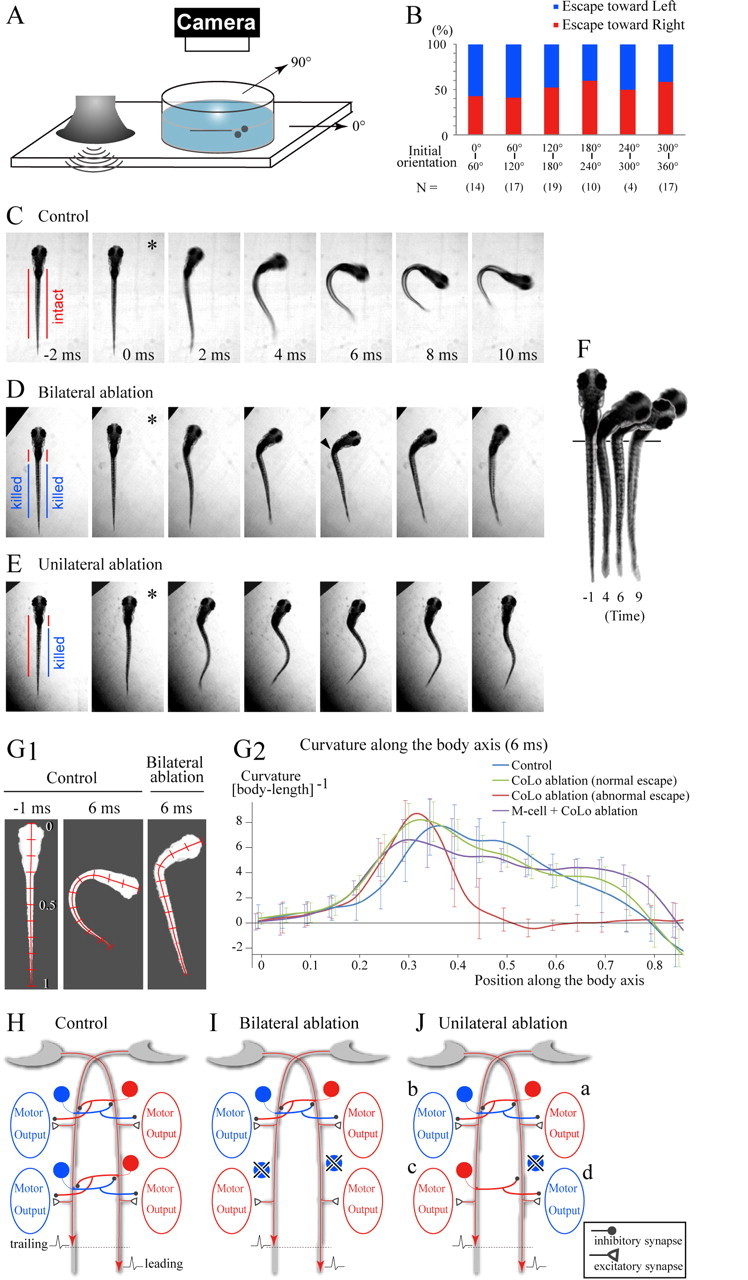
Behavioral analyses of the CoLo-ablated larvae. A, A schematic illustration of the experimental setup. Sound/vibration generated in the audio speaker propagates to the Petri dish. This elicits an escape in a larva. B, Relationships between the initial orientation of the larvae (see the schematics in A) and the direction of the escape. “N” stands for the number of the trials. The number of larvae used in this experiment was 16. C–E, Escape responses of a control (C) and CoLo-ablated (D, E) larvae. In each panel, a single asterisk marks the initiation of movement. Images were collected at 1000 frames/s. Every other frame is shown (2 ms between frames). C, An example of an escape behavior in a control larva (a Tol-056 heterozygote). See also supplemental Movie 3 (available at www.jneurosci.org as supplemental material). D, An example of an abnormal escape behavior in a CoLo-ablated larva (bilateral ablation of CoLos located caudal to the 7th segment). See also supplemental Movie 4 (available at www.jneurosci.org as supplemental material). Note that the caudal part of the body is almost straight, whereas contraction of the rostral part of the body seems normal. This resulted in a sharp kink (arrowhead). E, An example of an abnormal escape behavior in a CoLo-ablated larva (ablation of the right-side CoLos located caudal to the 7th segment). See also supplemental Movie 6 (available at www.jneurosci.org as supplemental material). Note that, near simultaneously, the rostral part of the body curved toward the right, whereas the caudal part of the body curved toward the left. This resulted in a characteristic S-shape of the body. F, Images of the bilaterally ablated larva at four different time points (the same trial shown in D). The onset of movement is defined as time 0. The pigmentation pattern was used to align larvae (the vertical line). Note that the straight part of the body is shortened. G1, Midline tracing of larvae. Images were inversed, and the midline was traced. Position along the body axis is indicated by bars at increments of 0.1. Left, A control larva before movement; middle, a control larva at 6 ms after the onset of movement; right, a bilaterally CoLo-ablated larva at the 6 ms time point. G2, Quantitative analyses of the curvature of the body at the 6 ms time point. Curvature of the midline at 0.001 increments of body length was calculated with BohBoh software. The blue trace represents the mean value of the escapes of control larvae. The green trace represents the mean value of the normal escapes of bilateral CoLo ablations. The red trace represents the mean value of the abnormal escapes of bilateral CoLo ablations. The purple trace represents the mean value of the escapes in those larvae in which unilateral ablation of the M-cell and bilateral ablation of CoLos were performed. The numbers of images examined are as follows: 14 for control; 18 for bilateral ablation with normal escapes; 9 for bilateral ablation with impaired escapes; 11 for unilateral M-cell ablation and bilateral CoLo ablation. For every 0.05 increment of position, the SDs are indicated. H–J, Schematic illustrations for explanation of the motor activities in control (H), bilaterally ablated (I), and unilaterally ablated (J) larva during coactivation of the two M-cells with slight time differences. In each panel, the leading spike runs on the right M-axon. Circular cells represent CoLo neurons. Red represents an active state, whereas blue represents an inactive state. H, The motor activity on the left side along the entire body is suppressed by the crossed inhibitions mediated by CoLos, resulting in a normal escape toward the right. I, In the rostral part of the body in which CoLos are present, the motor activity of the left side is suppressed. In the caudal part in which CoLos are absent, both sides become active, resulting in the straightening of the body. J, In the rostral part in which CoLos are present, the right side is active (a), whereas the motor activity of the left side is suppressed by CoLos (b). In the caudal part, in which CoLos are absent on the right side, the activity occurs on the left side (c). Activation of the right side depends on the balance between the excitatory effects originating from the right M-spike and the inhibitory effects originating from contralateral CoLos. If the inhibitions arrive early enough, the excitatory effects are suppressed (d).
M-cells indeed played a critical role in initiating fast escapes in our experimental system. In response to sound/vibration stimulus, larvae (5.3–5.8 dpf) showed fast escapes (latency, <15 ms) (Fig. 7 C) (supplemental Movie 3, available at www.jneurosci.org as supplemental material) in >80% of trials. When both of the M-cells were laser ablated (two larvae) (supplemental Fig. 3C, available at www.jneurosci.org as supplemental material), fast escapes (latency, <15 ms) were completely abolished; >10 trials were performed for each larva. When one of the M-cells was ablated (three larvae) (supplemental Fig. 3B, available at www.jneurosci.org as supplemental material), larvae performed fast escapes only to the contralateral side of the intact M-cell; more than eight escapes were examined for each larva. These results show the critical roles of M-cells in the initiation of fast escapes. It is noteworthy that the directions of the escapes were found to be mostly random (Fig. 7 B). This suggests that the stimuli in our experimental system had little laterality in larval zebrafish.
We first investigated the effects of bilateral ablation of CoLos located caudal to the seventh segment (an image of a CoLo-ablated larva is shown in supplemental Fig. 4, available at www.jneurosci.org as supplemental material). Dramatic impairments in behavior were often observed (Fig. 7 D) (supplemental Movie 4, available at www.jneurosci.org as supplemental material). The abnormal escape behavior was characterized by straightening of the caudal part of the body, whereas the rostral part of the body turned normally. As a result, a sharp kink was apparent (Fig. 7 D, arrowhead). In the straight part, which approximately corresponded to the CoLo-ablated region, bilateral activation of trunk musculature appeared to occur, as inferred by the shortening of the body (Fig. 7 F). Such abnormal escapes were observed in ∼30% of trials, although occurrence frequency varied from animal to animal (Table 1). In trials in which animals did not show impaired escapes, the escape behaviors were indistinguishable from those of controls (supplemental Movie 5, available at www.jneurosci.org as supplemental material). This precludes the possibility that the severe impaired-escape phenotypes observed were attributable to collateral damage related to the laser ablation.
Table 1.
Frequency of impaired escapes in CoLo-ablated larvae
| Number of total escapes | Number of impaired escapes | Ratio (%) | |
|---|---|---|---|
| Bilateral ablation | |||
| Fish 1 | 10 | 7 | 70.0 |
| Fish 2 | 3 | 1 | 33.3 |
| Fish 3 | 9 | 1 | 11.1 |
| Fish 4 | 23 | 4 | 17.4 |
| Fish 5 | 9 | 0 | 0.0 |
| Fish 6 | 21 | 11 | 52.4 |
| Fish 7 | 25 | 4 | 16.0 |
| 28.6 average | |||
| Unilateral ablation | |||
| Fish 8 | 5 a | 2 | 40.0 |
| Fish 9 | 6 a | 5 | 83.3 |
| Fish 10 | 5 a | 1 | 20.0 |
| Fish 11 | 2 a | 1 | 50.0 |
| Fish 12 | 3 a | 1 | 33.3 |
| Fish 13 | 8 a | 2 | 25.0 |
| Fish 14 | 5 a | 0 | 0.0 |
| 36.0 average |
In fish 6 and fish 7, CoLos located caudal to the 11th segment were ablated. For all the other fish, ablations were performed against CoLos located caudal to the seventh segment.
aIn the unilateral ablation experiments (fish 8–14), impaired escapes occurred only toward the side of the ablation. Therefore, in the ″Number of total escapes,″ only those escapes that occurred in that direction were counted.
We quantitatively analyzed the behaviors by examining the curvature of the body. We compared the curvature of the body at 6 ms because the phenotype was most evident at this time point (Fig. 7 G1). The result is summarized in Figure 7 G2. Control fish showed smooth curvature of the body at the caudal two-thirds of body (blue trace). In contrast, after bilateral ablation of CoLos, a sharp peak appeared at the rostral end of the body (at 0.3 body length; red trace). In more caudal regions (0.5–0.8), the curvature value is close to 0, representing straightening of the body. SDs in this straight region are small, indicating the consistency of the phenotype. The curvature of normal escapes in the CoLo-ablated larvae (green trace) is similar to those seen in controls.
When CoLos caudal to the 11th segment were bilaterally ablated, the kinked region shifted caudally (data not shown). Thus, the straightening of the body in the abnormal escapes was attributable to the absence of CoLos in the corresponding region.
On what occasions did the larvae show impaired escapes? Given that M-cells are responsible for initiating fast escapes in the system, bilateral contraction observed in the CoLo-ablated region suggests that M-cells fired bilaterally in the impaired escapes. The normal escapes in the CoLo-intact region (rostral part of the body) suggest that CoLo-mediated inhibitions made motor activity unilateral in the corresponding region even in such occasions: if CoLos were intact along the entire length of the body, normal escapes would occur. This notion of unilateral motor output during bilateral activation of the M-cells is in accord with the results of previous studies on the forced coactivation of the M-axons in adult goldfish (Yasargil and Diamond, 1968). During electrical activation of the two M-axons in the spinal cord, the output by the trailing M-spike was completely suppressed if the time difference of the two spikes was greater than a minimal discrimination time (0.15–0.20 ms in the case of adult goldfish) (Yasargil and Diamond, 1968; Diamond, 1971). Taking this into account, our results suggest the following. First, the sound/vibration stimuli used in the present study often elicited bilateral M-cell activation. Second, normal larvae perform escapes even in such occasions by taking advantage of the spike-timing discrimination circuits in the spinal cord. Third, CoLos play a pivotal role in the circuits (Fig. 7 H): in the absence of CoLos, bilateral muscular contractions occur (Fig. 7 I).
To obtain evidence supporting this notion, we performed unilateral ablations of CoLos (caudal to the seventh segment). As expected, abnormal escapes were only observed in the direction of the ablated CoLos (frequency, 36%) (Table 1). In these abnormal escapes, we occasionally observed S-shaped escapes (Fig. 7 E) (supplemental Movie 6, available at www.jneurosci.org as supplemental material). The caudal part of the body curved in the direction opposite the main direction of the escape. This phenotype is explained by the idea that the excitatory effects of the leading M-spike were overridden by those of the trailing M-spike in the case of unilateral presence of CoLos (Fig. 7 J; see the legend for a more detailed explanation). In addition to the S-shaped phenotypes, we observed phenotypes that were similar to the ones obtained in the bilateral ablations (straightening of the caudal region) (supplemental Movie 7, available at www.jneurosci.org as supplemental material). In these cases, the differences in timing of the two M-spikes were likely to be slightly larger. This would lead to the late arrival of the CoLo-mediated inhibition, and, thereby, the excitatory effects of the leading M-spike were not overridden, resulting in bilateral contraction.
In other larvae, one of the M-cells was ablated in addition to the bilateral elimination of CoLos. In this condition, bilateral M-cell firing should not occur, and thus, we expected that no stiffened phenotype would appear. We performed experiments in six larvae. At least five escapes were examined in each larva, and thus, >30 escapes were examined in total. In these larvae, abnormal escapes were never observed. The larvae performed normal escapes to the opposite side of the intact M-cell (Fig. 7 G2, purple trace). Collectively, all the results thus far described are consistent with the idea that (1) M-cell coactivations often occurred in our experiments and that (2) CoLos play a pivotal role in allowing animals to perform escapes during bilateral activation of the M-cells.
Calcium imaging of M-cells
To further obtain parallel evidence that both M-cells were coactivated by the sound/vibration stimulus, we performed calcium imaging (O'Malley et al., 1996; Takahashi et al., 2002; Kohashi and Oda, 2008). The M-cells were retrogradely labeled with a Ca2+ indicator, Calcium Green dextran, and imaged with confocal microscopy. The sound/vibration stimuli were delivered to the animals using the same apparatus described above. Evoked fluorescence response (ΔF/F) in the M-cells was compared with that elicited by AD stimulus applied to the spinal cord at the end of experiments (Kohashi and Oda, 2008).
A representative example of Ca2+ imaging is shown in Figure 8. Figure 8, A and B, shows the results of the AD stimulations. Fluorescence responses in each M-cell were evoked in an all-or-nothing manner with steady amplitudes. Figure 8, C and E, shows two examples of Ca2+ imaging in the sound/vibration stimulation trials. In the trial shown in Figure 8 C, both of the M-cells are likely to have fired, because the normalized ΔF/F (normalized with the ΔF/F value of the AD spikes) in each cell was close to 100% (Fig. 8 D, black traces). In the trial shown in Figure 8 E, only the left M-cell is likely to have fired, because the normalized ΔF/Fs in the left and right M-cells were close to 100 and 0%, respectively (Fig. 8 F, black traces). We defined normalized ΔF/F >70% as a sign of a spike of the M-cell (Kohashi and Oda, 2008). Figure 8 D shows traces of all the trials in which both of the M-cells in the larva were considered to fire (black and gray traces). Figure 8 F shows traces of all the trials in which only the left M-cell was considered to fire (black and gray traces). The red trace in each panel shows the average of the traces shown (average of black and gray traces). The vast majority of the traces reasonably represent coactivation (Fig. 8 D) and single activation (Fig. 8 F). We also performed line-scan experiments to obtain results with better time resolution. In trials in which M-cell coactivation is likely to have occurred, no discernible difference in the timing of the activations of the two cells was present, although the movement artifact prevented an examination of fluorescence response during a critical time period (∼50 ms after the stimulus) (supplemental Fig. 5, available at www.jneurosci.org as supplemental material). Ca2+ imaging was performed in five larvae in total (three for the frame scan and two for the line scan), and coactivations of the M-cells were observed at least once in all the larvae. In total, 23 of 42 trials (55%) were considered to be coactivations (only those trials in which at least one of the M-cells was judged to have fired were included in the total number). These results support the conclusion that the two M-cells in larval zebrafish were often coactivated during the sound/vibration stimulations used in this study.
Figure 8.

Fluorescence responses of the paired M-cells during sound/vibration stimuli. A, Plots of fluorescence responses associated with an AD spike of the M-cells. The responses occurred in an all-or-nothing manner. The black traces represent suprathreshold responses. The gray traces represent subthreshold responses. B, The amplitude of the fluorescence response during electrical stimulation in the spinal cord is plotted against stimulation intensities. The constant responses to the suprathreshold stimuli are consistent with the generation of a single antidromic spike. The average values of the responses (36.1% for the left M-cell; 33.9% for the right M-cell) were used to normalize the fluorescence responses shown in D and F. C, An example of coactivation of the M-cells during a sound/vibration stimulus. Pseudocolored images of the fluorescence responses before (−0.2 s) and after (+0.20, +2.99, and +6.58 s) the sound/vibration stimulus. For the purpose of illustration, different look-up tables, shown under the panels, were used to make the images on the left and the right. This is because the labeling intensities of the left and right M-cells were different. The left and right images were combined. D, Plots of the fluorescence of the M-cells during sound/vibration stimuli. Fluorescence responses (ΔF/F) were normalized with the values associated with the AD stimulations. All the trials in which both of the M-cells in the larva were considered to have fired (>70% of normalized ΔF/F) are shown (black and gray). The black trace corresponds to the trial shown in C. The responses of the rest of the trials (n = 6) are shown in gray. The red traces represent the averages. E, An example of activation of a single M-cell during a sound/vibration stimulus. The same look-up tables used in C were used to make the left and right images. F, Plots of the fluorescence of the M-cells during sound/vibration stimuli. All trials in which only the left M-cell was considered to have fired are shown (black and gray). The black trace corresponds to the trial shown in E. The responses of the rest of the trials are shown in gray (n = 6). The red traces represent the averages.
Rare occurrence of M-cell coactivations within a minimal discrimination time
It has been shown in a previous study that electrically activating both M-axons within a minimal discrimination time results in no motor activity (Yasargil and Diamond, 1968). This may be explained by the idea that CoLo-mediated crossed inhibitions shunt all the excitations (supplemental Fig. 6A, available at www.jneurosci.org as supplemental material). Because M-cell coactivation often occurred in our experiments, one might wonder whether coactivations within a minimal discrimination time might have occurred. We assessed this possibility by unilateral ablation of CoLos caudal to the seventh segment, the experiment described in the previous section. The predicted behavior was that in which curvature of the body occurs only in the caudal region in which CoLos are unilaterally present (supplemental Fig. 6B, available at www.jneurosci.org as supplemental material). In our experiments, we did observe one such phenotype (supplemental Movie 8, available at www.jneurosci.org as supplemental material). However, occurrence of this phenotype was rare compared with that of the stiffened (or S-shaped) phenotypes [in total, 12 such phenotypes in fish 8–14 (Table 1)]. This suggests that the vast majority of the M-cell coactivations were those in which the differences in timing of the two spikes were beyond a minimal discrimination time.
Discussion
We have identified a class of commissural inhibitory neurons, CoLos, in larval zebrafish. We have shown that (1) these neurons are present at one cell per hemi-segment, (2) they are electrotonically excited by the M-axon, (3) they provide inhibition to contralateral primary motoneurons, (4) they are active only during the early phase of escapes, and (5) they play an important role in escape behavior during sound/vibration stimuli. We have provided evidence that strongly suggests that CoLos play a particularly important role during bilateral activation of the two M-cells: CoLo-mediated spinal inhibitory circuits enable animals to perform escapes in these occasions by suppressing the excitatory effects of one of the M-spikes. This study illustrates a clear case of the behavioral role of a class of interneuron in the vertebrate spinal cord.
Distribution, morphology, and synaptic targets of CoLos
CoLo-corresponding neurons have been identified in adult goldfish and tench (Fetcho and Faber, 1988; Yasargil and Sandri, 1990). However, no information has been reported on the timing of their development. We have shown that CoLos are present even in the embryonic stage and that they are present at approximately one cell per hemisegment. This is in accord with the electron micrograph study in adult tench (Yasargil and Sandri, 1990). Thus, once the segmental distribution of CoLos is generated in the early stages, the pattern is likely to be maintained throughout life. To our knowledge, CoLo distribution represents the strongest case of segmental pattern of interneuron distribution in vertebrates. From a developmental point of view, how this segmental distribution is established during development is an interesting issue for future studies.
The critical feature of CoLos is that they receive electrotonic inputs from the M-axon. It is not clear whether the connection was purely electrotonic: there might be additional chemical components, which could have been diminished by cholinergic neurotransmission blockers used for immobilizing animals (M-cells are thought to be cholinergic) (Day et al., 1983). Importantly, however, electrotonic inputs alone were sufficient to drive spikes in CoLos. Neuronal type connexin was found to be densely present at the Mauthner–CoLo synapses, suggesting a large electrotonic conductance. This probably contributed to the reliable induction of CoLo spikes on M-spikes.
The configuration of the Mauthner–CoLo circuits are ideal for producing very fast crossed inhibition on receiving an M-spike. These include (1) fast electrical transmission, (2) a robust CoLo axon (indicative of fast conduction), (3) a descending main axon (in the same direction that the M-spike travels), and (4) short axons (although robust, CoLo–axon conduction velocity is likely to be slower than that of the giant M-axon). With chains of short inhibitory neurons, the opposite side can receive inhibition with a minimal delay. Regarding the postsynaptic targets of CoLos, direct evidence is only available for primary motoneurons. However, all the known targets of the M-axon, including CoLos, have been shown to receive very fast inhibition on a contralateral M-spike, strongly suggesting that CoLos inhibit all of these (Fetcho, 1990). Our own and previous anatomical studies also support this view (Fetcho, 1990; Yasargil and Sandri, 1990).
Escape-specific activity of CoLos
To what extent the activity of spinal interneurons is shared by different motor activities is an important issue. Fetcho (1991) pointed out a similarity between Mauthner-mediated escape circuits in fish and swimming circuits in tadpoles and lamprey, raising the possibility that some of the circuit components might be shared between these two behaviors. At least for CoLos, however, this is not the case: CoLos were never active during swimming. The same conclusion was reported recently by Liao and Fetcho (2008), in which the authors further showed that CoLos were not active during struggling, a very strong but slower movement. A likely reason why the spinal cord contains this specialized class of neurons is that the speeds required for escapes and swimming/struggling differ greatly; inhibition mediated by the commissural interneurons without CoLos would not be fast enough for escapes.
The present study has focused on the role of CoLos in escapes that occur from rest (see the following section). However, fast escapes are known to occur when fish are swimming by immediately shutting down the ongoing activity (Jayne and Lauder, 1993; Svoboda and Fetcho, 1996). Eaton et al. (1995) suggested that one of the primary roles of the large M-axons are to turn off competing contralateral activity. We expect that fast crossed inhibitions mediated by CoLos play an important role in this process by immediately shunting motoneuron activities. Future studies must address this issue.
Escape behaviors in fish are a form of startle response. Startle responses occur in a wide variety of species, including mammals. Like Mauthner-mediated escape behaviors in fish, one characteristic feature of the acoustic startle response in mammals is the immediate arrest of ongoing activity (Eaton, 1984). This suggests the involvement of short-latency inhibition. With analogy to CoLos, it would be interesting to ask whether the mammalian spinal cord contains inhibitory interneurons dedicated to startle responses.
The role of CoLos in escapes during bilateral activation of the M-cells
CoLo-ablated larvae often showed impaired escapes during sound/vibration stimuli. Thus, CoLos, with a presence of just one cell per hemisegment, play very important roles in escape behavior. We have obtained several lines of evidence that strongly support the notion that both of the M-cells were activated in these impaired escapes. This in turn suggests that, in normal conditions, larvae are able to perform escapes during M-cell coactivation by taking advantage of CoLo-mediated inhibitory circuits in the spinal cord. Our calcium imaging data also suggest that coactivations of the M-cells did occur during the sound/vibration stimuli used in our study.
The present study uncovers the behavioral importance of the spike-timing discrimination circuit that was first described by Yasargil and Diamond (1968). They showed that the spinal circuits could discriminate slight differences in timing of the M-spikes; when both of the M-axons were artificially activated, the excitatory effect of the trailing spike was completely suppressed if the intervals of the spikes were greater than the minimal discrimination time (∼0.15–0.20 ms in adult goldfish). The importance of this, however, has not been fully emphasized, because subsequent evidence showed that, in the vast majority of escapes, only one of the M-cells fired (Zottoli, 1977; Eaton et al., 1981). Our results strongly suggest that coactivation of the two M-cells do occur in escapes elicited by sound/vibration stimuli having little laterality and that CoLos lie at the core of this spike-timing discrimination circuit. As discussed above, the configuration of CoLos is ideal for shunting all the excitatory effects of the trailing M-spike. This circuit is likely to be behaviorally important for fish in their natural lives. Predator attacks do not always have laterality (e.g., attacks from above). During an attack, an animal may need to perform an escape to either direction. The CoLo-mediated discrimination circuit enables animals to do so.
M-cell coactivation is not likely to be specific to larval fish. Firing of the M-cell on the side of the escape was reported in adult goldfish (Zottoli, 1977; Eaton et al., 1988), although the occurrence frequencies were much lower (1 in 39 and 1 in 16, respectively). In such “incorrect” firings, it is likely that the other M-cell fired earlier. In the present study, larval zebrafish showed a higher frequency of M-cell coactivation (∼30% in the behavioral experiments). Differences in laterality of the stimuli used in the different experiments could explain the difference in frequency. In addition, adult fish may have better ability to detect slight laterality by using multiple layers of inhibitory circuits in the hindbrain (Korn and Faber, 2005). It is important to note, however, that many of the inhibitory circuits, including reciprocal inhibitions of the two M-cells, are already functional in 5 dpf zebrafish larvae (Takahashi et al., 2002). Therefore, the frequent coactivation of the two M-cells in the present study could not be attributed to the absence of the reciprocal inhibition circuit of the two M-cells.
Takahashi et al. (2002) suggested that the reciprocal inhibitions arrive within 2 ms. Thus, in our experiments, bilateral activation of the M-cells perhaps occurred within this narrow time window. The phenotype of CoLo-ablated animals also supports this view: bilateral muscular contractions appeared to occur near simultaneously. Nonetheless, our results also suggest that M-cell coactivation within a minimal discrimination time rarely occurs, meaning that the two spikes are slightly desynchronized. The M-cell is known to receive a large amount of spontaneous inhibitory inputs (Hatta and Korn, 1999; Korn and Faber, 2005), which probably help desynchronize the two M-spikes.
The spinal cord tends to be considered as output machinery that just obeys descending commands. However, the spinal circuits in fish can neglect a trailing M-spike, which, if occurring alone, produces a very powerful output. This means that descending motor commands are filtered in the spinal cord to produce the appropriate behavior. Although the case might be an exceptionally dramatic one, information processing of descending commands at the level of the spinal cord might be more important than generally considered for the proper execution of behaviors in vertebrates.
Footnotes
This work was supported in part by grants from the Ministry of Education, Culture, Sports, Science, and Technology of Japan. We are grateful to Y. Sato for helping to establish enhancer trap lines, M. Tanimoto for suggestions on behavioral experiments, S. Baba and K. Shiba for suggestions on the analyses of behavioral data, and Y. Okamura for generous support.
References
- Baba SA, Mogami Y. An approach to digital image analysis of bending shapes of eukaryotic flagella and cilia. Cell Motil. 1985;5:475–489. [Google Scholar]
- Bhatt DH, Otto SJ, Depoister B, Fetcho JR. Cyclic AMP-induced repair of zebrafish spinal circuits. Science. 2004;305:254–258. doi: 10.1126/science.1098439. [DOI] [PubMed] [Google Scholar]
- Burgess HA, Granato M. Sensorimotor gating in larval zebrafish. J Neurosci. 2007;27:4984–4994. doi: 10.1523/JNEUROSCI.0615-07.2007. [DOI] [PMC free article] [PubMed] [Google Scholar]
- Casagrand JL, Guzik AL, Eaton RC. Mauthner and reticulospinal responses to the onset of acoustic pressure and acceleration stimuli. J Neurophysiol. 1999;82:1422–1437. doi: 10.1152/jn.1999.82.3.1422. [DOI] [PubMed] [Google Scholar]
- Day JW, Hall DH, Hall LM, Bennett MV. α-Bungarotoxin labeling and acetylcholinesterase localization at the Mauthner fiber giant synapse in the hatchetfish. J Neurosci. 1983;3:272–279. doi: 10.1523/JNEUROSCI.03-02-00272.1983. [DOI] [PMC free article] [PubMed] [Google Scholar]
- Diamond J. The Mauthner cell. In: Hoar WS, Randall DJ, editors. Fish physiology. Vol V. New York: Academic; 1971. pp. 265–346. [Google Scholar]
- Eaton RC. Neural mechanisms of startle behavior. New York: Plenum; 1984. [Google Scholar]
- Eaton RC, Lavender WA, Wieland CM. Identification of Mauthner-initiated response patterns in goldfish: evidence from simultaneous cinematography and electrophysiology. J Comp Physiol A Neuroethol Sens Neural Behav Physiol. 1981;144:521–531. [Google Scholar]
- Eaton RC, DiDomenico R, Nissanov J. Flexible body dynamics of the goldfish C-start: implications for reticulospinal command mechanisms. J Neurosci. 1988;8:2758–2768. doi: 10.1523/JNEUROSCI.08-08-02758.1988. [DOI] [PMC free article] [PubMed] [Google Scholar]
- Eaton RC, Hofve JC, Fetcho JR. Beating the competition: the reliability hypothesis for Mauthner axon size. Brain Behav Evol. 1995;45:183–194. doi: 10.1159/000113549. [DOI] [PubMed] [Google Scholar]
- Eaton RC, Lee RK, Foreman MB. The Mauthner cell and other identified neurons of the brainstem escape network of fish. Prog Neurobiol. 2001;63:467–485. doi: 10.1016/s0301-0082(00)00047-2. [DOI] [PubMed] [Google Scholar]
- Fetcho JR. Morphological variability, segmental relationships, and functional role of a class of commissural interneurons in the spinal cord of goldfish. J Comp Neurol. 1990;299:283–298. doi: 10.1002/cne.902990303. [DOI] [PubMed] [Google Scholar]
- Fetcho JR. Spinal network of the Mauthner cell. Brain Behav Evol. 1991;37:298–316. doi: 10.1159/000114367. [DOI] [PubMed] [Google Scholar]
- Fetcho JR, Faber DS. Identification of motoneurons and interneurons in the spinal network for escapes initiated by the Mauthner cell in goldfish. J Neurosci. 1988;8:4192–4213. doi: 10.1523/JNEUROSCI.08-11-04192.1988. [DOI] [PMC free article] [PubMed] [Google Scholar]
- Halloran MC, Sato-Maeda M, Warren JT, Su F, Lele Z, Krone PH, Kuwada JY, Shoji W. Laser-induced gene expression in specific cells of transgenic zebrafish. Development. 2000;127:1953–1960. doi: 10.1242/dev.127.9.1953. [DOI] [PubMed] [Google Scholar]
- Hatta K, Korn H. Tonic inhibition alternates in paired neurons that set direction of fish escape reaction. Proc Natl Acad Sci U S A. 1999;96:12090–12095. doi: 10.1073/pnas.96.21.12090. [DOI] [PMC free article] [PubMed] [Google Scholar]
- Higashijima S, Mandel G, Fetcho JR. Distribution of prospective glutamatergic, glycinergic, and GABAergic neurons in embryonic and larval zebrafish. J Comp Neurol. 2004a;480:1–18. doi: 10.1002/cne.20278. [DOI] [PubMed] [Google Scholar]
- Higashijima S, Schaefer M, Fetcho JR. Neurotransmitter properties of spinal interneurons in embryonic and larval zebrafish. J Comp Neurol. 2004b;480:19–37. doi: 10.1002/cne.20279. [DOI] [PubMed] [Google Scholar]
- Higashijima S, Masino MA, Mandel G, Fetcho JR. Engrailed-1 expression marks a primitive class of inhibitory spinal interneuron. J Neurosci. 2004c;24:5827–5839. doi: 10.1523/JNEUROSCI.5342-03.2004. [DOI] [PMC free article] [PubMed] [Google Scholar]
- Jayne BC, Lauder GV. Red and white muscle activity and kinematics of the escape response of the bluegill sunfish during swimming. J Comp Physiol A Neuroethol Sens Neural Behav Physiol. 1993;173:495–508. [Google Scholar]
- Kawakami K. Transposon tools and methods in zebrafish. Dev Dyn. 2005;234:244–254. doi: 10.1002/dvdy.20516. [DOI] [PubMed] [Google Scholar]
- Kimura Y, Okamura Y, Higashijima S. alx, a zebrafish homolog of Chx10, marks ipsilateral descending excitatory interneurons that participate in the regulation of spinal locomotor circuits. J Neurosci. 2006;26:5684–5697. doi: 10.1523/JNEUROSCI.4993-05.2006. [DOI] [PMC free article] [PubMed] [Google Scholar]
- Kohashi T, Oda Y. Initiation of Mauthner- or non-Mauthner-mediated fast escape evoked by different modes of sensory input. J Neurosci. 2008;28:10641–10653. doi: 10.1523/JNEUROSCI.1435-08.2008. [DOI] [PMC free article] [PubMed] [Google Scholar]
- Korn H, Faber DS. The Mauthner cell half a century later: a neurobiological model for decision-making? Neuron. 2005;47:13–28. doi: 10.1016/j.neuron.2005.05.019. [DOI] [PubMed] [Google Scholar]
- Liao JC, Fetcho JR. Shared versus specialized glycinergic spinal interneurons in axial motor circuits of larval zebrafish. J Neurosci. 2008;28:12982–12992. doi: 10.1523/JNEUROSCI.3330-08.2008. [DOI] [PMC free article] [PubMed] [Google Scholar]
- Nagayoshi S, Hayashi E, Abe G, Osato N, Asakawa K, Urasaki A, Horikawa K, Ikeo K, Takeda H, Kawakami K. Insertional mutagenesis by the Tol2 transposon-mediated enhancer trap approach generated mutations in two developmental genes: tcf7 and synembryn-like. Development. 2008;135:159–169. doi: 10.1242/dev.009050. [DOI] [PubMed] [Google Scholar]
- Nissanov J, Eaton RC, DiDomenico R. The motor output of the Mauthner cell, a reticulospinal command neuron. Brain Res. 1990;517:88–98. doi: 10.1016/0006-8993(90)91012-6. [DOI] [PubMed] [Google Scholar]
- O'Brien J, Bruzzone R, White TW, Al-Ubaidi MR, Ripps H. Cloning and expression of two related connexins from the perch retina define a distinct subgroup of the connexin family. J Neurosci. 1998;18:7625–7637. doi: 10.1523/JNEUROSCI.18-19-07625.1998. [DOI] [PMC free article] [PubMed] [Google Scholar]
- O'Malley DM, Kao YH, Fetcho JR. Imaging the functional organization of zebrafish hindbrain segments during escape behaviors. Neuron. 1996;17:1145–1155. doi: 10.1016/s0896-6273(00)80246-9. [DOI] [PubMed] [Google Scholar]
- Pereda A, O'Brien J, Nagy JI, Bukauskas F, Davidson KG, Kamasawa N, Yasumura T, Rash JE. Connexin35 mediates electrical transmission at mixed synapses on Mauthner cells. J Neurosci. 2003;23:7489–7503. doi: 10.1523/JNEUROSCI.23-20-07489.2003. [DOI] [PMC free article] [PubMed] [Google Scholar]
- Rash JE, Yasumura T, Dudek FE, Nagy JI. Cell-specific expression of connexins and evidence of restricted gap junctional coupling between glial cells and between neurons. J Neurosci. 2001;21:1983–2000. doi: 10.1523/JNEUROSCI.21-06-01983.2001. [DOI] [PMC free article] [PubMed] [Google Scholar]
- Roberts A, Clarke JDW. The neuroanatomy of an amphibian embryo spinal cord. Philos Trans R Soc Lond B Biol Sci. 1982;296:195–212. doi: 10.1098/rstb.1982.0002. [DOI] [PubMed] [Google Scholar]
- Shiba K, Ohmuro J, Mogami Y, Nishigaki T, Wood CD, Darszon A, Tatsu Y, Yumoto N, Baba SA. Sperm-activating peptide induces asymmetric flagellar bending in sea urchin sperm. Zoolog Sci. 2005;22:293–299. doi: 10.2108/zsj.22.293. [DOI] [PubMed] [Google Scholar]
- Svoboda KR, Fetcho JR. Interactions between the neural networks for escape and swimming in goldfish. J Neurosci. 1996;16:843–852. doi: 10.1523/JNEUROSCI.16-02-00843.1996. [DOI] [PMC free article] [PubMed] [Google Scholar]
- Takahashi M, Narushima M, Oda Y. In vivo imaging of functional inhibitory networks on the Mauthner cell of larval zebrafish. J Neurosci. 2002;22:3929–3938. doi: 10.1523/JNEUROSCI.22-10-03929.2002. [DOI] [PMC free article] [PubMed] [Google Scholar]
- Wood CD, Nishigaki T, Furuta T, Baba SA, Darszon A. Real-time analysis of the role of Ca2+ in flagellar movement and motility in single sea urchin sperm. J Cell Biol. 2005;169:725–731. doi: 10.1083/jcb.200411001. [DOI] [PMC free article] [PubMed] [Google Scholar]
- Yasargil GM, Diamond J. Startle-response in teleost fish: an elementary circuit for neural discrimination. Nature. 1968;220:241–243. doi: 10.1038/220241a0. [DOI] [PubMed] [Google Scholar]
- Yasargil GM, Sandri C. Morphology of the Mauthner axon inhibitory system in tench (Tinca tinca L.) spinal cord. Neurosci Lett. 1987;81:63–68. doi: 10.1016/0304-3940(87)90341-7. [DOI] [PubMed] [Google Scholar]
- Yasargil GM, Sandri C. Topography and ultrastructure of commissural interneurons that may establish reciprocal inhibitory connections of the Mauthner axons in the spinal cord of the tench, Tinca tinca L. J Neurocytol. 1990;19:111–126. doi: 10.1007/BF01188443. [DOI] [PubMed] [Google Scholar]
- Zottoli SJ. Correlation of the startle reflex and Mauthner cell auditory responses in unrestrained goldfish. J Exp Biol. 1977;66:243–254. doi: 10.1242/jeb.66.1.243. [DOI] [PubMed] [Google Scholar]