

Abstract
Neuroanatomical studies have revealed a vast network of corticocortical connections among the various fields that form cat auditory cortex. However, few studies have explored the functional communicative properties of these connections. The purpose of the present study was to examine the bidirectional processing contributions between the primary auditory cortex (A1) and the nonprimary anterior auditory field (AAF). Using acute recording techniques, multiunit neuronal activity was collected from the right hemisphere of nine mature cats. Cortical maps were generated, and the precise location of A1 and AAF was identified. Subsequently, the synaptic activity of A1 or AAF was suppressed with reversible thermal deactivation procedures while the neuronal response to tonal stimuli of the non-inactivated area (A1 or AAF) was measured. We examined response strength and latency, characteristic frequency, bandwidth, and neuronal threshold of A1 and AAF receptive fields before and during epochs of deactivation. Three major changes in A1 response properties were observed during AAF neuronal suppression: a decrease in response strength, an increase in neuronal thresholds, and a sharpening of receptive field bandwidths. In contrast, A1 deactivation did not produce any discernible changes in AAF neuronal responses. Collectively, these results suggest that the modulation of acoustic information between A1 and AAF in cat auditory cortex is dominated by a unidirectional AAF to A1 pathway.
Introduction
The concept of a receptive field has existed for well over a century and proposes that single neurons represent a limited portion of the external world and respond to particular stimulus features (Sherrington, 1906). This model of cortical response properties is based on the idea that signals from the sensory periphery are transmitted by fibers that relay in the thalamus before terminating in the cerebral cortex relatively unmodified. Reports in the visual, auditory, and somatosensory systems have challenged this model (Pons et al., 1987; Felleman and Van Essen, 1991; Salin and Bullier, 1995; Rauschecker et al., 1997; Winer et al., 2005). These studies have provided evidence that, in addition to the cortical afferents projecting from thalamus to cortex, connections between primary and nonprimary fields of the cerebral cortex are involved in the modulation of neuronal response properties activated by sensory information.
Neuroanatomical studies have used retrograde and anterograde tracers to identify corticocortical feedforward (primary to nonprimary) and feedback (nonprimary to primary) connections among visual processing areas (Rockland and Pandya, 1979; Callaway, 2004). In addition, permanent and reversible deactivation approaches have been used to investigate the flow of information throughout extrastriate visual cortex (Dreher and Cottee, 1975; Salin and Bullier, 1995; Azzopardi et al., 2003; Silvanto et al., 2005; Ponce et al., 2008; Bardy et al., 2009). From these investigations, it has been proposed that feedforward connections are primarily involved in the transferring of sensory information, whereas feedback connections are concerned with the integration and contextual modulation of sensory signals (Bardy et al., 2009).
Studies of cortical circuitry have demonstrated that interfield connectivity is strongest among functionally related auditory areas (Rouiller et al., 1991; Lee et al., 2004a; Kishan et al., 2008; Lee and Winer, 2008b,c). Based on these reports and the well defined model of information flow in the visual system, the present study investigated the functional hierarchical structure of auditory cortex. We examined the bidirectional processing contributions of primary auditory cortex (A1) and the nonprimary anterior auditory field (AAF). These two fields are the principal extrinsic input to one another. A1 provides ∼48% of the extrinsic cortical input to AAF, and AAF supplies ∼45% of the extrinsic cortical input of A1 (Lee and Winer, 2008c). We hypothesized that acoustic information would flow from A1 to AAF in a feedforward manner as demonstrated in other sensory systems (visual: Girard and Bullier, 1989; Girard et al., 1991a,b; somatosensory: Pons et al., 1987). Our results, however, contradicted our hypothesis. Deactivation of A1 did not provoke substantial changes in acoustically evoked neuronal activity in AAF. In contrast, deactivation of AAF induced considerable changes in the receptive field properties and response strength of A1 neurons. These findings suggest that, in contrast to the serial processing of information reported in the visual cortex, acoustic information emanating from the medial geniculate body (MGB) arrives simultaneously and independently to A1 and AAF; subsequently, corticocortical connections between A1 and AAF modulate specific response properties of neurons activated by the sensory information.
Materials and Methods
Overview.
Nine domestic adult cats weighing between 2.5 and 4.4 kg (median, 3.6 kg) were obtained from a United States Department of Agriculture licensed commercial laboratory animal breeding facility (Liberty Labs) and housed in an “enriched” colony environment. Acoustically evoked responses were measured in the right hemisphere of all nine animals (Fig. 1A). All procedures were conducted in accordance with the United States National Research Council Guidelines for the Care and Use of Mammals in Neuroscience and Behavioral Research (2003) and the Canadian Council on Animal Care Guide to the Care and Use of Experimental Animals (Olfert et al., 1993) and were approved by the University of Western Ontario Animal Use Subcommittee of the University Council on Animal Care.
Figure 1.

Lateral view of the right hemisphere of the cat cerebral cortex showing the loci examined. A, Schematic drawing of the 13 areas of cat auditory cortex. The highlighted regions illustrate the two areas examined in this study. B, Photomicrograph of the right hemisphere showing the location of individual microelectrode penetrations and their relationship to cortical vasculature. Each black dot in the figure represents a single recording site. C, Characteristic frequency organization of four auditory cortical fields. Borders (white lines) were defined based on tonotopic organization and latency characteristics. Each polygon represents an estimation of the cortical area with similar response properties as the recording site (middle of polygon). The color of each polygon identifies the CF for each recorded site. Sulci are highlighted with black lines. AII, Second auditory area; DZ, dorsal zone of auditory cortex; PAF, posterior auditory field; VAF, ventral auditory field; VPAF, ventral posterior auditory field; FAES, auditory field of the anterior ectosylvian sulcus; dPE, dorsal posterior ectosylvian area; iPE, intermediate posterior ectosylvian area; vPE, ventral posterior ectosylvian area; IN, insular region; T, temporal region. Sulci are indicated by italics: pes, posterior ectosylvian sulcus; ss, suprasylvian sulcus; aes, anterior ectosylvian sulcus; D, dorsal; A, anterior; P, posterior; V, ventral.
Surgical preparation.
Twenty-four hours before surgery, all cats were anesthetized with ketamine (20 mg/kg, i.m.), and the cephalic vein was cannulated with a feline indwelling catheter. Dexamethasone (1.0 mg/kg, i.v.) was administered to reduce inflammation during surgical and electrophysiological recording procedures. All animals were then fasted overnight. On the day of surgery, anesthesia was induced by an injection of sodium pentobarbital (25 mg/kg, i.v.) (Cheung et al., 2001), followed by supplemental doses as needed. Electrocardiogram and blood oxygen concentration were monitored to ensure proper levels of anesthesia. A second dose of dexamethasone was given, and atropine (0.03 mg/kg, s.c.) was administered to reduce respiratory and alimentary secretions. A rectal probe was used to monitor body temperature. Core temperature was maintained at 37°C using a water-filled heating pad (Gaymar). Animals were hydrated using an infusion pump supplying 2.5% dextrose/half-strength lactated Ringer's solution (4 ml · kg−1 · h−1, i.v.). In addition, dexamethasone (1.0 mg/kg, i.v.) and atropine (0.03 mg/kg, s.c.) were administered every 12 h for the duration of the experiment (36–84 h). To ensure adequate ventilation, the mucosa of the pharynx was anesthetized with a topical anesthetic (Cetacaine; Cetylite Laboratories) to inhibit the gag reflex, and the trachea was intubated with a cuffed endotracheal tube. Respiration was unassisted. The animal was then positioned in a stereotaxic frame (David Kopf Instruments), and the head was fixed by palato-orbital restraints and blunt (nonrupture) ear bars. Ophthalmic ointment (Neosporin; Kirkland) was applied to the cornea to prevent desiccation. A midline incision was made in the scalp, and the right temporalis muscle was detached medially and reflected laterally. A craniotomy was made over areas A1 and AAF. A head holder was attached to the frontal bone of the skull with dental acrylic and secured to the stereotaxic frame via a carrier. The ear bars and palato-orbital restraints were then removed to permit the unobstructed access of acoustic signals and to minimize pressure points on the animal. The dura was resected, and a layer of silicone oil was applied to the cortex to prevent desiccation. With the aid of a surgical microscope, a digital image of the exposed cortical region was taken to maintain a record of the position of each penetration in reference to the cerebral vasculature (Fig. 1B).
Stimulus generation and presentation.
Recordings took place on an electrically shielded, vibration-free table (Technical Manufacturing Corporation) within a double-walled sound chamber. Pure tones were calibrated using a one-quarter-inch microphone (Brüel and Kjær) and Tucker-Davis Technologies SigCal software. Acoustic signals were presented in the free-field 15 cm from the left ear, measured at the center of the head, and were digitally generated with a 24-bit digital-to-analog converter at 156 kHz (Tucker-Davis Technologies). Frequency–intensity receptive fields were obtained at each recorded site by presenting 2064 pure tones (5 ms rise and fall times, cosine squared gated, 25 ms total duration) in a pseudorandom order chosen from 16 intensities ranging from 0 to 75 dB sound pressure level (SPL) in 5 dB steps, and 129 frequencies in -octave steps ranging from 250 Hz to 64,000 Hz. Two sound transducers were used; signals with frequencies <24,000 Hz were delivered from a TS-AI072R speaker (Pioneer), and signals with frequencies ranging from 24,000 to 64,000 Hz were delivered from an EC1 sound transducer (Tucker-Davis Technologies). The speakers were placed immediately adjacent to each other during calibration and stimulus delivery. Each frequency–intensity combination was presented once at a rate of 2.5 Hz.
Recording procedures.
Parylene-coated tungsten microelectrodes with a 2 × 1 configuration and impedances of 1–2 MΩ at 1000 Hz were used (FHC). The electrodes were positioned orthogonally to the cortical surface and lowered into auditory cortex with a hydraulic microdrive (MO-95; Narashige). Differences in cortical laminae responses were minimized by recording neuronal responses at ∼1200 μm from the cortical surface (layer IV/V). To increase the likelihood of consistent laminae recording, all microelectrode penetrations were limited to the gyral surface circumscribed by the banks of the suprasylvian sulcus, the anterior ectosylvian sulcus, and the posterior ectosylvian sulcus. Recordings were bandpass filtered (500–5000 Hz), amplified (10,000×), and digitized at 25,000 Hz. Data acquisition was performed using Tucker-Davis Technologies System 3 hardware and software (OpenEx). During the first 24 h of each recording procedure, frequency–intensity receptive fields were derived at different locations of auditory cortex to delineate the borders of A1 and the AAF. During these recordings, no cortical deactivation was induced and microelectrode penetration sites were chosen to avoid damage to blood vessels while generating a complete and evenly spaced cortical map. After a clear distinction between A1 and AAF was established based on the reversal of tonotopic organization (Merzenich et al., 1975; Knight, 1977; Reale and Imig, 1980; Imaizumi et al., 2004), a cooling loop was apposed on the low isofrequency bands of A1 or AAF. This arrangement guaranteed that the cooling loop was located as far as possible from the A1/AAF border and that the cooling deactivation would not extent into adjacent fields. Cortical deactivation was assessed by lowering an electrode through the center of the cooling loop into layers IV/V and generating a frequency–intensity receptive field before, during, and after cooling deactivation. After confirmation of cortical deactivation, independent receptive fields were derived during the five stages of a cooling cycle for each recording site: before, transitioning to, during, transitioning out of, and after cooling. The recording cycle was initiated by selecting a site in the field adjacent to the deactivated region and previewing the response with random tonal stimuli; after a location driven by acoustic stimuli was found, a neuronal activity threshold was set. To guarantee that the changes observed were induced by cortical deactivation and not cell death, neuronal activity thresholds were defined before the commencement of a recording cycle, and they were maintained for all five conditions. Thermal maps were produced at the end of the procedure by lowering a 0.2 mm outer diameter mini-hypodermic probe type T thermocouple (HYP-O; Omega) during an epoch of cooling deactivation to the same locations at which the neuronal activity had been measured previously. The generation of thermal maps was used to demarcate the extent of deactivation.
Reversible cooling deactivation.
Cryoloops of different shapes and sizes were fabricated before each experimental procedure from 23 gauge hypodermic tubing (Lomber et al., 1999). Sizes ranged from 5.23 to 13.93 mm2 (median, 7.81 mm2). After the electrophysiological demarcation of A1 or AAF was completed, an appropriate cryoloop was chosen based on the size and shape of the recorded field. A copper/constantin microthermistor was attached at the union of the loop, and a custom-made connector allowed the attachment of the cryoloop to a stereotaxic carrier for precise manipulation and positioning. Cooling was achieved by pumping chilled methanol through the lumen of the cryoloop. Loop temperature was monitored, via a wireless thermometer (UWTC-2; Omega), from outside the acoustic chamber and controlled within 1°C by altering the rate of methanol flow. In the mammalian brain, synaptic transmission is blocked at temperatures below 20°C (Bénita and Condé, 1972). Acoustically evoked activity throughout the full thickness of cortex beneath the cryoloop was eliminated by maintaining the cooling probe at 3°C. This temperature reliably places the 20°C thermocline at the base of layer VI (Lomber et al., 1994, 1999; Lomber, 1999; Chafee and Goldman-Rakic, 2000; Palmer et al., 2007; Nakamoto et al., 2008). Receptive fields were collected for each stage of the cooling cycle. Collection of each receptive field took ∼14 min for a total of ∼70 min between the beginning and end of a recording cycle. The full thickness of cortex beneath the cooling loop can be cooled in ∼5 min, and normal brain temperature can be regained in ∼2 min; thus, 14 min for each transitional phase of the cycle provided ample time for deactivation and reactivation.
Histology.
At the end of four of the procedures, animals were deeply anesthetized with sodium pentobarbital (40 mg/kg, i.v.). An assessment of the cortical layer at which microelectrode recordings were made was conducted. An anticoagulant (heparin at 10,000 U, i.v.) and a vasodilator (1% sodium nitrite at 1 ml, i.v.) were administered. The cats were perfused through the ascending aorta, with 0.1 m PBS for 5 min while the arterial system was infused with aldehyde fixatives (1.5% glutaraldehyde/1% paraformaldehyde in 0.1 m PBS) for 20 min. Finally, to cryoprotect the tissue, 10% sucrose in 0.1 m PBS was perfused for 5 min. All solutions were buffered at pH 7.4 and infused at a rate of 100 ml/min. The net effect of the procedures was to exsanguinate the cat, a method that complies with the recommendations of the American Veterinary Medical Association Panel on Euthanasia (Beaver et al., 2001). The head was then placed in a stereotaxic apparatus; the brain was exposed, blocked at Horsley–Clarke coronal level A22, and removed from the cranium (Horsley and Clarke, 1908). Each brain was photographed and placed in 30% sucrose in 0.1 m PBS until it sank. Brains were frozen, and coronal sections (50 μm thick) were cut and collected serially. Sections were mounted onto gelatinized glass slides, stained with cresyl violet to reveal the presence of Nissl bodies, dehydrated, and coverslipped.
Data analysis.
In total, we recorded the neuronal activity from 535 A1 and 253 AAF locations. A1 and AAF were defined on the basis of their short response latency (8–25 ms) and continuous tonotopy (Imaizumi et al., 2004). Their mutual border was delineated by a reversal of tonotopic organization, with highest frequencies represented at the border. All other boundaries were determined using nonresponsive and non-A1/AAF sites. The recorded receptive fields were randomized and analyzed by a blind observer based on the following three parameters: (1) characteristic frequency (CF), defined as the tone frequency that evokes a reliable response at the lowest intensity level; (2) threshold, minimum intensity level that evoked a consistent neural response; and (3) bandwidths, receptive field widths above threshold in 5 dB SPL steps. Additionally, a custom-made program using MATLAB (MathWorks) generated a peristimulus time histogram (PSTH) from all the responses to tonal stimulation at each recorded site. The response strength was defined as the maximum number of spikes per second in the PSTH, and the noise level was calculated as the mean spike rate 50 ms before tone presentation. The onset latency was calculated as the time in the PSTH in which evoked neuronal activity reached 2 SDs above noise; peak latency was defined as the time in the PSTH in which the maximum number of driven spikes occurred, and end latency was measured as the time in the PSTH in which evoked activity returned to within 2 SDs of the noise level. Recording sites that did not return to 75% of their original firing rate (warm condition) during the rewarm condition were not included in the analysis of A1/AAF cooling effects. This criterion was implemented to reduce the possibility that the changes observed were a consequence of neuronal death rather than cortical deactivation. All statistical comparisons in this study were conducted with a two-tailed unpaired Student's t test. Characteristic frequency and thermal cortical maps were constructed by generating Voronoi tessellations (Fig. 1C) (Kilgard and Merzenich, 1998).
Results
The purpose of this investigation was to assess the bidirectional processing contributions between A1 and the AAF of the cat. The results are divided into three sections. In the first section, response characteristics of A1 and AAF neurons are described and compared. Section two examines the response properties of A1 neurons during deactivation of AAF and the response properties of AAF neurons during deactivation of A1. Last, section three compares the nonreciprocal bidirectional modulatory properties of AAF and A1.
Comparison of A1 and AAF response properties
The primary auditory cortices of all nine animals investigated in this study were bounded by the region circumscribed by the suprasylvian sulcus, the posterior ectosylvian sulcus, and the anterior ectosylvian sulcus. In contrast, the anterior auditory fields examined were located between the suprasylvian sulcus and the anterior ectosylvian sulcus. Consistent with previous reports, the tonotopic organization identified in A1 and AAF differed in gradient direction. The borders between the two fields were generally located dorsal to the anterior ectosylvian sulcus at the region of high-frequency representation of A1 and AAF (Merzenich et al., 1975; Knight, 1977; Reale and Imig, 1980).
Temporal measures
The serial processing of acoustic information between any two cortical fields would require one area to respond earlier than the other. To investigate the possibility of exclusively serial processing of acoustic information existing between A1 and AAF, we measured the onset, peak, and end latency of 535 A1 and 253 AAF sites within nine right hemispheres. No significant differences were found in response latencies between these fields (Fig. 2A). These results indicate that it is unlikely that information exchange between A1 and AAF is entirely processed sequentially and that at least some aspects of the processing must be conducted in parallel.
Figure 2.

Response properties of A1 and AAF neurons. A, PSTHs of responses from 535 A1 sites and 253 AAF sites. B, Cumulative area distribution of nine A1 and nine AAF cortices. C, Neuronal threshold measures of A1 and AAF neurons. Colored region (red and green) in A and B, and error bars in C represent ±SEM. Gray shaded regions in B indicate location of statistical significance at p < 0.05. *p < 0.0001.
Cortical representation of tonal stimuli
A clear tonotopic organization was observed in all nine animals studied. A1 showed a uniform distribution in the gradient of characteristic frequency representation, whereas AAF revealed an underrepresentation of neurons tuned from ∼2000 to ∼6000 Hz. Figure 2B illustrates the observed phenomenon by plotting the average cumulative amount of cortical area tuned to specific characteristic frequencies. The more evenly distributed characteristic frequencies in A1 make its cumulative distribution increase in a smooth and monotonic manner. In comparison, the slope of AAF diminishes for low to mid-frequencies, indicating a lack of neurons tuned to this frequency range. The gray shaded regions highlight the frequencies at which statistically significant (p < 0.05) differences were observed between the cumulative distributions of A1 and AAF. Therefore, although A1 and AAF are tonotopically organized, they differ in the proportion of cortical area tuned to specific frequencies.
Threshold measures
The neuronal thresholds of A1 and AAF were investigated by identifying the minimum intensity level at which a reliable neuronal response was attainable for each recorded receptive field. These values were then classified based on characteristic frequency and grouped in one of seven frequency bins. Frequency bins were separated by one octave and ranged from 500 to 64,000 Hz. A1 cells with characteristic frequencies ranging from 32,000 to 64,000 Hz exhibited a significantly lower (p < 0.0001) neuronal threshold than cells of matching frequencies in AAF (Fig. 2C). Therefore, only A1 and AAF cells tuned to high frequencies differ in neuronal thresholds.
Effects of deactivation on neuronal response
Deactivation assessment
Cortical deactivation was assessed to confirm that changes in response properties were a consequence of neuronal activity suppression in the cooled region and not a direct effect of cooling deactivation on the recorded field. To minimize the possibility of cooling contamination in the recording area, loops were placed over the low-frequency representations of A1 and AAF. These regions were chosen because they are the most distant from the common high-frequency border between A1 and AAF.
Extent.
At the end of each experiment, the extent of deactivation produced by cooling was assessed by measuring the cortical temperature at the same location as each electrophysiological recording site during cooling deactivation (Fig. 3). Previous reports have shown that cortical activity is abolished at temperatures below 20°C (Bénita and Condé, 1972; Lomber et al., 1994, 1996; Lomber, 1999; Chafee and Goldman-Rakic, 2000). Based on these reports, we were able to confirm that the deactivated region did not extend into the recording field and did not deactivate adjacent cortical areas. In addition, this procedure allowed us to verify that the proportions of A1 and AAF deactivation were comparable in size between each other and across animals.
Figure 3.

Representative example of changes in cortical temperature during epochs of cooling deactivation. A, Characteristic frequency representation of primary and nonprimary fields of auditory cortex and location of A1 and AAF cooling loops (gray-shaded regions). B, Temperature changes in cortical temperature during periods of AAF cooling. C, Temperature changes in cortical temperature during periods of A1 cooling. Note that AAF cooling included the ventral half of AAF (low-frequency representation) and did not extend into any portion of A1. Also note that A1 cooling only included the posterior half of A1 (low-frequency representation) and did not extent to any portion of AAF. Sulci are indicated by thick black lines. X symbols indicate unresponsive cortical sites. AI, Primary auditory area; DZ, dorsal zone of auditory cortex; PAF, posterior auditory field; pes, posterior ectosylvian sulcus; ss, suprasylvian sulcus; aes, anterior ectosylvian sulcus; D, dorsal; A, anterior. Scale bar, 2 mm.
Magnitude.
The degree of deactivation was calculated at a site immediately underneath the cooling loop placement. PSTHs and receptive fields were generated during the five phases of the deactivation cycle. This measure was conducted before any recordings in the adjacent field and provided verification of the elimination of neuronal activity at the site of cooling deactivation. Figure 4 shows a representative example of the effects of cooling on neuronal activity during the five stages of cooling deactivation. Figure 4 (left) illustrates the changes in response strength, and Figure 4 (right) shows the magnitude and location of the effects on receptive field structure. In Figure 4, it can be seen that the activity recorded before and after cooling is almost indistinguishable and that a complete silencing of neuronal activity is achieved during epochs of cooling.
Figure 4.
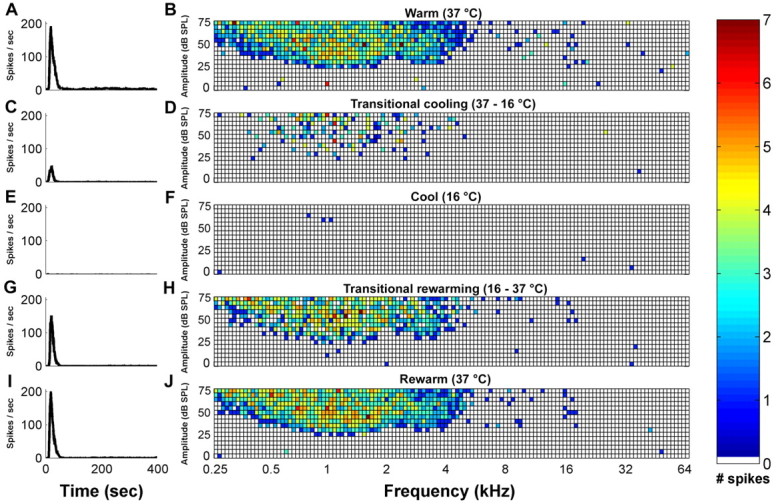
Peristimulus time histograms and corresponding receptive fields of an AAF site recorded directly beneath a cryoloop during the five stages of a cooling cycle. Data collected (1) before the initiation of cooling (A, B), (2) through the transitional cooling (C, D), (3) while cooled (E, F), (4) during the transitional rewarming (G, H), and (5) during AAF rewarmed epochs (I, J). Note that each square in the grid represents a frequency–intensity combination presented during the recording period. White squares indicate no spikes during the recording period in response to a tone presentation. Temperatures were measured at the cooling loop thermocouple and indicate the stage of the cooling cycle.
Effects of AAF deactivation on A1 response properties
Three major changes in A1 response properties were observed during AAF deactivation: a reduction in response strength, an increase in neuronal threshold, and a sharpening of receptive field bandwidths. Figure 5A–F shows a representative example of the changes in response magnitude of A1 activity before and during AAF deactivation. The difference between the two conditions reveals a widespread decrease in A1 activity. Although the subtraction of the before and after cooling conditions highlights the overall decrease in response activity, it does not provide information with regard to the frequency–intensity locations of the stimulus set that induced a neuronal response before but not during the cooling epoch. To highlight this difference, a binary subtraction was conducted (Fig. 5H). Black squares are located at frequency–intensity combinations in which there was a response in A1 previous but not during AAF deactivation. Figure 5G highlights the magnitude of these changes. This representative example shows a decrease in response activity in addition to specific structural changes in A1 receptive fields during AAF deactivation.
Figure 5.

Representative neuronal activity changes recorded from a single site in A1 before and during cooling deactivation of AAF. Peristimulus time histograms and corresponding receptive fields of a recording site located in A1 before (A, B) and during (C, D) AAF cooling. Subtraction of A1 activity recorded before AAF cooling from the activity of the same neuron during AAF cooling (E, F). Binary subtraction of active locations recorded in A1 during normal AAF activity from active locations recorded during AAF deactivation (G, H). Note that black squares indicate locations that were activated by tonal stimulation in A1 during periods of AAF normal activity but not during periods of AAF cooling deactivation.
Response strength.
Two analytical approaches were used to quantify acoustically evoked activity. In the first analysis, individual PSTHs were generated as the cumulative response of A1 neurons and were matched to the associated cycle phase (Fig. 6A,B). A significant decrease (p < 0.001) of 42% from the peak response strength was measured in A1 sites during AAF deactivation (Fig. 7A). In the second quantification method, we calculated the cumulative maximum number of spikes per second for each recorded site. The individual and group values are illustrated in Figure 8, A and B. This analysis revealed a significant difference (p = 0.0054) in the average of A1-driven responses before and during epochs of AAF cooling deactivation. Both analytical approaches used resulted in a statistically significant change of response strength, providing evidence of a substantial modulatory influence of AAF over A1 responses.
Figure 6.

A, A1 neuronal activity during the five stages of AAF cooling deactivation. B, Temperature changes recorded at the cooling loop during a complete deactivation cycle. The colors of the panels in A match the colors of B and indicate the times during which the peristimulus time histograms were recorded. Note the massive decrease in activity during the cool condition (dark blue) compared with the activity recorded during the warm (red) and rewarm (black) conditions in A. Also note that the PSTHs recorded during the warm and rewarm conditions show a striking resemblance to each other.
Figure 7.
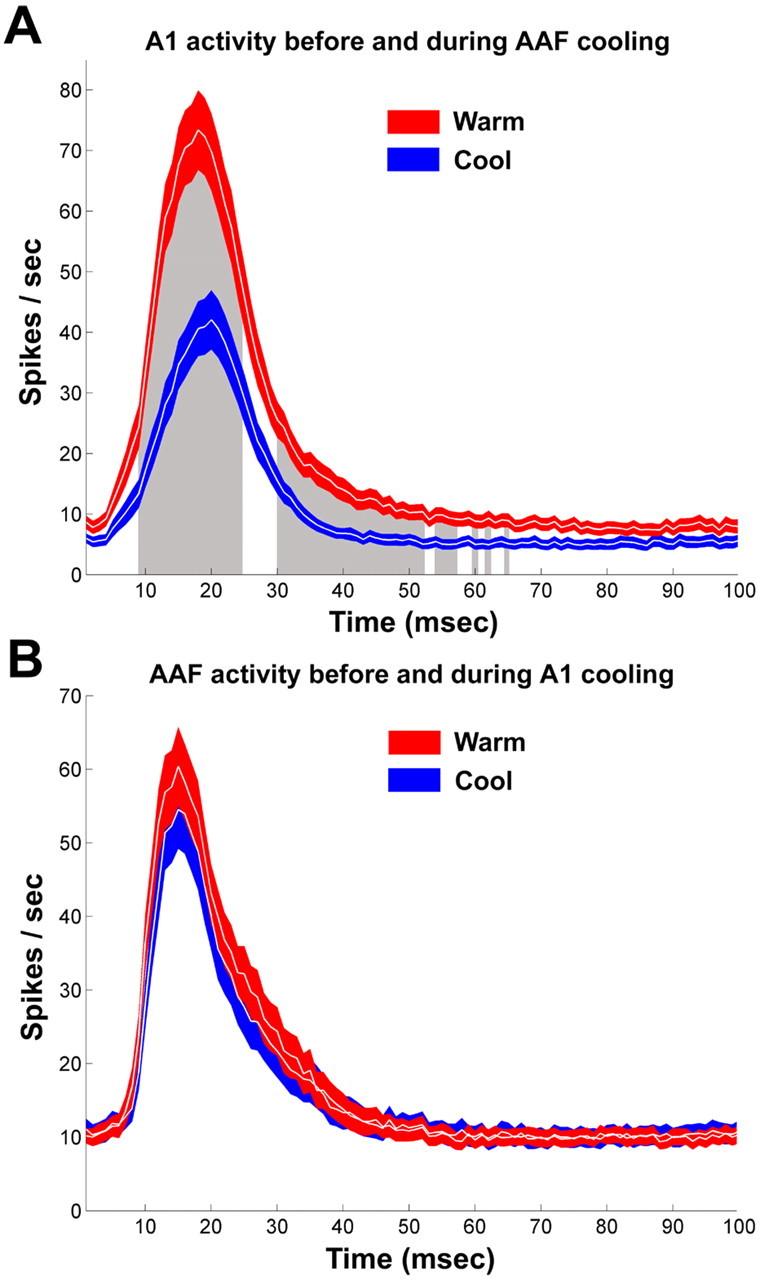
A, Comparison of PSTHs from A1 cells before and during cooling deactivation of AAF. B, Comparison of PSTHs from AAF cells before and during cooling deactivation of A1. Neuronal activity is shown before (warm, red) and during (cool, blue) deactivation. PSTHs were constructed from the cumulative responses within each receptive field. Note that, during periods of AAF deactivation, cells in A1 showed a large decrease in activity (blue curve in A). In comparison epochs of A1, cooling did not produce a decrease of activity in AAF (blue curve in B). A1, n = 91; AAF, n = 121. Colored regions (red and blue) represent ±SEM. Gray-shaded regions in A indicate location of statistical significant changes at p < 0.01.
Figure 8.

Mean peak response strength to tonal stimuli before, during, and after cooling deactivation. A, The response of A1 neurons is plotted before (x-axis) and after (y-axis) AAF deactivation with the least-square regression line plotted in gray. Similarly plotted is the peak response strength of AAF neurons during A1 deactivation with the corresponding least-square regression line plotted in gray (C). B, D, Average peak response strength of A1 and AAF neurons recorded before, during, and after periods of AAF and A1 cooling deactivation. Error bars indicate the ±SEM. A1, n = 91; AAF, n = 121. *p < 0.01.
Threshold.
The neuronal sensitivity to acoustic signals was measured. This level was determined to be the minimum intensity (decibels sound pressure level) needed to reliably produce a neuronal response. On average, the neuronal threshold of A1 sites significantly increased (p = 0.000043) by 11.65 dB. This change in sensitivity was present during periods of AAF cooling and returned to baseline levels after the termination of cooling deactivation (Fig. 9A). This increase in neuronal threshold was likely provoked by a widespread decrease of neuronal activity that abolished responses in the perimeter of A1 receptive fields.
Figure 9.
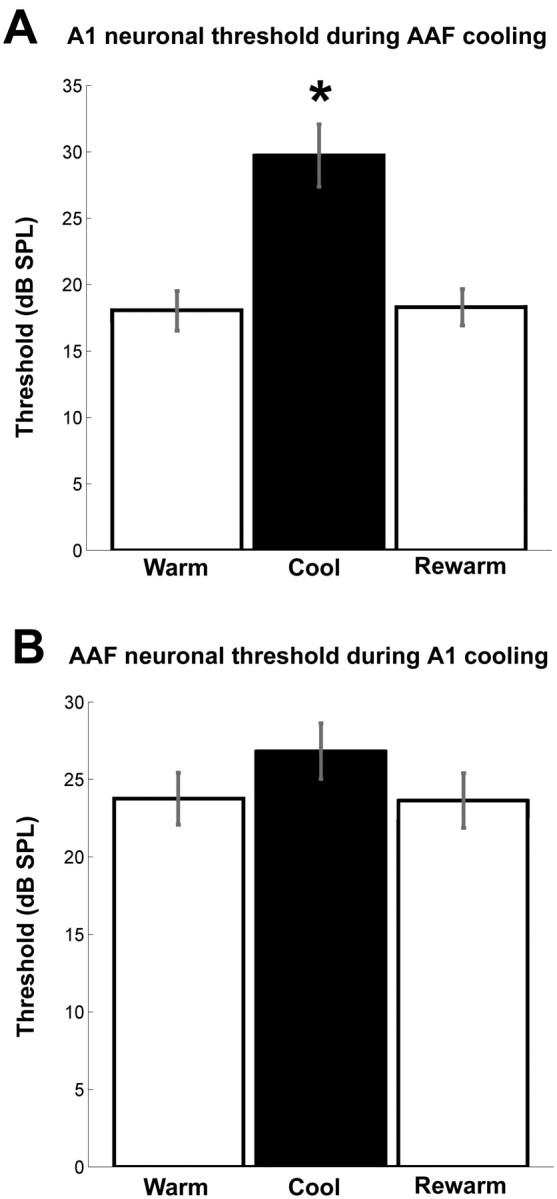
Neuronal thresholds changes before, during, and after cooling deactivation. A, Changes in A1 threshold sensitivity during cooling deactivation of AAF. B, Changes in AAF threshold sensitivity during cooling deactivation of A1. Note that there is a statistically significant change in neuronal thresholds in A1 cells during periods of AAF cooling deactivation but not in AAF cells during A1 deactivation. Error bars indicate ±SEM. A1, n = 79; AAF, n = 116. *p < 0.00001.
Bandwidth.
We implemented two quantification techniques to investigate the changes in receptive field bandwidth induced by cooling deactivation. First, we measured the bandwidth of each receptive field at 5 dB steps from 5 to 75 dB SPL above neuronal threshold. This analysis yielded a statistically significant decrease (p < 0.05) in A1 sites during AAF deactivation at 65 and 70 dB SPL above threshold (Fig. 10A). This quantification approach is problematic because of an inherent bias. As presented in the previous section, neuronal thresholds change during periods of deactivation. Because this analysis does not account for these differences in receptive field properties, the result is an apparent invariability of bandwidth measures. This bias was resolved by the computation of bandwidth sizes at 5 dB steps, from 5 to 75 dB not above neuronal threshold but above 0 dB SPL. This analysis resulted in a uniform statistically significant decrease (p < 0.005) of bandwidth sizes from 10 to 65 dB (Fig. 10C). Collectively, the changes observed in response strength, neuronal thresholds, and bandwidth measures in A1 cells indicate that AAF modulates multiple A1 response properties to tonal stimuli.
Figure 10.

Change in A1 and AAF receptive field bandwidths during cooling deactivation. Mean receptive field bandwidths at 15 intensities (decibels sound pressure level) above neuronal threshold in A1 and AAF sites before and during cooling deactivation (A, B). Mean receptive field bandwidths calculated at each of the 15 intensities (decibels sound pressure level) presented above 0 db SPL for A1 and AAF neurons before and during cooling deactivation (C, D). Note that a uniform decrease of receptive field bandwidth size was observed in A1 neurons during AAF cooling deactivation. In contrast, this change was not seen in AAF sites during A1 deactivation. Error bars indicate ±SEM. A1, n = 79; AAF, n = 116. *p < 0.007; **p < 0.5.
Effects of A1 deactivation on AAF response properties
In contrast to the considerable changes observed in neuronal activity of A1 neurons during AAF deactivation, no statistically significant alterations in the response strength of AAF neurons during epochs of A1 deactivation were revealed. It is important to note, however, that, although the group data analysis did not establish statistically significant changes, variations in response characteristics of individual recording sites were observed. Specifically, in 11 of 121 AAF sites examined (9.1%), a large reduction of 66% or more of the original firing rate was recorded during epochs of A1 deactivation; in 22 of 121 sites (18.2%), a mid-sized reduction between 33 and 66% of the original firing rate was measured; in 88 of 121 recorded sites (72.7%), a small reduction of <33% of the firing rate or an increase in response strength was revealed during epochs of A1 deactivation (Fig. 8C,D). In agreement with the lack of large changes in response strength from the majority of recorded sites, the neuronal thresholds of AAF sites did not change during A1 deactivation (Fig. 9B). Last, a significant narrowing of receptive fields (p < 0.01) was only present at 70 and 75 dB above 0 dB SPL (Fig. 10B,D). Overall, this analysis revealed that A1 deactivation induced small, medium, and large changes in response characteristics of specific AAF cells but did not change the general response properties of AAF cells as observed in the comparison of individual and group data analyses.
Response latencies
Three types of latency measures were calculated for each recorded site: onset, peak, and end latencies. This analysis was designed to identify the flow of acoustic information between A1 and AAF based on timing responses. The average population data of A1 latency measures revealed no statistically significant changes during epochs of AAF deactivation, suggesting that the processing of tonal signals in A1 is not dependent on AAF input (Fig. 11). A similar analysis of AAF latency measures showed no statistically significant changes before and during A1 deactivation (Fig. 12). A detailed analysis of latency measures for each data point was also conducted. This analysis revealed that the latency measures of the vast majority of A1 cells (onset, 89.9%; peak, 94.9%; end, 92.4%) underwent a change of <33% from the original firing rate. Comparably, the response latencies measures of the majority of AAF cell did not show any significant variations before and during periods of A1 deactivation (onset, 87.1%; peak, 93.1%; end, 91.4%). Consequently, this analysis provides evidence suggesting that thalamocortical connections terminating in A1 and AAF permit these fields to process acoustic information in parallel, regardless of any subsequent corticocortical processing.
Figure 11.

Neuronal latency changes in A1 sites during periods of AAF deactivation. Changes in onset latency (A), peak latency (B), and end latency (C). All A1 recorded sites are plotted before (x-axis) and during (y-axis) AAF deactivation for each latency measure. D, Summary of mean neuronal changes in A1 latency measures during AAF deactivation. Error bars indicate ±SEM; n = 79.
Figure 12.

Neuronal latency changes in AAF sites during periods of A1 deactivation. Changes in onset latency (A), peak latency (B), and end latency (C). All AAF recorded sites are plotted before (x-axis) and during (y-axis) A1 deactivation for each latency measure. Summary of mean neuronal changes in AAF latency measures during A1 deactivation. Error bars indicate ±SEM; n = 116.
Effects on neurons tuned to the deactivated frequency range
The mutual connectivity between A1 and AAF is frequency matched; thus, it was important to investigate whether neurons tuned to the deactivated frequency range incurred a larger decrease in response strength than nonmatched neurons. This analysis was technically difficult to accomplish for two reasons. First, the deactivated region of A1 was generally located in the low to mid-frequency range of the tonotopic map to avoid cooling extent to the bordering regions. Although the extent of deactivation was controlled, the lack of AAF neurons with low to mid-range characteristic frequencies made it difficult to collect a sizable number of neurons that met this criterion. Similarly, the deactivation of AAF was generally located in the low-frequency region to avoid cooling contamination onto high-frequency representations of A1. However, the matching low-frequency neurons in A1 were located within the banks of the posterior ectosylvian sulcus. As explained in Materials and Methods, we did not record from the sulci to avoid laminae response biases. Thus, the direct analysis of the effects of neuronal activity with matching frequencies could not be conducted. However, an indirect approach to investigate this question was implemented. We grouped the response strength data of all the recorded receptive fields and calculated the average number of spikes recorded for each frequency–intensity combination. The changes observed were uniformly distributed throughout all frequencies and did not show a specific decrease in neuronal activity in the low-frequency regions of A1 or AAF (Figs. 13, 14). Last, we measured the shifts in characteristic frequency properties during periods of deactivation.
Figure 13.
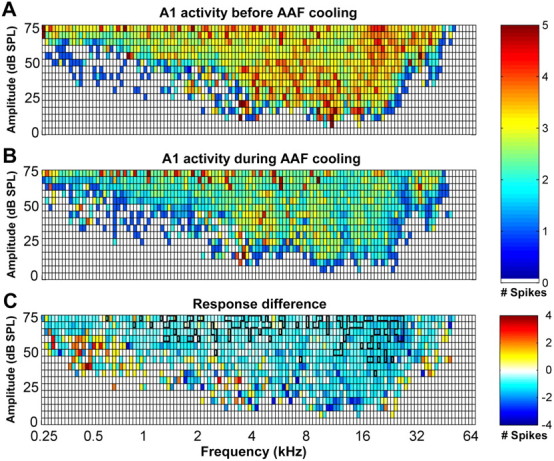
Mean response strength of A1 neurons to specific tonal stimuli before (A) and during (B) AAF deactivation. The color of each square in the table represents the average number of spikes evoked at the corresponding frequency–intensity combination. C, Subtraction of the response strength of A1 before AAF deactivation (A) from the response strength of A1 during AAF deactivation (B). Note that the decrease in driven activity of A1 cells during AAF cooling deactivation is uniform throughout the frequency–intensity domain. No change is represented by white boxes. In C, regions circumscribed by the thick black lines indicate statistically significant changes at p < 0.05; n = 79.
Figure 14.
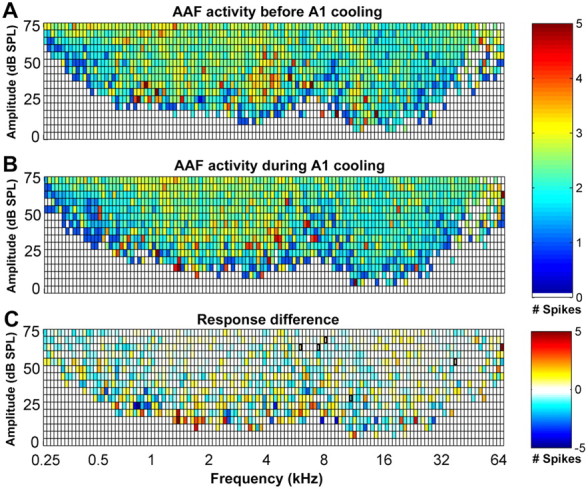
Mean response strength of AAF neurons to specific tonal stimuli before (A) and during (B) A1 deactivation. The color of each square in the table represents the average number of spikes evoked at the corresponding frequency–intensity combination. C, Subtraction of the response strength of AAF before A1 deactivation (A) from the response strength of AAF during A1 deactivation (B). Note that the decrease in driven activity of AAF cells during A1 deactivation is not uniform throughout the frequency–intensity domain. Large regions of responsive areas resulted in a net effect of no change indicated by a white box. In C, regions circumscribed by the thick black line indicate statistically significant changes at p < 0.05; n = 116.
On average, the population data of A1 neuronal tuning properties during AAF cooling deactivation failed to show any significant changes in characteristic frequency shifts (Fig. 15A). Comparably, the population data of AAF characteristic properties during A1 deactivation was not altered (Fig. 15B). Although the group data analysis suggests that the tuning properties of A1 and AAF neurons are not determined by their mutual corticocortical connectivity, many neurons exhibited large variations in tuning properties. The change observed in individual recording sites is a possible result of degraded receptive field structures provoked during cooling deactivation periods rather than a shift of neuronal tuning preference. However, we cannot rule out the possibility of a complex pattern of receptive field tuning changes that our analysis may have not identified.
Figure 15.
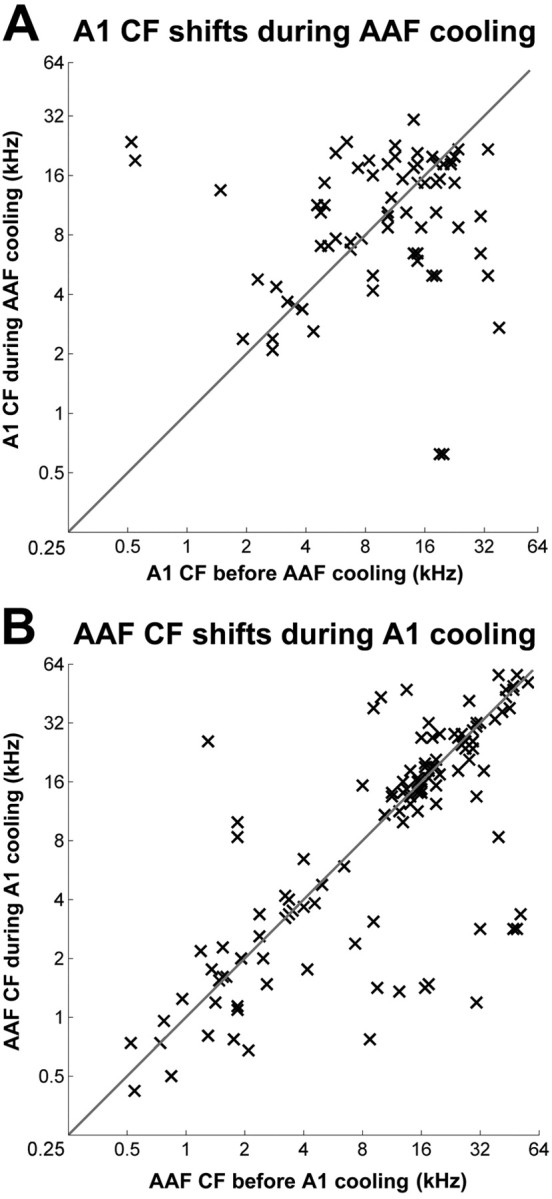
A, CFs of A1 before and during cooling deactivation of AAF. B, CFs of AAF before and during cooling deactivation of A1. CFs are plotted in a before (x-axis) and during (y-axis) cooling deactivation manner. A1, n = 79; AAF, n = 116.
Differential modulatory effects between A1 and AAF
The degree of modulatory effects between A1 and AAF was examined. In particular, the change in the number of driven spikes and the number of active frequency–intensity locations within the receptive fields of A1 and AAF cells was quantified before and during epochs of cooling deactivation. On average, the reduction in neuronal activity observed in AAF during epochs of A1 cooling deactivation was significantly different (p = 0.00025) from the decrease of neuronal activity observed in A1 cells during AAF deactivation. Note that this analysis is comparable with the measures of response strength described previously but considers only the driven activity observed within the receptive field rather than within the cumulative PSTHs. Thus, the direction of change remains constant, but the magnitude differs slightly from the aforementioned analysis. Similar changes were observed in the quantification of active frequency–intensity locations within A1 and AAF receptive fields. On average, the decrease of active A1 locations during AAF deactivation was significantly different (p = 0.0014) from the decreased in the number of active AAF locations during A1 cooling deactivation. The differential influence of neuronal activity exerted by A1 and AAF on each other suggests that projections from AAF to A1 may have a larger modulatory effect on the neuronal activity of A1 neurons than A1 neurons do on the neuronal activity of AAF.
Discussion
Effect of AAF deactivation on A1 response properties
Deactivation of AAF neurons elicited a substantial change in the response strength of A1 activity that was not matched to the specific frequency range of AAF deactivation. This observation may be explained by the mutual connectivity of A1 and AAF neurons. It has been reported that as many as 30% of the AAF–A1 connections originate from frequency-mismatch locations (Lee et al., 2004a). Thus, deactivation of a specific frequency range in AAF could have a strong effect throughout A1. In addition to changes in response strength, the receptive fields of A1 neurons underwent considerable structural alterations during AAF deactivation. Specifically, A1 neurons showed a substantial increase in neuronal thresholds and a sharpening of bandwidth measures during epochs of AAF deactivation. Both of these changes in structure can be attributed to the general properties of A1 receptive fields. Usually, the center of A1 receptive fields has a higher firing rate than its perimeter. Thus, a widespread decrease in firing rate should result in the removal of low count firing regions, namely its bordering area. This model can explain the increase in neuronal threshold and decrease in bandwidths of A1 neurons during deactivation of AAF. In comparison, no changes in response latencies and tuning of A1 neurons were observed during AAF deactivation, suggesting that not all A1 response features are dependent on AAF activity.
Effect of A1 deactivation on AAF response properties
The analysis of the population data of AAF neurons during epochs of A1 deactivation did not reveal statistically significant changes in receptive field structure. However, ∼10% of the neurons recorded underwent a profound change in response properties. Our results are comparable with reports in the rhesus monkey in which it has been shown that the physical removal of A1 does not significantly affect the response properties of neurons in the rostral auditory field (area R) (Rauschecker et al., 1997). The findings of this study are important because area R in the rhesus monkey shares multiple properties with AAF in the cat, including tonotopy and cortical location. Thus, the similarity of our results with this previous report suggests that the inability of A1 neurons to alter AAF responses may not be unique to the feline model and may be generalized to other species.
Response properties of A1 and AAF neurons
Our findings are in general agreement with previously published work describing the response properties of A1 and AAF to tonal stimuli (Reale and Imig, 1980; Imaizumi et al., 2004). First, we found both fields to be tonotopically organized with a reversal of CF gradient at their mutual border. Second, the representation of CFs in A1 of all animals examined was evenly distributed. In comparison, the cortical representation of CFs in AAF was irregular with an underrepresentation of cells tuned to mid-range frequencies. As reported previously by Imaizumi et al. (2004), we found the neuronal thresholds to vary between A1 and AAF in cells with high CFs. However, some differences were observed between our results and previously published work. In particular, we did not find neuronal response latency differences between A1 and AAF as reported by Imaizumi et al. (2004). One plausible explanation for this discrepancy is that we measured response latencies by calculating a difference of 2 SDs from the neuronal noise level to indicate the onset and end measures. In comparison, Imaizumi et al. (2004) used the minimum value in the latency-level function at CF to determine latency measures. Overall, our results fit well with previous reports on the spectral properties of A1 and AAF neurons, and the differences discussed are a likely consequence of dissimilar analytical approaches.
Comparison with other sensory modalities
Experiments in the somatosensory system have explored the interactions between the primary and secondary cerebral cortical areas SI and SII. These experiments have been conducted in the cat (Turman et al., 1992, 1995), marmoset (Zhang et al., 1996), possum (Coleman et al., 1999), rabbit (Murray et al., 1992), tree shrew, and the prosimian galago (Garraghty et al., 1991). In these studies, it was consistently demonstrated that the deactivation of SI does not result in the silencing of SII neurons as reported previously by Pons et al. (1987) but rather results in a decrease of SII neuronal firing rate. From these studies, it was concluded that the reduction in SII activity is attributable to a loss of background facilitation rather than an obstruction of a component of peripheral input that relays in SI before arriving to SII (Zhang et al., 1996). The consistent results obtained from multiple species suggest a parallel rather than a serial processing flow of somatic information. Comparably, deactivation of SII neurons in the cat produced an ∼40% decrease in response strength of SI neurons (Turman et al., 1995). These observations are in accord with our results in auditory cortex and suggest that the cerebral cortex may process acoustic and somatosensory information comparably.
Conversely, visual cortex has been reported to process information serially. In the visual cortex of macaque monkeys, deactivation of the primary visual cortex (V1) results in the silencing of neurons in areas V2–V4 (Girard and Bullier, 1989; Girard et al., 1991a). Based on these results, it has been suggested that neither the direct geniculate input nor feedback projections from the middle temporal area form a network capable of driving V2 neurons in the absence of V1 input. Collectively, results in the visual, somatosensory, and auditory systems reveal two distinct processing models of sensory information by the cerebral cortex. First, as shown in the visual system, information is processed serially, moving from primary to nonprimary processing areas. Second, as shown in the somatosensory and auditory systems, sensory information is processed in parallel, in which information from the thalamus arrives simultaneously to multiple cortical areas and is then modulated by corticocortical connections.
Modulatory and parallel processing in auditory cortex
The results of this study demonstrate that corticocortical connectivity among primary and nonprimary areas of auditory cortex can have a direct impact on an array of receptive field properties. Our observations suggest that acoustic information is processed in parallel as identified by the residual neuronal activity measured in AAF and A1 during epochs of cooling deactivation. This model of information processing is in accordance with previous anatomical studies that have reported A1 and AAF as having two parallel and independent inputs arriving from the MGB (Imaizumi et al., 2004). Recent reports have supported this model by providing evidence that the number of double-labeled neurons in the thalamus after A1 and AAF injections ranges between <1 and 2.8% of all labeled thalamic cells (Lee and Winer, 2008c; Kishan et al., 2008). Therefore, there can only be a very small number of thalamic neurons that project to both fields (Lee and Winer, 2008c; Kishan et al., 2008). The results from the present study support the model of parallel and independent signal processing conducted by A1 and AAF. Our results also suggest that neuronal activity in AAF may be more dependent on thalamic inputs than cortical inputs such as A1. However, because there are converging cortical (ipsilateral and contralateral) and thalamic inputs into every cerebral area, the only way this proposition can be confirmed is by reversible deactivation of specific regions of the MGB. In addition, these results point to the plausible existence of a second type of processing that is modulatory in nature and is conducted subsequently to the arrival of thalamocortical signals. This conclusion is based on the observed decrease, but not elimination, of A1 or AAF responses during epochs of deactivation.
Direction of modulatory processing
The direction of modulatory processing between fields A1 and AAF may be explained based on their respective thalamocortical connections. Both fields receive projections from the MGB (Andersen et al., 1980; Lee and Winer, 2008a). Approximately 80% of A1 thalamic afferents arise in the ventral division of the MGB (Lee and Winer, 2008c). In contrast, ∼40% of AAF thalamic afferents emanate from the ventral division and ∼35% from the rostral pole of the MGB (Lee et al., 2004b). A plausible explanation for the profound influence of AAF deactivation on A1 neurons is that, because AAF is the principal relay station between the rostral pole of the MGB and A1, deactivation of AAF may obstruct the flow of information moving from the rostral pole of the MGB to A1. In comparison, the deactivation of A1 may only play a small modulatory role on AAF response activity because both A1 and AAF receive most of their thalamocortical connections from the ventral division of the MGB. Thus, the information conveyed by the ventral division arrives at both fields (parallel processing) independent of their mutual communication, and neither A1 nor AAF serves as a relay station for this type of information. This model provides a plausible anatomical explanation for the serial and parallel processing of acoustic signals observed in the present study. In addition, it speculates that thalamocortical connections have a stronger impact on cortical activity than corticocortical projections.
Footnotes
This work was supported in part by grants from the Natural Sciences and Engineering Research Council of Canada, the Canadian Institutes of Health Research, and the Canada Foundation for Innovation. We thank Kelly N. Decker for technical assistance during electrophysiological recordings.
References
- Andersen RA, Knight PL, Merzenich MM. The thalamocortical and corticothalamic connections of AI, AII, and the anterior auditory field (AAF) in the cat: evidence for two largely segregated systems of connections. J Comp Neurol. 1980;194:663–701. doi: 10.1002/cne.901940312. [DOI] [PubMed] [Google Scholar]
- Azzopardi P, Fallah M, Gross CG, Rodman HR. Response latencies of neurons in visual areas MT and MST of monkeys with striate cortex lesions. Neuropsychologia. 2003;41:1738–1756. doi: 10.1016/s0028-3932(03)00176-3. [DOI] [PubMed] [Google Scholar]
- Bardy C, Huang JY, Wang C, Fitzgibbon T, Dreher B. “Top-down” influences of ipsilateral or contralateral postero-temporal visual cortices on the extra-classical receptive fields of neurons in cat's cytoarchitectonic area 17, striate cortex. Neuroscience. 2009;158:951–968. doi: 10.1016/j.neuroscience.2008.09.057. [DOI] [PubMed] [Google Scholar]
- Beaver BV, Reed W, Leary S, McKiernan B, Bain F, Schultz R, Bennett BT, Pascoe P, Shull E, Cork LC, Francis-Floyd R, Amass KD, Johnson RJ, Schmidt RG, Underwood W, Thornton GW, Kohn B. 2000 Report of the American Veterinary Medical Association Panel on Euthanasia. J Am Vet Med Assoc. 2001;218:669–696. [Google Scholar]
- Bénita M, Condé H. Effects of local cooling upon conduction and synaptic transmission. Brain Res. 1972;36:133–151. doi: 10.1016/0006-8993(72)90771-8. [DOI] [PubMed] [Google Scholar]
- Callaway EM. Feedforward, feedback and inhibitory connections in primate visual cortex. Neural Netw. 2004;17:625–632. doi: 10.1016/j.neunet.2004.04.004. [DOI] [PubMed] [Google Scholar]
- Chafee MV, Goldman-Rakic PS. Inactivation of parietal and prefrontal cortex reveals interdependence of neural activity during memory-guided saccades. J Neurophysiol. 2000;83:1550–1566. doi: 10.1152/jn.2000.83.3.1550. [DOI] [PubMed] [Google Scholar]
- Cheung SW, Nagarajan SS, Bedenbaugh PH, Schreiner CE, Wang X, Wong A. Auditory cortical neuron response differences under isoflurane versus pentobarbital anesthesia. Hear Res. 2001;156:115–127. doi: 10.1016/s0378-5955(01)00272-6. [DOI] [PubMed] [Google Scholar]
- Coleman GT, Zhang HQ, Murray GM, Zachariah MK, Rowe MJ. Organization of somatosensory areas I and II in marsupial cerebral cortex: parallel processing in the possum sensory cortex. J Neurophysiol. 1999;81:2316–2324. doi: 10.1152/jn.1999.81.5.2316. [DOI] [PubMed] [Google Scholar]
- Dreher B, Cottee LJ. Visual receptive-field properties of cells in area 18 of cat's cerebral cortex before and after acute lesions in area 17. J Neurophysiol. 1975;38:735–750. doi: 10.1152/jn.1975.38.4.735. [DOI] [PubMed] [Google Scholar]
- Felleman DJ, Van Essen DC. Distributed hierarchical processing in the primate cerebral cortex. Cereb Cortex. 1991;1:1–47. doi: 10.1093/cercor/1.1.1-a. [DOI] [PubMed] [Google Scholar]
- Garraghty PE, Florence SL, Tenhula WN, Kaas JH. Parallel thalamic activation of the first and second somatosensory areas in prosimian primates and tree shrews. J Comp Neurol. 1991;311:289–299. doi: 10.1002/cne.903110209. [DOI] [PubMed] [Google Scholar]
- Girard P, Bullier J. Visual activity in area V2 during reversible inactivation of area 17 in the macaque monkey. J Neurophysiol. 1989;62:1287–1302. doi: 10.1152/jn.1989.62.6.1287. [DOI] [PubMed] [Google Scholar]
- Girard P, Salin PA, Bullier J. Visual activity in areas V3a and V3 during reversible inactivation of area V1 in the macaque monkey. J Neurophysiol. 1991a;66:1493–1503. doi: 10.1152/jn.1991.66.5.1493. [DOI] [PubMed] [Google Scholar]
- Girard P, Salin PA, Bullier J. Visual activity in macaque area V4 depends on area 17 input. Neuroreport. 1991b;2:81–84. doi: 10.1097/00001756-199102000-00004. [DOI] [PubMed] [Google Scholar]
- Horsley V, Clarke RH. The structure and functions of the cerebellum examined by a new method. Brain. 1908;31:45–124. [Google Scholar]
- Imaizumi K, Priebe NJ, Crum PA, Bedenbaugh PH, Cheung SW, Schreiner CE. Modular functional organization of cat anterior auditory field. J Neurophysiol. 2004;92:444–457. doi: 10.1152/jn.01173.2003. [DOI] [PubMed] [Google Scholar]
- Kilgard MP, Merzenich MM. Cortical map reorganization enabled by nucleus basalis activity. Science. 1998;279:1714–1718. doi: 10.1126/science.279.5357.1714. [DOI] [PubMed] [Google Scholar]
- Kishan AU, Lee CC, Winer JA. Branched projections in the auditory thalamocortical and corticocortical systems. Neuroscience. 2008;154:283–293. doi: 10.1016/j.neuroscience.2008.01.010. [DOI] [PMC free article] [PubMed] [Google Scholar]
- Knight PL. Representation of the cochlea within the anterior auditory field (AAF) of the cat. Brain Res. 1977;130:447–467. doi: 10.1016/0006-8993(77)90108-1. [DOI] [PubMed] [Google Scholar]
- Lee CC, Winer JA. Connections of cat auditory cortex: I. Thalamocortical system. J Comp Neurol. 2008a;507:1879–1900. doi: 10.1002/cne.21611. [DOI] [PMC free article] [PubMed] [Google Scholar]
- Lee CC, Winer JA. Connections of cat auditory cortex: II. Commissural system. J Comp Neurol. 2008b;507:1901–1919. doi: 10.1002/cne.21614. [DOI] [PMC free article] [PubMed] [Google Scholar]
- Lee CC, Winer JA. Connections of cat auditory cortex. III. Corticocortical system. J Comp Neurol. 2008c;507:1920–1943. doi: 10.1002/cne.21613. [DOI] [PMC free article] [PubMed] [Google Scholar]
- Lee CC, Schreiner CE, Imaizumi K, Winer JA. Tonotopic and heterotopic projection systems in physiologically defined auditory cortex. Neuroscience. 2004a;128:871–887. doi: 10.1016/j.neuroscience.2004.06.062. [DOI] [PubMed] [Google Scholar]
- Lee CC, Imaizumi K, Schreiner CE, Winer JA. Concurrent tonotopic processing streams in auditory cortex. Cereb Cortex. 2004b;14:441–451. doi: 10.1093/cercor/bhh006. [DOI] [PubMed] [Google Scholar]
- Lomber SG. The advantages and limitations of permanent or reversible deactivation techniques in the assessment of neural function. J Neurosci Methods. 1999;86:109–117. doi: 10.1016/s0165-0270(98)00160-5. [DOI] [PubMed] [Google Scholar]
- Lomber SG, Cornwell P, Sun JS, MacNeil MA, Payne BR. Reversible inactivation of visual processing operations in middle suprasylvian cortex of the behaving cat. Proc Natl Acad Sci U S A. 1994;91:2999–3003. doi: 10.1073/pnas.91.8.2999. [DOI] [PMC free article] [PubMed] [Google Scholar]
- Lomber SG, Payne BR, Cornwell P. Learning and recall of form discriminations during reversible cooling deactivation of ventral-posterior suprasylvian cortex in the cat. Proc Natl Acad Sci U S A. 1996;93:1654–1658. doi: 10.1073/pnas.93.4.1654. [DOI] [PMC free article] [PubMed] [Google Scholar]
- Lomber SG, Payne BR, Horel JA. The cryoloop: an adaptable reversible cooling deactivation method for behavioral or electrophysiological assessment of neural function. J Neurosci Methods. 1999;86:179–194. doi: 10.1016/s0165-0270(98)00165-4. [DOI] [PubMed] [Google Scholar]
- Merzenich MM, Knight PL, Roth GL. Representation of cochlea within primary auditory cortex in the cat. J Neurophysiol. 1975;38:231–249. doi: 10.1152/jn.1975.38.2.231. [DOI] [PubMed] [Google Scholar]
- Murray GM, Zhang HQ, Kaye AN, Sinnadurai T, Campbell DH, Rowe MJ. Parallel processing in rabbit first (SI) and second (SII) somatosensory cortical areas: effects of reversible inactivation by cooling of SI on responses in SII. J Neurophysiol. 1992;68:703–710. doi: 10.1152/jn.1992.68.3.703. [DOI] [PubMed] [Google Scholar]
- Nakamoto KT, Jones SJ, Palmer AR. Descending projections from auditory cortex modulate sensitivity in the midbrain to cues for spatial position. J Neurophysiol. 2008;99:2347–2356. doi: 10.1152/jn.01326.2007. [DOI] [PubMed] [Google Scholar]
- Olfert ED, Cross BM, McWilliam AA. Ottawa: Canadian Council on Animal Care; 1993. Guide to the care and use of experimental animals. [Google Scholar]
- Palmer AR, Hall DA, Sumner C, Barrett DJ, Jones S, Nakamoto K, Moore DR. Some investigations into non-passive listening. Hear Res. 2007;229:148–157. doi: 10.1016/j.heares.2006.12.007. [DOI] [PubMed] [Google Scholar]
- Ponce CR, Lomber SG, Born RT. Integrating motion and depth via parallel pathways. Nat Neurosci. 2008;11:216–223. doi: 10.1038/nn2039. [DOI] [PMC free article] [PubMed] [Google Scholar]
- Pons TP, Garraghty PE, Friedman DP, Mishkin M. Physiological evidence for serial processing in somatosensory cortex. Science. 1987;237:417–420. doi: 10.1126/science.3603028. [DOI] [PubMed] [Google Scholar]
- Rauschecker JP, Tian B, Pons T, Mishkin M. Serial and parallel processing in rhesus monkey auditory cortex. J Comp Neurol. 1997;382:89–103. [PubMed] [Google Scholar]
- Reale RA, Imig TJ. Tonotopic organization in auditory cortex of the cat. J Comp Neurol. 1980;192:265–291. doi: 10.1002/cne.901920207. [DOI] [PubMed] [Google Scholar]
- Rockland KS, Pandya DN. Laminar origins and terminations of cortical connections of the occipital lobe in the rhesus monkey. Brain Res. 1979;179:3–20. doi: 10.1016/0006-8993(79)90485-2. [DOI] [PubMed] [Google Scholar]
- Rouiller EM, Simm GM, Villa AE, de Ribaupierre Y, de Ribaupierre F. Auditory corticocortical interconnections in the cat: evidence for parallel and hierarchical arrangement of the auditory cortical areas. Exp Brain Res. 1991;86:483–505. doi: 10.1007/BF00230523. [DOI] [PubMed] [Google Scholar]
- Salin PA, Bullier J. Corticocortical connections in the visual system: structure and function. Physiol Rev. 1995;75:107–154. doi: 10.1152/physrev.1995.75.1.107. [DOI] [PubMed] [Google Scholar]
- Sherrington CS. London: Constable; 1906. The integrative action of the nervous system. [Google Scholar]
- Silvanto J, Lavie N, Walsh V. Double dissociation of V1 and V5/MT activity in visual awareness. Cereb Cortex. 2005;15:1736–1741. doi: 10.1093/cercor/bhi050. [DOI] [PubMed] [Google Scholar]
- Turman AB, Ferrington DG, Ghosh S, Morley JW, Rowe MJ. Parallel processing of tactile information in the cerebral cortex of the cat: effect of reversible inactivation of SI on responsiveness of SII neurons. J Neurophysiol. 1992;67:411–429. doi: 10.1152/jn.1992.67.2.411. [DOI] [PubMed] [Google Scholar]
- Turman AB, Morley JW, Zhang HQ, Rowe MJ. Parallel processing of tactile information in cat cerebral cortex: effect of reversible inactivation of SII on SI responses. J Neurophysiol. 1995;73:1063–1075. doi: 10.1152/jn.1995.73.3.1063. [DOI] [PubMed] [Google Scholar]
- Winer JA, Miller LM, Lee CC, Schreiner CE. Auditory thalamocortical transformation: structure and function. Trends Neurosci. 2005;28:255–263. doi: 10.1016/j.tins.2005.03.009. [DOI] [PubMed] [Google Scholar]
- Zhang HQ, Murray GM, Turman AB, Mackie PD, Coleman GT, Rowe MJ. Parallel processing in cerebral cortex of the marmoset monkey: effect of reversible SI inactivation on tactile responses in SII. J Neurophysiol. 1996;76:3633–3655. doi: 10.1152/jn.1996.76.6.3633. [DOI] [PubMed] [Google Scholar]