

Abstract
Respiratory depression limits provision of safe opioid analgesia and is the main cause of death in drug addicts. Although opioids are known to inhibit brainstem respiratory activity, their effects on cortical areas that mediate respiration are less well understood. Here, functional magnetic resonance imaging was used to examine how brainstem and cortical activity related to a short breath hold is modulated by the opioid remifentanil. We hypothesized that remifentanil would differentially depress brain areas that mediate sensory-affective components of respiration over those that mediate volitional motor control. Quantitative measures of cerebral blood flow were used to control for hypercapnia-induced changes in blood oxygen level-dependent (BOLD) signal. Awareness of respiration, reflected by an urge-to-breathe score, was profoundly reduced with remifentanil. Urge to breathe was associated with activity in the bilateral insula, frontal operculum, and secondary somatosensory cortex. Localized remifentanil-induced decreases in breath hold-related activity were observed in the left anterior insula and operculum. We also observed remifentanil-induced decreases in the BOLD response to breath holding in the left dorsolateral prefrontal cortex, anterior cingulate, the cerebellum, and periaqueductal gray, brain areas that mediate task performance. Activity in areas mediating motor control (putamen, motor cortex) and sensory-motor integration (supramarginal gyrus) were unaffected by remifentanil. Breath hold-related activity was observed in the medulla. These findings highlight the importance of higher cortical centers in providing contextual awareness of respiration that leads to appropriate modulation of respiratory control. Opioids have profound effects on the cortical centers that control breathing, which potentiates their actions in the brainstem.
Introduction
Opioid drugs, such as morphine, are prescribed to millions of patients every day for the relief of severe pain. Although usually safe, opioids can cause potentially fatal depression of breathing. In vivo evaluation of drug effects on breathing is usually achieved by measuring depression of hypoxic and hypercapnic ventilatory responses (Bailey et al., 2000; Dahan and Teppema, 2003; Mitsis et al., 2009). These measurements give reliable estimation of drug-induced changes in chemoreflex responsiveness; however, brainstem respiratory control mechanisms are also modulated by inputs from higher centers in the cortex (Colebatch et al., 1991; Corfield et al., 1998; McKay et al., 2003, 2008). Although it is well established that opioids depress the brainstem respiratory control centers (Pattinson, 2008), in patients receiving opioids, pain and arousal state are particularly critical in determining the final respiratory output, suggesting that conscious mechanisms are also important.
Functional magnetic resonance imaging (fMRI) has enabled in vivo investigations of cortical influences on respiration in humans. Such studies suggest that the insula and operculum mediate dyspnea (Banzett et al., 2000; Evans et al., 2002; McKay et al., 2008; Peiffer, 2008; Peiffer et al., 2008; von Leupoldt et al., 2008), and the cingulate gyrus, the prefrontal cortex, and the supramarginal gyrus integrate emotional and sensory aspects of respiration. The motor cortex is implicated in the volitional control of breathing and speech (Gandevia and Rothwell, 1987; McKay et al., 2003; Brown et al., 2008). It is plausible that brain regions that express both high densities of opioid receptors and modulate respiration (particularly the insula, operculum, and prefrontal cortex) (Baumgärtner et al., 2006; Tracey and Mantyh, 2007) are likely to have a role in mediating opioid-induced respiratory depression. In this study, we investigated the effect of the opioid remifentanil on volitional respiration by assessing changes in the brain centers that mediate a short expiratory breath hold. Breath holding is initially a motor act, but soon causes a strong urge to breathe, which eventually overpowers the volitional inhibitory act (Parkes, 2006). Breath holding therefore tests both the motor and sensory/affective components of respiration. We hypothesized that opioids would strongly modulate the sensory and affective components of the breath hold, but have a lesser effect on the motor component. We would therefore be able to isolate the volitional aspects of respiratory control from those that are sensory and affective. We hypothesized the activity in brain areas mediating these feelings of respiratory urge would be diminished by remifentanil.
One difficulty with imaging opioid effects in the brain is that the associated respiratory depression leads to a rise in arterial carbon dioxide tension (PaCO2) causing an increase in cerebral blood flow (CBF) (MacIntosh et al., 2008), thereby dampening a task-induced blood oxygen level-dependent (BOLD) response (Cohen et al., 2002). Therefore we measured CBF using an arterial spin-labeling (ASL) technique and incorporated these measurements into our data analysis. Further explanation of our methodological rationale can be found in the supplemental material (available at www.jneurosci.org).
Materials and Methods
Subjects
The Oxfordshire Clinical Research Ethics Committee approved the study, and volunteers gave written, informed consent. Twelve healthy volunteers (10 males, 2 females; mean age ± SD, 30 ± 6 years) were examined on three different occasions. One subject (male) was excluded because of an inability to comply with the experimental protocol. Exclusion criteria included medication or drugs acting on the central nervous or respiratory systems for therapeutic or recreational use. A medical history and, where appropriate, a physical examination were performed to ensure that the subjects were healthy [American Society of Anesthesiologists physical status 1 (Owens et al., 1978)] and that there was no contraindication to remifentanil or to magnetic resonance imaging. The first examination was a medical screen to ensure that volunteers tolerated remifentanil, determined by an anesthetist monitoring blood pressure and oxygen saturation. On the second occasion, we performed the magnetic resonance imaging scanning described below, combined with a remifentanil infusion to an estimated plasma concentration of 1.0 ng/ml. Volunteers fasted before the first two visits (6 h for solids; 2 h for clear fluids) and were supervised for 1 h after termination of the infusion. Part of the data, pertaining to technical developments of the imaging and analysis, have previously been reported (Harvey et al., 2008; MacIntosh et al., 2008).
Breathing system
A breathing system was constructed that had minimal resistance to breathing, allowed rapid changes in inspired gas concentration, and eliminated rebreathing of expired gases. The resistance to breathing was kept minimal by using wide-bore respiratory tubing as a reservoir for inspiration. The individual gases were delivered separately to a mixing chamber near the subject, which facilitated rapid changes in gas concentrations. The total fresh gas flow rate was 30 L/min, which eliminated rebreathing of expired gases. The subjects wore a tight fitting facemask (Hans Rudolph), which was attached to the breathing system. The subjects were given 10 min before the experiment to become accustomed to the facemask and breathing system after positioning in the scanner. The subjects breathed a mixture of oxygen and air, and the end-tidal O2 partial pressure (PETO2) was maintained at 225 mmHg by manual control of the gas mixture, by a dedicated experimenter. This achieved similar control over end-tidal gas concentrations as an automated system (Wise et al., 2007).
Drug infusion
A target-controlled infusion of remifentanil (at a solution concentration of 10 μg/ml) was delivered via an indwelling intravenous cannula inserted into a vein in the left forearm. An estimated effect site concentration of 1.0 ng/ml was maintained with a pump (Graseby 3500 TCI incorporating Diprifusor; SIMS Graseby) (Gray and Kenny, 1998) that was preprogrammed according to a pharmacokinetic model of remifentanil (Minto et al., 1997a,b).
Physiological measurements
Oxygen saturations and heart rate were monitored continuously and noninvasive blood pressure was recorded before and after each scan (Invivo Research). The end-tidal CO2 partial pressure (PETCO2) and PETO2 were determined using rapidly responding gas analyzers (model CD-3A and S-3A; AEI Technologies) and continuously displayed and recorded with a data acquisition device (PowerLab 8; ADInstruments) connected to a laptop computer using dedicated software (Chart 5; ADInstruments).
Magnetic resonance imaging
Imaging was performed at 3T with a Thermo Fisher Scientific Trio system using a 12-channel head coil. The fMRI protocol (illustrated in Fig. 1) included a BOLD echo-planar image (EPI) acquisition optimized for image quality in the cortex, a BOLD sequence optimized for the brainstem, and a whole-brain ASL sequence, before and during the remifentanil infusion. The orders of each scan (brainstem, cortex, ASL) were randomized between subjects.
Figure 1.

Overview of the experiment. The order of the three scans was randomized between subjects. The bottom part of the picture shows the stimuli delivery during the whole-brain BOLD sequence. The stimuli presentations were similar in nature during the brainstem sequence, but without visual stimulation.
Cortex BOLD scanning.
We acquired 47 contiguous axial slices with a voxel size of 3 × 3 × 3.5 mm and an echo time (TE) of 30 ms. Volumes were acquired continuously with a repetition time (TR) of 3 s. The scan lasted 13 min, 21 s, and consisted of 267 volumes.
Brainstem BOLD scanning.
The field of view comprised 20 coronal oblique slices of the brainstem (sequence parameters: TE, 28 ms; TR, 1.5 s; voxel size, 2.5 × 2.5 × 3 mm). This scan also lasted 13 min, 21 s, and consisted of 534 volumes.
ASL scanning.
Nine subjects underwent a whole-brain ASL sequence to measure changes in CBF induced by remifentanil infusion (MacIntosh et al., 2008). These measurements were incorporated into the higher level fMRI analysis to help account for the confounding effects of global CBF changes on the BOLD signal. The scanning sequence incorporated multiple inflow measurements (i.e., different inflow times ranging from 500 to 2500 ms), and the whole sequence lasted 6 min, 30 s. The imaging volume was 200 × 200 × 96 mm (voxel dimensions, 3.125 × 3.125 × 5 mm). The TR and TE were 3100 and 39.9 ms, respectively. A calibration gradient and spin echo (GRASE) scan, required for CBF quantification, was performed with a long TR (6000 ms), long inversion time (5000 ms), and in the absence of background suppression, but otherwise identical imaging parameters.
Structural scanning.
For each subject, a T1-weighted structural scan (1 × 1 × 1 mm voxels) was acquired in the same imaging plane as the brainstem EPI scans. This was used for anatomical overlay of brain activation and image registration.
Stimuli and tasks
During the BOLD sequences, the subjects performed a series of tasks (Fig. 1) described by the following: expiratory breath hold (eight repeats), finger tapping (self-paced finger opposition right hand, eight repeats during cortex sequence, nine during brainstem sequence), and for the cortex sequence, visual stimulation (8 Hz flashing checkerboard; eight repeats). During scanning, the instructions for the breath-holding and finger opposition task were cued with written instructions on the screen (either “breath hold” or “finger tap” in white letters on a black background) that remained visible for the duration of the time they were required to perform that task. The subjects underwent a short instruction session before scanning, which gave the subjects a chance to practice the tasks. The instruction for the breath hold was to stop breathing at end expiration after the current breath, and maintain end expiration until the next cue 15 s later, therefore most breath holds were slightly <15 s. After each breath hold, the subject rated the “urge to breathe” using a 0–100 rating scale. The subjects were asked to imagine the strongest urge to breathe that they could and to rate the breath holds relative to this. A button box was used to move a slider displayed on the screen from 0 (written anchor was “no sensation”) to 100 (written anchor was “most intense sensation”).
The duration of finger tapping and visual stimulation was 15 s. The visual stimulation and finger opposition tasks were included for validating the use of ASL CBF correction. We hypothesized that these tasks/stimuli would be less affected by remifentanil than the opioid-sensitive aspect of the breath hold. Finger tapping was also incorporated to give guidance on localizing brainstem activations to the breath-holding task.
Breath holding increases arterial PCO2, which leads to vasodilatation and a generalized increase in the BOLD signal that is highly correlated with local, neurally induced BOLD signal changes of interest. Therefore, CO2 challenges were interspersed throughout the experiment, to dissociate the time course of CO2 from that of the breath holds. The CO2 challenges were repeated eight times, each for 15 s, and were delivered by manually adding CO2 to the gas mixture. The concentration of CO2 in the inspired gas mixture during the CO2 challenge was determined from, and equal to, the PETCO2 reading taken immediately before the challenge. In pilot studies, this technique resulted in an approximately equivalent rise in PETCO2 as during the breath hold, despite continued ventilation.
Breath holding is associated with small decreases in PaO2. This potential systematic error was addressed by performing the experiment under mild hyperoxia to minimize the effect of changing PaO2 on BOLD.
During the ASL scanning, the subjects were asked to remain awake with their eyes open, but no stimuli were delivered.
Analysis
Preprocessing.
Image preprocessing was performed by using the Oxford Centre for Functional Magnetic Resonance Imaging of the Brain Software Library (FMRIB, Oxford, UK; FSL version 4.0; http://www.fmrib.ox.ac.uk/fsl/). The following prestatistics processing was applied: motion correction (Jenkinson et al., 2002), removal of nonbrain structures (i.e., skull and surrounding tissues) (Smith, 2002), spatial smoothing by using a full-width half-maximum Gaussian kernel of 5 mm, mean-based intensity normalization of all volumes by the same factor (i.e., four-dimensional grand mean), and high-pass temporal filtering (Gaussian-weighted least-squares straight line fitting). In addition, the brainstem images were corrected for B0 distortion with FUGUE (Jenkinson, 2003) and were corrected for cardiac- and respiratory-related noise effects with RETROICOR (Harvey et al., 2008). Time-series statistical analysis was performed using FILM with local autocorrelation correction (Woolrich et al., 2001). We assumed a 6 s hemodynamic delay, and a temporal derivative of the regressors was included in the analysis to account for small differences in the hemodynamic response function.
Image registration.
After preprocessing, the functional scans were registered to the MNI152 standard space [average T1 brain image constructed from 152 normal subjects at the Montreal Neurological Institute (MNI), Montreal, QC, Canada] by using affine registration (FLIRT) (Jenkinson et al., 2002) between the EPI and the T1 structural scan [additional details are in the study by Pattinson et al. (2009)]. Nonlinear registration (FNIRT) (Andersson et al., 2007) was used to optimize registration between the T1 structural scan and the MNI standard brain.
Voxelwise analysis.
fMRI data processing was performed using FEAT (FMRI Expert Analysis Tool), version 5.97, part of FSL (FMRIB's Software Library) (www.fmrib.ox.ac.uk/fsl). To correct for multiple comparisons, Z (Gaussianized T/F) statistic images were thresholded using clusters determined by Z > 2.3 and a (corrected) cluster significance threshold of p = 0.05 (Worsley, 2001).
The first-level analysis in FEAT incorporated a general linear model in which the regressors were derived from the timing values for the different stimuli (i.e., breath holding, urge-to-breathe rating, finger tapping, and in the case of the cortex sequence, visual stimulation).
We divided the examination of the breath hold-related fMRI signals into two components. First was the session average response to breath holding resulting in widespread cortical activity. The second component looked for the degree of within-scan breath hold-to-breath hold covariation of the urge to breathe and the BOLD signal as they vary about their mean values for that session. Therefore, two separate regressors for breath holding (trial-to-trial invariant and trial-to-trial varying urge to breathe) were incorporated into the model and are illustrated in Figure 2. The trial-to-trial invariant (nonsubjective) regressor models each breath hold as an “on” period with a value of 1, with the baseline as 0. To model the trial-to-trial varying subjective component of the breath hold, the urge-to-breathe values taken after the breath hold were included as an additional regressor that was modeled during the period of the breath hold. The ratings were demeaned before incorporating into the model, and thus the urge-to-breathe regressor represents the variability of the subjective response to breath holding, which varies around the average response (described by the trial-to-trial invariant regressor). By demeaning this regressor, it is therefore orthogonal to the average brain response to breath holding, and thus we are able to isolate the subjective aspect of the task that varies from breath hold to breath hold.
Figure 2.

Illustration of the statistical model used to differentiate the breath hold, urge to breathe, and PETCO2 regressors for the first-level fMRI analysis (values are demeaned). For clarity, the visual stimulation and finger-tapping tasks are not displayed. The asterisk (*) indicates CO2 peaks caused by extra CO2 administered through the breathing system.
The PETCO2 time series data were included as an additional regressor. To estimate the change in PETCO2 during the periods of breath holding performed while scanning, before the experiment the subjects performed three inspiratory breath holds lasting 15 s separated by an interval of at least 1 min, and the rise in PETCO2 was measured. This value (ΔPETCO2/time) was used to model the change in PETCO2 during the breath holds while scanning. PETCO2 was assumed to rise linearly during the breath hold (Fig. 3). The regressors for the breath holds, rating scale, and PETCO2 are illustrated in Figure 2. The time period of the rating scale and six motion correction parameters (Jenkinson et al., 2002) were included as regressors of no interest.
Figure 3.

Portion of respiratory trace from one subject demonstrating the tidal CO2 trace (top trace), the expiratory tidal volume trace (middle trace), and inspiratory tidal volume (bottom trace). The duration of the breath hold was calculated from the time between end of expiratory airflow and beginning of inspiratory airflow (the time between the two vertical bars on the chart). The rise in PETCO2 during the breath hold was modeled from the average of three inspiratory breath holds performed before the study, and is shown as a dotted line.
Voxelwise statistical analysis was extended to a second (group) level in a mixed-effects analysis using FLAME (Woolrich et al., 2004) for the no-drug and remifentanil conditions. Z statistic images were thresholded using clusters determined by Z > 2.3 and a (corrected) cluster significance threshold of p < 0.05.
A final analysis was a paired t test within FEAT, to compare the stimulus-evoked change in BOLD signal between the baseline (no-drug) and remifentanil. In this analysis, resting CBF values were included on a voxelwise basis, as a regressor of no interest, to help account for remifentanil-induced CBF increases that decrease the stimulus-evoked BOLD response. We anticipate that the drug-modulatory effects beyond the CBF effects are neuronal in origin. As with the previously described analyses, Z statistic images were thresholded using clusters determined by Z > 2.3 and a (corrected) cluster significance threshold of p < 0.05.
In two subjects, ASL data were not acquired, so we used the group mean for the appropriate condition (baseline/remifentanil). In areas in which there was not ASL coverage (the most ventral part of the frontal lobe, dorsal aspects of the occipital lobe, and in the lower brainstem), the mean CBF value for the whole brain was used.
Physiological measurements and subjective ratings were compared using two-tailed t tests, and p < 0.05 was considered significant.
ASL analysis
A 6 mm full-width half-maximum spatial smoothing kernel filter was applied to the ASL images before sinc-interpolated subtraction between tag and control volumes (Mumford et al., 2006). Next, the 14 control-tag difference images were averaged at each inversion time, producing an ASL kinetic curve to which a two-parameter model (i.e., the arterial transit time and CBF) was fit for each voxel (Buxton et al., 1998). Fitting was performed using a least-squares routine in Matlab (Mathworks), producing estimates of CBF (in relative units). From the calibration scan, a mask of CSF voxels was generated by manual segmentation. Relative CBF estimates were then converted to absolute values using a known proton density ratio between CSF and blood (Wu and Wong, 2006), and after correction for the TR and inversion time values used in the calibration scans, and the radiofrequency profile of the 12 channel receive coil. Registration to anatomical and standard space images was performed using FLIRT (Jenkinson et al., 2002). Additional details of the ASL analysis can be found in the study by MacIntosh et al. (2008).
Results
Physiology and subjective ratings
The physiological data are summarized in Tables 1 and 2. A portion of a representative respiratory trace is illustrated in Figure 3. Blood pressure and heart rate during the no-drug and remifentanil infusion periods were similar. By manually adjusting the inspired oxygen concentrations, we managed to achieve good control of PETO2 during the experiment. There was no significant difference between PETO2 during baseline and remifentanil conditions. Oxygen saturation during remifentanil infusion was 0.2% lower than at baseline (p < 0.05). Remifentanil profoundly reduced the urge-to-breathe rating (p < 0.0001) despite a slightly longer duration of measured breath hold (p < 0.05). The breath hold and the CO2 challenges gave equivalent rises in PETCO2. Remifentanil induced a rise in baseline PETCO2 of ∼8 mmHg. There were no significant differences in the physiological changes during the different scanning protocols, and therefore the results were combined.
Table 1.
Cardiovascular and respiratory parameters
| No drug | Remifentanil | |
|---|---|---|
| Systolic blood pressure (mmHg)NS | 121 (7) | 118 (11) |
| Diastolic blood pressure (mmHg)NS | 67 (7) | 65 (7) |
| Heart rate (beats per minute)NS | 58 (7) | 59 (7) |
| End-tidal O2 (mmHg)* | 227 (2.5) | 228 (5.6) |
| Oxygen saturations (%)* | 98.6 (0.4) | 98.4 (0.5) |
| Urge-to-breathe rating (/100)*** | 28 (12) | 14 (8) |
| Duration of breath hold (s)* | 13.7 (1.1) | 14.6 (1.6) |
Values represent mean ± SD. Values for the brainstem and whole-brain imaging sessions were not significantly different so are combined.
NSNo significant difference; * p < 0.05; *** p < 0.0001.
Table 2.
PETCO2 values at baseline and with CO2 challenges and breath holds for the no-drug and remifentanil conditions
| Baseline | CO2 challenge | Breath hold | |
|---|---|---|---|
| No drug | 40 (5) | 47 (5) | 45 (5) |
| Remifentanil | 48 (6) | 55 (7) | 53 (7) |
Values are ±SD (in millimeters mercury).
No significant difference was observed between the CO2 challenge and breath hold for both conditions.
Preremifentanil fMRI
Breath hold
The imaging results from the brainstem and cortex sequences were consistent; supplemental Table 1 (available at www.jneurosci.org as supplemental material) displays the spatial location and Z statistics of the significant clusters. Some of the cortical activations were more significant in the brainstem sequence, which may be attributable to a greater contrast-to-noise ratio. The rise in PETCO2 during the breath hold was included in the first-level fMRI analysis and the CO2 challenges. Having accounted for vascular CO2 effects, during breath holding we observed signal increases bilaterally in the following cortical areas: dorsolateral prefrontal cortex (DLPFC), insula, operculum, the anterior cingulate cortex (ACC), the supramarginal gyrus, and in the motor cortex (Fig. 4).
Figure 4.
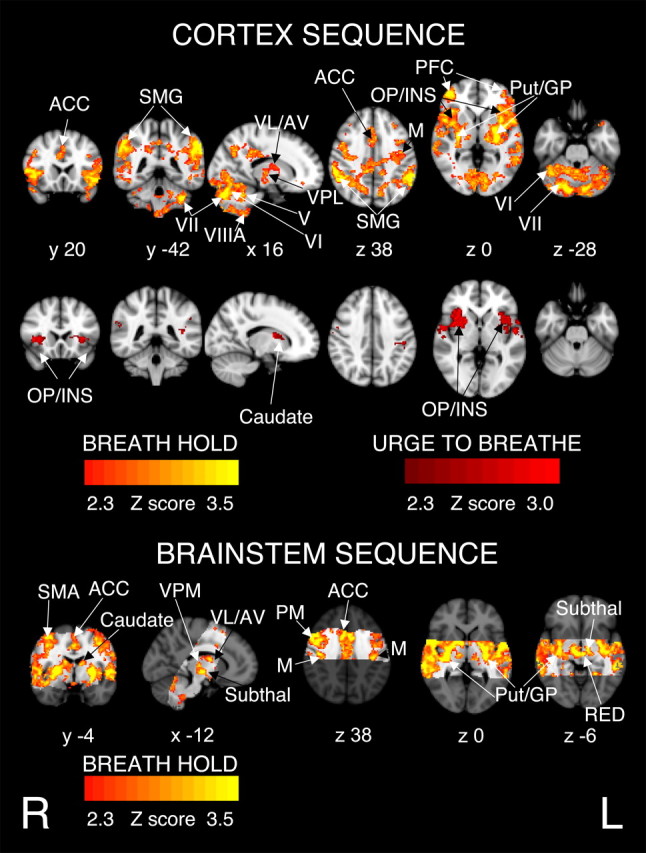
BOLD response to breath hold, in 11 subjects having accounted for CO2-induced vasodilatation. There were no activations related to the trial-to-trial varying urge to breathe in the brainstem sequence. The images consist of a color-rendered statistical map superimposed on a standard (MNI) brain. The bright gray region on the brainstem sequence delineates the coverage for the brainstem scanning. Significant regions are displayed with a threshold of Z > 2.3, with a cluster probability threshold of p < 0.05 (corrected for multiple comparisons). Abbreviations: ACC, Anterior cingulate cortex; SMG, supramarginal gyrus; thalamic nuclei: VL, ventrolateral nucleus; VPL, ventral posterolateral nucleus; AV, anterior ventral nucleus; VPM, ventral posteromedial nucleus; PFC, prefrontal cortex; OP/INS, operculum and insula; M, motor cortex; PM, premotor cortex; SMA, supplementary motor area; Put, putamen; GP, globus pallidum; V, VI, VII, VIIIA, cerebellar lobes; Subthal, subthalamic nucleus; RED, red nuclei. R (right) and L (left) indicate image orientation for images in x and z planes.
Motor cortex activations were bilateral but were more significant on the right side than the left. In the brainstem sequence the top 14 mm of the motor cortex was not included in the field of view because of the angle of image acquisition. The brainstem scanning produced activity in the premotor cortices that was not seen in the whole-brain sequence (displayed in the bottom part of Fig. 4). In subcortical areas, bilateral activity was observed in the putamen, globus pallidum, and in the thalamus [ventral posterolateral (VPL), ventrolateral (VL), anteroventral (AV), and ventral posteromedial (VPM) nuclei], and bilateral activity in the caudate nuclei, in the brainstem sequence only. In the cerebellum, we observed bilateral activations in lobules V, VI, VII, and VIIIA. In the brainstem, we observed activation in the subthalamic nuclei, red nuclei, and in the ventrolateral medulla, extending rostrally to the inferior dorsal pons (Fig. 5).
Figure 5.

BOLD response in the brainstem to finger tapping and to breath hold, in 11 subjects (no-drug infusion) having accounted for CO2-induced vasodilatation. The images consist of a color-rendered statistical map superimposed on a standard (MNI) brain. Significant regions are displayed with a threshold of Z > 2.3, with a cluster probability threshold of p < 0.05 (corrected for multiple comparisons). The sagittal image on the right displays the position of slices, but for clarity only displays the activation map for the breath hold contrast. Abbreviations: R, Raphe nuclei (serotoninergic); ret, nuclei reticularis including adrenergic and noradrenergic centers; VII, facial nucleus; Amb, nucleus ambiguus; IX, glossopharyngeal nucleus; NTS, nucleus tractus solitarius; GC, gracile (medial) and cuneate (lateral) nuclei (in blue). Line drawing is adapted from Duvernoy (1995) showing approximate position of nuclei. R (right) and L (left) indicate image orientation.
Urge-to-breathe rating
BOLD activations were correlated with the within-scan urge-to-breathe rating in the cortex sequence as illustrated in Figure 4. Supplemental Table 2 (available at www.jneurosci.org as supplemental material) displays the spatial location and Z statistics of the significant clusters. Activations were bilateral and mainly in the anterior insula and frontal operculum, areas that were not included in the imaging plane of the brainstem sequence. A small area of activation was observed in the right caudate and in the left AV thalamic nucleus.
Finger tapping, visual stimulation, and CO2 challenges
For the finger-tapping task, we observed strongest activations in the left motor cortex, left premotor cortex, left primary somatosensory cortex, and in the right cerebellum, although there was some contralateral activation. Activation in the medulla corresponded to the right cuneate nucleus, and in the pons. Visual stimulation elicited strong activation in the visual cortex (Fig. 6, top panel), and the hypercapnic challenges elicited strong BOLD activation throughout the brain (Fig. 6, top panel).
Figure 6.
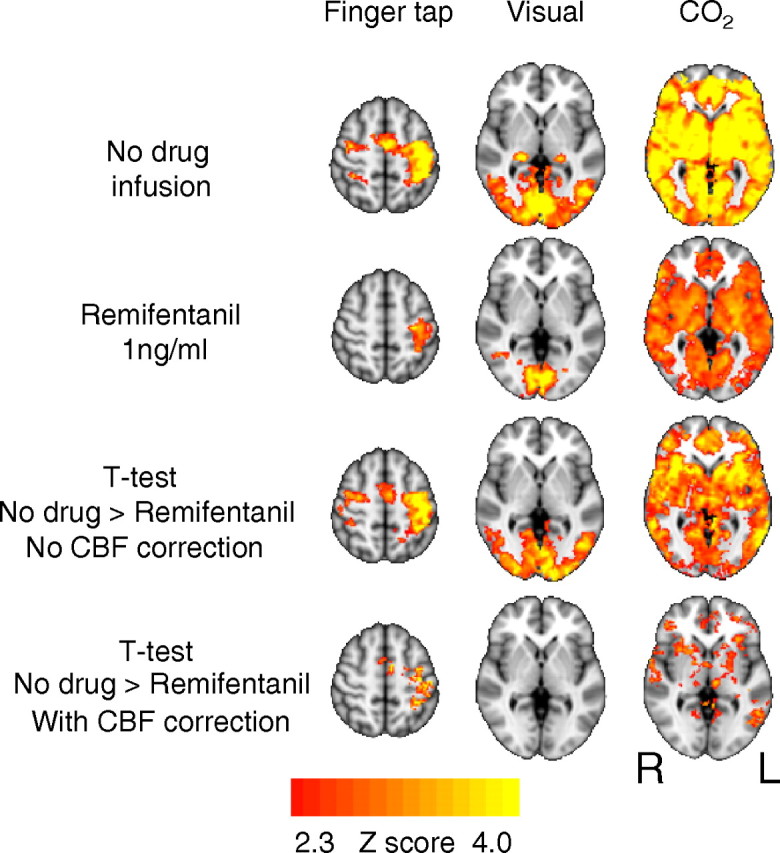
Comparison of BOLD response to finger tapping, visual stimulation, and CO2 challenges before and during infusion of remifentanil. The images consist of a color-rendered statistical map of changes in activation (Z scores) superimposed on a standard (MNI) brain. Significant regions are displayed with a threshold of Z > 2.3, with a cluster probability threshold of p < 0.05 (corrected for multiple comparisons). The apparent strong difference in activations between no-drug and remifentanil conditions is mostly explained by the change in baseline cerebral blood flow. R (right) and L (left) indicate image orientation for images in x and z planes.
Remifentanil infusion
Administration of remifentanil produced strong decreases in the amplitude of the positive BOLD response to the stimuli. This is illustrated in Figure 6 for finger tapping, visual stimulation, and hypercapnia. We observed no significant activations that were correlated with the trial-to-trial varying urge-to-breathe subjective rating scale. For the breath hold stimulus, despite the generalized reduction in BOLD activity, there remained strong activation in the bilateral putamen and globus pallidum and left supramarginal gyrus that was observed during both scanning protocols (Fig. 7). Supplemental Table 3 (available at www.jneurosci.org as supplemental material) displays the spatial location and Z statistics of the significant clusters. The bilateral activation in the caudate was only apparent in the brainstem sequence.
Figure 7.

BOLD response to breath holding during infusion of remifentanil (1 ng/ml), without CBF correction. The only activations to remain are seen in the putamen and caudate, bilaterally, and the left supramarginal gyrus. The images consist of a color-rendered statistical map of changes in activation (Z scores) superimposed on a standard (MNI) brain. Significant regions are displayed with a threshold of Z > 2.3, with a cluster probability threshold of p < 0.05 (corrected for multiple comparisons). R (right) and L (left) indicate image orientation for images in x and z planes.
Comparison of predrug and remifentanil conditions
A component of these global reductions in BOLD signal responses to stimulation are attributable to the perfusion effect of increased baseline CBF (Cohen et al., 2002; MacIntosh et al., 2008) consequent to hypercapnia. Baseline CBF was therefore included in the analysis in the interest of dissociating the global perfusion effects from specific neuronal effects of remifentanil. Figure 6 demonstrates that, with remifentanil infusion, the difference in BOLD responses between the two conditions is mostly accounted for by CBF differences; this is most striking in the visual cortex. There remained some changes in BOLD responsiveness to CO2 despite correction for CBF changes.
Breath hold—cortex sequence
The effect of remifentanil on the trial-to-trial constant BOLD response to breath holding, incorporating CBF correction, is illustrated in Figure 8. Supplemental Table 4 (available at www.jneurosci.org as supplemental material) displays the spatial location and Z statistics of the significant clusters. Brain regions that were activated during the no-drug condition, but showed no modulatory effect of remifentanil, include most of the insula (other than a localized area in the left anterior insula), operculum, the motor cortex, supramarginal gyrus, the putamen, and globus pallidum. In contrast, brain areas in which remifentanil induced significant decreases in activity were areas in the left DLPFC, left anterior insula and operculum, a discrete area in the ACC, in the VPL nucleus of the thalamus, the subthalamic nuclei, and in lobule VII of the cerebellum. We also observed a significant reduction in the BOLD response to breath holding in the periaqueductal gray (PAG), bilaterally, an area that was not identified as active during the no-drug condition.
Figure 8.

t test demonstrating areas with significantly stronger BOLD response to trial-to-trial invariant component of breath hold during the no-drug condition, compared with remifentanil infusion having accounted for differences in baseline CBF. There were no differences in the trial-to-trial varying urge-to-breathe contrast, and therefore it is not displayed. The images consist of a color-rendered statistical map of changes inactivation (Z scores) superimposed on a standard (MNI) brain. The BOLD responses to the baseline (no-drug) state are displayed in red–yellow scale and are fully detailed in Figure 4. Significant regions are displayed with a threshold of Z > 2.3, with a cluster probability threshold of p < 0.05 (corrected for multiple comparisons). Abbreviations: Cerebellar lobes VI and VII; ACC, anterior cingulate cortex; PFC, prefrontal cortex; VPL, ventroposterolateral nucleus of thalamus; OP/INS, operculum and insula; Subthal, subthalamic nucleus. R (right) and L (left) indicate image orientation.
Comparison of the trial-to-trial varying urge-to-breathe activations between no-drug and remifentanil explores potential remifentanil effects on the slope of the regression between the urge-to-breathe scores and the BOLD signal. This comparison showed no significant differences between the no-drug and remifentanil condition, suggesting that BOLD signal related to the breath hold urge to breathe decreases in proportion to the decreases in the rating scores.
Breath hold—brainstem sequence
As the ASL did not extend below the midpons, we used the global subject-wise mean CBF value for the group comparison, and this revealed no differences between the baseline and remifentanil conditions in the pons and medulla. Above the midpons, we observed significant reductions in breath hold-related activity in the left subthalamic nucleus and in the right thalamus.
ASL
CBF estimates from the GRASE–ASL data showed that remifentanil infusion caused an increase in gray matter perfusion from 62 ± 12.0 to 84 ± 19.8 ml/100 g tissue/min. The largest changes in CBF were observed in the thalamus, anterior cingulate, and insular cortices (MacIntosh et al., 2008).
Discussion
Main findings
First, urge to breathe is reflected by BOLD activity in the anterior insula, operculum, secondary somatosensory cortex, and putamen. With remifentanil, the urge to breathe is profoundly depressed and activation in these areas decreases in proportion to the change in subjective ratings.
Second, in the left anterior insula, ACC, left DLPFC, cerebellum, thalamus, subthalamic nucleus, and PAG, remifentanil causes decreases in breath hold-related activity.
Third, breath hold-related activity was unaffected by remifentanil in the motor cortex, putamen, globus pallidum, and supramarginal gyrus.
The effect of remifentanil on respiratory interoception
In the no-drug condition, the trial-to-trial varying urge-to-breathe ratings were correlated with bilateral activity in the anterior insula, frontal operculum, left anterior thalamus, the right caudate nucleus (Fig. 4), and bilateral secondary somatosensory cortices (supplemental Table 2, available at www.jneurosci.org as supplemental material).
With remifentanil, we observed a localized decrease in activity in the left anterior insula and operculum, in relation to the nonsubjective (trial-to-trial constant) regressor (Fig. 8). Remifentanil infusion led to profound decreases in the mean urge-to-breathe ratings and corresponding reductions in breath hold-related cortical activity. Paired t tests revealed no difference in the relationship between the BOLD response and the within-scan trial-to-trial variability in the urge to breathe between no-drug and remifentanil conditions, suggesting that BOLD activation covarying with the urge to breathe decreased in proportion to the profoundly decreased subjective ratings (additional explanation in supplemental material, available at www.jneurosci.org).
The insula and operculum have been implicated in awareness of internal body states, especially the subjective experience of pain (Tracey and Mantyh, 2007) and dyspnea (von Leupoldt and Dahme, 2005). These structures express high opioid receptor densities (Baumgärtner et al., 2006). Activation in the anterior thalamus (Pattinson et al., 2009) in relation to hypercapnia and in the caudate nucleus in relation to dyspnea (Peiffer et al., 2008) suggest that these structures may also form part of the network that mediates the urge to breathe.
Remifentanil therefore depresses the brain centers that mediate the contextual awareness of respiration. During opioid administration, respiratory depression leads to hypercapnia. Usually, hypercapnia causes a profound increase in the awareness of respiration; however, remifentanil dampens this effect, allowing potentially fatal respiratory depression to occur.
Opioid-sensitive aspects of the breath hold
When compared with the no-drug condition, breath holding (trial-to-trial invariant regressor) during remifentanil led to significant reductions in BOLD activation in left DLPFC and the cerebellum (Fig. 8) areas strongly connected to each other (Kelly and Strick, 2003) and implicated in dyspnea relief (Peiffer et al., 2008). Activity in the DLPFC has been associated with response inhibition (Watanabe et al., 2002) including breath holding (McKay et al., 2008).
The decreased breath hold-related activation in the rostral ACC is consistent with that observed with opioid analgesia (Petrovic et al., 2002) and dyspnea relief (Peiffer et al., 2008). The ACC has a role in cognitive attention, expresses high opioid receptor densities, and has been identified in the context of respiratory stimulation (Banzett et al., 2000; Evans et al., 2002). Thus, the ACC appears to be important for opioidergic modulation of respiration.
The subthalamic nuclei have previously been implicated in mediating inhibitory actions (Aron and Poldrack, 2006; McKay et al., 2008). Reduced activations in these nuclei imply that, with remifentanil, less cortical inhibition is necessary to stop breathing, which is already depressed at a brainstem level.
In addition to its modulating influence on pain (Dunckley et al., 2005), the PAG, through opioidergic mechanisms, suppresses respiration (Sessle et al., 1981) via direct actions on the nucleus tractus solitarius in the ventral lateral medulla. The PAG is connected to the prefrontal cortex (Hadjipavlou et al., 2006), in which we have identified breath hold-related BOLD signal decreases. In conjunction with the decreased activity in the VPL thalamic nucleus, our findings suggest opioid-mediated reductions in respiratory traffic between the brainstem and the cortex. These reductions in cortical activity may be attributable to localized binding of remifentanil or attributable to an indirect effect of reduced signaling from the medullary respiratory centers. As these brain areas have demonstrated high opioid receptor densities, it seems likely that both factors are important.
Opioid-insensitive aspects of the breath hold
Breath hold-related activation in the putamen and globus pallidum was unaffected by remifentanil. These structures are thought to be part of multiple parallel cortico-striato-thalamo-cortical loops (Alexander et al., 1986), are important for motor control, and have been identified in multiple fMRI studies of respiration (Corfield et al., 1995; Gozal et al., 1995; Evans et al., 2002; McKay et al., 2008; Pattinson et al., 2009).
Bilateral breath hold-related activations in the supramarginal gyrus were preserved with remifentanil. McKay et al. (2008) observed activation in the supramarginal gyrus with breath holding and proposed that it is associated with behavioral awareness of respiration and with response inhibition (Liddle et al., 2001). In the no-drug state, activations in the motor cortex correspond with those identified in studies of laryngeal motor control (Brown et al., 2008) and voluntary expiration (Ramsay et al., 1993) and were mostly unaffected by remifentanil.
In the context of this study, although remifentanil has diminished some of the sensory-affective components of the breath-holding task, it still remains under conscious control and therefore requires sensory-motor association. Our findings demonstrate that opioids have little effect on the brain areas that execute the final motor action of breath holding, as is reflected in the clinical situation in which opioid-apneic patients will breathe when instructed, but otherwise remain apneic.
With the trial-to-trial constant component of breath hold, bilateral activation in much of the insula and operculum was unchanged with remifentanil, similar to findings in a study of dyspnea relief (Peiffer et al., 2008). We suggest that breath hold-related activity in the insula and operculum can be divided into opioid-sensitive (relating to its cognitive and affective aspects) and opioid-insensitive components that may be related to monitoring the execution of the task.
Brainstem
The ventrolateral medulla has been identified as a crucial center for automatic breathing (Feldman and Del Negro, 2006), but whether activity there is modulated by conscious mechanisms remains unexplained (Corfield et al., 1998; McKay et al., 2003, 2008).
We observed bilateral activation in response to breath holding in the ventral medulla and dorsal pons in locations corresponding to centers identified for the automatic control of respiration. Our findings support the results of a postmortem study (Schwarzacher et al., 2006) that identified areas rostral to the lateral reticular nucleus and lateral to the inferior olivary nucleus as likely locations of the pre-Bötzinger complex in humans.
The activation in the ventral lateral medulla could be related to a number of mechanisms: (1) cortical inhibition of brainstem respiratory rhythm generating centers in the pre-Bötzinger complex; (2) mechanosensory inputs from the glossopharyngeal and vagal nerves (via the nucleus tractus solitarius); (3) increased chemoreceptive activity relating to hypercapnia as a consequence of the breath hold.
It is well recognized that brainstem fMRI is more challenging than in the cortex. This methodological constraint, in concert with the smaller BOLD changes that are associated with remifentanil, reduced the sensitivity to breath hold neuronal responses in the brainstem during remifentanil infusion. We were unable to resolve this issue and therefore could not determine the effect of remifentanil on the brainstem areas that mediate breath holding.
Limitations
For practical reasons, we chose to perform the study in a single experimental session. We feel that a potential order effect is unlikely to add significant bias to our results because, if such an effect existed, it would be small and would be greatly overwhelmed by the profound physiological effects of remifentanil. Additional and more detailed explanations can be found in the online material.
Conclusions
Breath holding is initiated by the cortex, which transmits a “stop breathing” signal to the brainstem or spinal cord. This signal is eventually overcome by a powerful involuntary urge to breathe (Parkes, 2006). The present study extends the observations by McKay et al. (2008) and uses breath holding as a tool to investigate opioid effects on breathing.
We propose that remifentanil affects the volitional respiratory control pathway at a number of points. Although not demonstrated here, brainstem respiratory drive is depressed by opioids (Pattinson, 2008) Therefore, less cognitive effort would be required to inhibit breathing. This is reflected in the reduced BOLD activations observed in the ACC, DLPFC, cerebellum, PAG, VPL, and subthalamic nuclei. As awareness of breathing is depressed, hypercapnia is tolerated. The underlying mechanism may be attributable to reduced brainstem input to the cortex, direct inhibition of cortical centers, or both.
The findings presented here help us understand mechanisms of opioid-induced respiratory depression and give us insight into potential targets for the treatment of dyspnea, the uncomfortable shortness of breath seen in patients with chronic airways disease, cardiac failure, and terminal cancer (ATS, 1999).
This study highlights the importance of higher cortical centers in providing contextual awareness of respiration that leads to appropriate top–down modulation of brainstem respiratory control. Although the brainstem generates the respiratory rhythm and is exquisitely sensitive to opioids, the importance of higher centers mediating breathing must not be overlooked.
Footnotes
These studies were supported by the International Anesthesia Research Society. K.P. and R.W. are supported by the Medical Research Council (United Kingdom).
References
- Alexander GE, DeLong MR, Strick PL. Parallel organization of functionally segregated circuits linking basal ganglia and cortex. Annu Rev Neurosci. 1986;9:357–381. doi: 10.1146/annurev.ne.09.030186.002041. [DOI] [PubMed] [Google Scholar]
- Andersson J, Jenkinson M, Smith SM. Oxford: Oxford Centre for Functional Magnetic Resonance Imaging of the Brain; 2007. Non-linear registration, aka spatial normalisation. FMRIB technical report TR07JA2. [Google Scholar]
- Aron AR, Poldrack RA. Cortical and subcortical contributions to Stop signal response inhibition: role of the subthalamic nucleus. J Neurosci. 2006;26:2424–2433. doi: 10.1523/JNEUROSCI.4682-05.2006. [DOI] [PMC free article] [PubMed] [Google Scholar]
- ATS. Dyspnea. Mechanisms, assessment, and management: a consensus statement. American Thoracic Society. Am J Respir Crit Care Med. 1999;159:321–340. doi: 10.1164/ajrccm.159.1.ats898. [DOI] [PubMed] [Google Scholar]
- Bailey PL, Lu JK, Pace NL, Orr JA, White JL, Hamber EA, Slawson MH, Crouch DJ, Rollins DE. Effects of intrathecal morphine on the ventilatory response to hypoxia. N Engl J Med. 2000;343:1228–1234. doi: 10.1056/NEJM200010263431705. [DOI] [PubMed] [Google Scholar]
- Banzett RB, Mulnier HE, Murphy K, Rosen SD, Wise RJ, Adams L. Breathlessness in humans activates insular cortex. Neuroreport. 2000;11:2117–2120. doi: 10.1097/00001756-200007140-00012. [DOI] [PubMed] [Google Scholar]
- Baumgärtner U, Buchholz HG, Bellosevich A, Magerl W, Siessmeier T, Rolke R, Höhnemann S, Piel M, Rösch F, Wester HJ, Henriksen G, Stoeter P, Bartenstein P, Treede RD, Schreckenberger M. High opiate receptor binding potential in the human lateral pain system. Neuroimage. 2006;30:692–699. doi: 10.1016/j.neuroimage.2005.10.033. [DOI] [PubMed] [Google Scholar]
- Brown S, Ngan E, Liotti M. A larynx area in the human motor cortex. Cereb Cortex. 2008;18:837–845. doi: 10.1093/cercor/bhm131. [DOI] [PubMed] [Google Scholar]
- Buxton RB, Frank LR, Wong EC, Siewert B, Warach S, Edelman RR. A general kinetic model for quantitative perfusion imaging with arterial spin labeling. Magn Reson Med. 1998;40:383–396. doi: 10.1002/mrm.1910400308. [DOI] [PubMed] [Google Scholar]
- Cohen ER, Ugurbil K, Kim SG. Effect of basal conditions on the magnitude and dynamics of the blood oxygenation level-dependent fMRI response. J Cereb Blood Flow Metab. 2002;22:1042–1053. doi: 10.1097/00004647-200209000-00002. [DOI] [PubMed] [Google Scholar]
- Colebatch JG, Adams L, Murphy K, Martin AJ, Lammertsma AA, Tochon-Danguy HJ, Clark JC, Friston KJ, Guz A. Regional cerebral blood flow during volitional breathing in man. J Physiol. 1991;443:91–103. doi: 10.1113/jphysiol.1991.sp018824. [DOI] [PMC free article] [PubMed] [Google Scholar]
- Corfield DR, Fink GR, Ramsay SC, Murphy K, Harty HR, Watson JD, Adams L, Frackowiak RS, Guz A. Evidence for limbic system activation during CO2-stimulated breathing in man. J Physiol. 1995;488:77–84. doi: 10.1113/jphysiol.1995.sp020947. [DOI] [PMC free article] [PubMed] [Google Scholar]
- Corfield DR, Murphy K, Guz A. Does the motor cortical control of the diaphragm “bypass” the brain stem respiratory centres in man? Respir Physiol. 1998;114:109–117. doi: 10.1016/s0034-5687(98)00083-8. [DOI] [PubMed] [Google Scholar]
- Dahan A, Teppema LJ. Influence of anaesthesia and analgesia on the control of breathing. Br J Anaesth. 2003;91:40–49. doi: 10.1093/bja/aeg150. [DOI] [PubMed] [Google Scholar]
- Dunckley P, Wise RG, Fairhurst M, Hobden P, Aziz Q, Chang L, Tracey I. A comparison of visceral and somatic pain processing in the human brainstem using functional magnetic resonance imaging. J Neurosci. 2005;25:7333–7341. doi: 10.1523/JNEUROSCI.1100-05.2005. [DOI] [PMC free article] [PubMed] [Google Scholar]
- Duvernoy H. New York: Springer; 1995. The human brainstem and cerebellum. [Google Scholar]
- Evans KC, Banzett RB, Adams L, McKay L, Frackowiak RS, Corfield DR. BOLD fMRI identifies limbic, paralimbic, and cerebellar activation during air hunger. J Neurophysiol. 2002;88:1500–1511. doi: 10.1152/jn.2002.88.3.1500. [DOI] [PubMed] [Google Scholar]
- Feldman JL, Del Negro CA. Looking for inspiration: new perspectives on respiratory rhythm. Nat Rev Neurosci. 2006;7:232–242. doi: 10.1038/nrn1871. [DOI] [PMC free article] [PubMed] [Google Scholar]
- Gandevia SC, Rothwell JC. Activation of the human diaphragm from the motor cortex. J Physiol. 1987;384:109–118. doi: 10.1113/jphysiol.1987.sp016445. [DOI] [PMC free article] [PubMed] [Google Scholar]
- Gozal D, Omidvar O, Kirlew KA, Hathout GM, Hamilton R, Lufkin RB, Harper RM. Identification of human brain regions underlying responses to resistive inspiratory loading with functional magnetic resonance imaging. Proc Natl Acad Sci U S A. 1995;92:6607–6611. doi: 10.1073/pnas.92.14.6607. [DOI] [PMC free article] [PubMed] [Google Scholar]
- Gray JM, Kenny GN. Development of the technology for ‘Diprifusor’ TCI systems. Anaesthesia. 1998;(Suppl 1):22–27. doi: 10.1111/j.1365-2044.1998.53s114.x. [DOI] [PubMed] [Google Scholar]
- Hadjipavlou G, Dunckley P, Behrens TE, Tracey I. Determining anatomical connectivities between cortical and brainstem pain processing regions in humans: a diffusion tensor imaging study in healthy controls. Pain. 2006;123:169–178. doi: 10.1016/j.pain.2006.02.027. [DOI] [PubMed] [Google Scholar]
- Harvey AK, Pattinson KT, Brooks JC, Mayhew SD, Jenkinson M, Wise RG. Brainstem functional magnetic resonance imaging: disentangling signal from physiological noise. J Magn Reson Imaging. 2008;28:1337–1344. doi: 10.1002/jmri.21623. [DOI] [PubMed] [Google Scholar]
- Jenkinson M. Fast, automated, N-dimensional phase-unwrapping algorithm. Magn Reson Med. 2003;49:193–197. doi: 10.1002/mrm.10354. [DOI] [PubMed] [Google Scholar]
- Jenkinson M, Bannister P, Brady M, Smith S. Improved optimization for the robust and accurate linear registration and motion correction of brain images. Neuroimage. 2002;17:825–841. doi: 10.1016/s1053-8119(02)91132-8. [DOI] [PubMed] [Google Scholar]
- Kelly RM, Strick PL. Cerebellar loops with motor cortex and prefrontal cortex of a nonhuman primate. J Neurosci. 2003;23:8432–8444. doi: 10.1523/JNEUROSCI.23-23-08432.2003. [DOI] [PMC free article] [PubMed] [Google Scholar]
- Liddle PF, Kiehl KA, Smith AM. Event-related fMRI study of response inhibition. Hum Brain Mapp. 2001;12:100–109. doi: 10.1002/1097-0193(200102)12:2<100::AID-HBM1007>3.0.CO;2-6. [DOI] [PMC free article] [PubMed] [Google Scholar]
- MacIntosh BJ, Pattinson KT, Gallichan D, Ahmad I, Miller KL, Feinberg DA, Wise RG, Jezzard P. Measuring the effects of remifentanil on cerebral blood flow and arterial arrival time using 3D GRASE MRI with pulsed arterial spin labelling. J Cereb Blood Flow Metab. 2008;28:1514–1522. doi: 10.1038/jcbfm.2008.46. [DOI] [PubMed] [Google Scholar]
- McKay LC, Evans KC, Frackowiak RS, Corfield DR. Neural correlates of voluntary breathing in humans. J Appl Physiol. 2003;95:1170–1178. doi: 10.1152/japplphysiol.00641.2002. [DOI] [PubMed] [Google Scholar]
- McKay LC, Adams L, Frackowiak RS, Corfield DR. A bilateral cortico-bulbar network associated with breath holding in humans, determined by functional magnetic resonance imaging. Neuroimage. 2008;40:1824–1832. doi: 10.1016/j.neuroimage.2008.01.058. [DOI] [PubMed] [Google Scholar]
- Minto CF, Schnider TW, Egan TD, Youngs E, Lemmens HJ, Gambus PL, Billard V, Hoke JF, Moore KH, Hermann DJ, Muir KT, Mandema JW, Shafer SL. Influence of age and gender on the pharmacokinetics and pharmacodynamics of remifentanil. I. Model development. Anesthesiology. 1997a;86:10–23. doi: 10.1097/00000542-199701000-00004. [DOI] [PubMed] [Google Scholar]
- Minto CF, Schnider TW, Shafer SL. Pharmacokinetics and pharmacodynamics of remifentanil. II. Model application. Anesthesiology. 1997b;86:24–33. doi: 10.1097/00000542-199701000-00005. [DOI] [PubMed] [Google Scholar]
- Mitsis GD, Governo RJ, Rogers R, Pattinson KT. The effect of remifentanil on respiratory variability, evaluated with dynamic modeling. J Appl Physiol. 2009;106:1038–1049. doi: 10.1152/japplphysiol.90769.2008. [DOI] [PubMed] [Google Scholar]
- Mumford JA, Hernandez-Garcia L, Lee GR, Nichols TE. Estimation efficiency and statistical power in arterial spin labeling fMRI. Neuroimage. 2006;33:103–114. doi: 10.1016/j.neuroimage.2006.05.040. [DOI] [PMC free article] [PubMed] [Google Scholar]
- Owens WD, Felts JA, Spitznagel EL., Jr ASA physical status classifications: a study of consistency of ratings. Anesthesiology. 1978;49:239–243. doi: 10.1097/00000542-197810000-00003. [DOI] [PubMed] [Google Scholar]
- Parkes MJ. Breath-holding and its breakpoint. Exp Physiol. 2006;91:1–15. doi: 10.1113/expphysiol.2005.031625. [DOI] [PubMed] [Google Scholar]
- Pattinson KT. Opioids and the control of respiration. Br J Anaesth. 2008;100:747–758. doi: 10.1093/bja/aen094. [DOI] [PubMed] [Google Scholar]
- Pattinson KT, Mitsis GD, Harvey AK, Jbabdi S, Dirckx S, Mayhew SD, Rogers R, Tracey I, Wise RG. Determination of the human brainstem respiratory control network and its cortical connections in vivo using functional and structural imaging. Neuroimage. 2009;44:295–305. doi: 10.1016/j.neuroimage.2008.09.007. [DOI] [PubMed] [Google Scholar]
- Peiffer C. Dyspnea and emotion: what can we learn from functional brain imaging? Am J Respir Crit Care Med. 2008;177:937–939. doi: 10.1164/rccm.200802-298ED. [DOI] [PubMed] [Google Scholar]
- Peiffer C, Costes N, Hervé P, Garcia-Larrea L. Relief of dyspnea involves a characteristic brain activation and a specific quality of sensation. Am J Respir Crit Care Med. 2008;177:440–449. doi: 10.1164/rccm.200612-1774OC. [DOI] [PubMed] [Google Scholar]
- Petrovic P, Kalso E, Petersson KM, Ingvar M. Placebo and opioid analgesia—imaging a shared neuronal network. Science. 2002;295:1737–1740. doi: 10.1126/science.1067176. [DOI] [PubMed] [Google Scholar]
- Ramsay SC, Murphy K, Shea SA, Friston KJ, Lammertsma AA, Clark JC, Adams L, Guz A, Frackowiak RS. Changes in global cerebral blood flow in humans: effect on regional cerebral blood flow during a neural activation task. J Physiol. 1993;471:521–534. doi: 10.1113/jphysiol.1993.sp019913. [DOI] [PMC free article] [PubMed] [Google Scholar]
- Schwarzacher S, Rub U, Bohl J, Deller T. Localization of human pre-Boetzinger complex. Paper presented at Xth Oxford Conference on Modeling and Control of Breathing; September; Lake Louise, AB, Canada. 2006. [Google Scholar]
- Sessle BJ, Ball GJ, Lucier GE. Suppressive influences from periaqueductal gray and nucleus raphe magnus on respiration and related reflex activities and on solitary tract neurons, and effect of naloxone. Brain Res. 1981;216:145–161. doi: 10.1016/0006-8993(81)91283-x. [DOI] [PubMed] [Google Scholar]
- Smith SM. Fast robust automated brain extraction. Hum Brain Mapp. 2002;17:143–155. doi: 10.1002/hbm.10062. [DOI] [PMC free article] [PubMed] [Google Scholar]
- Tracey I, Mantyh PW. The cerebral signature for pain perception and its modulation. Neuron. 2007;55:377–391. doi: 10.1016/j.neuron.2007.07.012. [DOI] [PubMed] [Google Scholar]
- von Leupoldt A, Dahme B. Cortical substrates for the perception of dyspnea. Chest. 2005;128:345–354. doi: 10.1378/chest.128.1.345. [DOI] [PubMed] [Google Scholar]
- von Leupoldt A, Sommer T, Kegat S, Baumann HJ, Klose H, Dahme B, Büchel C. The unpleasantness of perceived dyspnea is processed in the anterior insula and amygdala. Am J Respir Crit Care Med. 2008;177:1026–1032. doi: 10.1164/rccm.200712-1821OC. [DOI] [PubMed] [Google Scholar]
- Watanabe J, Sugiura M, Sato K, Sato Y, Maeda Y, Matsue Y, Fukuda H, Kawashima R. The human prefrontal and parietal association cortices are involved in NO-GO performances: an event-related fMRI study. Neuroimage. 2002;17:1207–1216. doi: 10.1006/nimg.2002.1198. [DOI] [PubMed] [Google Scholar]
- Wise RG, Pattinson KTS, Bulte DP, Chiarelli PA, Mayhew SD, Balanos G, O'Connor D, Pragnell T, Robbins PA, Tracey I, Jezzard P. Dynamic forcing of end-tidal carbon dioxide and oxygen applied to functional magnetic resonance imaging. J Cereb Blood Flow Metab. 2007;27:1521–1532. doi: 10.1038/sj.jcbfm.9600465. [DOI] [PubMed] [Google Scholar]
- Woolrich MW, Ripley BD, Brady M, Smith SM. Temporal autocorrelation in univariate linear modeling of FMRI data. Neuroimage. 2001;14:1370–1386. doi: 10.1006/nimg.2001.0931. [DOI] [PubMed] [Google Scholar]
- Woolrich MW, Behrens TE, Beckmann CF, Jenkinson M, Smith SM. Multilevel linear modelling for FMRI group analysis using Bayesian inference. Neuroimage. 2004;21:1732–1747. doi: 10.1016/j.neuroimage.2003.12.023. [DOI] [PubMed] [Google Scholar]
- Statistical analysis of activation images. In: Worsley K, editor; Jezzard P, Matthews PM, Smith SM, editors. Functional MRI: an introduction to methods, Chap 14. Oxford: Oxford UP; 2001. [Google Scholar]
- Wu WC, Wong EC. Intravascular effect in velocity-selective arterial spin labeling: the choice of inflow time and cutoff velocity. Neuroimage. 2006;32:122–128. doi: 10.1016/j.neuroimage.2006.03.001. [DOI] [PubMed] [Google Scholar]