

Abstract
Cytotoxic CD8+ T cells are considered important effector cells contributing to neuronal damage in inflammatory and degenerative CNS disorders. Using time-lapse video microscopy and two-photon imaging in combination with whole-cell patch-clamp recordings, we here show that major histocompatibility class I (MHC I)-restricted neuronal antigen presentation and T cell receptor specificity determine CD8+ T-cell locomotion and neuronal damage in culture and hippocampal brain slices. Two separate functional consequences result from a direct cell–cell contact between antigen-presenting neurons and antigen-specific CD8+ T cells. (1) An immediate impairment of electrical signaling in single neurons and neuronal networks occurs as a result of massive shunting of the membrane capacitance after insertion of channel-forming perforin (and probably activation of other transmembrane conductances), which is paralleled by an increase of intracellular Ca2+ levels (within <10 min). (2) Antigen-dependent neuronal apoptosis may occur independently of perforin and members of the granzyme B cluster (within ∼1 h), suggesting that extracellular effects can substitute for intracellular delivery of granzymes by perforin. Thus, electrical silencing is an immediate consequence of MHC I-restricted interaction of CD8+ T cells with neurons. This mechanism is clearly perforin-dependent and precedes, but is not causally linked, to neuronal cell death.
Introduction
Cytotoxic CD8+ T cells are important effector cells in adaptive immune responses. On recognition of their cognate antigen presented by major histocompatibility class I (MHC I) molecules and formation of the immunological synapse, CD8+ T cells are able to kill a target cell by two fundamentally different mechanisms (Kägi et al., 1994a; Lowin et al., 1994). (1) Granule cytotoxicity occurs by liberation of perforin together with a variety of granzymes. Perforin alone can lead to rapid necrosis of the target cell within minutes through the formation of large unselective transmembrane pores leading to rapid swelling and rupture of the cell membrane (Waterhouse et al., 2006). Alternatively, perforin mediates the trafficking of granzymes into the target cell promoting apoptosis within a few hours by a yet elusive mechanism (Waterhouse et al., 2006; Pipkin and Lieberman, 2007). (2) Target cell apoptosis may also occur through the ligation of cell death receptors (e.g., FasL/Fas) (Choi and Benveniste, 2004).
The role of CD8+ T cells in various autoimmune and infectious inflammatory CNS disorders has emerged recently (Dörries, 2001; Bauer et al., 2002; Neumann et al., 2002; Friese and Fugger, 2005; Melzer et al., 2009). In these disorders, CD8+ T cells use to outnumber CD4+ T cells in inflammatory lesions and are frequently found in close apposition to neurons with their cytotoxic granules polarized toward the neuronal surface membrane. Moreover, they show oligoclonal expansions in lesions as a likely consequence of their local antigen-driven activation. Importantly, the number of CD8+ T cells correlates with the extent of neuronal/axonal damage in inflammatory lesions, and the detrimental function of CD8+ T cells in CNS inflammation is further supported by their principal ability to kill oligodendrocytes and neurons (Neumann et al., 2002). Interaction of CD8+ T cells with neurites and perikarya has been shown to induce dendritic damage and transection of axons as well as neuronal apoptosis in vitro (Medana et al., 2001) and in vivo (Rall et al., 1995; Sanchez-Ruiz et al., 2008). Thus, CD8+ T cells are considered important effector cells contributing to neuronal damage in inflammatory CNS disorders.
We here visualize and characterize direct cell–cell-interactions between antigen-specific CD8+ T cells and antigen-presenting CNS neurons and determine functional consequences on a molecular level. MHC I expression was induced by interferon-γ (IFN-γ) in cultured hippocampal neurons as well as in living brain slice cultures, followed by external loading with antigenic peptide [ovalbumin (OVA) peptide] or a control peptide [SINFEKL (SIY) peptide]. Neurons were coincubated with activated T-cell receptor (TCR) transgenic, OVA-specific wild-type (WT) CD8+ T cells [OT-I T cells (Hogquist et al., 1994)] or OT-I T cells deficient for perforin (Kägi et al., 1994b) or the granzyme B cluster (Heusel et al., 1994) as a paradigm for a MHC I-restricted immune–neuronal interaction and its mechanisms. T cell migration and neuronal cell death were analyzed by time-lapse video microscopy and two-photon imaging in combination with immunocytochemistry. CD8+ T cell-induced alterations of the electrical properties of neurons were dissected using whole-cell patch-clamp recordings, and the impact of CD8+ T cell–neuron interactions on neuronal network activity was studied using multiple electrode recordings and living brain slice preparations.
Materials and Methods
Mice.
WT C57BL/6 and OT-I (Hogquist et al., 1994) mice, as well as OT-I × perforin−/− [OT-I (perf−/−)] (Kägi et al., 1994b) and OT-I × granzyme B cluster−/− [OT-I (gran B−/−)] (Heusel et al., 1994) mice were kept under pathogen-free conditions and had access to food and water ad libitum. All experiments were conducted according to the German law of animal protection and were approved by local authorities. All mice strains were either created on or backcrossed to a C57BL/6 RAG-1−/− genetic background (Mombaerts et al., 1992).
T-cell stimulation and flow cytometry.
Splenocytes from WT OT-I, OT-I (gran B−/−), and OT-I (perf−/−) mice were isolated as described previously (Ortler et al., 2008), plated at a density of 1 × 10⁷ per well on a 12-well plate, and primed by incubation for 5 d with ovalbumin257–264 peptide (1 nm) and IL-2 (500 IU/ml). On day 3, culture medium was renewed, and, on day 4, again 500 IU/ml IL-2 was added to the medium. After 5 d of in vitro culture, purity of CD8+ cells was checked regularly by flow cytometry (FACS-Calibur system; BD Bioscience) following standard protocols using CD8–PE (catalog #553033; BD Pharmingen) and CD4–FITC (catalog #553046; BD Pharmingen). Results were analyzed by CellQuest Pro Software (BD Bioscience).
WT OT-I, OT-I (gran B−/−), and OT-I (perf−/−) T cells were tested regularly and did not differ in cytokine (IFN-γ) secretion assessed by ELISA from culture supernatants or proliferation assessed by conventional [3H]thymidine uptake during antigen stimulation of splenocytes in vitro.
Hippocampal cell culture.
Neuronal cell cultures were obtained from WT C57BL/6 mice embryos (embryonic day 18) following previously described protocols (Lafon et al., 2008). Pregnant mice were killed by cervical dislocation, and embryos were removed and transferred into warmed HBSS (Invitrogen). After preparation of hippocampi, tissue was collected in 5 ml of 0.25% trypsin in HBSS. After 5 min of incubation at 37°C, tissue was washed two times with HBSS and dissociated in 1 ml of neuronal medium [10% 10× modified Earl's medium (MEM), 0.2205% sodium bicarbonate, 1 mm sodium pyruvate, 2 mm l-glutamine, 2% B27 supplement (all from Invitrogen), 3.8 mm glucose (Merck), and 1% penicillin/streptomycin (Biochrom)] by triturating with fire polished Pasteur pipettes of decreasing tip diameter. Neurons were diluted in neuronal medium and plated at a density of 60,000 cells/cm2 on poly-d-lysine (Sigma)-coated coverslips in four-well plates (Nunc). All cell cultures were incubated at 37.0°C and 5% CO2 and held in culture for up to 5–7 d before experiments. Immunocytochemical staining (see below) for nuclei [4′,6′-diamidino-2-phenylindole (DAPI)], neurons [neuronal-specific nuclear protein (NeuN)], and astrocytes (GFAP) provided a purity of ∼80% of our neuronal cell culture system.
For OT-I T-cell cytotoxicity assays, hippocampal cell cultures were incubated for 48 h with pure neuronal medium or neuronal medium containing 500 U/ml IFN-γ (Pepro Tech). Neurons were loaded with or without control peptide (SIY; 100 nm) or appropriate ovalbumin257-264 peptide (OVA, 100 nm), and, subsequently, in vitro activated WT OT-I T cells were added at a density of 60,000 cells/cm2 and coincubated for 6 h. In another subset of experiments, coincubation was performed in the presence of neutralizing anti-FasL (CD95L) antibodies (MFL4; catalog #555021; BD Pharmingen) at a concentration of 10 and 50 μg/ml and an isotypic control (50 μg/ml). As control, IFN-γ-induced neuronal cell cultures loaded with the OVA peptide were incubated for 6 h with in vitro activated WT 2C T cells at a density of 60,000 cells/cm2. In another subset of control experiments, IFN-γ-induced neuronal cell cultures loaded with the OVA peptide were incubated for 10 min with WT OT-I T cells or nystatin (200 μg/ml). Afterward, the cultures were washed, and neuronal cell death was analyzed after 6 h.
To analyze cell death after OT-I T cell–neuron interactions, cocultures were stained with 0.5 μg/ml DAPI (Merck) and propidium iodide (PI) (57.14 ng/ml; Merck) for 5 min each, and the number of PI-positive neurons was analyzed using a standard fluorescence microscope (Zeiss). Alternatively, cocultures were fixed with 4% paraformaldehyde (PFA) (Merck), washed three times with 10 mm PBS, and incubated for 90 min at 4°C in 10 mm PBS containing 10% horse normal serum (NHS) (PAA Laboratories) and 0.2% Triton X-100 (Sigma). Subsequently, primary antibodies [NeuN at 1:1000 (Millipore Bioscience Research Reagents) and activated caspase-3 at 1:200 (Cell Signaling Technology)] were diluted in 10 mm PBS containing 1% NHS and incubated for 1 h at room temperature. After washing steps with 10 mm PBS, secondary antibodies [cyanine 2 (Cy2)-labeled donkey anti-mouse at 1:100 (Dianova) and Cy3-labeled goat anti-rat at 1:100 (Dianova)] were incubated in the same manner. Staining with 0.5 μg/ml DAPI (Merck) was performed for 5 min. Finally, cultures were washed and subsequently covered with 1,4-diazabicyclo-[2.2.2]octane (DABCO) (Merck), and the fraction of activated caspase-3-positive neurons was determined by immunofluorescence microscopy (Axiophot; Zeiss).
Acute hippocampal slices.
WT C57BL/6 mice [postnatal day 10 (P10) to P12] were lethally anesthetized, and CNS vessels were highlighted by intracardial injection of 2% green fluorescent FITC–dextran (150 kDa) in PBS. Brains were removed immediately and put into 4°C cold (carbogen: 95% O2 and 5% CO2) artificial CSF (ACSF) containing the following (in mm): 124 NaCl, 1.25 NaH2PO4, 26 NaHCO3, 3 KCl, 1.6 CaCl2, 1.8 MgSO4, and 10 glucose. pH was adjusted to 7.35. Brain slices, 400 μm thick, were prepared using a vibratome (Leica VT 1200). Hippocampal tissue was isolated and allowed to recover for at least 1 h at room temperature before transfer to a heated Luigs & Neumann slice chamber (37°C), in which slices were continuously perfused with prewarmed carbogen-bubbled ACSF. Slices were labeled with the calcium sensitive dye Fluo-4 (Invitrogen) by incubation at a concentration of 10 μm for 30 min at 33°C. In vitro activated OT-I T cells were labeled with fluorescent Celltracker Orange CMTMR (Invitrogen) at a concentration of 2.5 μm for 30 min at 37°C. Approximately 0.75 × 10⁶ labeled T cells were transferred on the slice surface and allowed to enter the slice for ∼30 min before imaging. Image acquisition was usually performed in a depth of 30–80 μm and for ∼5 h per slice.
Chronic hippocampal slices.
Slices were isolated and prepared from C57BL/6 mice (P8–P11) as described previously (Kluge et al., 1998). In brief, brains were rapidly removed under sterile conditions after decapitation and placed in ice-cold preparation medium (MEM, 1% image glutamine; Invitrogen, Germany) at pH 7.35. The hippocampi were separated from the brain and cut into 350-μm-thick vertical slices on a tissue chopper (McIlwain; Gala Instruments). The slices were cultured on Millipore cell culture inserts, (pore size, 0.4 μm; Millipore) in six-well plates containing cultivation medium. The sterile cultivation medium contained 50% MEM, 25% HBSS (Invitrogen), 25% heat-inactivated normal horse serum (Invitrogen), 2% glutamine, 10 μg/ml insulin–transferrin–sodium selenite supplement (Roche Diagnostics), 2.64 mg/ml glucose (Braun), 0.1 mg/ml streptomycin, 100 U/ml penicillin, 0.8 μg/ml vitamin C (Sigma), 0.04% bicarbonate (Sigma), and 0.5% 1 m Tris base at pH 7.35. The organotypic slice cultures were incubated at 35°C in a humidified atmosphere with 5% CO2. In vitro activated WT OT-I T cells (50,000 cells per slice) were transferred onto the slice surface, and antigen was added 12 h after OT-I T-cell application. PI was added after 24 h of coincubation at a concentration of 5 μg/ml for 30 min and then washed away with cultivation medium. Slices were fixed in 4% PFA. After immersion of slices in 0.8 m sucrose solution for 2 d, followed by 1.4 m sucrose immersion for 3 d, 20 μm thin horizontal sections were resectioned. Neuronal cell death was estimated by fluorescent microscopic examination of the cells in the organotypic hippocampal slices using standard fluorescence microscopy (BX-50 microscope; Olympus). The number of PI-positive neurons/100,000 μm2 was analyzed using custom-built software after visual identification of the dentate gyrus region of the hippocampal slice.
For analysis of MHC I expression in neurons and astrocytes of chronic hippocampal slices, 10 μm slices were postfixed in 4% paraformaldehyde for 10 min and incubated in blocking solution (PBS containing 5% BSA, 1% normal goat serum, and 0.2% Triton X-100). Slices were then incubated simultaneously or consecutively with antibodies against GFAP (1:1000; Sigma) or NeuN (1:1000; Millipore Bioscience Research Reagents) and MHC I (1:100; Abcam) overnight at 4°C. Secondary antibodies were Alexa Fluor 488-coupled goat antibodies recognizing mouse IgG or Cy3-coupled goat antibodies recognizing rat or rabbit IgG. Negative controls were obtained by omitting either the primary or secondary antibody and revealed no detectable signal on subsequent analysis (data not shown). Sections were examined using an Axiophot2 microscope (Zeiss) equipped with a CCD camera (Visitron Systems).
Immunocytochemistry.
For immunocytochemical analysis of MHC I expression, hippocampal cell cultures were incubated for 48 h with pure neuronal medium or medium containing 500 U/ml IFN-γ (Pepro Tech). Afterward, they were fixed with 4% PFA (Merck), washed three times with 10 mm PBS, and incubated for 90 min at 4°C in 10 mm PBS containing 10% NHS (PAA Laboratories) and 0.2% Triton X-100 (Sigma). Primary antibodies [mouse MAP IIa/b at 1:200 (Abcam), NeuN at 1:1000 (Millipore Bioscience Research Reagents), GFAP at 1:1000 (Sigma), and rat MHC I at 1:200 (Abcam)] were diluted in 10 mm PBS containing 1% NHS and incubated for 1 h at room temperature. After washing steps with 10 mm PBS, secondary antibodies [Cy2-labeled donkey anti-mouse at 1:100 (Dianova) and Cy3-labeled goat anti-rat at 1:100 (Dianova)] were incubated in the same manner. Staining with 0.5 μg/ml DAPI (Merck) was performed for 5 min. Finally, cultures were washed and subsequently covered with DABCO (Merck).
Immunocytochemical stainings for granzyme B and perforin in T cells were performed on paraformaldehyde-fixed WT OT-I, OT-I (gran B−/−), and OT-I (perf−/−) T cells using rabbit anti-granzyme B (1:100; ab4059; Abcam), rat anti-perforin (1:100; ab16074; Abcam), and the corresponding secondary antibodies goat anti-rabbit Cy3 and goat anti-rat Cy2 (both 1:50; Dianova). Cell nuclei were counterstained with DAPI (0.5 μg/ml), and pictures were collected by immunofluorescence microscopy (Axiophot; Zeiss).
Time-lapse video microscopy.
Coverslips carrying neuronal cell cultures were transferred to co-cultivation chambers. A single chamber was filled with 200 ± 30 μl of neuronal medium containing 60,000 activated WT OT-I, OT-I (gran B−/−), or OT-I (perf−/−) T cells and subsequently sealed with paraffin/Vaseline.
Co-cultivation chambers were incubated at 37°C for 1 h before time-lapse imaging to allow for sedimentation of T cells to the bottom of the chamber and were then transferred to a microscope (Leica DM IL) connected to a digital camera (TP-505D; Topica). Images were taken every 20 s at a magnification of 20× for up to 6 h using an automated software (Time-Controlled Recorder Tetra version 1.1.0.4; SVS-Vistek). To provide adequate culturing conditions (37°C), a thermal measurement feedback regulator (STATOP-4849; Chauvin Arnoux) was connected to an infrared heat lamp (Beurer).
Still images were combined to movie sequences at an image rate of 10 frames per second using Apple Quicktime Pro. This resulted in an acceleration factor of 200× (1 s time-lapse movie is equal to 200 s real time).
Time-lapse movie sequences were analyzed for OT-I T-cell locomotion (i.e., fraction of time T cells migrate) and mobility (i.e., fraction of migrating T cells), T cell–neuron contact sites (neurites vs somata) and durations, migration pathways and distances, as well as morphological features of neuronal cell death (retraction of neurites, swelling of somata, and membrane blebbing) (Sumen et al., 2004). To obtain these parameters, a cell-tracking script based on HyperCard 2.2 by Apple Computers was used.
Electrophysiology.
Electrophysiological parameters [capacitance (CM), membrane resistance (RM), and serial resistance (RS)] of cultured whole-cell patch-clamped hippocampal neurons were measured using the “sine + dc” mode of the software lock-in extension of PULSE (Lindau and Neher, 1988) and the EPC10 amplifier (HEKA). Sine-wave frequency was set to 500 Hz, the peak amplitude was set to ±20 mV, and the holding potential was −80 mV. Internal two-pole and three-pole Bessel filter was set as described previously (Hallermann et al., 2003).
Measurements were performed for 10–15 min at ∼5 min after establishing the whole-cell configuration. A two-compartment recording chamber separating neuronal cell cultures from different T-cell types by a paraffin/Vaseline spacer (ratio of 1:1, heated at 100°C) was used. WT OT-I, OT-I (gran B−/−), or OT-I (perf−/−) T cells were transferred onto the somata of single neurons using a borosilicate glass pipette in the cell-attached configuration. The whole procedure was visualized using a microscope equipped with infrared-differential interference contrast optics (Dodt and Zieglgänsberger, 1990). Whole-cell recording pipettes were fabricated from borosilicate glass (typical resistance of 2–3 MΩ; GT150T-10; Clark Electromedical Instruments) and filled with an intracellular solution containing the following (in mm): 95 K-gluconate, 20 K3-citrate, 10 NaCl, 10 HEPES, 1 MgCl2, 0.5 CaCl2, 3 BAPTA, 3 Mg-ATP, and 0.5 Na-GTP. The internal solution was set to a pH value of 7.25 using KOH and an osmolality of 295 mOsm/kg. Slices were continuously superfused with a solution containing the following (in mm): 120 NaCl, 2.5 KCl, 1.25 NaH2PO4, 30 HEPES, 2 MgSO4, 2 CaCl2, and 10 dextrose. pH values were adjusted to 7.25 using HCl. A subset of electrophysiological experiments was performed in the presence of neutralizing anti-FasL (CD95L) antibodies (MFL4; catalog #555021; BD Pharmingen) at a concentration of 10 and 50 μg/ml and an isotypic control (50 μg/ml).
All neurons included in the analysis had a resting membrane potential negative to −60 mV, the access resistance was typically in the range of 5–15 MΩ, and series resistance compensation of >40% was routinely performed. A liquid junction potential of 8 ± 2 mV (n = 10) was measured and taken into account when analyzing the data.
Extracellular recording of neuronal network activity during T cell–neuron interactions using multielectrode arrays.
To analyze the impact of antigen-dependent CD8+ T cell–neuron interactions on the activity of a neuronal network, different parameters of neuronal network activity were determined using the multielectrode array (MEA) technique (Illes et al., 2007). MEA detects compound field potentials in the spatial vicinity of multiple extracellular electrodes in densely cultured hippocampal neurons, which are capable of generating spontaneous synchronized activity. Murine hippocampal neurons (QBM Cell Science) were plated at a density of 2 × 10⁵/cm2 on MEA chips coated with poly-d-lysine and laminin. MEA chips contained 60 Ti/TiN microelectrodes (Multi-Channel Systems), each with an input resistance of <50 kΩ, a diameter of 30 μm, and a mean distance to the neighboring electrode of 200 μm. All electrode signals were sampled at a frequency of 25 kHz using the MC-Rack Standard software (Multi-Channel Systems). MEA chips were incubated with the relevant peptide (OVA; 100 nm) or the control peptide (SIY; 100 nm) for 75 min and then incubated with 60,000 activated OT-I T cells for another 375 min. During the incubation, we analyzed the number of active channels as a measure of neuronal network activity.
To prove the synaptic interconnection of the cultured neurons, immunofluorescence staining for neurons and synaptophysin was performed using the following antibodies: the primary antibodies synaptophysin (rabbit, 1:5000; Synaptic Systems) and Map2 (mouse, 1:1000; Sigma); the secondary antibodies Cy3-conjugated donkey anti-rabbit IgG (1:1500; Dianova) and Alexa Fluor 488-conjugated goat anti-mouse IgG (1:2000; Invitrogen). Pictures were collected by immunofluorescence microscopy (Axiophot; Zeiss).
Calcium imaging during T cell–neuron interactions.
Imaging was performed using a custom-made two-photon microscope (T.I.L.L. Photonics) as described previously (Meis et al., 2007). In brief, fluorescent dyes were excited at 790 nm by a titanium/sapphire laser (Mira 900; Coherent). The laser beam was scanned by a modified Fluoview confocal unit (T.I.L.L. Photonics), mounted on top of an Olympus BX50WI microscope and operated by FV300 software (Olympus). The scanned beam was focused on the cell cultures through a 40× water-immersion objective (LUMPlan FI/IR, numerical aperture 0.8; Olympus). Emitted fluorescence was detected by external photomultipliers (Hamamatsu Photonics) after passing an infrared blocking filter (BG39; Chroma Technology). Bis-fura-2 (Invitrogen) was used as intracellular calcium indicator (Stutzmann et al., 2003). Results are expressed as fluorescence over time.
Two-photon microscopy in hippocampal brain slices.
Cells were visualized in acute hippocampal slice cultures by a two-photon system SP2 (Leica) equipped with an upright microscope fitted with 20× water-immersion objective (numerical aperture 0.5; Leica). Fluorescent dyes were excited simultaneously by a mode-locked titanium/sapphire laser (Tsunami; Spectra Physics) at a wavelength of 840 nm. Fluorescence from FITC–dextran and Celltracker Orange CMTMR (Invitrogen) was collected using two external non-descanned detectors. xyz stacks were typically collected 30–80 μm below the surface over a period of 1–2 h (z-stack ranging between 30 and 50 μm thickness, z-plane distance typically 1.8 μm). Cell recognition, movement tracking, and three-dimensional presentation were performed using Volocity (Improvision).
Statistical analysis.
All results are presented as mean ± SEM. Statistical analysis was performed using a modified Student's t test for normally distributed data (Dixon and Massey, 1969) or a Mann–Whitney test for not-normally distributed datasets. A Bonferroni's-corrected one-way ANOVA was used in case of multiple comparisons using SPSS, Prism 4 (GraphPad Software), or Origin (Microcal). p values <0.05 were considered statistically significant and are indicated as ** in the figures.
Results
Interaction of antigen-specific CD8+ effector T cells and MHC I-expressing hippocampal neurons in a coculture system: neuronal cell death by apoptosis
Under basal conditions, MHC I molecules cannot be detected on the surface membrane of hippocampal neurons. However, MHC I expression can be induced by exposure to IFN-γ (100 IU/ml) for 48 h and detected on both cell somata and neurites (Medana et al., 2001) by immunocytochemistry (supplemental Fig. 1A, available at www.jneurosci.org as supplemental material). To investigate whether OT-I T cells have the potential to induce antigen-dependent neuronal damage, we cocultured OT-I effector T cells and hippocampal neurons under various conditions. Neuronal cell death was assessed at different time points by DAPI/PI staining for plasma-membrane permeabilization and caspase-3 staining as marker for apoptosis. In the absence of OT-I T cells and during additional incubation with IFN-γ for MHC I induction (100 U/ml), virtually all neurons survived for at least 6 h. However, coincubation with OT-I cells after loading MHC I-expressing neurons with antigenic peptide (OVA) caused pronounced neuronal cell death (36 ± 16% surviving neurons, n = 5, p = 0.0213) (supplemental Fig. 1B, available at www.jneurosci.org as supplemental material) after a monoexponential time course with a time constant τ of 72 min. This is regarded as characteristic for apoptosis by perforin-mediated delivery of granzymes into the target cell (Waterhouse et al., 2006). Indeed, the time course of caspase-3 activation in cultured IFN-γ-treated neurons loaded with OVA peptide during coincubation with OT-I T cells was indistinguishable from that obtained by staining for PI uptake (supplemental Fig. 1B, available at www.jneurosci.org as supplemental material). Under control conditions, i.e., loading of neurons without any antigenic peptide or an irrelevant peptide (SIY), we observed significantly less neuronal cell death after 6 h (no peptide: 72 ± 4% surviving neurons, n = 5, p = 0.001; SIY-peptide: 83 ± 7% surviving neurons, n = 5, p = 0.045). Moreover, neuronal cell death was assessed by DAPI/PI staining after 6 h of incubation with SIY-reactive 2C T cells (Stefanski et al., 2001) in cultured IFN-γ-treated neurons loaded with OVA peptide and turned out not to be significantly different from background levels (2C T cells: 90 ± 3% surviving neurons; no T cells: 90 ± 4.4% surviving neurons; n = 5, p = 0.89) (supplemental Fig. 1C, available at www.jneurosci.org as supplemental material). Thus, most of the observed neuronal cell death is attributable to antigen-specific interaction of neurons with CD8+ T cells.
Visualization of immune–neuronal interactions by time-lapse video microscopy reveals morphological features of neuronal cell death consistent with apoptosis
Having demonstrated the principal antigen-dependent, MHC I-restricted induction of cell death in hippocampal neurons by OT-I T cells during coculture, we studied the migratory behavior of OT-I T cells and the morphology of cell-contact-dependent neuronal cell death under coculture conditions using time-lapse video microscopy (Wolf and Geley, 2006; Wolf et al., 2007) in coated coverslip preparations. With a mixture of poly-d-lysine (10 μg/ml) and laminin (20 μg/ml), neurons showed typical morphology, and OT-I T cells were able to freely migrate through the culture without being differentially affected by the coating procedure and the antigen-peptide incubation (supplemental Fig. 2A,B, available at www.jneurosci.org as supplemental material). T cell mobility, i.e., the fraction of migrating T cells in this system, was unchanged after application of the recognized (OVA) or control (SIY) peptide compared with control conditions (supplemental Fig. 2C, available at www.jneurosci.org as supplemental material).
However, migration patterns of OT-I T cells clearly differed depending on the relevance of the presented peptide: whereas OT-I T cells repetitively contacted neurons regardless of the antigen presented, the prevailing site of cell–cell contact (neurite vs soma) was determined by the antigen peptide presented to OT-I cells (Fig. 1A,B). In the absence of the relevant peptide, MHC I-expressing neurons were contacted by OT-I T cells at the soma as well as the neurites in equal parts (soma/neurite ratio: control, 50.0 ± 3.7%/50.0 ± 3.8%, n = 15; SIY, 62.6 ± 3.7%/37.4 ± 3.8%, n = 23). In contrast, OVA-presenting neurons were preferentially contacted at the neurites (soma/neurite ratio: 23.8 ± 6.8%/76.2 ± 6.9%, n = 21) (Fig. 1B) (supplemental Movies 1, 2, available at www.jneurosci.org as supplemental material), resembling the preferential attack of neurites in opposition to somata of antigen peptide loaded neurons by antigen-specific CD8+ T cells in vitro (Medana et al., 2001).
Figure 1.

Time-lapse video microscopy of OT-I T cell–neuron interactions. A, Migration and interaction of a stimulated OT-I T cell (white arrow) with a MHC I-expressing hippocampal neuron over 60 min in the presence of a control peptide (SIY, left column) and the appropriate OVA peptide (OVA, right column; see also corresponding video traces in Fig. 2A and supplemental Movies 1, 2, available at www.jneurosci.org as supplemental material). Scale bar, 20 μm (for all panels). B, Bar graph representation of T cell–neuron interaction sites [soma (black bars) vs neurites (gray bars)] under control conditions (con; n = 15) and after application of a control peptide (SIY; n = 23) or OVA peptide (OVA; n = 21). C, Percentage of T cell–neuron interactions leading to neuronal death as indicated by morphological changes (lethal hits) under control conditions (con; n = 15) and in the presence of a control peptide (SIY; n = 23) or OVA peptide (OVA; n = 21). Error bars represent mean ± SEM. **p < 0.05; ns, not significant.
Only under these conditions were relevant fractions of “lethal hits” observed. These were defined as morphological changes (retraction of neurites and swelling of somata followed by membrane blebbing), indicating neuronal apoptosis as a consequence of a direct CD8+ T cell–neuron contact (28 ± 2%, n = 21) (Fig. 1C). In contrast, in neurons presenting control peptide, the percentage of lethal hits was reduced to ∼10% (11 ± 6%, n = 23, p = 0.003), and under control conditions, virtually no lethal hits were observed (n = 15, p = 0.00004). Notably, the overall mean contact time between OT-I T cells and OVA-presenting neurons (101.9 ± 16.1 min) corresponded to the time constant of neuronal cell death assessed by PI uptake (τ = 72.4 min), suggesting that early morphological characteristics of neuronal apoptosis observed during lethal hits on direct CD8+ T cell–neuron contacts finally result in positive DAPI/PI staining, indicating late apoptosis rather than necrosis (Waterhouse et al., 2006).
OT-I T-cell migratory behavior under the experimental conditions was carefully controlled. We did not observe differences between the groups in the velocity of migration (Fig. 2B). However, locomotion (i.e., the percentage of time an OT-I T cell migrates), as well as total migrated distances were significantly lower in OVA-loaded cultures, reflecting a stop signal delivered to migrating OT-I T cells by the OVA-presenting neuron during extensive T cell–neuron interactions (Negulescu et al., 1996; Dustin et al., 1997). This T-cell “immobilization” allows for formation of the immunological synapse and initiation of CD8+ T-cell cytotoxicity on cognate antigen recognition (Fig. 2A,B).
Figure 2.

Analysis of OT-I T cell migration under coculture condition with neuronal cells. A, Representative tracking traces of individual OT-I T cells under coculture conditions in the presence of a control peptide (SIY, left) and OVA peptide (OVA, right). B, Bar graph representation of the T-cell migration parameters velocity (micrometers per minute), locomotion (percentage of time a T cell migrates), and migrated distance (micrometers) under control conditions (con; n = 21), after application of control peptide (SIY; n = 31) and after application of OVA peptide (OVA; n = 29). Error bars represent mean ± SEM. **p < 0.05; ns, not significant.
Passive electrical properties of antigen-presenting hippocampal neurons are altered as a direct consequence of cell–cell contact with antigen-specific CD8+ T cells
Having demonstrated that migrating OT-I T cells stop and induce neuronal apoptosis during appropriate MHC I-restricted antigen presentation, we asked for the impact of OT-I T cells on the functional properties of a single neuron during interaction. Single activated OT-I T cells were placed onto the soma of whole-cell patch-clamped hippocampal neurons presenting either OVA or a control peptide (SIY). OT-I T cells were placed on the soma of neurons for technical reasons of cell size and mechanical stability of the cell–cell contact during recording, although freely moving OT-I T cells preferentially contacted neurites in culture. Neurons were held at −80 mV, and a sine-wave voltage protocol [frequency of 500 Hz, amplitude of ±20 mV (Hallermann et al., 2003)] was applied (Fig. 3A, inset) to determine passive electrical parameters (CM, RS, and RM) (Fig. 3A–C) of neurons before and after establishing a direct cell–cell contact with an activated OT-I T cell. Recordings were performed for 10–15 min during which RS remained constant, allowing for exact monitoring of changes of the whole-cell membrane resistance RM resulting from T cell–neuron interaction. As a positive control, the unselective pore-forming agent nystatin (Holz and Finkelstein, 1970) (200 μg/ml), applied to the internal recording solution, significantly reduced RM within 10 min compared with control conditions (ΔRM: control, −30.38 ± 5.76%; nystatin, −65.92 ± 6.5%; n = 10 for each group; p = 0.001). Direct contact of OT-I T cells with OVA-presenting neurons caused a significant reduction of neuronal RM compared with control. This effect was not observed during presentation of a control peptide (ΔRM: SIY, −20.01 ± 5.03%; OVA, −51.18 ± 7.8%; n = 10; p = 0.0009) (Fig. 3C). Of note, nystatin, as well as both peptides caused a significant decrease of the membrane capacitance CM compared with control conditions, indicating a small reduction of the membrane surface probably attributable to retraction of neurites rather than profound cell swelling within a few minutes as typical of perforin-mediated cell lysis (Waterhouse et al., 2006). Again this points toward apoptosis as the neuronal death mechanism. Notably, peptide loading (OVA/SIY) per se did not induce any alteration of the electrical properties of cultured neurons (data not shown).
Figure 3.

Alteration of electrical properties of neurons during cell–cell contact with OT-I T cells. Whole-cell patch-clamp recordings of hippocampal neurons after establishing a cell–cell contact to an activated OT-I T cell. Neurons were held at −80 mV, and a sine-wave protocol (A, see inset; frequency of 500 Hz, voltage amplitude of 20 mV) was applied to determine passive electrical parameters. A, Representative recordings (left) and bar graph representation (right) of the CM under control conditions (con; n = 10), after intracellular application of the pore-forming agent nystatin (Nyst; 200 μg/ml; n = 12), and after attaching a single OT-I cell to the soma of the recorded neuron presenting a control peptide (SIY; n = 11) or OVA peptide (OVA; n = 12). B, Representative recordings (left) and bar graph representation (right) of changes in RS under control conditions (con; n = 10), after application of nystatin (Nyst; n = 12), and after neuron–T cell contact in the presence of a control peptide (SIY; n = 11) or OVA peptide (OVA; n = 12). C, Representative recordings (left) and bar graph representation (right) of changes in RM under control conditions (con; n = 10), after application of nystatin (Nyst; n = 12), and after neuron–T cell contact in the presence of the control peptide (SIY; n = 11) or OVA peptide (OVA; n = 12). Error bars represent mean ± SEM. **p < 0.05; ns, not significant.
In summary, our single-cell electrophysiological recordings indicate that cytotoxic CD8+ T cells can induce a massive reduction of RM, i.e., a profound increase of the membrane conductance of neurons. This effect is strictly antigen specific and occurs within <10 min after direct cell–cell contact, which is long before final cell membrane permeabilization. Increased neuronal whole-cell membrane conductance after CD8+ T-cell contact will cause an impairment of neuronal signaling attributable to massive electrical shunting of the neuronal membrane capacitance.
To confirm these findings on the level of neuronal network activity, we used multielectrode recording arrays in dense neuronal cell cultures incubated with OT-I T cells in the presence of the relevant OVA (100 nm) or the control SIY (100 nm) (supplemental Fig. 3, available at www.jneurosci.org as supplemental material). In these cultures, neurons were synaptically interconnected as shown by staining for synaptophysin (supplemental Fig. 3A, inset, available at www.jneurosci.org as supplemental material). During T-cell incubation, the number of recording channels detecting extracellular compound field potentials representing spontaneous synchronized activity of the neuronal network was used as a measure of the impact of OT-I T cells on electrical activity of neurons. Preincubation with either the relevant or the control peptide did not overtly change the number of active channels. However, during addition of activated OT-I T cells in the presence of the OVA peptide compared with the SIY peptide, the neuronal network activity was significantly reduced (supplemental Fig. 3A,B, available at www.jneurosci.org as supplemental material), and this effect persisted over a period of 24 h (supplemental Fig. 3B, inset, available at www.jneurosci.org as supplemental material). Hence, OT-I T cells are capable of electrical silencing single neurons and neuronal networks during detection of their cognate antigen presented on neurons in the context of MHC I molecules.
Intracellular Ca2+ accumulation during CD8+ T cell–neuron interaction is associated with the increase in whole-cell membrane conductance
In addition to an immediate impairment of electrical signaling, the neuronal membrane conductance activated by CD8+ T-cell contact may cause intracellular Ca2+ accumulation. Hence, we used the Ca2+ chelator bis-fura-2 to analyze neuronal calcium dynamics during a T cell–neuron interaction (Fig. 4).
Figure 4.

Kinetics of neuronal Ca2+ influx are similar to the increased membrane conductance during OT-I T cell–neuron interaction. A, Representative Ca2+ imaging with bis-fura-2 under control conditions (bleaching) and after application of the Ca2+-pore-forming agent ionomycin. Bar graph representation of the fluorescence ratio (ΔF/F) under control conditions and after application of ionomycin (see inset). Picture indicates a representative cultured hippocampal neuron and regions of interest for Ca2+ signal detection after attachment of an OT-I T cell on the soma of the investigated neuron (ROI1, soma; ROI2, proximal neurite; ROI3, distal neurite). Scale bar, 15 μm. B–D, Representative Ca2+ imaging traces and bar graph representation of Ca2+ signals recorded after establishing a cell–cell contact between WT OT-I T cells and neurons in the presence of OVA peptide (OVA; n = 5) or a control peptide (SIY; n = 5) detected at the soma (B), the proximal neurite (C), and the distal neurite (D). Bis-fura-2 fluorescence is expressed as the raw fluorescence, so that decreases in bis-fura-2 fluorescence correspond to increasing [Ca2+]i.
Under control conditions (no peptide loading, no OT-I T cells), constant intracellular Ca2+ concentrations were observed in neurons over 15 min (ΔF/F, 2.5 ± 0.94%). As a positive control, we used the Ca2+-pore-forming agent ionomycin (Liu and Hermann, 1978) (50 μg/ml), which induced a strong neuronal Ca2+ influx (ΔF/F, 28.6 ± 3.48%; n = 4; p = 0.004) (Fig. 4A). OT-I T cell–neuron interactions in the presence of a control peptide (SIY) had neither a significant impact on the intracellular Ca2+ concentration at the soma (O1) (Fig. 4B–D) nor at the proximal (O2) or distal (O3) neurites compared with control conditions (ΔF/F, <9% in all cases). In contrast, neurons presenting OVA showed a significant increase in intracellular Ca2+ concentration after establishing a cell–cell contact with an activated OT-I T cell. Intracellular Ca2+ increase displayed the same kinetics as the decrease in RM reaching a steady state within ≤10 min (Figs. 3C, 4B–D). Interestingly, an almost simultaneous rise of the intracellular Ca2+ concentration was observed at all regions of interest (ΔF/F: soma, 13.97 ± 3.07%; proximal dendrite, 26.4 ± 6.7%; distal dendrite, 23.1 ± 7.4%; n = 4; p = 0.0021), although OT-I T cells were always attached to the neuronal soma. Moreover, Ca2+ signals are even transmitted to neurites and somata of neighboring neurons during placement of OT-I T cells onto the soma a neuron (data not shown). This transmission could be attributable to the insertion of diffusely release perforin into the membrane of neighboring neurons (Gobel et al., 2009; Melzer et al., 2009). Alternatively, the perforin-dependent depolarization and Ca2+ rise of neuron A may induce a (para-)synaptic release of excitatory neurotransmitter and excite synaptically connected neighboring neuron B. This is in good agreement with the antigen-dependent electrical silencing observed in neuronal networks during incubation of OT-I T cells (supplemental Fig. 3, available at www.jneurosci.org as supplemental material).
Increased neuronal whole-cell membrane conductance and intracellular Ca2+ accumulation after a CD8+ T-cell contact depend on incorporation of pore-forming perforin into the neuronal surface membrane
The increase of the intracellular Ca2+ concentration simultaneous to the activation of a membrane conductance by CD8+ T cells may result from either Ca2+ entry through Ca2+-conducting channels incorporated or activated in the neuronal surface membrane and/or the liberation of Ca2+ from intracellular stores. Perforin is released together with granzymes by exocytosis from CD8+ T cells during TCR ligation and is known to form unselective pores within the target cell membrane (Young et al., 1986; Persechini et al., 1990; Pipkin and Lieberman, 2007). Therefore, we studied the impact of OT-I T cells deficient for perforin [OT-I (perfor−/−) (Kägi et al., 1994b)] or the granzyme B cluster [(OT-I (gran B−/−) (Heusel et al., 1994) (Fig. 5B)] on the neuronal membrane resistance RM during cell–cell contact (Fig. 5). In mutant OT-I T cells, expression of CD8, cytokine secretion (IFN-γ), as well as proliferation rates after CD3/CD28 bead stimulation in vitro were indistinguishable from wild-type OT-I cells (Fig. 5A,C,D). This is in good agreement with previous results (Waterhouse et al., 2006). However, whereas OT-I (gran B−/−) T cells were still capable of inducing a strong reduction of membrane resistance RM comparable with WT OT-I T cells [ΔRM: WT OT-I, −51.17 ± 7.82%; OT-I (gran B−/−), −57.7 ± 6.6%; n = 10; p = 0.23)], OT-I (perf−/−) T cells failed to induce any immediate alteration of the passive electrical properties of neurons compared with control [ΔRM: control, −30.38 ± 5.67%; OT-I (perf−/−), −32 ± 6%; n = 10; p = 0.45)] (Fig. 5E).
Figure 5.
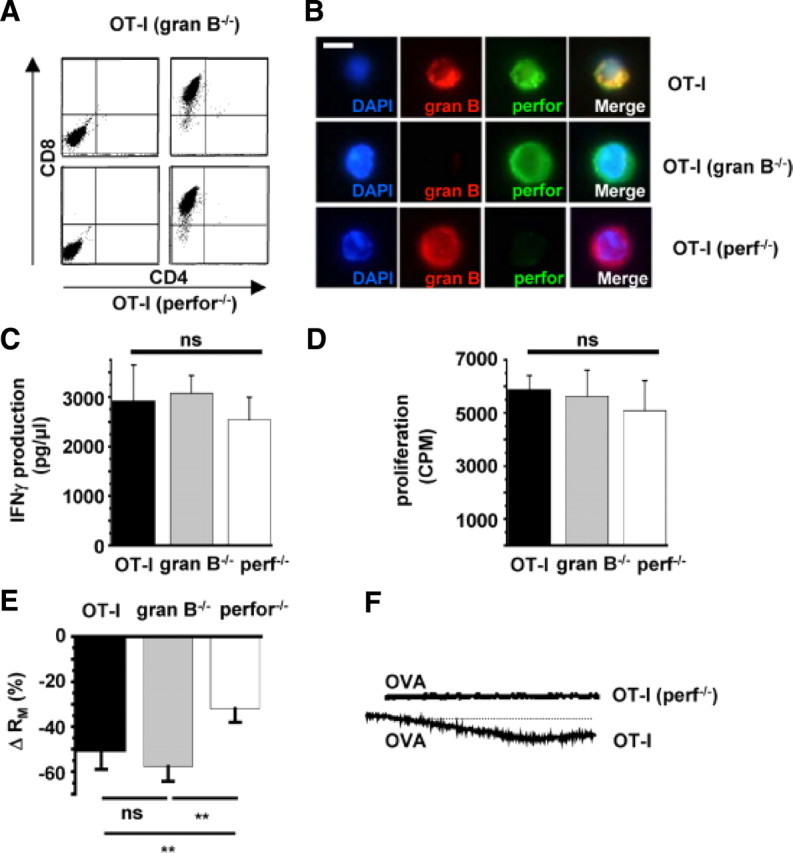
Increased neuronal membrane conductance during OT-I T cell–neuron interaction is attributable to incorporation of perforin into the neuronal surface membrane. A, Flow cytometry of splenocytes from RAG-1−/− OT-I mice deficient for granzyme B (gran B−/−; top row) or perforin (perf−/−; bottom row) before (left column) and after (right column) in vitro stimulation with OVA and IL-2. Virtually all cells were CD8+ after 5 d of in vitro stimulation. B, Immunocytochemistry using specific antibodies raised against granzyme B (red, gran B) and perforin (green, perf). Cell nuclei were counterstained with DAPI (blue). Scale bar, 10 μm. C, IFN-γ production during CD3/CD28 bead stimulation of OT-I T cells and OT-I T cells deficient for granzyme B (gran B−/−) or perforin (perf−/−). D, Proliferation after CD3/CD28 bead stimulation of OT-I cells and OT-I cells deficient for granzyme B (granB−/−) or perforin (perf−/−) as indicated by [3H]thymidine incorporation. E, Bar graph representation of the alteration of RM after establishing cell–cell contact between WT OT-I cells, OT-I cells deficient for granzyme B cluster (gran B−/−), or perforin (perf−/−) and hippocampal neurons. F, Representative Ca2+ imaging traces of Ca2+ signals recorded after establishing a cell–cell contact between WT OT-I T cells (n = 8) and OT-I (perf−/−) T cells (n = 8) and neurons in the presence of OVA peptide detected at the soma. Scale bars like in Fig. 4B–D. Error bars represent mean ± SEM. **p < 0.05; ns, not significant.
Accordingly, OT-I (perf−/−) T cells had no significant impact on the intracellular Ca2+ concentration at the soma or the neurites of MHC I-induced, OVA-peptide-loaded neurons compared with WT OT-I T cells (ΔF/F, <9% in all cases) (Fig. 5F).
These data clearly suggest that transmembrane pores formed by perforin mediate at least in part the conductance increase of the neuronal membrane and are thus likely to impair electrical signaling in neurons during antigen recognition by CD8+ T cells. Moreover, the accompanying rise of the intracellular Ca2+ concentration also crucially depends on perforin. Perforin is indeed known to create unselective, high-conductance pores (Young et al., 1986; Persechini et al., 1990), which are likely to contribute to the overall Ca2+ influx. However, the perforin-induced conductance increase will also depolarize the neuronal membrane, leading to an amplification of the conductance increase and the Ca2+ signal through activation of other voltage- and Ca2+-dependent transmembrane conductances and Ca2+ influx pathways.
Time-lapse video microscopy of OT-I T cell–neuron cocultures: the role of perforin and granzymes in neuronal apoptosis
Given the profound perforin-mediated impact of CD8+ T cells on the functional properties and calcium dynamics of neurons during cell-contact-dependent antigen recognition, we used time-lapse video microscopy of OT-I T cell–neuron cocultures in the presence of OVA and the control peptide (SIY) to study the impact of perforin and granzyme B cluster deficiency on OT-I T-cell locomotion and neuronal cell death (lethal hits) (Fig. 6).
Figure 6.

Perforin and the granzyme B cluster are dispensable for neuronal death in OT-I T cell–neuron cocultures. A, Representative tracking of WT OT-I cells (left), OT-I cells deficient for perforin (perf−/−; middle), or OT-I cells deficient for granzyme B cluster (gran B−/−; right) in hippocampal neuron cocultures in the presence of the OVA peptide (OVA; top row) or a control peptide (SIY; bottom row). Scale bar, 100 μm. B, Bar graph representation of the migrated distance of OT-I T cells, OT-I T cells deficient for perforin (perf−/−), or granzyme B cluster (gran B−/−) in the presence of OVA peptide (OVA; black columns) or a control peptide (SIY; gray columns). C, Percentage of T cell–neuron interactions leading to neuronal death as indicated by morphological changes (lethal hits) of neurons after coculture with OT-I T cells or OT-I T cells deficient for perforin (perf−/−) or granzyme B (gran B−/−) in the presence of OVA peptide (OVA; black columns) or a control peptide (SIY; gray columns). Error bars represent mean ± SEM. **p < 0.05; ns, not significant.
First we tested spontaneous migratory behavior of WT OT-I, OT-I (gran B−/−), and OT-I (perf−/−) T cells in the presence of the control peptide (SIY) (Fig. 6A, bottom row, B). Under these conditions, WT OT-I and OT-I (perf−/−) T cells showed equal migrated distances, whereas OT-I (gran B−/−) T cells exhibited a pronouncedly impaired migratory capacity, resulting in significantly reduced migrated distances.
In the presence of the OVA peptide, migrated distances of WT OT-I T cells were significantly reduced compared with SIY peptide, reflecting the stop signal delivered through TCR engagement by appropriate antigen presentation (Negulescu et al., 1996; Dustin et al., 1997) (Fig. 2B). In contrast, OT-I (gran B−/−) T cells showed significantly increased migrated distances, probably reflecting the coexistence of an activating, pro-migratory signal delivered to OT-I (gran B−/−) T cells during TCR-mediated recognition of the appropriate antigen, consistent with the repetitive TCR-mediated antigen stimulation of CD8+ T cells required to maintain efficient migratory properties within their target tissue in vivo (Mrass et al., 2006). OT-I (perf−/−) T cells displayed only a slightly, nonsignificantly reduced migratory behavior, suggesting a weighted equilibrium between stop and go signals delivered to OT-I T cells in culture (Fig. 6A, top row, B).
To our surprise, the relative number of lethal hits, reflecting the capability of inducing morphological alterations of neurons consistent with apoptotic cell death was independent from the migratory capacity of OT-I T cell. No significant differences between WT OT-I, OT-I (perf−/−), and OT-I (gran B−/−) T cells (Fig. 6C) were observed. This indicated, that, at least in our system, perforin per se as well as granzyme B (and granzymes C, D, E, F, and G in granzyme B cluster) (Heusel et al., 1994; Pham et al., 1996; Revell et al., 2005) delivered by perforin are dispensable for the induction of neuronal death.
To test whether electrical silencing could indeed occur independent from neuronal cell death, we incubated cultured neurons for 10 min with the unselective pore-forming agent nystatin (Holz and Finkelstein, 1970) at a concentration of 200 μg/ml or with WT OT-I T cells in the presence of the OVA peptide, conditions known to induce electrical silencing (Fig. 3). Afterward, cultures were washed extensively, and cell death was determined by DAPI/PI staining after 6 h, corresponding to the time interval required to detect cell membrane permeabilization in neurons incubated with OT-I T cells in the presence of the relevant OVA peptides (supplemental Fig. 1B, available at www.jneurosci.org as supplemental material). Numbers of PI-positive neurons were unaltered regardless of previous incubation with nystatin or WT OT-I T cells (supplemental Fig. 1D, available at www.jneurosci.org as supplemental material). Formally, we cannot exclude that injured neurons were also lost attributable to the washing procedure, although overall neuronal cell numbers were comparable with control conditions. This confirms that perforin-dependent electrical silencing by WT OT-I T cells (mimicked by nystatin) can occur independently from neuronal cell death. Conversely, neuronal cell death is possible without preceding electrical silencing (as demonstrated using perforin- and granzyme B-deficient OT-I T cells). Hence, CD8+ T cells that transiently contact antigen-presenting neurons may indeed induce transient electrical impairment without causing cell death.
FasL–Fas interactions are not required for conductance changes of neurons or neuronal apoptosis in OT-I T cell–neuron interactions
Ligation of Fas-receptors (CD95) on exposition of FasL (CD95L) on the surface of cytotoxic CD8+ T cells or the release of soluble FasL from cytotoxic granules has been postulated as a key mechanism to promote target cell death (Choi and Benveniste, 2004). This occurs with kinetics similar to that of perforin–granzyme-mediated cytotoxicity (Denecker et al., 2001a,b). Hence, we challenged the relevance of this pathway using a neutralizing anti-FasL antibody (MFL4) (Brunner et al., 1995; Kayagaki et al., 1997). The presence of a neutralizing anti-FasL antibody at a known blocking concentration of 10 μg/ml (Kayagaki et al., 1997) as well as 50 μg/ml or an isotypic control (50 μg/ml) did not influence neuronal survival in our OT-I T cell–neuron coculture system (Fig. 7A). Of note, blockade of Fas–FasL interactions also did not influence the decrease of the membrane resistance RM after a direct OT-I T-cell contact with an OVA-presenting neuron (Fig. 7B) at a concentration of 10 μg/ml. Hence, the FasL–Fas pathway is involved in neither impairing electrical signaling nor killing of neurons during a direct T cell–neuron interaction in our system.
Figure 7.

FasL–Fas interactions contribute to neither alteration of electrical properties of neurons nor neuronal killing by OT-I T cells. A, Cell death after 6 h of OT-I neuron coculture under control conditions (con; n = 16) and in the presence of a neutralizing anti-FasL antibody (10 μg/ml, n = 16; 50 μg/ml, n = 8) and an isotypic control (50 μg/ml, n = 6) as assessed by DAPI/PI staining. B, RM of hippocampal neurons after interaction with OT-I cells in the absence and presence of a neutralizing anti-FasL antibody (10 μm/ml, n = 8; 50 μm/ml, n = 8) and an isotypic control (Iso; 50 μm/ml, n = 6). Error bars represent mean ± SEM. **p < 0.05; ns, not significant.
CD8+ T cell–neuron interaction in acute and chronic hippocampal slice cultures
To prove our in vitro findings in virtually intact CNS parenchyma, we investigated the migratory and interactive behavior of activated WT OT-I T cells transferred into acute organotypic hippocampal slice cultures using two-photon microscopy (Nitsch et al., 2004). In the absence of the cognate antigen, activated CMTMR-labeled WT OT-I T cells rapidly entered acute hippocampal slices and showed a typical random migratory behavior in the densely packed neuronal banners of the CA region as described previously (Donnadieu et al., 1994; Siffrin et al., 2009) (Fig. 8A). OT-I cells under these conditions exhibited continuous propulsive migration with trailing uropods (Fig. 8B, top). Next, we determined the impact of antigen perfusion, i.e., external loading of MHC I-expressing cells within the slice with the cognate peptide for OT-I T cells. Antigen delivery caused an abrupt alteration of the migratory behavior of OT-I T cells: immediately after initiation of antigen perfusion, the former ovoid shaped and elongated cells rounded and froze on the spot (Fig. 8B, bottom) (supplemental Movie 3, available at www.jneurosci.org as supplemental material). Cell tracking revealed strong stationary motility with a sudden decrease of the instantaneous cell velocity from 0.044 ± 0.001 to 0.014 ± 0.001 μm/s after antigen perfusion (p < 0.001) (Fig. 8C), which remained unchanged until the end of experiment (here 20 min; longest observation time, 40 min; data not shown). The motility pattern of OT-I cells before antigen application showed characteristics of a random-walk behavior that has been described for CD8+ T cells in lymph nodes during the priming phase (Hugues et al., 2004) as well as in target tissue during the effector phase (Mrass et al., 2006). After antigen delivery, this nondirected motility changed to confined migration (Fig. 8D), as demonstrated by a reduced slope in the mean displacement plot (MDP). The MDP integrates velocity and directionality of each cell track and indicates the overall migration pattern of a cell population (Sumen et al., 2004). This characteristic change of motility pattern strongly indicates the delivery of a stop signal, allowing for the formation of an immunological synapse between CD8+ T cells and antigen-presenting cells in vitro (Donnadieu et al., 1994; Dustin et al., 1997), during the priming phase in lymph nodes (Hugues et al., 2004) and during the effector phase (Mrass et al., 2006) in vivo.
Figure 8.

Migratory behavior of OT-I T cells and neuronal killing in hippocampal slices. A, Acute hippocampal slices contain high densities of visually detectable neurons (NeuN) in the CA region (white frame) and permit the study of WT OT-I T cell migration and their interaction with neurons in intact CNS parenchyma by two-photon microscopy. B, WT OT-I T cells migrating in the absence of the OVA peptide are characterized by a round leading edge and a trailing uropod (top). During antigen application, OT-I T cells become round and stationary (bottom) (supplemental Movie 3, available at www.jneurosci.org as supplemental material). C, Mean instantaneous velocity of WT OT-I T cells (0–60 min) and after application of 25 nm OVA peptide (62–85 min) in acute hippocampal slice cultures. D, MDP of OT-I T cells in the absence and presence of the cognate antigen. The decrease of the slope in the MDP plot indicates the switch from a randomly migrating to a stationary OT-I T cell population during addition of antigen. E, F, Cells (white frame) in the CA region were loaded with the calcium-indicator dye Fluo-4 (green) and examined for the time course of changes in the intracellular Ca2+ levels before and after addition of the OVA peptide in the presence of OT-I T cells (left). Time course of the normalized maximal fluorescence intensities before and after addition of the OVA peptide (right). During addition of the antigenic peptide, target cells displayed either short transient Ca2+ oscillations (E) (supplemental Movie 4, available at www.jneurosci.org as supplemental material) or persistent increases of the intracellular Ca2+ levels (F) (supplemental Movie 5, available at www.jneurosci.org as supplemental material). G, Bar graph representation of the density of visually detected PI-positive neurons (DCA) in chronic hippocampal slice cultures after 24 h under control conditions (ctrl, 42 ± 5 DCA; n = 57), after application of OT-I cells without peptide (OT-I, 109 ± 19 DCA; n = 36), and after application of OT-I cells in the presence of OVA peptide (25 nm OVA; OT-I + OVA, 193 ± 30 DCA; n = 10). Data are presented as mean ± SEM. *p < 0.05; ***p < 0.01.
To investigate the impact of OT-I T cells on the intracellular Ca2+ concentration of target cells, acute hippocampal slices were loaded with the calcium indicator dye Fluo-4 before transfer of T cells. In the absence of their cognate antigen peptide, OT-I T cells migrating through the CNS tissue had almost no impact on the intracellular calcium levels of Fluo-4-loaded cells in the neuronal banner [Fig. 8E (supplemental Movie 4, available at www.jneurosci.org as supplemental material; Fig. 8F (supplemental Movie 5, available at www.jneurosci.org as supplemental material)]. After addition of the OVA peptide the normalized maximal intensity timelines of Fluo-4-loaded cells contacted by OT-I T cells indicate an intermittent and/or persistent increase of the intracellular Ca2+ concentration (Fig. 8E,F).
To study the outcome of OT-I T-cell interactions with antigen-loaded CNS cells including neurons, we used chronic organotypic hippocampal slices (Hailer et al., 1996), which allow incubation of OT-I T cells over a period of 24 h. OT-I T cells were applied to the slice, antigen was added 12 h later, and cocultures were stained with PI and fixed after 24 h. After resectioning, quantitative analysis of cell death was performed by visual identification of PI-positive hippocampal neurons. In organotypic hippocampal slices, antigen-dependent interactions of OT-I cell with hippocampal neurons resulted in a marked increase in the density of PI-positive neurons (Fig. 8G). However, it should be noted that, in these slice preparations, MHC I expression could also be detected in non-neuronal cells (supplemental Fig. 1E, available at www.jneurosci.org as supplemental material), and thus neuronal cell death could not solely be attributable to direct OT-I T-cell interactions but may also result from collateral neuronal killing by OT-I T cells interacting with antigen peptide-loaded glial cells.
Discussion
CD8+ cytotoxic T lymphocytes are considered important effector cells contributing to CNS damage in various neuroinflammatory disorders. We here visualize and characterize the interaction between primed TCR-transgenic, ovalbumin-reactive CD8+ T cells (OT-I T cells) and MHC I-expressing CNS neurons loaded with either OVA or a control peptide and determine functional consequences on a molecular and electrophysiological level. During coculture, OT-I T cells killed MHC I-expressing, OVA-presenting CNS neurons, as assessed by activated caspase-3 and PI-staining, with a time constant of ∼72 min in an antigen and cell–cell contact-dependent manner (supplemental Fig. 1, available at www.jneurosci.org as supplemental material). Together with data ruling out a relevant contribution of the FasL–Fas pathway (Fig. 7A) (Brunner et al., 1995; Kayagaki et al., 1997; Gobel et al., 2009), this indicates induction of apoptosis by perforin-mediated delivery of granzymes into the cytoplasm of OVA-loaded neurons rather than perforin-mediated lysis (Waterhouse et al., 2006). During apoptosis (i.e., granzyme-delivery by sublytic concentrations of perforin), cells initially undergo a period of intense ruffling of the plasma membrane known as blebbing. Finally, the integrity of the plasma membrane is lost, allowing the passive uptake of PI after 1–2 h (Waterhouse et al., 2006). In contrast, during perforin-mediated lysis (i.e., necrosis by lytic concentrations of perforin), rapid cell swelling and rupture of the plasma membrane occur in the absence of rounding and blebbing and result in rapid PI uptake within minutes (Waterhouse et al., 2006). During coculture, locomotion of OT-I T cells (Fig. 2), their sites of cell–cell interaction with neurons (neurites vs somata), and their killing efficacy (lethal hits characterized by retraction of neurites and swelling of somata) were all determined by MHC I-restricted neuronal presentation of the TCR-specific OVA peptide (Fig. 1). Notably, the mean cell–cell contact time between OT-I T cells and neurons (∼100 min) in culture corresponded to the time constant of killing (∼72 min), suggesting that both parameters reflect the same neuronal cell death process induced by cytotoxic CD8+ T cells. Conceptually, this consists of an initiation phase (∼28 min), followed by the execution phase (∼72 min) (Waterhouse et al., 2006).
Real-time electrophysiological recordings revealed that, on direct contact with activated OT-I T cells in the presence of the appropriate trimolecular complex, neuronal membrane resistance RM decreased ∼50% within 10 min. Approximately half of this can be attributed to the cell–cell contact with WT OT-I T cells when compared with the spontaneous RM decrease within 10 min (Fig. 3). This dramatically alters passive electrical properties and impairs electrical signaling of neurons by shunting the membrane capacitance, rendering them leaky and electrically silent. Electrical silencing (in the presence of a inflammatory milieu) has been shown to be associated with upregulation of MHC I expression, thus further facilitating recognition and interaction with specific T cells (Neumann et al., 1995, 1997). With similar kinetics and antigen restriction, neurons showed a rapid influx of Ca2+ during cell–cell contact with activated OT-I T cells (Fig. 4). Single-cell recordings and Ca2+ imaging using OT-I T cells deficient for perforin (Kägi et al., 1994b) or the granzyme B cluster [i.e., granzymes B, C, D, E, and F (Heusel et al., 1994; Pham et al., 1996; Revell et al., 2005)] (Fig. 5E) as well as WT OT-I T cells in the presence of blocking concentrations of monoclonal anti-FasL antibodies (Brunner et al., 1995; Kayagaki et al., 1997) (Fig. 7B) showed that the immediate increase of the whole-cell membrane conductance as well as the accompanying Ca2+ influx (Fig. 4E) in neurons contacted by OT-I T cells solely depended on T-cell-derived perforin. This strongly suggests that transmembrane pores formed by perforin induce the neuronal whole-cell conductance increase and transmembrane Ca2+ influx. Perforin is known to create unselective, high-conductance, Ca2+-permeable pores in a range of target cell membranes (Young et al., 1986; Persechini et al., 1990) and has been shown to cause electrical silence and intracellular Ca2+ overload of cardiomyocytes (Binah et al., 1992; Felzen et al., 1994). Moreover, in agreement with our single-cell recordings, we also observed an enhanced reduction of the spontaneous synchronized network activity during incubation of neuronal cell cultures with activated OT-I T cells in the presence of the relevant (OVA) compared with the control (SIY) peptide (supplemental Fig. 3, available at www.jneurosci.org as supplemental material).
Assuming that augmentation of the whole-cell membrane conductance is predominantly attributable to pore formation by perforin, one can obtain a rough estimate of the maximal number of perforin channels that need to be formed in the neuronal surface membrane to account for the whole-cell conductance increase induced by a single CD8+ T cell: during cell–cell contact with WT OT-I T cells, neuronal RM decreases from ∼1 to 0.5 GΩ, whereas OT-I (perf−/−) T cells reduce RM to 0.75 GΩ within 10 min. Thus, after 10 min of contact, perforin approximately accounts for an increase of the whole-cell conductance GM = 1/RM from 1.3 to 2 μS (Figs. 3C, 5E,F). Assuming an open probability p close to 1 in the absence of voltage-dependent gating transitions and a single-channel conductance γ of 1–2 nS (Young et al., 1986; Persechini et al., 1990), the mean perforin-induced conductance increase ΔGM of ∼700 pS cannot be explained by the formation of perforin channels of that size [n = ΔGM/γp (Hille, 1992)]. Thus far, published single perforin channel conductances were primarily obtained from experiments with purified perforin or cytotoxic granules at rather high concentrations (Young et al., 1986; Persechini et al., 1990; Binah et al., 1992; Felzen et al., 1994). Our results obtained from a more physiological direct CD8+ T cell–neuron interaction point toward much smaller single-channel conductances and/or open probabilities of perforin-formed channels in the neuronal surface membrane.
Thus far, our data consistently suggest that OT-I T cells induced apoptotic neuronal cell death by perforin-dependent delivery of granzyme(s) into neurons after coculture, and T-cell-derived perforin exerted massive impact on the electrical properties and intracellular Ca2+ concentration of neurons. Surprisingly, the quantity of neuronal cell death (i.e., lethal hits characterized by retraction of neurites and swelling of somata) in cocultures over 6 h (assessed by time-lapse videography) showed no differences between perforin-deficient, granzyme B cluster-deficient and WT OT-I T cells (Fig. 6C). In perforin-deficient OT-I T cells, this might be explained by either a perforin-independent delivery of granzyme(s) into the cytoplasm of neurons or extracellular effects of granzymes on neurons: indeed, granzyme entry into the target cell in the absence of perforin can be facilitated by the mannose-6-phosphate receptor (Motyka et al., 2000). Granzymes also may induce neuronal apoptosis and induce corresponding morphological alterations in the absence of perforin by activating cell surface receptors (Suidan et al., 1994; Wang et al., 2006). This suggests that, in our experimental setting, perforin is indispensable for the immediate alteration of the electrical properties but is not required for the induction of cell death of neurons. Indeed, 10 min incubation of neurons with WT OT-I T cells or the unselective pore-forming nystatin known to induce electrical silencing did not induce significant neuronal cell death afterward (supplemental Fig. 1D, available at www.jneurosci.org as supplemental material), suggesting that electrical silencing indeed is not necessarily linked to neuronal cell death. Conversely, neuronal cell death is possible without preceding electrical silencing (as demonstrated using perforin- and granzyme B-deficient OT-I T cells). Hence, CD8+ T cells that transiently contact antigen-presenting neurons may indeed induce transient electrical impairment without causing cell death.
To demonstrate the relevance of our findings in intact neural tissue, we finally used hippocampal slice cultures to study the migratory and neuronal killing behavior by WT OT-I T cells in living CNS tissue (Fig. 8). Similar to our in vitro findings, OT-I T cells displayed characteristic immobilization in the presence of OVA reflecting the stop signal delivered to migrating T cells via TCR signaling by antigen-presenting cells (Negulescu et al., 1996; Dustin et al., 1997). This antigen-dependent immobilization of OT-I T cells is supposed to be necessary for immunological synapse formation and closely resembles migratory behavior of CD8+ T cells in lymph nodes on recognition of their cognate antigen on antigen-presenting cells (Hugues et al., 2004) and during the effector phase in target tissue other than the CNS (Mrass et al., 2006). Moreover, after external loading of slices with OVA, we observed substantially enhanced neuronal killing by OT-I T cells after 12 h, confirming our in vitro findings in intact living CNS tissue. It should be noted, however, that all neural cell types express MHC I, and, thus, incubation of brain slices with the relevant OVA peptide will render all cell types targets for coincubated OT-I T cells. Hence, the observed neuronal Ca2+ accumulation and cell death might in part result from a bystander effect by the spillover of CD8+ T-cell-derived cytotoxic effector molecules (Gobel et al., 2009). Thus, we first demonstrate the migratory behavior of antigen-specific CD8+ T cells and their impact on the intracellular Ca2+ levels and survival of neurons in intact CNS parenchyma. Our experimental findings thus represent a paradigm for CD8+ T cell–neuron interactions as they may occur in various inflammatory CNS disorders (Melzer et al., 2009).
Footnotes
This study was supported by Interdisciplinary Center for Clinical Research Würzburg Grants A54-1 (S.G.M., H.W.) and Z-3/4 (N.M., H.W.) and the German Research Foundation Grants SFB581 and TP A8 (H.W.). We thank Dr. T. Hünig (Institute for Virology and Immunobiology, University of Würzburg, Germany) for providing WT OT-T, OT-I (perf−/−), and OT-I (granB−/−) mice and helpful discussions and A. Schmidt for excellent technical assistance. We thank Dr. P. Friedl (Department of Cell Biology, University of Nijmegen, The Netherlands) for his help with time-lapse video microscopy.
References
- Bauer J, Bien CG, Lassmann H. Rasmussen's encephalitis: a role for autoimmune cytotoxic T lymphocytes. Curr Opin Neurol. 2002;15:197–200. doi: 10.1097/00019052-200204000-00012. [DOI] [PubMed] [Google Scholar]
- Binah O, Marom S, Rubinstein I, Robinson RB, Berke G, Hoffman BF. Immunological rejection of heart transplant: how lytic granules from cytotoxic T lymphocytes damage guinea pig ventricular myocytes. Pflugers Arch. 1992;420:172–179. doi: 10.1007/BF00374987. [DOI] [PubMed] [Google Scholar]
- Brunner T, Mogil RJ, LaFace D, Yoo NJ, Mahboubi A, Echeverri F, Martin SJ, Force WR, Lynch DH, Ware CF, Green DR. Cell-autonomous Fas (CD95)/Fas-ligand interaction mediates activation-induced apoptosis in T-cell hybridomas. Nature. 1995;373:441–444. doi: 10.1038/373441a0. [DOI] [PubMed] [Google Scholar]
- Choi C, Benveniste EN. Fas ligand/Fas system in the brain: regulator of immune and apoptotic responses. Brain Res Brain Res Rev. 2004;44:65–81. doi: 10.1016/j.brainresrev.2003.08.007. [DOI] [PubMed] [Google Scholar]
- Denecker G, Vercammen D, Declercq W, Vandenabeele P. Apoptotic and necrotic cell death induced by death domain receptors. Cell Mol Life Sci. 2001a;58:356–370. doi: 10.1007/PL00000863. [DOI] [PMC free article] [PubMed] [Google Scholar]
- Denecker G, Vercammen D, Steemans M, Vanden Berghe T, Brouckaert G, Van Loo G, Zhivotovsky B, Fiers W, Grooten J, Declercq W, Vandenabeele P. Death receptor-induced apoptotic and necrotic cell death: differential role of caspases and mitochondria. Cell Death Differ. 2001b;8:829–840. doi: 10.1038/sj.cdd.4400883. [DOI] [PubMed] [Google Scholar]
- Dixon W, Massey FJ. Introduction to statistical analysis. New York: McGraw-Hill; 1969. [Google Scholar]
- Dodt HU, Zieglgänsberger W. Visualizing unstained neurons in living brain slices by infrared DIC-videomicroscopy. Brain Res. 1990;537:333–336. doi: 10.1016/0006-8993(90)90380-t. [DOI] [PubMed] [Google Scholar]
- Donnadieu E, Bismuth G, Trautmann A. Antigen recognition by helper T cells elicits a sequence of distinct changes of their shape and intracellular calcium. Curr Biol. 1994;4:584–595. doi: 10.1016/s0960-9822(00)00130-5. [DOI] [PubMed] [Google Scholar]
- Dörries R. The role of T-cell-mediated mechanisms in virus infections of the nervous system. Curr Top Microbiol Immunol. 2001;253:219–245. doi: 10.1007/978-3-662-10356-2_11. [DOI] [PubMed] [Google Scholar]
- Dustin ML, Bromley SK, Kan Z, Peterson DA, Unanue ER. Antigen receptor engagement delivers a stop signal to migrating T lymphocytes. Proc Natl Acad Sci U S A. 1997;94:3909–3913. doi: 10.1073/pnas.94.8.3909. [DOI] [PMC free article] [PubMed] [Google Scholar]
- Felzen B, Berke G, Rosen D, Coleman R, Tschopp J, Young JD, Binah O. Effects of purified perforin and granzyme A from cytotoxic T lymphocytes on guinea pig ventricular myocytes. Cardiovasc Res. 1994;28:643–649. doi: 10.1093/cvr/28.5.643. [DOI] [PubMed] [Google Scholar]
- Friese MA, Fugger L. Autoreactive CD8+ T cells in multiple sclerosis: a new target for therapy? Brain. 2005;128:1747–1763. doi: 10.1093/brain/awh578. [DOI] [PubMed] [Google Scholar]
- Gobel K, Melzer N, Herrmann AM, Schuhmann MK, Bittner S, Ip CW, Hunig T, Meuth SG, Wiendl H. Collateral neuronal apoptosis in CNS gray matter during an oligodendrocyte-directed CD8(+) T cell attack. Glia. 2009 doi: 10.1002/glia.20938. in press. [DOI] [PubMed] [Google Scholar]
- Hailer NP, Jarhult JD, Nitsch R. Resting microglial cells in vitro: analysis of morphology and adhesion molecule expression in organotypic hippocampal slice cultures. Glia. 1996;18:319–331. doi: 10.1002/(sici)1098-1136(199612)18:4<319::aid-glia6>3.0.co;2-s. [DOI] [PubMed] [Google Scholar]
- Hallermann S, Pawlu C, Jonas P, Heckmann M. A large pool of releasable vesicles in a cortical glutamatergic synapse. Proc Natl Acad Sci U S A. 2003;100:8975–8980. doi: 10.1073/pnas.1432836100. [DOI] [PMC free article] [PubMed] [Google Scholar]
- Heusel JW, Wesselschmidt RL, Shresta S, Russell JH, Ley TJ. Cytotoxic lymphocytes require granzyme B for the rapid induction of DNA fragmentation and apoptosis in allogeneic target cells. Cell. 1994;76:977–987. doi: 10.1016/0092-8674(94)90376-x. [DOI] [PubMed] [Google Scholar]
- Hille B. Ionic channels of excitable membranes. Ed 2. Sunderland, MA: Sinauer; 1992. [Google Scholar]
- Hogquist KA, Jameson SC, Heath WR, Howard JL, Bevan MJ, Carbone FR. T cell receptor antagonist peptides induce positive selection. Cell. 1994;76:17–27. doi: 10.1016/0092-8674(94)90169-4. [DOI] [PubMed] [Google Scholar]
- Holz R, Finkelstein A. The water and nonelectrolyte permeability induced in thin lipid membranes by the polyene antibiotics nystatin and amphotericin B. J Gen Physiol. 1970;56:125–145. doi: 10.1085/jgp.56.1.125. [DOI] [PMC free article] [PubMed] [Google Scholar]
- Hugues S, Fetler L, Bonifaz L, Helft J, Amblard F, Amigorena S. Distinct T cell dynamics in lymph nodes during the induction of tolerance and immunity. Nat Immunol. 2004;5:1235–1242. doi: 10.1038/ni1134. [DOI] [PubMed] [Google Scholar]
- Illes S, Fleischer W, Siebler M, Hartung HP, Dihné M. Development and pharmacological modulation of embryonic stem cell-derived neuronal network activity. Exp Neurol. 2007;207:171–176. doi: 10.1016/j.expneurol.2007.05.020. [DOI] [PubMed] [Google Scholar]
- Kägi D, Vignaux F, Ledermann B, Bürki K, Depraetere V, Nagata S, Hengartner H, Golstein P. Fas and perforin pathways as major mechanisms of T cell-mediated cytotoxicity. Science. 1994a;265:528–530. doi: 10.1126/science.7518614. [DOI] [PubMed] [Google Scholar]
- Kägi D, Ledermann B, Bürki K, Seiler P, Odermatt B, Olsen KJ, Podack ER, Zinkernagel RM, Hengartner H. Cytotoxicity mediated by T cells and natural killer cells is greatly impaired in perforin-deficient mice. Nature. 1994b;369:31–37. doi: 10.1038/369031a0. [DOI] [PubMed] [Google Scholar]
- Kayagaki N, Yamaguchi N, Nagao F, Matsuo S, Maeda H, Okumura K, Yagita H. Polymorphism of murine Fas ligand that affects the biological activity. Proc Natl Acad Sci U S A. 1997;94:3914–3919. doi: 10.1073/pnas.94.8.3914. [DOI] [PMC free article] [PubMed] [Google Scholar]
- Kluge A, Hailer NP, Horvath TL, Bechmann I, Nitsch R. Tracing of the entorhinal-hippocampal pathway in vitro. Hippocampus. 1998;8:57–68. doi: 10.1002/(SICI)1098-1063(1998)8:1<57::AID-HIPO6>3.0.CO;2-4. [DOI] [PubMed] [Google Scholar]
- Lafon M, Mégret F, Meuth SG, Simon O, Velandia Romero ML, Lafage M, Chen L, Alexopoulou L, Flavell RA, Prehaud C, Wiendl H. Detrimental contribution of the immuno-inhibitor B7–H1 to rabies virus encephalitis. J Immunol. 2008;180:7506–7515. doi: 10.4049/jimmunol.180.11.7506. [DOI] [PubMed] [Google Scholar]
- Lindau M, Neher E. Patch-clamp techniques for time-resolved capacitance measurements in single cells. Pflugers Arch. 1988;411:137–146. doi: 10.1007/BF00582306. [DOI] [PubMed] [Google Scholar]
- Liu C, Hermann TE. Characterization of ionomycin as a calcium ionophore. J Biol Chem. 1978;253:5892–5894. [PubMed] [Google Scholar]
- Lowin B, Hahne M, Mattmann C, Tschopp J. Cytolytic T-cell cytotoxicity is mediated through perforin and Fas lytic pathways. Nature. 1994;370:650–652. doi: 10.1038/370650a0. [DOI] [PubMed] [Google Scholar]
- Medana I, Martinic MA, Wekerle H, Neumann H. Transection of major histocompatibility complex class I-induced neurites by cytotoxic T lymphocytes. Am J Pathol. 2001;159:809–815. doi: 10.1016/S0002-9440(10)61755-5. [DOI] [PMC free article] [PubMed] [Google Scholar]
- Meis S, Munsch T, Sosulina L, Pape HC. Postsynaptic mechanisms underlying responsiveness of amygdaloid neurons to cholecystokinin are mediated by a transient receptor potential-like current. Mol Cell Neurosci. 2007;35:356–367. doi: 10.1016/j.mcn.2007.03.012. [DOI] [PubMed] [Google Scholar]
- Melzer N, Meuth SG, Wiendl H. CD8+ T cells and neuronal damage: direct and collateral mechanisms of cytotoxicity and impaired electrical excitability. FASEB J. 2009;23:3659–3673. doi: 10.1096/fj.09-136200. [DOI] [PubMed] [Google Scholar]
- Mombaerts P, Iacomini J, Johnson RS, Herrup K, Tonegawa S, Papaioannou VE. RAG-1-deficient mice have no mature B and T lymphocytes. Cell. 1992;68:869–877. doi: 10.1016/0092-8674(92)90030-g. [DOI] [PubMed] [Google Scholar]
- Motyka B, Korbutt G, Pinkoski MJ, Heibein JA, Caputo A, Hobman M, Barry M, Shostak I, Sawchuk T, Holmes CF, Gauldie J, Bleackley RC. Mannose 6-phosphate/insulin-like growth factor II receptor is a death receptor for granzyme B during cytotoxic T cell-induced apoptosis. Cell. 2000;103:491–500. doi: 10.1016/s0092-8674(00)00140-9. [DOI] [PubMed] [Google Scholar]
- Mrass P, Takano H, Ng LG, Daxini S, Lasaro MO, Iparraguirre A, Cavanagh LL, von Andrian UH, Ertl HC, Haydon PG, Weninger W. Random migration precedes stable target cell interactions of tumor-infiltrating T cells. J Exp Med. 2006;203:2749–2761. doi: 10.1084/jem.20060710. [DOI] [PMC free article] [PubMed] [Google Scholar]
- Negulescu PA, Krasieva TB, Khan A, Kerschbaum HH, Cahalan MD. Polarity of T cell shape, motility, and sensitivity to antigen. Immunity. 1996;4:421–430. doi: 10.1016/s1074-7613(00)80409-4. [DOI] [PubMed] [Google Scholar]
- Neumann H, Cavalié A, Jenne DE, Wekerle H. Induction of MHC class I genes in neurons. Science. 1995;269:549–552. doi: 10.1126/science.7624779. [DOI] [PubMed] [Google Scholar]
- Neumann H, Schmidt H, Cavalié A, Jenne D, Wekerle H. Major histocompatibility complex (MHC) class I gene expression in single neurons of the central nervous system: differential regulation by interferon (IFN)-gamma and tumor necrosis factor (TNF)-alpha. J Exp Med. 1997;185:305–316. doi: 10.1084/jem.185.2.305. [DOI] [PMC free article] [PubMed] [Google Scholar]
- Neumann H, Medana IM, Bauer J, Lassmann H. Cytotoxic T lymphocytes in autoimmune and degenerative CNS diseases. Trends Neurosci. 2002;25:313–319. doi: 10.1016/s0166-2236(02)02154-9. [DOI] [PubMed] [Google Scholar]
- Nitsch R, Pohl EE, Smorodchenko A, Infante-Duarte C, Aktas O, Zipp F. Direct impact of T cells on neurons revealed by two-photon microscopy in living brain tissue. J Neurosci. 2004;24:2458–2464. doi: 10.1523/JNEUROSCI.4703-03.2004. [DOI] [PMC free article] [PubMed] [Google Scholar]
- Ortler S, Leder C, Mittelbronn M, Zozulya AL, Knolle PA, Chen L, Kroner A, Wiendl H. B7–H1 restricts neuroantigen-specific T cell responses and confines inflammatory CNS damage: implications for the lesion pathogenesis of multiple sclerosis. Eur J Immunol. 2008;38:1734–1744. doi: 10.1002/eji.200738071. [DOI] [PubMed] [Google Scholar]
- Persechini PM, Young JD, Almers W. Membrane channel formation by the lymphocyte pore-forming protein: comparison between susceptible and resistant target cells. J Cell Biol. 1990;110:2109–2116. doi: 10.1083/jcb.110.6.2109. [DOI] [PMC free article] [PubMed] [Google Scholar]
- Pham CT, MacIvor DM, Hug BA, Heusel JW, Ley TJ. Long-range disruption of gene expression by a selectable marker cassette. Proc Natl Acad Sci U S A. 1996;93:13090–13095. doi: 10.1073/pnas.93.23.13090. [DOI] [PMC free article] [PubMed] [Google Scholar]
- Pipkin ME, Lieberman J. Delivering the kiss of death: progress on understanding how perforin works. Curr Opin Immunol. 2007;19:301–308. doi: 10.1016/j.coi.2007.04.011. [DOI] [PMC free article] [PubMed] [Google Scholar]
- Rall GF, Mucke L, Oldstone MB. Consequences of cytotoxic T lymphocyte interaction with major histocompatibility complex class I-expressing neurons in vivo. J Exp Med. 1995;182:1201–1212. doi: 10.1084/jem.182.5.1201. [DOI] [PMC free article] [PubMed] [Google Scholar]
- Revell PA, Grossman WJ, Thomas DA, Cao X, Behl R, Ratner JA, Lu ZH, Ley TJ. Granzyme B and the downstream granzymes C and/or F are important for cytotoxic lymphocyte functions. J Immunol. 2005;174:2124–2131. doi: 10.4049/jimmunol.174.4.2124. [DOI] [PubMed] [Google Scholar]
- Sanchez-Ruiz M, Wilden L, Müller W, Stenzel W, Brunn A, Miletic H, Schlüter D, Deckert M. Molecular mimicry between neurons and an intracerebral pathogen induces a CD8 T cell-mediated autoimmune disease. J Immunol. 2008;180:8421–8433. doi: 10.4049/jimmunol.180.12.8421. [DOI] [PubMed] [Google Scholar]
- Siffrin V, Brandt AU, Radbruch H, Herz J, Boldakowa N, Leuenberger T, Werr J, Hahner A, Schulze-Topphoff U, Nitsch R, Zipp F. Differential immune cell dynamics in the CNS cause CD4+ T cell compartmentalization. Brain. 2009;132:1247–1258. doi: 10.1093/brain/awn354. [DOI] [PubMed] [Google Scholar]
- Stefanski HE, Mayerova D, Jameson SC, Hogquist KA. A low affinity TCR ligand restores positive selection of CD8+ T cells in vivo. J Immunol. 2001;166:6602–6607. doi: 10.4049/jimmunol.166.11.6602. [DOI] [PubMed] [Google Scholar]
- Stutzmann GE, LaFerla FM, Parker I. Ca2+ signaling in mouse cortical neurons studied by two-photon imaging and photoreleased inositol triphosphate. J Neurosci. 2003;23:758–765. doi: 10.1523/JNEUROSCI.23-03-00758.2003. [DOI] [PMC free article] [PubMed] [Google Scholar]
- Suidan HS, Bouvier J, Schaerer E, Stone SR, Monard D, Tschopp J. Granzyme A released upon stimulation of cytotoxic T lymphocytes activates the thrombin receptor on neuronal cells and astrocytes. Proc Natl Acad Sci U S A. 1994;91:8112–8116. doi: 10.1073/pnas.91.17.8112. [DOI] [PMC free article] [PubMed] [Google Scholar]
- Sumen C, Mempel TR, Mazo IB, von Andrian UH. Intravital microscopy: visualizing immunity in context. Immunity. 2004;21:315–329. doi: 10.1016/j.immuni.2004.08.006. [DOI] [PubMed] [Google Scholar]
- Wang T, Allie R, Conant K, Haughey N, Turchan-Chelowo J, Hahn K, Rosen A, Steiner J, Keswani S, Jones M, Calabresi PA, Nath A. Granzyme B mediates neurotoxicity through a G-protein-coupled receptor. FASEB J. 2006;20:1209–1211. doi: 10.1096/fj.05-5022fje. [DOI] [PubMed] [Google Scholar]
- Waterhouse NJ, Sutton VR, Sedelies KA, Ciccone A, Jenkins M, Turner SJ, Bird PI, Trapani JA. Cytotoxic T lymphocyte-induced killing in the absence of granzymes A and B is unique and distinct from both apoptosis and perforin-dependent lysis. J Cell Biol. 2006;173:133–144. doi: 10.1083/jcb.200510072. [DOI] [PMC free article] [PubMed] [Google Scholar]
- Wolf F, Geley S. A simple and stable auto focusing protocol for long multidimensional live cell microscopy. J Microsc. 2006;221:72–77. doi: 10.1111/j.1365-2818.2006.01538.x. [DOI] [PubMed] [Google Scholar]
- Wolf K, Wu YI, Liu Y, Geiger J, Tam E, Overall C, Stack MS, Friedl P. Multi-step pericellular proteolysis controls the transition from individual to collective cancer cell invasion. Nat Cell Biol. 2007;9:893–904. doi: 10.1038/ncb1616. [DOI] [PubMed] [Google Scholar]
- Young JD, Nathan CF, Podack ER, Palladino MA, Cohn ZA. Functional channel formation associated with cytotoxic T-cell granules. Proc Natl Acad Sci U S A. 1986;83:150–154. doi: 10.1073/pnas.83.1.150. [DOI] [PMC free article] [PubMed] [Google Scholar]