

Abstract
Monkeys with unilateral lesions of the primary visual cortex (V1) can make saccades to visual stimuli in their contralateral (“affected”) hemifield, but their sensitivity to luminance contrast is reduced. We examined whether the effects of V1 lesions were restricted to vision or included later stages of visual–oculomotor processing. Monkeys with unilateral V1 lesions were tested with a visually guided saccade task with stimuli in various spatial positions and of various luminance contrasts. Saccades to the stimuli in the affected hemifield were compared with those to the near-threshold stimuli in the normal hemifield so that the performances of localization were similar. Scatter in the end points of saccades to the affected hemifield was much larger than that of saccades to the near-threshold stimuli in the normal hemifield. Additional analysis revealed that this was because the initial directional error was not as sufficiently compensated as it was in the normal hemifield. The distribution of saccadic reaction times in the affected hemifield tended to be narrow. We modeled the distribution of saccadic reaction times by a modified diffusion model and obtained evidence that the decision threshold for initiation of saccades to the affected hemifield was lower than that for saccades to the normal hemifield. These results suggest that the geniculostriate pathway is crucial for on-line compensatory mechanisms of saccadic control and for decision processes. We propose that these results reflect deficits in deliberate control of visual–oculomotor processing after V1 lesions, which may parallel loss of visual awareness in human blindsight patients.
Keywords: residual vision, superior colliculus, monkey, decision, macaque, oculomotor
Introduction
Some patients with damage to the primary visual cortex (V1) retain their ability to localize visual targets by either saccades or pointing by hand in their contralateral hemifield (“blindsight” or “residual vision”) (Poppel et al., 1973; Sanders et al., 1974; Weiskrantz et al., 1974). Blindsight has attracted attention of many researchers as “vision without awareness” (Dennett, 1991; Kaas, 1995; Chalmers, 1996; Block, 2005; Lamme, 2006). Saccades to visual stimuli are also retained in macaque monkeys with unilateral V1 lesions (Mohler and Wurtz, 1977; Segraves et al., 1987). However, these authors also provided evidence that saccades to visual stimuli became inaccurate just after the lesion (Mohler and Wurtz, 1977) or after recovery (Segraves et al., 1987), which was not investigated further. These studies led us to examine whether V1 lesions affect not only vision but also other aspects of visual–oculomotor processing.
Visual–oculomotor processing comprises various components. Monkey neurophysiological studies have demonstrated at the single-neuron level that various brain regions participate in each of these components: visual detection (Supèr et al., 2001), perceptual decision (Gold and Shadlen, 2007), target selection (Schall and Thompson, 1999), saccade initiation (Dorris et al., 1997), and control of trajectory during saccades (McPeek et al., 2003). In this study, we examined the effects of V1 lesions on two components of visual–oculomotor processing: control of trajectory during saccades and decision of saccade initiation.
We made unilateral lesions of V1 in macaque monkeys and systematically investigated saccades to the contralateral (“affected”) and ipsilateral (“normal”) hemifields. Because it is already known that the sensitivity to luminance contrast of stimuli is reduced in V1-lesioned monkeys (Cowey and Stoerig, 2004), the effects of V1 lesions on visibility must also be considered. For this purpose, various properties of the saccades to the affected hemifield were compared with those of the saccades to the low-contrast, near-threshold stimuli in their normal hemifield so that the success ratio of target localization was similar between the two conditions. We obtained evidence suggesting that the inaccuracy of saccades to the affected hemifield was not only attributable to insufficient visual information but also to deficits in saccadic control.
Decision processes in human and monkey have been successfully modeled by rise-to-threshold models (Carpenter and Williams, 1995; Hanes and Schall, 1996; Reddi and Carpenter, 2000; Ratcliff et al., 2003, 2007; Ratcliff and Smith, 2004; Palmer et al., 2005; Nakahara et al., 2006) based on the distributions of saccadic reaction times. To examine the effects of V1 lesions on decision of saccade initiation, we adopted the diffusion model, which incorporates success ratio and the reaction times of both correct and error trials (Ratcliff, 2001; Ratcliff and Tuerlinckx, 2002). The modeling revealed that the decision threshold for saccade initiation was lower in the affected hemifield than in the normal hemifield. Together, these results suggest that V1 lesions affect various stages of visual–oculomotor processing; decision making and oculomotor control. The relevance of such difference to conscious and unconscious visual processing will be discussed from the perspective of blindsight.
Materials and Methods
Animals.
Two Japanese monkeys (Macaca fuscata; monkey A, male, body weight of 9.0 kg; monkey T, female, body weight of 6.5 kg) were implanted with scleral search coils (Judge et al., 1980) and a head holder. All surgeries were performed under aseptic conditions as described previously (Kobayashi et al., 2002; Watanabe et al., 2005). Anesthesia was induced by administration of xylazine hydrochloride (2 mg/kg, i.m.) and ketamine hydrochloride (5 mg/kg, i.m.) and was maintained with isoflurane (1.0–1.5%). All experimental procedures were performed in accordance with the National Institutes of Health Guidelines for the Care and Use of Laboratory Animals and approved by the Committee for Animal Experiment at National Institute of Natural Sciences. The monkeys were allowed to recover for >2 weeks before starting the preoperative training.
Preoperative training.
The monkeys sat in a primate chair with their heads in a fixed position and were trained to perform a visually guided saccade task with four possible targets for a liquid reward. Eye movements were recorded using the magnetic search coil (Robinson, 1963) with a resolution of 0.1°. Horizontal and vertical eye positions were sampled at 1 kHz. Visual stimuli were presented on a cathode ray tube (CRT) monitor (21 inch, Mitsubishi model RD21GZ) positioned 28 cm from the eyes. Visual displays and data storage were controlled using computers running a real-time data acquisition system (Reflective computing, Tempo for Windows) with a dynamic link to Matlab (MathWorks). At the beginning of each trial, the fixation point (FP) appeared at the center of the screen, and monkeys were required to move their eyes to the FP. The duration of fixation was varied randomly between 400 and 1000 ms. When the eye positions deviated >1.5° from the FP, the trial was aborted. The saccadic target (a small spot of light 0.45° in diameter) appeared in the peripheral visual field concurrently with the offset of the FP. Monkeys were rewarded with fruit juice 200–500 ms after correctly making a saccade to the target and then maintaining fixation for 100–300 ms in the target window (size, 2–3°). Target eccentricity was fixed at 10°. Target direction was either upper 30° or lower 30° for both hemifields. A small percentage of trials with saccadic reaction times <80 ms were considered to be trials with anticipatory saccades and were omitted from the analysis. Trials with saccadic reaction times >700 ms were rare and were also omitted from the analysis. Intertrial intervals ranged from 1500 to 2000 ms.
Unilateral V1 lesion.
To study residual vision after V1 lesion, it is important to exclude the possibility that the spared cortex contributes to the residual vision (Campion et al., 1983; Fendrich et al., 1992). Thus, lesion should cover all of the corresponding visual field tested (5–25° in eccentricity). This corresponds to the posterior half of operculum, dorsal and ventral leaf and roof of calcarine sulcus, and the most posterior part of the stem of calcarine sulcus (Daniel and Whitteridge, 1961; Gattass et al., 1981; Van Essen et al., 1984). Under anesthesia, these cortices (Fig. 1) were surgically removed by aspiration with a small-gauge metal suction tube. After surgery, the monkeys were given penicillin G (80,000 units/d, i.m.) and cefmetazole (0.5 g/d, i.m.) as an antibiotics and dexamethasone sodium phosphate (0.5 mg/kg, i.m.) to minimize brain edema. Magnetic resonance images (MRIs) of the brains of these monkeys were acquired before and after the surgery (Fig. 1 B–D). The acquisition sequence was three-dimensional magnetization-prepared rapid-acquisition gradient echo. The voxel size was 0.82 × 0.82 × 0.81 mm.
Figure 1.
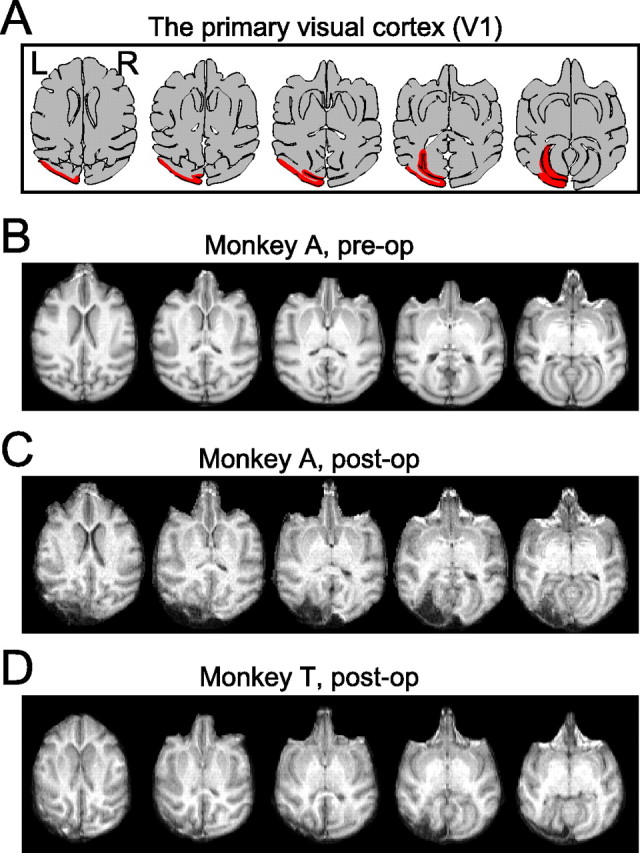
Lesion site. A, Drawing of horizontal section of macaque brain. The left V1s are drawn in red. B–D, Magnetic resonance images of monkey brains before and after V1 lesion. Axial slices. B, Monkey A, 4 weeks preoperative. C, Monkey A, 1 week postoperative. D, Monkey T, 1 week postoperative. L, Left; R, right.
Postoperative training.
Postoperative training was started 6 d (monkey A) or 21 d (monkey T) after the surgery, at which time the monkeys' general behavior in the cage looked normal. Initial recovery after V1 lesion was assessed with the same task as that of the preoperative training (supplemental Figs. 2S, 3S and supplemental Results, available at www.jneurosci.org as supplemental material).
Behavioral task.
After the postoperative training, the monkeys were tested with a visually guided saccade task with various target positions and various luminance contrasts. The saccadic target was presented in one of two to three eccentricities (5, 10, 15, 20, or 25°) in one of five directions (upper 60°, upper 30°, 0°, lower 30°, or lower 60°). Luminance of the target spot was calibrated by measuring luminance of a large spot of light with different intensity (from 0 to 255 in two or five steps) on the CRT screen with CS-100 (Konica Minolta). The procedure was repeated occasionally to ensure the luminance of the monitor was stable. Luminance contrast of the targets was expressed as Michelson contrast and ranged from 0.05 to 0.9. The target was 0.45° in diameter. In 45 sessions, the possible target positions were limited to one of the hemifields (monkey T, affected hemifield included 12 sessions, normal hemifield included 13 sessions; monkey A, affected hemifield included 10 sessions, normal hemifield included 10 sessions). In 21 sessions, targets were presented randomly in both hemifields (monkey T, 10 sessions; monkey A, 11 sessions). Because similar results were obtained from both kinds of sessions, data were merged for analysis (see also supplemental Results, available at www.jneurosci.org as supplemental material). Monkeys were rewarded for moving their eyes to the invisible target window (variable across target eccentricities, typically, 4° radius in 10° in eccentricity and 7.5° radius in 20° in eccentricity) within 700 ms after the target onset and within 150–250 ms after the saccade onset. The latter criterion was set to discourage the monkeys from making multiple saccades to foveate the saccadic target. There was no difference in reward criteria for time windows and spatial windows between the hemifields. Background luminance was set at 1 or 3 cd/m2, because comparable values were chosen in neurophysiological studies that investigated visual response of V1 neurons to stimuli presented in the natural blind spot in macaque monkeys (Murakami et al., 1997; Komatsu et al., 2000). In these studies, the effects of light scattering from the natural blind spot must be avoided. The precise time of target presentation on the CRT monitor was checked using a photo diode in the initial stage of experimental setup. The error between the time of the stimulus onset recorded in the software and that measured optically was at most ±6 ms, which is consistent with the frame rate of the CRT monitor, 80 Hz.
Calibration for saccade measurement.
We followed the procedure as described previously (Aizawa and Wurtz, 1998). Briefly, we used an eight-parameter model of the eye-coil system to make the conversion from the measured eye position to the actual eye position. To obtain values for the eight parameters used for calibration of the experimental data, calibration sessions were inserted occasionally in the testing sessions. The task of the calibration sessions was essentially the same as that used for testing sessions (see above, Behavioral task), but monkeys had to maintain fixation for 1000 ms after correctly making saccades to the target. The mean eye position during 750–1000 ms of the fixation period was used for calibration.
Analysis of saccadic eye movements.
Localization of the target was evaluated by calculating the ratio of success trials among all trials (“success ratio”). The trial was considered successful when the directional error of a saccade was <15°. Discrimination of the target positions was evaluated by calculating the discrimination index; first, the distribution of the directional component of end points in polar coordinates was plotted as a histogram (Fig. 2B). The bin width was 2°. Then, the discrimination index was defined as the area under the curve (AUC) of the receiver operating characteristic (ROC) curve from two distributions of end points with neighboring targets. Thus, for each eccentricity, the discrimination indices were obtained from four neighboring target pairs. When the two distributions were perfectly separated, the discrimination index was one. When the two distributions were perfectly overlapped, the discrimination index was 0.5. Threshold for luminance contrast was defined as the luminance contrast at which the psychometric function intersected the line representing a success ratio of 0.79. We chose this value because the value corresponds to the sensitivity value d′ = 2 in the five-alternative forced choice, in signal detection theory, thus ensuring that it is near threshold. The saccadic reaction time was defined as the interval between the target onset and the saccade onset. Saccades were detected when the peak velocity of the polar component exceeded 200°/s, except for targets with 5° eccentricity, for which the criteria was occasionally reduced to 100°/s. Then the onset time of the detected saccade was defined as the time point preceding the detected saccade at which the velocity exceeded 30°/s. The end point of the saccades was defined as the spatial position at which the velocity of the saccade declined below 30°/s after the saccadic onset. The initial direction of the saccades was defined as the vector angle from the onset of saccade to the point on the trajectory with 50% of the amplitude of the end point (see Fig. 6A). The variability of the saccadic end points and the initial directions was evaluated by constructing histograms of the directional component (in 0.01° bins, smoothed by a Gaussian filter with 1° SD) and by calculating the half-width at half-height (HWHH) of the peak of the histograms. In one target (25° in eccentricity, upper 60° in direction, affected hemifield) of 50 possible targets of monkey A, the peak was not reliably detected and the data were removed from analysis. We adopted the HWHH because it has the advantage that the value is invariant for systematic errors in the end points. For statistical analysis, JMP 6 (SAS Institute) was used.
Figure 2.
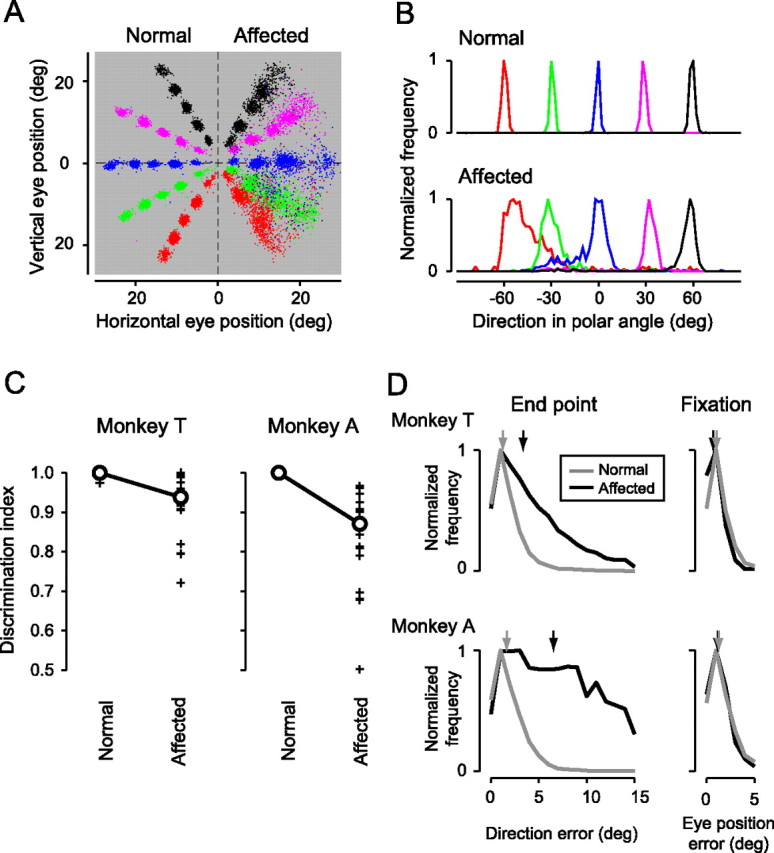
Residual vision and error in the saccadic end points. A, Distribution of the saccadic end points in the visually guided saccade task. Colors of dots indicate the direction of the position of the saccadic targets. Monkey T. B, The distributions of the directional components of end points (in polar coordinates) are plotted for saccades to the normal (top) and affected (bottom) hemifields. The values were normalized so that the peak value for each curve was one. Monkey T. The bin size is 2°. Targets with 10° eccentricity. C, The discrimination index for each neighboring target pair (see Results) was separately plotted for the targets in the normal and affected hemifields in monkey T (left) and monkey A (right). Circles, Median values. D, Left, Histograms of directional errors (in polar coordinates) of the saccadic end points. Gray line, Trials with targets in the normal hemifield; black line, trials with targets in the affected hemifield. Right, Histograms of the eye position errors (in polar coordinates) in fixation during the calibration sessions. Gray line, Trials with fixation targets in the normal hemifield; black line, trials with fixation targets in the affected hemifield. The arrows indicate the median values. Top, Monkey T; bottom, monkey A. The bin size is 1°.
Figure 6.

Scatter in the initial direction of saccades. A, Examples of trajectories of the saccades to a target (10° in eccentricity and lower 60° in direction) in the three trial categories. For comparison, the figure for the affected hemifield is flipped horizontally. Green dots, The points calculated as the initial direction of the saccades. Magenta dots, The end points of the saccades. White circles, Possible target positions. B, Histograms of the directional component of the initial direction (green) in polar coordinates, plotted in the same manner as in Figure 5B. For comparison, the histograms of the directional component of the end points (magenta, the same data as Fig. 5B) were superimposed. Monkey T, Trials with eccentricity of 10°. The bin size is 2°. C, The mean values for the HWHHs of the initial direction (green) and for those of the saccadic end points (magenta, the same data as Fig. 5C). **p < 0.01 in Tukey–Kramer's HSD test. †p < 0.001 in Wilcoxon's signed ranks test with Bonferroni's correction. n.s., Not significant. D, The mean values for the compensation index (see Results) were plotted across the three trial categories. Mean and SE. *p < 0.05 in Tukey–Kramer's HSD test.
A modified diffusion model.
The distributions of the saccadic reaction times were modeled based on the diffusion model (Ratcliff, 1978; Ratcliff and Tuerlinckx, 2002; Ratcliff et al., 2003). We adopted the diffusion model because it incorporates the reaction times of both correct and error trials and thus it is suitable for modeling responses to near-threshold stimuli such as low-contrast spots (Carpenter and Reddi, 2001; Ratcliff, 2001). Because the success trials were evaluated by the direction of the end points and the possible target directions for each hemifield were five, the task in the present study was treated as a five-alternative forced-choice task. Thus, the original diffusion model, designed for a two-alternative choice task, was not directly applicable to our data. Thus, the model was modified. The decision signals for five targets were independently accumulated in 1 ms steps (see Fig. 9A, top). The decision signal for the target accumulates with the accumulation rate μ and a Gaussian noise σ (see Fig. 9A, top). The decision signal for the nontargets accumulates with the accumulation rate 0 and a Gaussian noise σ, thus moving in a random-walk manner. In the original diffusion model, a saccade initiated at the time point when the difference between the decision signals of two choices exceeded a decision threshold (Ratcliff, 1978). As a natural extension to the five-alternative forced choice task, we modified the model so that a saccade initiated at the time point when the difference between the maximal decision signal and the secondary maximal signal exceeded the decision threshold θ (see Fig. 9A, middle). The same rule was adopted in modeling of a naming task (which was essentially a multi-alternative choice task) by a counter model (Ratcliff and McKoon, 1997). The saccadic reaction time was calculated as the sum of the time for the decision signal to reach to the decision threshold Td and the time for the nondecision component Tr (see Fig. 9A, middle). When the maximal decision signal was the nontarget, the trial was classified as an error trial. By repeating these procedures, the distributions of both success and error trials were constructed from 10,000 simulated data for each parameter (see Fig. 9A, bottom). The model contains three free parameters: μ, θ, and Tr. σ is a scaling factor, and both μ and θ was expressed relative to σ. For comparison of the decision thresholds θ between the hemifields, it is reasonable to evaluate them as the relative values to the noise level σ rather than as the absolute values. Here we set σ at 10. For simplicity, other possible components for variability were omitted. With this simplification, the median of the distribution of the success trials and the error trials are the same in the our model (Ratcliff and Tuerlinckx, 2002).
Figure 9.

A modified diffusion model. A, Illustration of the model. Top, The decision signal for the target accumulates with an accumulation rate μ and Gaussian noise σ (black line). The decision signals for the nontargets accumulate with an accumulation rate 0 and Gaussian noise σ (gray dotted lines). Middle, When the difference between the maximal signal and the second maximal signal exceeds the decision threshold θ, a saccade initiates. Td, Time of decision-related component; Tr, time of non-decision-related component. Bottom, By repeating this procedure, the distributions of the saccadic reaction times for the success trials and error trials were constructed. B, A sample simulation. The distributions of the simulated saccadic reaction times for the success trials (black line) and the error trials (gray, dotted line) are plotted for nine combinations of two parameters, the accumulation rate μ and the decision threshold θ. Tr is fixed here as 100 ms. The bin size is 5 ms.
Fitting the distribution of the saccadic reaction time.
We used the χ2 fitting method as described previously (Ratcliff and Tuerlinckx, 2002). Briefly, the observed reaction times for the success and error trials were separately grouped into six bins (at 0.1, 0.3, 0.5, 0.7, and 0.9 quantiles) (see Fig. 10A). In total, 12 bins of data for the observed data and the simulated data were obtained. Then, χ2 statistics were obtained as the sum of (O − E)2/E across 12 bins, where O is the frequency of the observed data and E is the frequency of the simulated data. The range and step of the parameters for the simulated data were as follows: μ from 0.10 to 1.60 in 0.01 steps; θ, from 5 to 100 in 1 steps; Tr, from 50 to 160 ms in 1 ms steps. The simulated data with the smallest χ2 statistics were selected as the best-fitted data. For statistical analyses of difference in the decision thresholds θ between the hemifields, the likelihood ratio test was used. The likelihood functions L for the two models, one with different θ for different hemifields (H1) and another with the same θ across hemifields (H0), were calculated based on the number of trials in the bins for the observed data and the simulated data (12 bins × 5 trial categories in total for each monkey). If the goodness of fit of the model H1 is equally good as that of the model H0, the likelihood ratio statistics 2 × [ln(L(H0)) − ln(L(H1))] follows the χ2 distribution with the degree of freedom one.
Figure 10.
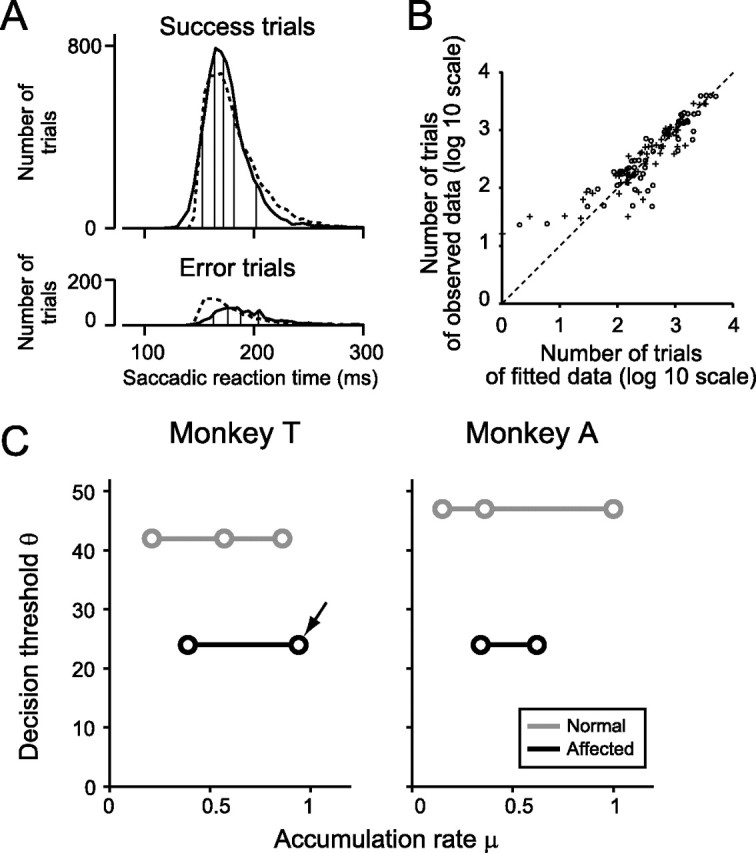
Fitting of the distribution of saccadic reaction times to the modified diffusion model. A, Histograms of saccadic reaction times of success trials (top) and error trials (bottom). Monkey T. The targets with high luminance contrast in the affected hemifield. Solid line, Observed data; dotted line, the best-fitted data (θ = 24, μ = 0.94, and Tr = 140 ms in this condition). To evaluate the goodness of fit, the data were subdivided into six bins (vertical lines) so that the ratio of the number of trials in the six bins was 1:2:2:2:2:1. B, Evaluation of the goodness of the fit. Each point represents a pair of the number of trials of observed data and that of fitted data in one bin of the histograms. For example, 12 data points were obtained from A, which have six pairs of behavioral data (solid line) and fitted data (dotted line) in success trials and another six pairs in error trials. The 12 data points were obtained from five trial categories of two monkeys. Thus, in total, 120 data points were plotted. log 10, Log10 scale. Circles, Monkey T; crosses, monkey A. C, The best-fitted values for the decision threshold θ are plotted against those for the accumulation rate μ. The decision threshold θ was held constant across the different trial categories within the hemifield. Gray, Saccades to the normal hemifield; black, saccades to the affected hemifield. Arrow, Condition plotted in A.
Results
Organization of experimental results
First, we confirmed that the extent of the V1 lesion covered all of the contralesional visual hemifield to be tested based on MR imaging (Fig. 1) and showed that there was a visual deficit that resulted from the lesion, using the saccade localization task (Fig. 3A). Then we mapped the extent of lesion and showed that sensitivity for luminance contrast was reduced by the V1 lesion in all of the contralesional target positions (Fig. 3B,C). Finally, we compared the saccadic properties between hemifields with visual deficit (the affected hemifield) and without visual deficit (the normal hemifield) using the same task as that used for test of visual deficit (see Figs. 5–10).
Figure 3.

Sensitivity to luminance contrast. A, Psychometric functions. Left, The success ratio was plotted against the luminance contrast. Gray line, Trials with targets in the normal hemifield; black line, trials with targets in the affected hemifield. Target eccentricity, 10°. Monkey T. Trials with different directions were merged for each hemifield. A dotted line indicates the success ratio 0.79, which corresponds to d′ = 2 in five-alternative forced choice in signal detection theory, used for defining the threshold for luminance contrast. Both plots were fitted with logistic functions with statistical significance (p < 0.01). Right, The discrimination index was plotted against the luminance contrast for the same data as in left. The discrimination indices of four pairs of neighboring targets were plotted against luminance contrasts. Gray lines, The normal hemifield; black lines, the affected hemifield. A dotted line indicates the chance level. B, The threshold for luminance contrast is displayed as a grayscale for each target position. Monkey T. C, Same as in B but for monkey A.
Figure 5.
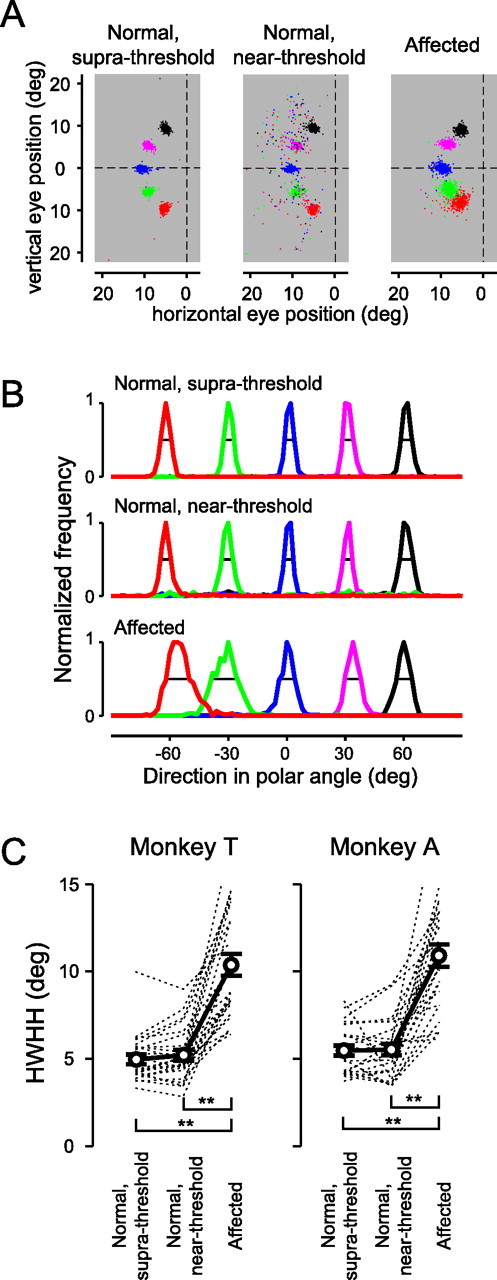
Scatter in the saccadic end points. A, The distribution of the saccadic end points in the three trial categories. Colors of dots indicate the direction of the position of the saccadic targets. For comparison, the figure for the affected hemifield is flipped horizontally. Trials with target eccentricity of 10°. Monkey T. B, Histograms of the directional components of the saccadic end points (in polar coordinates) in the three trial categories. Black line, The HWHH of the distribution. The bin size is 2°. C, The HWHH of each distribution is plotted across the three trial categories. The dotted lines denote individual values for each target position. The circles and error bars denote the means and SEs across target positions, respectively. **p < 0.01 in Tukey–Kramer's HSD test.
Figure 7.

Spatial pattern of saccade deficits. A, The HWHH of the end points is displayed as a grayscale for each target position, in the same manner as Figure 3, B and C. Monkey T. B, Same as in A but for monkey A. In one target (25° in eccentricity, upper 60° in direction, affected hemifield) of monkey A, the HWHH was not reliably calculated and the data were removed from analysis.
Figure 8.
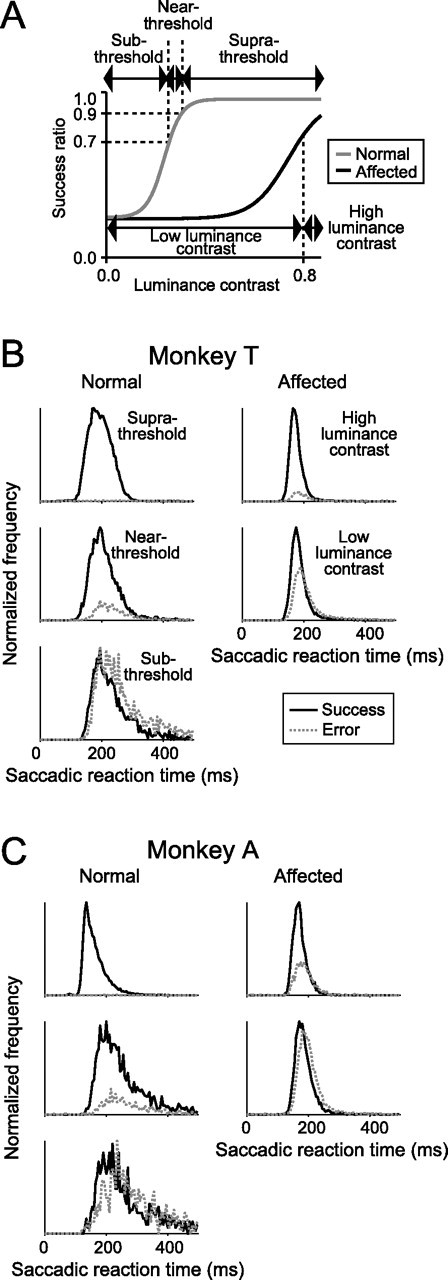
Distributions of the saccadic reaction times. A, Trials were classified into five trial categories in the same manner as shown in Figure 4A, except that two additional categories were added. B, Histograms of the saccadic reaction times for the five trial categories. The bin size is 5 ms. Left column, Saccades to the normal hemifield. Right column, Saccades to the affected hemifield. Black line, Success trials; gray dotted line, error trials. Monkey T. C, Same as in B but for monkey A.
Recovery of visually guided saccade after V1 lesion
The left V1s were removed by aspiration in two Japanese monkeys (Fig. 1). Brain MRIs 1 week after the lesions (Fig. 1C,D) indicated that both the occipital cortex posterior to the lunate sulcus and the banks of the calcarine sulcus were removed. Reconstruction of the lesion site suggest that the extent of lesion covered all of the contralesional visual hemifield tested here (5–25° in eccentricity) in both monkeys. For details, see supplemental Figure 1S and supplemental Results (available at www.jneurosci.org as supplemental material). The performance of visually guided saccades to the affected hemifield dropped to chance level just after the lesion but recovered in ∼2 months (for details, see supplemental Figs. 2S, 3S and supplemental Results, available at www.jneurosci.org as supplemental material). All of the following results were obtained after the recovery.
Residual vision
The monkeys were tested with a visually guided saccade task with targets in various positions and various luminance contrasts. In this and next sections, the data of trials with stimuli of high luminance contrasts (>0.8) are presented. The data of all trials with stimuli of various luminance contrasts (0.05–0.9) are presented below (see “Sensitivity to luminance contrast” and subsequent sections).
The distribution of the saccadic end points for monkey T is shown in Figure 2A. The monkey correctly made saccades to the normal hemifield and also correctly localized the target position in the affected hemifield, although the end points of saccades to this hemifield were scattered. Discrimination of the targets was evaluated by the distribution of the directional component of the end points in polar coordinates for each target position (Fig. 2B). In the normal hemifield, the mean discrimination index, computed from the AUC of the ROC curve drawn from the two distributions of end points with neighboring targets, was nearly 1, which indicates perfect discrimination (Fig. 2C). The median discrimination index in the affected hemifield (0.93 in monkey T and 0.87 in monkey A) was significantly lower than that of the normal hemifield (p < 0.001, Wilcoxon's signed ranks test) but significantly higher than the chance level, 0.5 (p < 0.0001, Wilcoxon's signed ranks test) in both monkeys (Fig. 2C). These results show that the monkeys with unilateral V1 lesions retained their ability to localize visual targets by saccades. The possibility that scattered light from targets in the affected hemifield contributed to the residual vision (Campion et al., 1983; Moore et al., 1995; Gross et al., 2004) was excluded by experiments showing that neither of the monkeys were able to localize visual targets presented in their natural blind spot in a monocular condition (supplemental Fig. 4S, available at www.jneurosci.org as supplemental material).
Error in the saccadic end point and fixation
To quantitatively confirm the differences in the distributions of the end points of the saccades to the affected and normal hemifields, we evaluated the deviations of the directional components of the saccadic end points from the target positions. In both monkeys, the directional errors in the affected hemifield (in polar coordinates) were much larger than those in the normal hemifield (Fig. 2D, left). When only the successful trials (trials with <15° of directional errors) were considered, the median values of the directional errors were 3.4° (n = 6739 trials) and 1.3° (n = 7737 trials) in the affected and normal hemifields of monkey T, respectively, and 6.4° (n = 3868 trials) and 1.5° (n = 6725 trials) in the respective hemifields of monkey A (Fig. 2D, left, arrows). These differences are statistically significant in both monkeys (the median test, p < 0.0001).
We also examined the difference in eye position errors during fixation in the calibration sessions between the normal and affected hemifields (Fig. 2D, right). The eye position errors during fixation in the affected hemifield was similar or slightly smaller than those in the normal hemifield, with the median values being 0.7° (n = 1923 trials) and 1.1° (n = 1677 trials), respectively, in monkey T (the median test, p < 0.0001) and 1.2° (n = 511 trials) and 1.3° (n = 2463 trials) in monkey A (the median test, p > 0.1). Thus, errors in fixation or the calibration procedure cannot explain the larger directional errors in the end points of saccades to the affected hemifield.
Sensitivity to luminance contrast
The effect of luminance contrast of the target on localization was assessed by systematically changing luminance contrasts (0.05–0.9) of the targets in the visually guided saccade task. For this purpose, success ratios and the discrimination indices were plotted against luminance contrasts (Fig. 3A, monkey T, 10° in eccentricity). These plots show that the sensitivity for luminance contrast was reduced in all of the five targets in the affected hemifield (for additional analysis, see supplemental Fig. 5S and supplemental Results, available at www.jneurosci.org as supplemental material). Then the thresholds for luminance contrast for each target position were calculated and displayed in a grayscale (Fig. 3B,C). When the corresponding pairs of target positions were compared between hemifields, the threshold for luminance contrast was consistently higher in the affected hemifield in all of the target pairs for all tested target positions. These results show that the V1 lesion reduced the sensitivity for luminance contrast of the targets. Thus, we confirmed behaviorally that V1 lesion affected all of the contralesional visual field tested by the visually guided saccade task (5–25° in eccentricity and upper 60° to lower 60° in direction).
Comparison with near-threshold condition
The errors in the end points of saccades to the affected hemifield demonstrated in Figure 2, A and D, can result from either insufficient visual information or deficits in control of saccades. To explore the cause of inaccurate saccades to the affected hemifield, we compared the saccades with the affected hemifield with those to targets with reduced luminance contrasts in the normal hemifield. In this comparison, the difficulties of the tasks at the level of visual processing were set to be analogous in the two hemifields. For the near-threshold condition, trials with luminance contrasts for which the success ratio was 0.7–0.9 were collected. Thus, three datasets were obtained (Fig. 4A): (1) saccades to the suprathreshold stimuli in the normal hemifield (“normal, suprathreshold”: n = 20,055 trials for monkey T and n = 14,486 trials for monkey A), (2) saccades to the near-threshold stimuli in the normal hemifield (“normal, near-threshold”: n = 5366 trials for monkey T and n = 3256 trials for monkey A), and (3) saccades to the targets with high luminance contrast (>0.8) in the affected hemifield (“affected”: n = 7629 trials for monkey T and n = 5875 trials for monkey A). If there are differences in the distribution of the saccadic end points between the normal, near-threshold condition and the affected condition, then the inaccuracy in the affected hemifield cannot be explained simply by insufficient visual information.
Figure 4.
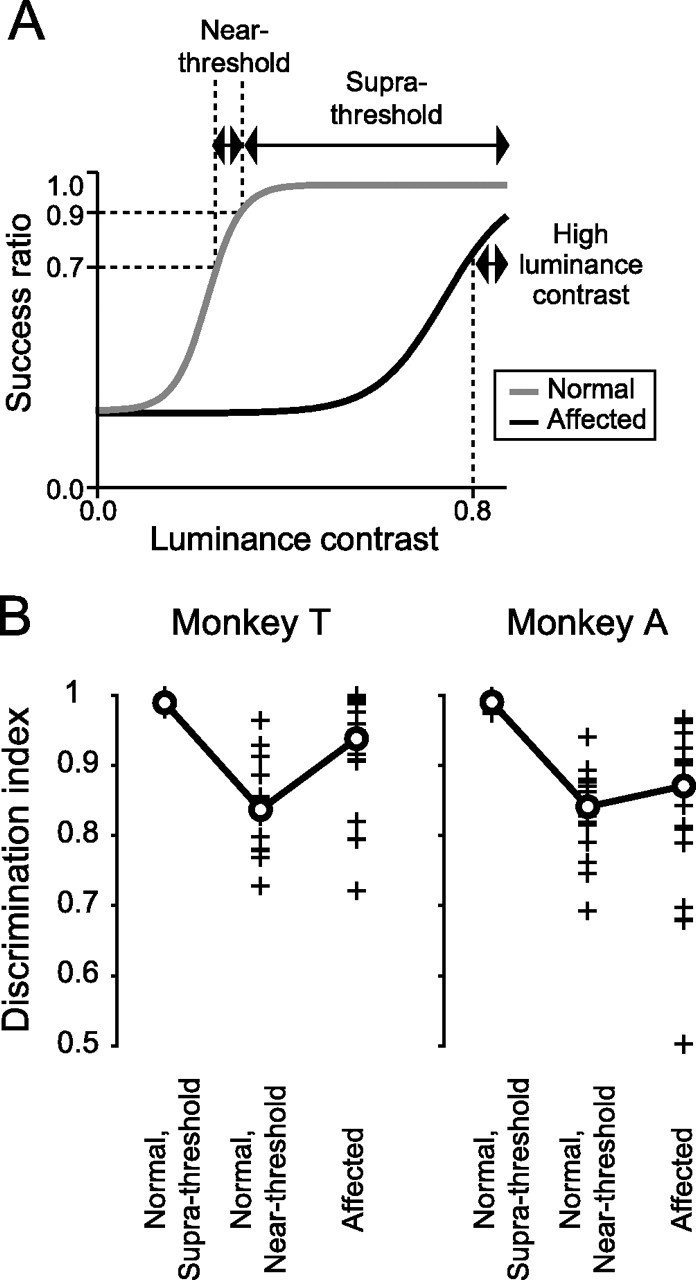
Classification of trials. A, A schematic psychometric function. Trials were classified into three categories, based on the success ratio for each luminance contrast: (1) saccades to suprathreshold stimuli in the normal hemifield (Supra-threshold), (2) saccades to near-threshold stimuli in the normal hemifield (Near-threshold), and (3) saccades to targets with high luminance contrast (>0.8) in the affected hemifield (High luminance contrast). B, The discrimination index calculated for three trial categories. Symbols are the same as in Figure 2C.
To examine the validity of this classification, the discrimination indices (Fig. 2C) were compared among the three trial categories (Fig. 4B). In both monkeys, the discrimination indices of the normal, near-threshold condition were equivalent (p > 0.10 for monkey A, Wilcoxon's signed ranks test) or even smaller (p < 0.001 for monkey T, Wilcoxon's signed ranks test) than that of the affected condition, suggesting the validity of the classification.
Scatter in the saccadic end point
To examine the effect of V1 lesion on accuracy of saccades, we compared distributions of the saccadic end points for the three trial categories. There were many mislocalization errors for the saccades to the near-threshold stimuli (Fig. 5A, middle). However, when only successful trials were considered, the distribution of the saccadic end points looks more similar to that of saccades to the suprathreshold stimuli (Fig. 5A, left) than that of saccades to the affected hemifield (Fig. 5A, right). To compare the variability of the saccadic end points, we first plotted histograms of the distributions of their directional components for the three trial categories and calculated the HWHH for each target (Fig. 5B). The HWHHs were then compared across the three trial categories (Fig. 5C). One-way ANOVA indicated a statistically significant main effect in the trial categories (p < 0.0001, in both monkeys; F(2,72) = 51.4 in monkey T; F(2,71) = 49.6 in monkey A). A post hoc multiple comparison test indicated that there were differences between saccades to the affected hemifield and those to the suprathreshold stimuli and between saccades to the affected hemifield and those to the near-threshold stimuli but no differences between saccades to the suprathreshold and the near-threshold stimuli [Tukey–Kramer's honestly significant difference (HSD) test, p < 0.01]. These results showed that saccades to the near-threshold stimuli in the normal hemifield were still much more accurate than those to the affected hemifield, although the difficulties of the two trial categories were similar. We also examined the distribution of end points of saccades to the “blurred” targets, which were produced by spatial smoothing of the original dot targets. The HWHHs of saccades to the blurred targets in the normal hemifield were still smaller than those of saccades to the affected hemifield (supplemental Fig. 6S, available at www.jneurosci.org as supplemental material). For detail, see supplemental Results (available at www.jneurosci.org as supplemental material).
Initial direction of saccades
To further explore the cause of scatter in the end points of saccades to the affected hemifield, we analyzed the trajectory of the saccades. We found that their trajectories tended to be straight (Fig. 6A, right). This contrasted with the saccades to the normal hemifield in both the suprathreshold and the near-threshold conditions (Fig. 6A, left and middle). This observation was quantified by measuring the initial direction of the saccades, defined as the vector angle from the saccade onset to the point on the trajectory with 50% of the amplitude of the end point (Fig. 6A, green dots). The distributions of the initial directions were then compared with those of the end points (Fig. 6B). The distribution of the initial direction in the normal hemifield was broader than that of the end points (Fig. 6B, top and middle). Conversely, they were almost identical in the affected hemifield (Fig. 6B, bottom). Variabilities in the initial directions, evaluated by the HWHH, were compared between the three trial categories (Fig. 6C, green line) and with those of the end points (Fig. 6C, magenta line). One-way ANOVA of the HWHH of the initial directions indicated a statistically significant main effect in trial categories (p < 0.001, in both monkeys; F(2,72) = 9.7 in monkey T; F(2,71) = 13.8 in monkey A). A post hoc multiple comparison test indicated that there were differences between the HWHH of the initial directions to the affected hemifield and those to the suprathreshold stimuli and between those to the affected hemifield and those to the near-threshold stimuli but no differences between those to the suprathreshold and the near-threshold stimuli (Tukey–Kramer's HSD test, p < 0.01). There were significant differences between the HWHH of the end point and the initial direction in the normal, suprathreshold condition (p < 0.0001 for both monkeys, Wilcoxon's signed ranks test with Bonferroni's correction for multiple comparison) and in the normal, near-threshold condition (p < 0.0001 for both monkeys), but there were no differences in the affected hemifield (p > 0.10 for both monkeys).
The saccadic system is equipped with mechanisms by which initial direction errors are compensated in the course of eye movements (Becker and Jurgens, 1990; Quaia et al., 2000) so that the accuracy of the end points is attained. To quantify the degree of such compensation, we defined the compensation index as 1 − (HWHH of the end points/HWHH of the initial direction). If there was no compensation, the compensation index was zero and the saccades were inaccurate. The mean values for the compensation index were compared among the three trial categories (Fig. 6D). ANOVA indicated a statistically significant main effect in trial categories (p < 0.001, in both monkeys; F(2,72) = 35.7 in monkey T; F(2,71) = 5.7 in monkey A). A post hoc multiple comparison test indicated that there was a difference between the saccades to the affected hemifield and those to the suprathreshold stimuli and between the saccades to the affected hemifield and those to the near-threshold stimuli but not between the saccades to the suprathreshold and the near-threshold stimuli (Tukey–Kramer's HSD test, p < 0.05). These results suggest that the V1 lesions affected neuronal mechanisms of the on-line compensation of initial direction errors.
Comparison between saccade deficits and visual deficits
To compare the spatial pattern of saccade deficits with that of visual deficits, the HWHH of the end points were displayed (Fig. 7A,B) in the same manner as in Figure 3, B and C. This demonstrates that the HWHHs were consistently higher in all of the targets in the affected hemifield than the corresponding pair of targets in the normal hemifield.
As described above, we confirmed that the lesion in V1 was complete (Fig. 1) (supplemental Fig. 1S, available at www.jneurosci.org as supplemental material) and that the V1 lesion affected all of the contralesional visual field tested here (Fig. 3) (supplemental Fig. 5S, available at www.jneurosci.org as supplemental material). Additional support was obtained from comparison between the spatial pattern of saccade deficits and that of visual deficits. If the lesion was incomplete, the threshold for luminance contrast for the positions will be low and the saccade deficits would be small, and there will be a positive correlation between them. To exclude this possibility, we calculated the target-by-target correlation coefficients between the threshold for luminance contrast (Fig. 3B,C) and the HWHH (Fig. 7A,B), which evaluated the degree of scatter in the end points of saccades. The correlation coefficients were −0.05 and −0.002 in monkey T and monkey A, respectively. These values were not significantly different from zero (p > 0.5). We also calculated the correlation coefficients between the log-converted threshold for luminance contrast and the HWHH. They were −0.10 and −0.03 in monkey T and monkey A, respectively. These values were not significantly different from zero (p > 0.5). These results indicate that the above possibility is unlikely; the variation in the threshold for luminance contrast is not a result of spared V1 but rather random variation or positional bias, which we argued in detail in the supplemental Results (available at www.jneurosci.org as supplemental material).
Saccadic reaction time
Then we examined the effect of V1 lesions on the saccadic reaction time. The saccades for both the success and error trials were classified into five trial categories, three of which were identical to those used for the analysis of the end points (Fig. 8A): (1) saccades to the suprathreshold stimulus in the normal hemifield, (2) saccades to the near-threshold stimulus in the normal hemifield, (3) saccades to the subthreshold stimulus in the normal hemifield in which the success ratio was below 0.7 (n = 2612 trials for monkey T; n = 1695 trials for monkey T), (4) saccades to the targets with high luminance contrasts (>0.8) in the affected hemifield, and (5) saccades to the targets with low luminance contrasts (<0.8) in the affected hemifield (n = 16,718 trials for monkey T; n = 10,632 trials for monkey T). Histograms of the saccadic reaction times of both the success and error trials were then plotted (Fig. 8B,C). The median values of the saccadic reaction times of the success trials for each condition were as follows: (1) 193 ms, (2) 201 ms, (3) 217 ms, (4) 172 ms, and (5) 180 ms for monkey T (Fig. 8B); and (1) 153 ms, (2) 230 ms, (3) 252 ms, (4) 169 ms, and (5) 181 ms for monkey A (Fig. 8C). Statistical analysis revealed that the median reaction time of saccades to the targets with high luminance contrasts in the affected hemifield was significantly shorter than to that to the near-threshold stimuli in the normal hemifield (Mann–Whitney's U test, p < 0.0001, in both monkeys). This suggests that V1 lesions affect saccade initiation. The widths of the distributions of the saccadic reaction time of the success trials, evaluated here as the difference between the 25th percentile point and the 75th percentile point, were as follows: (1) 53 ms, (2) 56 ms, (3) 72 ms, (4) 25 ms, and (5) 30 ms for monkey T (Fig. 8B); and (1) 44 ms, (2) 102 ms, (3) 170 ms, (4) 28 ms, and (5) 34 ms for monkey A (Fig. 8C). We observed that the widths of the distributions of the saccades to the affected hemifield were narrower than those of the saccades to the normal hemifield. Moreover, the shapes of the distributions of the saccades to the affected hemifield were similar, regardless of the different luminance contrasts of the targets. This is a striking contrast to the tendency in the normal hemifield, in which the distributions were wider as the luminance contrast of the target was reduced. These results raise the possibility that V1 lesion affects decision processes for saccade initiation.
A modified diffusion model
To explore the effect of V1 lesions on the decision process, the distributions of saccadic reaction times were modeled by a modified version of the diffusion model (Ratcliff, 1978; Ratcliff and Tuerlinckx, 2002; Ratcliff et al., 2003), as illustrated in Figure 9A (for details, see Materials and Methods). Briefly, the decision signal for the target position accumulates with the accumulation rate μ in a random-walk manner, whereas those for the nontarget positions accumulate with the accumulation rate 0 (Fig. 9A, top). When the difference between the maximal value and the second maximal value exceeds the decision threshold θ, a saccade initiates (Fig. 9A, middle). Based on whether the decision signal with maximal value is for the target or nontargets, trials are classified into either success or error trials (Fig. 9A, bottom). The model contains three free parameters: the accumulation rate μ, the decision threshold θ, and the time of the nondecision component Tr. Because Tr does not affect the shape of the distribution of the saccadic reaction times, the general tendency of the distribution can be viewed by plotting the distributions of the saccadic reaction times across the accumulation rate μ and the decision threshold θ (Fig. 9B). Reduction of accumulation rate μ in the model corresponds to reduction of the luminance contrast of the target. The overall pattern matches very well with the behavioral data. The distribution of the simulated saccadic reaction times when the decision threshold θ is high (Fig. 9B, θ = 50) resembles that of the normal hemifield (Fig. 8B,C); as the accumulation rate μ is reduced, the distribution becomes wider and the median saccadic reaction time becomes longer. Conversely, the distribution of the simulated saccadic reaction times when the decision threshold θ is low (Fig. 9B, θ = 20) resembles that of the affected hemifield; the width of the distribution is rather insensitive to reductions in the accumulation rate μ.
Estimation of decision threshold by the modified diffusion model
These observations were confirmed quantitatively by fitting behavioral data with simulated data (for details, see Material and Methods). Briefly, the distribution of the saccadic reaction times was classified into six quantile bins (Fig. 10A, vertical lines), and the number of trials in each bin was calculated for success trials (Fig. 10A, top) and for error trials (Fig. 10A, bottom). The same procedure was done for the simulated data with three parameters (Fig. 10A, dotted lines). The χ2 statistics were calculated for each behavioral data- simulated data pair. The simulated data with the smallest χ2 statistics were selected as the best-fitted data. From the best-fitted data (Fig. 10A, dotted lines), three parameters were obtained. Fitting was done separately for each monkey and for each hemifield. Because saccadic targets with different luminance conditions were presented randomly, making it impossible for the monkeys to adjust decision threshold for each trial category independently, the decision threshold θ was held constant across the different trial categories (that reflect different luminance contrasts) within each monkey and each hemifield. The nondecision component Tr was also held constant in the same manner as the decision threshold θ. The only parameter that changed across trial categories within each hemifield was the accumulation rate μ. The goodness of fit was evaluated by plotting the number of trials in the six quantile bins for behavioral data against that for the best-fitted data (Fig. 10B). The Pearson's correlation coefficient between the number of trials in the bins for the behavioral data and that for the best-fitted data were 0.89 and was statistically significant (p < 10−9; df = 118). The best-fitted values for the decision threshold θ and the accumulation rate μ were plotted against one another (Fig. 10C). In both monkeys, the decision threshold θ was significantly lower in the saccades to the affected hemifield than those to the normal hemifield (likelihood ratio test; χ12 = 7693, p < 10−9 for monkey T; χ12 = 11,292, p < 10−9 for monkey A). These results suggest that V1 lesion lowered the decision threshold for saccade initiation to the affected hemifield. The accumulation rate μ became smaller as the luminance contrast of the target for the condition decreased. The nondecision component Tr was consistently shorter in the normal hemifield than in the affected hemifield (118 vs 140 ms in monkey T; 92 vs 134 ms in monkey A). When the decision threshold θ was varied across different trial categories in the fitting procedure, the decision threshold θ was consistently lower in the affected hemifield than in the normal hemifield (supplemental Fig. 7S, available at www.jneurosci.org as supplemental material). For detail, see supplemental Results (available at www.jneurosci.org as supplemental material).
Discussion
In this study, we made unilateral lesions in V1 of macaque monkeys (Fig. 1) and used a visually guided saccade task with saccadic targets in various possible positions and various luminance contrasts to examine residual visuomotor processing. We confirmed that the monkeys had residual vision (Fig. 2), that their sensitivity to the luminance contrast of the targets was reduced (Fig. 3), and that their accuracy in saccadic end points was reduced (Fig. 2). Then we compared the saccades to the affected hemifield with those to the near-threshold stimuli in the normal hemifield and found that the accuracy was worse than those to the near-threshold stimuli (Fig. 5). Together with the results of saccades to the spatially smoothed targets (supplemental Fig. 6S, available at www.jneurosci.org as supplemental material), these results suggest that inaccurate saccades to the affected hemifield cannot be explained simply by insufficient visual information. We also found that the variability in the initial direction of the saccades to the affected hemifield was similar to that in the end points of the saccades (Fig. 6). Conversely, in the normal hemifield, there was significant reduction in the variability in the end points of the saccades compared with that of the initial direction of the saccades. These results suggest that V1 lesions affect the neural mechanisms, which compensate for variation in the initial direction of the saccades, responsible for accurate saccadic end points. We also found that the distributions of saccadic reaction times were consistently narrower for the saccades to the affected hemifield than for those to the normal hemifield (Fig. 8). Computational modeling of these distributions revealed lowered decision thresholds for the initiation of saccades to the affected hemifield (Figs. 9, 10). Together, these results suggest that the behavioral effects of V1 lesions are not limited to vision but also encompass the various stages of visuomotor processing, including the saccade control system and decision processes (Fig. 11). We propose that these results reflect deficits in deliberate control of visual–oculomotor processing after V1 lesions, which may parallel loss of visual awareness in human blindsight patients.
Figure 11.

A summary of the current study. A, A simplified scheme illustrating the potential circuits responsible for residual visual–oculomotor processing after V1 lesion. sSC, The superficial layer of the superior colliculus; dSC, the deeper layer of the superior colliculus. B, V1 lesions affected various stages of visual–oculomotor processing, not only visual processing but also the decision process and saccadic control, as indicated by open arrows.
Effect of V1 lesion on saccadic eye movement: previous studies
The cerebral cortex plays an important role in visually guided saccades (Pierrot-Deseilligny et al., 1991). Most neuropsychological studies have focused on damage in the frontal or parietal cortex (Leigh and Kennard, 2004). Conversely, current knowledge about the impairment of saccadic eye movements in patients with cortical damage including early visual cortices is sparse and rare (Barton, 2001; Leigh and Kennard, 2004). One of the exceptions is a study that examined saccades to auditory targets in patients suffering from hemianopia attributable to occipital lesions (Traccis et al., 1991). This result implies that occipital lesions influence a common mechanism of saccade control used for visual and auditory targets.
In monkey studies, residual visuomotor processing after V1 lesions was permanently lost after an additional lesion of the superior colliculus (Mohler and Wurtz, 1977). These and other findings from human studies (Rafal et al., 1990; Morris et al., 2001) suggest that the residual visual–oculomotor processing is mediated by the pathways that bypass V1, possibly through the retinotectal pathway (Fig. 11A) (Isa, 2002). Because V1 lesion may induce reorganization in brain circuit, residual vision may reflect either the intact retinotectal pathway or reorganized one. However, the aim of current study is not to reveal the function of intact retinocollicular pathway but to investigate what change is associated with the residual visuomotor processing after the lesion. Thus, we did not discriminate these two possibilities in this paper. The contribution of extrastriate cortices to residual vision is essentially unknown. However, there may be a possibility that variation in visual deficits between the two monkeys in the current study is attributable to the degree of additional damage in V2 and V3.
Electrical microstimulation to V1 evokes saccadic eye movements in monkeys (Schiller, 1972, 1977; Tehovnik et al., 2003). These movements are thought to be triggered by phosphene induction (Bradley et al., 2005; Tehovnik et al., 2005), via the direct striate–collicular pathway (Schiller, 1977; Tehovnik et al., 2003). One possible explanation for our findings that V1 lesions affect saccadic control and decision may be that V1 lesions eliminate the striate–collicular input to the superior colliculus, thus affecting the activity of the superior colliculus.
Control of saccades
Figure 6 indicates that difference in scatter of end points between hemifields cannot be explained by that of variability in initial directions. This suggests that the difference in the end points emerges not at the time of motor planning but during saccade execution, which is unlikely to be influenced by voluntary control or strategic factors.
Duration of saccadic eye movements is so short that visual feedback is too slow for on-line trajectory control. Various studies showed that internal monitoring or corollary discharge of saccadic commands is used for on-line trajectory control (Guthrie et al., 1983; Duhamel et al., 1992; Sommer and Wurtz, 2002). On-line compensation for deviations from the desired trajectory of saccades has been investigated in human and monkey studies (Becker and Jurgens, 1990; Quaia et al., 2000). Such compensatory mechanisms require sensory feedback to calculate error between the desired and executed trajectory for off-line calibration of the model (Wolpert et al., 1995; Chen-Harris et al., 2008). Because it is unlikely that V1 is involved in fast on-line trajectory control, our interpretation of the current results is that the pathway involving V1 contributes to off-line calibration of the compensatory mechanisms.
Currently, the underlying neural mechanism for compensation is not fully understood, but the superior colliculus and the cerebellum are thought to be involved in the process (Quaia et al., 1999). Reversible inactivation of the superior colliculus by muscimol produces curved saccades in monkey (Aizawa and Wurtz, 1998; Quaia et al., 1998). Ablation or reversible cooling of V1 affects firing properties of the superior colliculus neurons (Schiller et al., 1974; Mohler and Wurtz, 1977). These studies support the view that the effect of V1 lesion on saccade trajectory may be through effects on the activity of the superior colliculus.
In the current study, we focused our analyses on the directional component of saccades, which was relevant to the compensation of the initial direction errors. The polar component of saccades has to be analyzed in conjunction with the analysis of the velocity and duration of saccades, which will be dealt with in a separate study.
Decision process
Analyses based on the diffusion model revealed that the decision threshold for initiation of saccades was lower in saccades to the affected hemifield than those to the normal hemifield. This suggests that the monkeys with V1 lesions did not wait for the accumulation of sufficient amount of sensory evidence to initiate saccades to the affected hemifield. Because the same monkeys initiated saccades to the normal hemifield with higher decision thresholds in the same sessions (see also supplemental Results, available at www.jneurosci.org as supplemental material), the lowered decision threshold cannot be explained by on-line voluntary control of strategy. We can describe the monkeys' behavioral changes after V1 lesion as a change to an indeliberate decision. In human blindsight patients, residual visuomotor processing was observed when they were asked to act by guessing (Weiskrantz et al., 1974). Then, it is conceivable that saccadic localization of the monkeys was also made by guessing without visual awareness. If so, then the monkeys may rely more on the offset of the fixation point and less on accumulation of sensory evidence, which may explain lower decision threshold.
Our finding concerning the decision of saccade initiation can be extended to decision processes in general. Blindsight patients exhibit dissociation between the performance in forced-choice discrimination and in yes–no detection (Azzopardi and Cowey, 1997, 1998), which may, to some extent, reflect an abnormal decision process (Campion et al., 1983; Lau, 2008). Analysis based on the signal detection theory revealed that human blindsight patients have difficulty in setting and maintaining criterion level in yes–no detection, which does not occur in forced-choice discrimination (Azzopardi and Cowey, 1997, 1998). Such dissociation may arise from the common mechanisms that were found in the current study, that is, reduction of decision threshold in the forced-choice task.
Implication for blindsight
One of the controversies concerning blindsight is whether it is a form of near-threshold vision or qualitatively different from normal vision (Campion et al., 1983; Azzopardi and Cowey, 1997). Our study provides some clues to the question. We compared the saccades toward targets in the affected hemifield with those toward targets with weak, near-threshold luminance in the normal hemifield, which are “equally difficult to see,” in terms of target localization. Our results showed that visual–oculomotor processing with and without V1 may be qualitatively different at various stages, from vision and decision making to saccade control. These results suggest that the residual visuomotor processing of monkeys with V1 lesion is unlike normal, near-threshold vision. Effects of V1 lesions on saccadic control and decision found in the current study may reflect qualitative difference in visual awareness, which is also induced by V1 lesion.
Footnotes
This work was supported by Ministry of Education, Culture, Sports, Science, and Technology of Japan Grant-in-Aid for Scientific Research Grants 18500317 and 18019038 (M.Y.) and the Core Research for Evolutional Science and Technology and the Japan Science and Technology Agency (T.I.). We are grateful to Shuko Kumagaya for technical assistance, Douglas Munoz and Tadashi Ogawa for comments on a previous version of this manuscript, and the members in the behavioral development laboratory for discussion.
References
- Aizawa H, Wurtz RH. Reversible inactivation of monkey superior colliculus. I. Curvature of saccadic trajectory. J Neurophysiol. 1998;79:2082–2096. doi: 10.1152/jn.1998.79.4.2082. [DOI] [PubMed] [Google Scholar]
- Azzopardi P, Cowey A. Is blindsight like normal, near-threshold vision? Proc Natl Acad Sci USA. 1997;94:14190–14194. doi: 10.1073/pnas.94.25.14190. [DOI] [PMC free article] [PubMed] [Google Scholar]
- Azzopardi P, Cowey A. Blindsight and visual awareness. Conscious Cogn. 1998;7:292–311. doi: 10.1006/ccog.1998.0358. [DOI] [PubMed] [Google Scholar]
- Barton JJS. Brain damage and eye movements. In: Behrmann M, editor. Handbook of neuropsychology. Ed 2. Amsterdam: Elsevier; 2001. pp. 15–44. [Google Scholar]
- Becker W, Jürgens R. Human oblique saccades: quantitative analysis of the relation between horizontal and vertical components. Vision Res. 1990;30:893–920. doi: 10.1016/0042-6989(90)90057-r. [DOI] [PubMed] [Google Scholar]
- Block N. Two neural correlates of consciousness. Trends Cogn Sci. 2005;9:46–52. doi: 10.1016/j.tics.2004.12.006. [DOI] [PubMed] [Google Scholar]
- Bradley DC, Troyk PR, Berg JA, Bak M, Cogan S, Erickson R, Kufta C, Mascaro M, McCreery D, Schmidt EM, Towle VL, Xu H. Visuotopic mapping through a multichannel stimulating implant in primate V1. J Neurophysiol. 2005;93:1659–1670. doi: 10.1152/jn.01213.2003. [DOI] [PubMed] [Google Scholar]
- Campion J, Latto R, Smith YM. Is blindsight an effect of scattered light, spared cortex and near-threshold vision? Behav Brain Sci. 1983;3:423–486. [Google Scholar]
- Carpenter RH, Reddi BA. Reply to “Putting noise into neurophysiological models of simple decision making.”. Nat Neurosci. 2001;4:337. doi: 10.1038/85956. [DOI] [PubMed] [Google Scholar]
- Carpenter RH, Williams ML. Neural computation of log likelihood in control of saccadic eye movements. Nature. 1995;377:59–62. doi: 10.1038/377059a0. [DOI] [PubMed] [Google Scholar]
- Chalmers D. The conscious mind. Oxford: Oxford UP; 1996. [Google Scholar]
- Chen-Harris H, Joiner WM, Ethier V, Zee DS, Shadmehr R. Adaptive control of saccades via internal feedback. J Neurosci. 2008;28:2804–2813. doi: 10.1523/JNEUROSCI.5300-07.2008. [DOI] [PMC free article] [PubMed] [Google Scholar]
- Cowey A, Stoerig P. Stimulus cueing in blindsight. Prog Brain Res. 2004;144:261–277. doi: 10.1016/S0079-6123(03)14418-4. [DOI] [PubMed] [Google Scholar]
- Daniel PM, Whitteridge D. The representation of the visual field on the cerebral cortex in monkeys. J Physiol. 1961;159:203–221. doi: 10.1113/jphysiol.1961.sp006803. [DOI] [PMC free article] [PubMed] [Google Scholar]
- Dennett D. Consciousness explained. Boston: Little, Brown; 1991. [Google Scholar]
- Dorris MC, Paré M, Munoz DP. Neuronal activity in monkey superior colliculus related to the initiation of saccadic eye movements. J Neurosci. 1997;17:8566–8579. doi: 10.1523/JNEUROSCI.17-21-08566.1997. [DOI] [PMC free article] [PubMed] [Google Scholar]
- Duhamel JR, Goldberg ME, Fitzgibbon EJ, Sirigu A, Grafman J. Saccadic dysmetria in a patient with a right frontoparietal lesion. The importance of corollary discharge for accurate spatial behaviour. Brain. 1992;115:1387–1402. doi: 10.1093/brain/115.5.1387. [DOI] [PubMed] [Google Scholar]
- Fendrich R, Wessinger CM, Gazzaniga MS. Residual vision in a scotoma: implications for blindsight. Science. 1992;258:1489–1491. doi: 10.1126/science.1439839. [DOI] [PubMed] [Google Scholar]
- Gattass R, Gross CG, Sandell JH. Visual topography of V2 in the macaque. J Comp Neurol. 1981;201:519–539. doi: 10.1002/cne.902010405. [DOI] [PubMed] [Google Scholar]
- Gold JI, Shadlen MN. The neural basis of decision making. Annu Rev Neurosci. 2007;30:535–574. doi: 10.1146/annurev.neuro.29.051605.113038. [DOI] [PubMed] [Google Scholar]
- Gross CG, Moore T, Rodman HR. Visually guided behavior after V1 lesions in young and adult monkeys and its relation to blindsight in humans. Prog Brain Res. 2004;144:279–294. doi: 10.1016/S0079-6123(03)14419-6. [DOI] [PubMed] [Google Scholar]
- Guthrie BL, Porter JD, Sparks DL. Corollary discharge provides accurate eye position information to the oculomotor system. Science. 1983;221:1193–1195. doi: 10.1126/science.6612334. [DOI] [PubMed] [Google Scholar]
- Hanes DP, Schall JD. Neural control of voluntary movement initiation. Science. 1996;274:427–430. doi: 10.1126/science.274.5286.427. [DOI] [PubMed] [Google Scholar]
- Isa T. Intrinsic processing in the mammalian superior colliculus. Curr Opin Neurobiol. 2002;12:668–677. doi: 10.1016/s0959-4388(02)00387-2. [DOI] [PubMed] [Google Scholar]
- Judge SJ, Richmond BJ, Chu FC. Implantation of magnetic search coils for measurement of eye position: an improved method. Vision Res. 1980;20:535–538. doi: 10.1016/0042-6989(80)90128-5. [DOI] [PubMed] [Google Scholar]
- Kaas JH. Visual perception. Vision without awareness. Nature. 1995;373:195. doi: 10.1038/373195a0. [DOI] [PubMed] [Google Scholar]
- Kobayashi Y, Inoue Y, Yamamoto M, Isa T, Aizawa H. Contribution of pedunculopontine tegmental nucleus neurons to performance of visually guided saccade tasks in monkeys. J Neurophysiol. 2002;88:715–731. doi: 10.1152/jn.2002.88.2.715. [DOI] [PubMed] [Google Scholar]
- Komatsu H, Kinoshita M, Murakami I. Neural responses in the retinotopic representation of the blind spot in the macaque V1 to stimuli for perceptual filling-in. J Neurosci. 2000;20:9310–9319. doi: 10.1523/JNEUROSCI.20-24-09310.2000. [DOI] [PMC free article] [PubMed] [Google Scholar]
- Lamme VA. Towards a true neural stance on consciousness. Trends Cogn Sci. 2006;10:494–501. doi: 10.1016/j.tics.2006.09.001. [DOI] [PubMed] [Google Scholar]
- Lau HC. A higher-order Bayesian decision theory of perceptual consciousness. Prog Brain Res. 2008;168:35–48. doi: 10.1016/S0079-6123(07)68004-2. [DOI] [PubMed] [Google Scholar]
- Leigh RJ, Kennard C. Using saccades as a research tool in the clinical neurosciences. Brain. 2004;127:460–477. doi: 10.1093/brain/awh035. [DOI] [PubMed] [Google Scholar]
- McPeek RM, Han JH, Keller EL. Competition between saccade goals in the superior colliculus produces saccade curvature. J Neurophysiol. 2003;89:2577–2590. doi: 10.1152/jn.00657.2002. [DOI] [PubMed] [Google Scholar]
- Mohler CW, Wurtz RH. Role of striate cortex and superior colliculus in visual guidance of saccadic eye movements in monkeys. J Neurophysiol. 1977;40:74–94. doi: 10.1152/jn.1977.40.1.74. [DOI] [PubMed] [Google Scholar]
- Moore T, Rodman HR, Repp AB, Gross CG. Localization of visual stimuli after striate cortex damage in monkeys: parallels with human blindsight. Proc Natl Acad Sci U S A. 1995;92:8215–8218. doi: 10.1073/pnas.92.18.8215. [DOI] [PMC free article] [PubMed] [Google Scholar]
- Morris JS, DeGelder B, Weiskrantz L, Dolan RJ. Differential extrageniculostriate and amygdala responses to presentation of emotional faces in a cortically blind field. Brain. 2001;124:1241–1252. doi: 10.1093/brain/124.6.1241. [DOI] [PubMed] [Google Scholar]
- Murakami I, Komatsu H, Kinoshita M. Perceptual filling-in at the scotoma following a monocular retinal lesion in the monkey. Vis Neurosci. 1997;14:89–101. doi: 10.1017/s0952523800008798. [DOI] [PubMed] [Google Scholar]
- Nakahara H, Nakamura K, Hikosaka O. Extended LATER model can account for trial-by-trial variability of both pre- and post-processes. Neural Netw. 2006;19:1027–1046. doi: 10.1016/j.neunet.2006.07.001. [DOI] [PubMed] [Google Scholar]
- Palmer J, Huk AC, Shadlen MN. The effect of stimulus strength on the speed and accuracy of a perceptual decision. J Vis. 2005;5:376–404. doi: 10.1167/5.5.1. [DOI] [PubMed] [Google Scholar]
- Pierrot-Deseilligny C, Rivaud S, Gaymard B, Agid Y. Cortical control of memory-guided saccades in man. Exp Brain Res. 1991;83:607–617. doi: 10.1007/BF00229839. [DOI] [PubMed] [Google Scholar]
- Poppel E, Held R, Frost D. Residual visual function after brain wounds involving the central visual pathways in man. Nature. 1973;243:295–296. doi: 10.1038/243295a0. [DOI] [PubMed] [Google Scholar]
- Quaia C, Aizawa H, Optican LM, Wurtz RH. Reversible inactivation of monkey superior colliculus. II. Maps of saccadic deficits. J Neurophysiol. 1998;79:2097–2110. doi: 10.1152/jn.1998.79.4.2097. [DOI] [PubMed] [Google Scholar]
- Quaia C, Lefèvre P, Optican LM. Model of the control of saccades by superior colliculus and cerebellum. J Neurophysiol. 1999;82:999–1018. doi: 10.1152/jn.1999.82.2.999. [DOI] [PubMed] [Google Scholar]
- Quaia C, Paré M, Wurtz RH, Optican LM. Extent of compensation for variations in monkey saccadic eye movements. Exp Brain Res. 2000;132:39–51. doi: 10.1007/s002219900324. [DOI] [PubMed] [Google Scholar]
- Rafal R, Smith J, Krantz J, Cohen A, Brennan C. Extrageniculate vision in hemianopic humans: saccade inhibition by signals in the blind field. Science. 1990;250:118–121. doi: 10.1126/science.2218503. [DOI] [PubMed] [Google Scholar]
- Ratcliff R. A theory of memory retrieval. Psychol Rev. 1978;85:59–108. [Google Scholar]
- Ratcliff R. Putting noise into neurophysiological models of simple decision making. Nat Neurosci. 2001;4:336–337. doi: 10.1038/85956. [DOI] [PubMed] [Google Scholar]
- Ratcliff R, McKoon G. A counter model for implicit priming in perceptual word identification. Psychol Rev. 1997;104:319–343. doi: 10.1037/0033-295x.104.2.319. [DOI] [PubMed] [Google Scholar]
- Ratcliff R, Smith PL. A comparison of sequential sampling models for two-choice reaction time. Psychol Rev. 2004;111:333–367. doi: 10.1037/0033-295X.111.2.333. [DOI] [PMC free article] [PubMed] [Google Scholar]
- Ratcliff R, Tuerlinckx F. Estimating parameters of the diffusion model: approaches to dealing with contaminant reaction times and parameter variability. Psychon Bull Rev. 2002;9:438–481. doi: 10.3758/bf03196302. [DOI] [PMC free article] [PubMed] [Google Scholar]
- Ratcliff R, Cherian A, Segraves M. A comparison of macaque behavior and superior colliculus neuronal activity to predictions from models of two-choice decisions. J Neurophysiol. 2003;90:1392–1407. doi: 10.1152/jn.01049.2002. [DOI] [PubMed] [Google Scholar]
- Ratcliff R, Hasegawa YT, Hasegawa RP, Smith PL, Segraves MA. Dual diffusion model for single-cell recording data from the superior colliculus in a brightness-discrimination task. J Neurophysiol. 2007;97:1756–1774. doi: 10.1152/jn.00393.2006. [DOI] [PMC free article] [PubMed] [Google Scholar]
- Reddi BA, Carpenter RH. The influence of urgency on decision time. Nat Neurosci. 2000;3:827–830. doi: 10.1038/77739. [DOI] [PubMed] [Google Scholar]
- Robinson DA. A method of measuring eye movement using a scleral search coil in a magnetic field. IEEE Trans Biomed Eng. 1963;10:137–145. doi: 10.1109/tbmel.1963.4322822. [DOI] [PubMed] [Google Scholar]
- Sanders MD, Warrington EK, Marshall J, Wieskrantz L. “Blindsight”: vision in a field defect. Lancet. 1974;1:707–708. doi: 10.1016/s0140-6736(74)92907-9. [DOI] [PubMed] [Google Scholar]
- Schall JD, Thompson KG. Neural selection and control of visually guided eye movements. Annu Rev Neurosci. 1999;22:241–259. doi: 10.1146/annurev.neuro.22.1.241. [DOI] [PubMed] [Google Scholar]
- Schiller PH. The role of the monkey superior colliculus in eye movement and vision. Invest Ophthalmol. 1972;11:451–460. [PubMed] [Google Scholar]
- Schiller PH. The effect of superior colliculus ablation on saccades elicted by cortical stimulation. Brain Res. 1977;122:154–156. doi: 10.1016/0006-8993(77)90672-2. [DOI] [PubMed] [Google Scholar]
- Schiller PH, Stryker M, Cynader M, Berman N. Response characteristics of single cells in the monkey superior colliculus following ablation or cooling of visual cortex. J Neurophysiol. 1974;37:181–194. doi: 10.1152/jn.1974.37.1.181. [DOI] [PubMed] [Google Scholar]
- Segraves MA, Goldberg ME, Deng SY, Bruce CJ, Ungerleider LG, Mishkin M. The role of striate cortex in the guidance of eye movements in the monkey. J Neurosci. 1987;7:3040–3058. doi: 10.1523/JNEUROSCI.07-10-03040.1987. [DOI] [PMC free article] [PubMed] [Google Scholar]
- Sommer MA, Wurtz RH. A pathway in primate brain for internal monitoring of movements. Science. 2002;296:1480–1482. doi: 10.1126/science.1069590. [DOI] [PubMed] [Google Scholar]
- Supèr H, Spekreijse H, Lamme VA. Two distinct modes of sensory processing observed in monkey primary visual cortex (V1) Nat Neurosci. 2001;4:304–310. doi: 10.1038/85170. [DOI] [PubMed] [Google Scholar]
- Tehovnik EJ, Slocum WM, Schiller PH. Saccadic eye movements evoked by microstimulation of striate cortex. Eur J Neurosci. 2003;17:870–878. doi: 10.1046/j.1460-9568.2003.02489.x. [DOI] [PubMed] [Google Scholar]
- Tehovnik EJ, Slocum WM, Carvey CE, Schiller PH. Phosphene induction and the generation of saccadic eye movements by striate cortex. J Neurophysiol. 2005;93:1–19. doi: 10.1152/jn.00736.2004. [DOI] [PubMed] [Google Scholar]
- Traccis S, Puliga MV, Ruiu MC, Marras MA, Rosati G. Unilateral occipital lesion causing hemianopia affects the acoustic saccadic programming. Neurology. 1991;41:1633–1638. doi: 10.1212/wnl.41.10.1633. [DOI] [PubMed] [Google Scholar]
- Van Essen DC, Newsome WT, Maunsell JH. The visual field representation in striate cortex of the macaque monkey: asymmetries, anisotropies, and individual variability. Vision Res. 1984;24:429–448. doi: 10.1016/0042-6989(84)90041-5. [DOI] [PubMed] [Google Scholar]
- Watanabe M, Kobayashi Y, Inoue Y, Isa T. Effects of local nicotinic activation of the superior colliculus on saccades in monkeys. J Neurophysiol. 2005;93:519–534. doi: 10.1152/jn.00558.2004. [DOI] [PubMed] [Google Scholar]
- Weiskrantz L, Warrington EK, Sanders MD, Marshall J. Visual capacity in the hemianopic field following a restricted occipital ablation. Brain. 1974;97:709–728. doi: 10.1093/brain/97.1.709. [DOI] [PubMed] [Google Scholar]
- Wolpert DM, Ghahramani Z, Jordan MI. An internal model for sensorimotor integration. Science. 1995;269:1880–1882. doi: 10.1126/science.7569931. [DOI] [PubMed] [Google Scholar]