

Abstract
Gamma (γ) oscillation, a hallmark of cortical activity during sensory processing and cognition, occurs during persistent, self-sustained activity or “UP” states, which are thought to be maintained by recurrent synaptic inputs to pyramidal cells. During neocortical “UP” states, excitatory regular spiking (RS) (pyramidal) cells and inhibitory fast spiking (FS) (basket) cells fire with distinct phase distributions relative to the γ oscillation in the local field potential. Evidence suggests that γ-modulated RS → FS input serves to synchronize the interneurons and hence to generate γ-modulated FS → RS drive. How RS → RS recurrent input shapes both self-sustained activity and γ-modulated phasic firing, although, is unclear. Here, we investigate this by reconstructing γ-modulated synaptic input to RS cells using the conductance injection (dynamic clamp) technique in cortical slices. We find that, to show lifelike γ-modulated firing, RS cells require strongly γ-modulated, low-latency inhibitory inputs from FS cells but little or no γ-modulation from recurrent RS → RS connections. We suggest that this demodulation of recurrent excitation, compared with inhibition, reflects several possible effects, including distributed propagation delays and integration of excitation over wider areas of cortex, and maximizes the capacity for representing information by the timing of recurrent excitation.
Keywords: conductance injection, dynamic clamp, local field potential, regular-spiking, fast-spiking, synchronization
Introduction
Gamma (γ) oscillations, in the frequency range 30–80 Hz, are a prominent form of synchronization in the awake cortex and are widely believed to play a role in various neurocognitive functions, including feature binding, selective attention, and consciousness. The phasic activity of principal neurons associated with γ is thought to indicate the possibility of spike-time coding by individual cells relative to the γ“clock” signal of the average activity in the surrounding network. Many studies have established that γ oscillations can be maintained by local, recurrent neuronal interactions (Csicsvari et al., 2003; Traub et al., 2004), in which chemical and electrical interactions between interneurons (Buzsaki and Chrobak, 1995; Wang and Buzsaki, 1996; Penttonen et al., 1998; Deans et al., 2001; Hormuzdi et al., 2001; Galarreta and Hestrin, 2002; Gibson et al., 2005), the intrinsic γ-frequency threshold firing frequency of interneurons (Tateno et al., 2004), and cooperative drive of interneurons by principal cells (Whittington et al., 1995; Wang and Buzsaki, 1996; Buhl et al., 1998; Fisahn et al., 1998; Penttonen et al., 1998; Mann et al., 2005) are thought to be important. Self-sustained activity in the cortex, or the “UP” state (Steriade et al., 1993; Cowan and Wilson, 1994; Goldman-Rakic, 1995; Quintana and Fuster, 1999; Wang, 2001; Amit and Mongillo, 2003; Shu et al., 2003; Hasenstaub et al., 2005), is thought to be maintained by recurrent excitation between excitatory cells, balanced with recurrent inhibition via interneurons (Sanchez-Vives and McCormick, 2000; Shu et al., 2003; Haider et al., 2006), and has been shown recently to be accompanied by γ oscillations in vivo (Hasenstaub et al., 2005). However, so far, relatively little is known about the function of excitatory reverberation among pyramidal cells in the formation of the γ rhythm. From the perspective of coding or information representation, it is important to determine whether recurrent excitatory interactions between the principal cells directly influence the timing of the γ rhythm through recurrent excitation or whether the γ clock signal can be relatively independent of different patterns of recurrent excitation. Attempts have been made to measure inhibitory and excitatory fractions of synaptic input during γ oscillations, by voltage clamping the soma to depolarized or hyperpolarized membrane potentials. However, this approach suffers from the impossibility of spatial control of the membrane potential by the voltage clamp and precludes simultaneous observation of the response of the cell to particular patterns of synaptic input. Here, using recent in vivo measurements for the distributions of firing phase in the major cell groups that are responsible for γ, the regular-spiking (RS) (principal excitatory), and fast-spiking (FS) (inhibitory) cells, we have studied how principal cells integrate conductance stimuli that mimic γ-modulated population synaptic input. We find that, to reproduce lifelike γ-modulated firing, RS cells require strongly γ-modulated low-latency inhibitory inputs from FS cells but little or no γ-modulation from recurrent RS → RS connections. This demodulation of the recurrent excitatory signal probably reflects several characteristics of recurrent excitation, including distributed propagation delays and widespread divergence of local excitatory projections. We suggest that this leads to a high capacity for representing information through the timing of recurrent excitatory inputs but minimizes their impact on γ rhythm timing.
Materials and Methods
Electrophysiology.
Three hundred micrometer slices of somatosensory cortex were prepared from postnatal days 14 to 26 Wistar rats (killed according to United Kingdom Home Office guidelines) in chilled solution composed of the following (in mm): 125 NaCl, 25 NaHCO3, 2.5 KCl, 1.25 NaH2PO4, 2 CaCl2, 1 MgCl2, and 25 glucose (oxygenated with 95% O2, 5% CO2). Slices were held at room temperature for at least 30 min before recording and perfused with oxygenated slicing solution at 30–33°C during recording. Whole-cell recordings were made from the somata of neurons in cortical layers 2/3. Cells were identified as RS cells based on their pyramidal shape, capability for low-frequency firing (<10 Hz), and frequency adaptation. RS cells had input conductance of 4.98 ± 1.99 nS and spike width (measured at −30 mV) of 4.30 ± 1.37 ms (n = 37). Patch pipettes of 5–10 MΩ resistance were filled with a solution containing the following (in mm): 105 K-gluconate, 30 KCl, 10 HEPES, 10 phosphocreatine, 4 ATP, and 0.3 GTP, adjusted to pH 7.35. Current-clamp recordings were performed using a Multiclamp 700B (Molecular Devices, Union City, CA). Membrane potentials, including stated reversal potentials for injected conductances, were corrected afterward for the pre-nulling of the liquid junction potential (10 mV). Series resistances were in the range 10–20 MΩ and were measured and compensated for by the Auto Bridge Balance function of the Multiclamp 700B. Signals were filtered at 6–10 kHz (Bessel), sampled at 20 kHz with 16-bit resolution, and recorded with custom software written in Matlab (MathWorks, Natick, MA).
Conductance injection.
Recorded neurons were stimulated using conductance injection (Robinson and Kawai, 1993). A conductance injection amplifier (SM-1) or software running on a DSP analog board (SM-2; Cambridge Conductance, Cambridge, UK) implemented multiplication of the conductance command signal and the real-time value of the driving force, with a response time of <200 ns (SM-1) or <25 μs (SM-2), to produce the current command signal. Voltage dependence of NMDA current was simulated by multiplying the command signal by an additional factor (1 + 0.33[Mg2+]exp(−0.06V))−1 (Harsch and Robinson, 2000), where V is the membrane potential and [Mg2+] is the extracellular magnesium concentration set to either 1 or 0.5 mm. The reversal potentials EAMPA, ENMDA, and EGABA were set to 0, 0, and −70 mV, respectively.
Stimulus protocol.
A total of 25 (for time-varying γ) or 20 (periodic γ) seconds of γ-modulated conductance waveforms were calculated for each type of stimulus. Each γ-modulated stimulus was divided into five segments. Individual sweeps consisted of 5–7 s of stimulus, with data from the initial 1–2 s discarded to eliminate transient onset responses. Twenty to 30 s interval between sweeps was allowed for recovery. For experiments in which a parameter was varied systematically (e.g., degree of γ modulation), we used both increasing and decreasing orders and confirmed that there was no difference. During intervals between sweeps, we applied an adaptive background holding current (time constant, 100 ms) to keep the resting membrane potential at a constant level, usually −75 mV. This current was fixed for the duration of each stimulus.
Data analysis.
The occurrence of spikes was defined by a positive crossing of a threshold potential, usually −40 mV. Data from several cells were pooled to calculate histograms: 4 cells in Figure 2B, 14 cells in Figure 2D, 10 cells in Figure 2E, 5 cells in Figure 3C, 8 cells in Figure 4, 8 cells in Figure 5, and 2 cells in Figure 8. Figure 7 uses data from one cell. Spiking probability during the gamma period was expressed as an instantaneous firing frequency, by dividing the total number of spikes generated during each bin of the histogram by the total corresponding time period (bin width × number of neurons × number of trials × number of periods). “Mean phase” and “sharpness” of the distributions (see Figs. 4, 8) were defined as follows. For each bin whose normalized phase is x (0 ≤ x ≤ 1) and instantaneous firing frequency is fx (Hz), we constructed a two-dimensional vector (fx cos2πx, fx sin2πx). These vectors were then summed and normalized to the average of the instantaneous firing frequency. From this, we obtained the average vector
 |
where y (0 ≤ y < 1) and z were defined as the mean phase and the sharpness of the distribution (histogram), respectively.
Figure 2.

Stimulation of RS cells by γ-modulated (40 Hz) simulated synaptic conductances. Aa, Densities of simulated presynaptic RS (red) and FS (blue) spikes, tandem repeats of those shown in Figure 1C. b, AMPA (red), GABA (blue), and voltage-dependently blocked NMDA (orange) conductances. c, Recorded membrane potential response of an RS cell to the conductances shown in b. B, Histograms showing spike rate (instantaneous firing frequency, see Materials and Methods) phase distributions (over a single γ period of 25 ms) of RS cell spikes, resulting from the stimulus shown in Ab. γ-Modulated excitation and inhibition (a), γ excitation and constant inhibition (b), and γ inhibition and constant excitation (c). Dashed lines indicate presynaptic γ-modulated RS (red) and FS (blue) spike densities. C, D, As for A and B but with stochastic unitary inputs (i.e., constant inputs become stationary Poisson inputs). E, Spike rate phase distributions of RS cells in response to injection of mixtures of stationary and γ-modulated stochastic excitatory and inhibitory conductances. Solid lines indicate AMPA and GABA receptor conductances ensemble averaged over periods.
Figure 3.
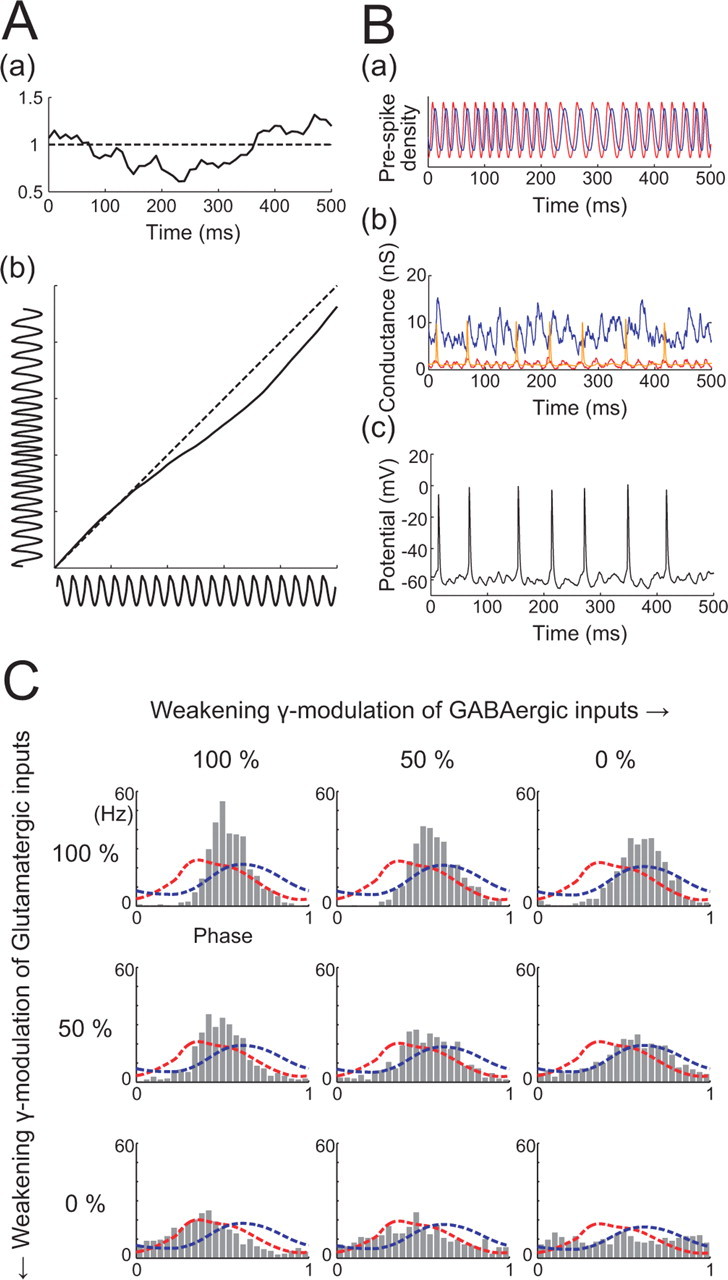
Time-varying γ oscillation frequency. Aa, An example OU process with mean of 1, SD of ¼, and time constant of 250 ms. b, Solid line is the integral of the OU process shown in a and maps the phase of a periodic spike density (horizontal trace) into one with a fluctuating period (vertical trace). Ba, Resulting densities of presynaptic RS (red) and FS (blue) spikes with a time-varying γ oscillation. b, Corresponding AMPA (red), GABA (blue), and NMDA (orange) receptor conductances. c, Membrane potential response of an RS cell to injection of conductances shown in b. C, Spike phase distributions of RS cells in response to injection of mixtures of stationary and time-varying γ-modulated stochastic excitatory and inhibitory conductances. Spike phase is normalized to the time-varying γ period.
Figure 4.

Quantitative comparison of spike phase distribution shape under different regimens of stimulation. Each panel compares nonstochastic 40 Hz γ stimulation (compare Fig. 2A,B), stochastic γ stimulation (compare Fig. 2C,D), and time-varying γ stochastic stimulation (Fig. 3). Mean (A) and sharpness (B) (see Materials and Methods) of the spike phase distributions of RS cells receiving both γ-modulated excitation and inhibition (a), γ-modulated excitation and stationary inhibition (b), and stationary excitation and γ-modulated inhibition (c). Error bars indicate average ± SD over nine cells. Dashed horizontal lines indicate the mean (A) and the sharpness (B) of the in vivo RS spike phase distribution used as the presynaptic spike density to synthesizing conductances (Fig. 1C).
Figure 5.

Effects of distributed delay in recurrent inputs on the postsynaptic RS spike phase distribution. Panels in the leftmost column show how a distribution of delays (indicated in green) of recurrent excitation affects the shape of the γ-modulated AMPA conductance (red solid lines), injected into RS cells. Panels in the top row show how delays in recurrent inhibition affect the shape of the total inhibitory conductance (blue solid lines). Numbers in milliseconds indicate the means of the delay distributions, which are the positive parts of Gaussians with SDs of 4, 8, 12, and 16 (ms). Histograms show the spike phase distributions of RS cells with the corresponding distribution of delays in excitation and inhibition. Dashed lines indicate the presynaptic RS (red) and FS (blue) spike phase distributions.
Figure 8.
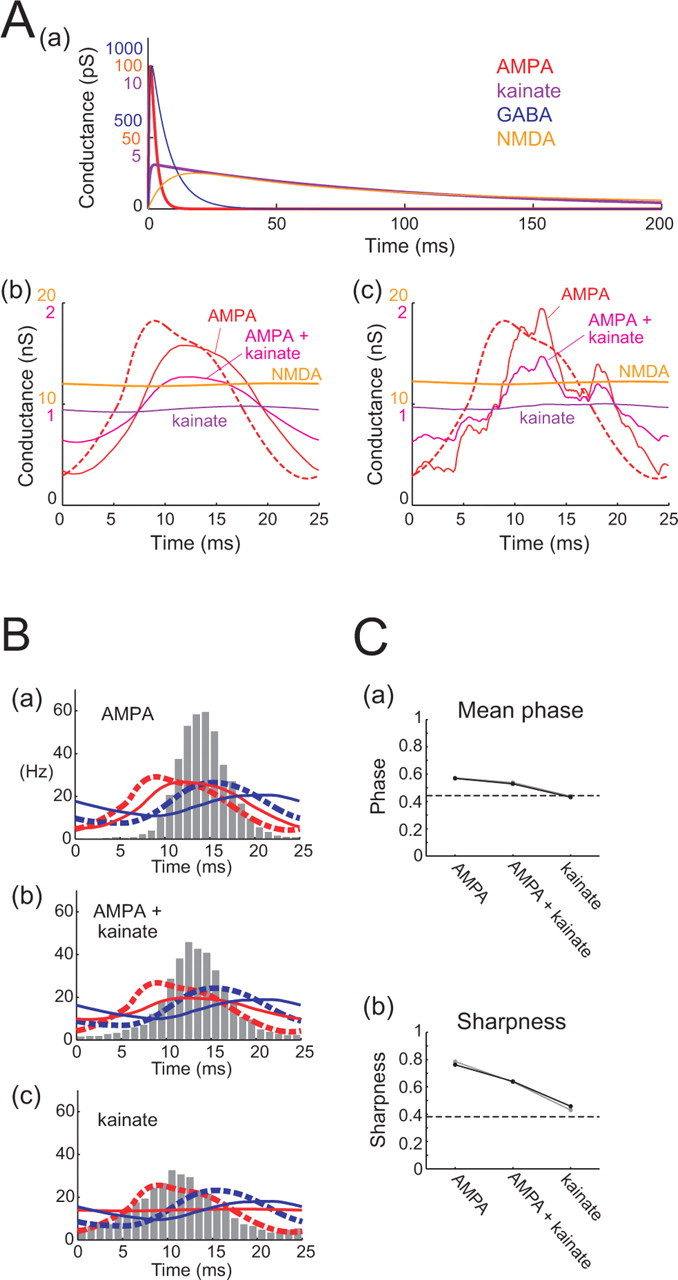
Possible effects of KAR-mediated excitatory conductance. Aa, Waveforms of the unitary conductances. Three scales on the vertical axis: blue, GABA; red, AMPA and NMDA; purple, kainate. In one of the two cells tested, all unitary conductances were scaled by a factor of 1.4. b, c, Simulated non-NMDA and unblocked NMDA conductance over a single γ period, stochastically generated according to the in vivo γ-modulated RS spike density (red dashed lines) at 4000 Hz. Three cases of non-NMDA conductance are drawn: AMPA receptor-mediated conductance (red), 50:50 mixture of AMPA receptor-mediated and KAR-mediated conductances (magenta), and purely KAR-mediated conductance (purple). b, Conductance waveforms averaged over γ cycles; c, one period of stochastically stimulated waveforms. Two scales on the vertical axis: orange, unblocked NMDA; red, AMPA and/or kainate. B, Histograms showing spike rate phase distributions of RS cell spikes. Three different cases of non-NMDA conductance were tested: a, AMPA receptor-mediated conductance only; b, mixture of AMPA receptor-mediated and KAR-mediated conductances; c, KAR-mediated conductance only. Dashed lines indicate presynaptic γ-modulated RS (red) and FS (blue) spike densities. Solid lines indicate non-NMDA excitatory conductance (red) and GABAergic conductance (blue). C, Mean (a) and sharpness (b) (as in Fig. 4) of the spike phase distributions of RS cells receiving different combinations of non-NMDA conductance, as indicated. Dashed horizontal lines indicate corresponding values of the in vivo RS spike phase distribution, used as the presynaptic spike density for synthesizing conductances. Results from two different cells are indicated by black and gray lines.
Figure 7.
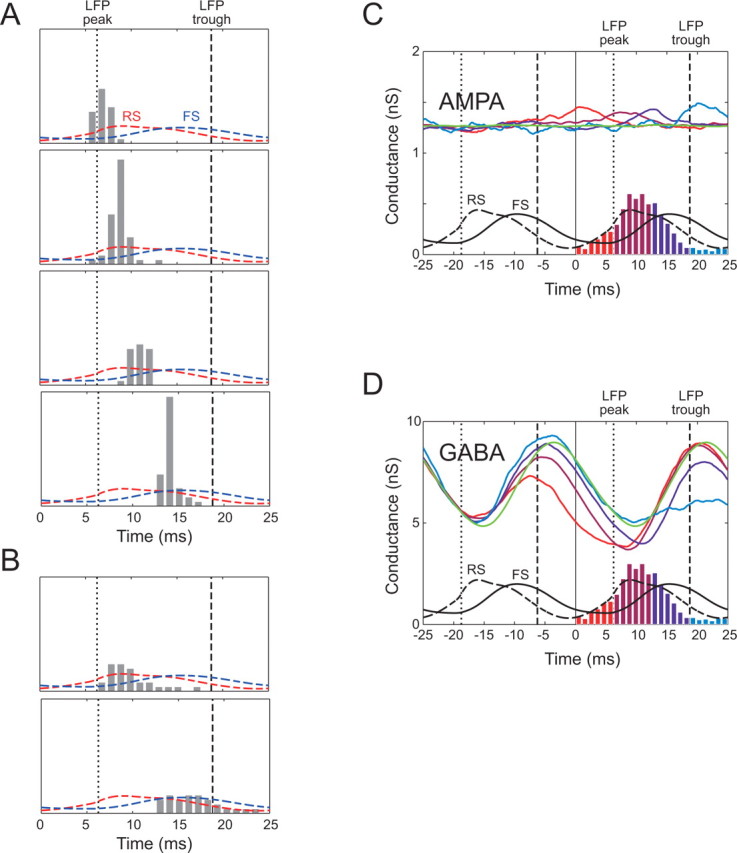
Gamma phase encoding of synaptic input. A, Four different examples of precise spike time distributions in response to repeated trials using identical stochastic instances of γ-modulated GABA conductance and Poisson glutamatergic conductances (data not shown). B, Two other instances in which spike timing was less reliable. C, Reverse correlation of the AMPA input with spikes drawn from different regions of the spike density distribution (color-coded, green indicates average for all spikes in the distribution). On average, spikes are associated with only small rises in AMPA conductance. D, Reverse correlation of the GABA input. Strong decreases in GABA input are linked to subsequent spiking.
Numerical simulations.
Simulations were performed in the simulation program NEURON version 5.8 (Hines and Carnevale, 1997). A layer 2/3 neocortical pyramidal cell model (Mainen et al., 1995) was obtained from the NEURON computational neuroscience model archive (see Fig. 6A). This compartmental model of a spatially extended neuron, with active currents and uniform passive electrical structure, included channels described by four voltage-dependent currents: fast (Hodgkin–Huxley style kinetics) Na+ (INa), fast K+ (IKv), slow, non-inactivating muscarinic K+ (IKm), and high-threshold Ca2+ (ICa), as well as one Ca2+-dependent potassium current (IKCa). There was a low density of Na+ channels in the soma and dendrites but a high density in the axon hillock and initial segment. IKv was present in the soma but absent in the dendrites, and IKm, ICa,, and IKCa were in both soma and dendrites. A first-order calcium pump was used for calculating the internal calcium concentration. Dendritic spines were taken into account by an increased dendritic membrane area of 0.83 μm2 per linear micrometer of dendrite. An “axon” consisting of a tapering conical hillock (10 μm long) connected by a cylindrical initial segment (15 μm) to five myelinated internodes separated by nodal segments (100 μm) was attached to the soma. Specific membrane capacitance was 0.75 μF cm−2, except in myelinated axon segments, where it was 0.02 μF cm−2, and specific membrane resistance was 30 kΩ-cm2, except for axon node segments, where it was 50 Ω-cm2. Specific axial resistance was 150 Ω-cm. The resting membrane potential and passive channel reversal potential were −70 mV, and reversal potentials ENa, EK, and ECa were 60, −90, and 140 mV, respectively. We adjusted channel densities (the parameters of the Mainen and Sejnowski model) to produce similar shapes and frequencies of firing as in the experimental cells. Values of channel densities are given in Tables 1 and 2 for active and passive dendrite models, respectively. Unitary synaptic inputs were exactly as used in the experiments, and 1000 AMPA/NMDA synapses and 100 GABA synapses were either concentrated at the soma or distributed evenly over the soma and dendrites.
Figure 6.
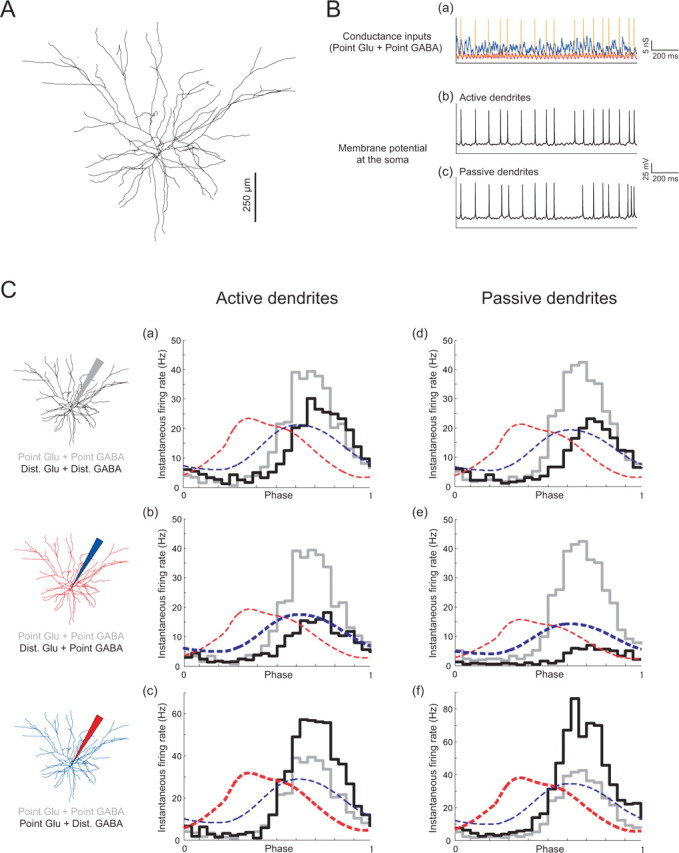
Comparison of point and distributed synaptic input in a numerical model of a layer 2/3 pyramidal cell. A, Morphology of the compartmental model (see Materials and Methods). Ba, Example stochastic γ-modulated point conductance input. The NMDA conductance is voltage dependent and thus shows spike transients. Example responses, with active (b) or passive (c) dendrites (see Tables 1, 2). C, Spike density distributions produced by different locations of excitation and inhibition, for active (a–c) and passive (d–f) dendrites, as indicated diagrammatically at the left, and also highlighted by the thickness of the red or blue traces showing presynaptic spike densities. In each case, the response to point somatic input of excitation and inhibition (corresponding to the experiments) is shown in gray.
Table 1.
Channel densities for active dendrite simulations
| Conductance (pS μm−2) | ḡPas | ḡNa | ḡKv | ḡCa | ḡKCa | ḡKm |
|---|---|---|---|---|---|---|
| Soma | 40 | 8.4 | 86 | 0.075 | 4.2 | 1 |
| Dendrites | 40 | 8.4 | 0 | 0.15 | 4.2 | 1 |
| Axon hillock and initial segment | 40 | 18,000 | 860 | 0 | 0 | 0 |
| Nodes of Ranvier | 40 | 18,000 | 0 | 0 | 0 | 0 |
Table 2.
Channel densities for passive dendrite simulations
| Conductance (pS μm−2) | ḡPas | ḡNa | ḡKv | ḡCa | ḡKCa | ḡKm |
|---|---|---|---|---|---|---|
| Soma | 45.66 | 12.6 | 48 | 0.15 | 4.2 | 0.1 |
| Dendrites | 45.66 | 0 | 0 | 0 | 0 | 0 |
| Axon hillock and initial segment | 45.66 | 16,200 | 480 | 0 | 0 | 0 |
| Nodes of Ranvier | 45.66 | 16,200 | 0 | 0 | 0 | 0 |
Results
Figure 1A illustrates diagrammatically the strategy that we followed. We assume that there are homogeneous populations of RS cells and FS cells in a local region of the neocortex, which generate spikes according to observed spike timing (phase) distributions of RS and FS cells, relative to the local field potential (LFP) γ oscillation during in vivo UP states (taken from Hasenstaub et al., 2005) (see below). From this, we calculate the expected recurrent synaptic conductances that should converge on to a single RS neuron, for different values of parameters such as the delay, degrees of stochasticity and γ modulation, and firing rate. We then stimulate actual RS cells in rat neocortical slices with these conductance inputs, using the conductance injection or dynamic-clamp technique (Robinson and Kawai, 1993; Sharp et al., 1993), and measure the “postsynaptic” RS cellular spike phase distribution. With this strategy, we could examine how the parameters of the reconstructed synaptic inputs determine the shape of the postsynaptic spike phase distribution. In particular, we were able to ask what assumptions are necessary to produce an RS spike phase distribution that is a consistent match with the original “presynaptic” distribution used to generate the spikes in silico.
Figure 1.
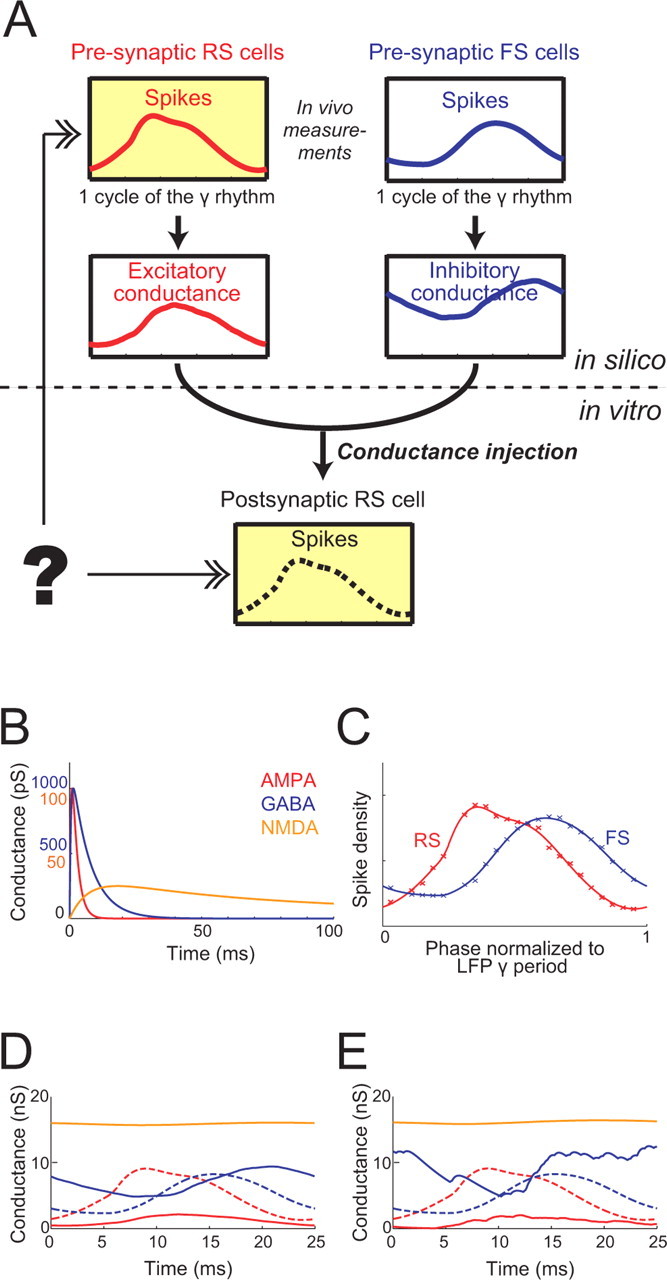
γ-Modulated conductance inputs to RS cells. A, Schematic illustration of overall strategy. RS pyramidal cells were stimulated in vitro with reconstructed synaptic conductances, which were calculated in silico based on the spike timing distributions of RS and FS cells observed during in vivo UP states. The recurrent synaptic input to an RS cell comes from presynaptic RS cells and FS cells, which are assumed to generate spikes according to distinct phase distributions with respect to the LFP oscillation, as measured in vivo (top row). Using spike times generated in silico from these distributions, we calculated expected postsynaptic somatic excitatory and inhibitory conductance waveforms (middle row), varying parameters of the recurrent inputs such as the amount of delay. We then injected these reconstructed synaptic conductances in RS cells in neocortical slices and recorded the resulting postsynaptic spike phase distribution (bottom). We examined what assumptions are required to produce the spike phase distribution that consistently matches the original presynaptic distribution (top left) used to generate the spikes in silico. B, Synthesizing artificial synaptic conductance inputs from the distributions of firing probability during the LFP γ-oscillation period. AMPA, GABA, and unblocked NMDA unitary conductance transients (red, blue, and orange, respectively). C, Curves indicate smooth fits to measured RS (red) and FS (blue) spike phase distributions (crosses) (from Hasenstaub et al., 2005). D, AMPA, GABA, and unblocked NMDA conductances over a single γ period, calculated as the convolutions of the unitary conductances in C and the spike phase distributions in B. E, Instances of stochastically stimulated conductances over one period, generated by summing unitary transients generated from nonstationary point processes, whose rates follow the distributions in B, scaled to have mean frequencies of 4000–6000 Hz for AMPA/NMDA and 600–1600 Hz for GABA. Conductance waveforms in D are thus the ensemble averages of the stochastically simulated waveforms in E. In D and E, the spike phase distributions in C are superimposed as dashed curves for comparison.
Stimulation of RS cells with reconstructed recurrent synaptic conductances
We started with a simple method of generating recurrent synaptic conductances by numerically convolving unitary AMPA and NMDA receptor conductance waveforms (red and orange lines in Fig. 1B, respectively) with the observed in vivo phase distribution of RS cellular spikes (red line in Fig. 1C: fitting of the data by Hasenstaub et al., 2005, their Fig. 5G, by a Gaussian mixture) and a unitary GABA receptor conductance waveform (blue line in Fig. 1B) with the FS spike phase distribution (blue line in Fig. 1C). These conductance stimuli (Fig. 1D) follow smooth trajectories that could be considered equivalent to the average synaptic conductance time course during the γ oscillation period. Figure 2Ac shows an example membrane potential trajectory of a neocortical RS cell in response to the injection of the conductances shown in Figure 2Ab: we adjusted the balance of excitation and inhibition so that RS cells fired at an average rate of 5–15 Hz (Hasenstaub et al., 2005). Figure 2Ba shows the resulting postsynaptic spike phase distribution. As shown in the figure, the postsynaptic distribution differs markedly from the presynaptic distribution (red dashed line in Fig. 2Ba), being much sharper and showing a delay of 4–5 ms in its peak. Thus, consistency of presynaptic and postsynaptic RS cell spike phase distributions does not hold under this simplest input scenario.
When only excitation or inhibition is γ modulated
To make the postsynaptic spike phase distribution closer to the presynaptic one, the structure of the reconstructed inputs needs to be altered. In the experiment described above, both excitatory and inhibitory conductance were fully γ modulated, as shown in Figure 2Ab. One possibility is that there is a difference in the extent of γ modulation in excitation and inhibition. We first tested the extreme cases of restricting γ modulation solely to excitation or to inhibition. Specifically, we stimulated RS cells with either (1) the reconstructed recurrent excitatory (AMPA and NMDA) conductance, which is the same as in the previous experiment and thus prominently γ modulated, together with tonic inhibitory (GABA) conductance, or (2) tonic excitatory conductance and the reconstructed γ-modulated inhibitory conductance. Figure 2, Bb and Bc, shows the resulting postsynaptic RS spike phase distributions. When only excitation is γ modulated (Fig. 2Bb), the peak of the postsynaptic distribution (histogram) is even further delayed from the presynaptic distribution (red dashed line) by ∼8 ms. Conversely, when only inhibition is γ modulated (Fig. 2Bc), the peak of the postsynaptic distribution shifts to the left, corresponding closely to that of the presynaptic distribution. These results suggest that, when recurrent excitation is γ modulated according directly to the presynaptic spike phase distribution of RS cells, it has too strong an impact on postsynaptic spike timing, leading to a peak in firing that is delayed by some milliseconds from that of the presynaptic distribution, thus making it impossible for presynaptic and postsynaptic spike distributions to agree. However, although the peak firing phase shifts to the correct position when only recurrent inhibition is γ modulated (Fig. 2Bc), the postsynaptic distribution is still much narrower than the presynaptic one, suggesting that additional modification to the input scenario is necessary.
Simulating stochastic firing of presynaptic neurons
So far, the stimuli used have not included the stochastic nature of activity in the presynaptic neuron population. It is possible that the spike phase distribution could be broadened sufficiently by taking such stochasticity into account. To test this, we devised another method to synthesize conductances: explicit instances of presynaptic spike times were generated as nonstationary Poisson processes, whose rates followed the RS and FS spike distributions (Fig. 2Ca, the same as Aa), scaled to frequencies that were compatible with known firing rate and numbers of synaptic connections, i.e., 4000–6000 Hz for AMPA/NMDA and 600–1600 Hz for GABA. Then unitary conductance transients (Fig. 1B) were generated for each spike time and summed. The resulting conductances were no longer smooth and periodic (Figs. 1E, 2Cb), and the membrane potential of the neuron stimulated in this way showed irregular fluctuations (Fig. 2Cc). Figure 2Da shows a postsynaptic spike phase distribution obtained for this stochastic input scenario. As shown in this figure, the postsynaptic distribution becomes broader than with deterministic stimuli (Fig. 2Ba), as desired, whereas the peak time of the distribution does not significantly change.
We then examined the scenario of stochastic excitation and inhibition but with γ modulation of only one or the other. In other words, we generated presynaptic FS spike times according to a stationary Poisson process, whereas RS spike times were generated according to the same nonstationary Poisson process as used in the previous experiment or vice versa. Figure 2, Db and Dc, shows the resulting postsynaptic RS spike phase distributions. The effect of the stochasticity is again to broaden the distribution relative to the corresponding distribution for nonstochastic input (Fig. 2Bb,Bc), whereas the peak positions hardly changed. Notably, in the case of stochastic γ-modulated inhibition and nonmodulated excitation (Fig. 2Dc), the postsynaptic RS spike phase distribution (histogram) closely resembles the presynaptic one (red dashed line) in both the peak time and the narrowness and also in the degree of skew. This suggests that the phase preference of RS spikes during UP states is shaped by γ-modulated recurrent GABAergic input and that γ-modulated recurrent excitation is inconsistent with the observed RS and FS firing distributions. We further examined, in a different set of cells, cases in which excitation or inhibition were partially γ modulated, using mixtures of stationary and nonstationary Poisson processes. This confirmed (Fig. 2E) that consistency between presynaptic and postsynaptic RS spike phase distributions is achieved when RS cells receive strongly γ-modulated inhibition and weakly or nonmodulated excitation (bottom left panels in Fig. 2E).
Simulating time-varying frequency of γ oscillations
So far, we have assumed that the frequency of the LFP γ oscillation is fixed at 40 Hz. However, in real γ oscillations, the frequency can vary from period to period, over the frequency range of 30–80 Hz (Hasenstaub et al., 2005). Can this variation cause additional change in the shape of the spike phase distributions? We simulated this scenario using an Ornstein–Uhlenbeck (OU) process (Gillespie, 1996). The periodic RS and FS spike densities used thus far (Fig. 2Ca) were transformed by stretching or shrinking the time axis by a time-variable factor, given by an OU process with mean of 1, SD of ¼, and time constant of 250 ms. Figure 3Aa shows an example OU process, and Figure 3Ab shows how the original periodic spike density (bottom horizontal waveform) is transformed into a time-varying γ-modulated one (left vertical waveform) via the integral of the OU process (diagonal line). From these time-varying γ-modulated spike densities (Fig. 3Ba), we synthesized AMPA, GABA, and NMDA receptor conductances (Fig. 3Bb) and injected them into RS cells (Fig. 3Bc). Again, we examined situations in which excitation and inhibition are γ modulated to different extents. The results (Fig. 3C) were generally similar to the previous ones obtained with a fixed (40 Hz) γ frequency (Fig. 2E): good agreement between presynaptic and postsynaptic RS spike phase distributions was again achieved when RS cells receive strongly γ-modulated inhibition and weakly or non-γ-modulated excitation (bottom left panels in Fig. 3C). Variation in the γ frequency appeared to have little effect on the peak phase of the distributions but reduced their sharpness slightly.
To compare these results quantitatively, we calculated the mean phase and the sharpness of the distributions (see Materials and Methods). As shown in Figure 4, the best match between the mean position of the presynaptic and postsynaptic distributions is realized when only GABAergic inputs are γ modulated (Fig. 4Ac). There was little effect of the degree of stochasticity on the mean position of the distribution (horizontal axes of Fig. 4Ac), but the sharpness of phase distributions was less for stochastic stimulation than for nonstochastic stimulation and reduced still further by using time-varying stochastic stimulation to almost the same extent as the original presynaptic distribution (Fig. 4Bc). The closest match to the presynaptic distribution, in both sharpness and mean phase, was for the case of time-varying γ-modulated stochastic GABAergic input, with stationary stochastic glutamatergic input (the rightmost points in Fig. 4Ac,Bc).
Simulating distributed delays on recurrent inputs
As seen above, to realize the match between presynaptic and postsynaptic distributions, it is necessary that excitatory synaptic inputs to RS cells should not be strongly γ modulated. One possibility is that γ modulation of recurrent excitation, which must be strong at its origin, namely in the firing of presynaptic RS cells, is then weakened by distributed delays in axonal conduction and/or dendritic integration (discussed later). We examined this possibility by synthesizing artificial recurrent conductances with delays. Specifically, spike times were first generated according to the presynaptic spike phase distributions in the same way as previously but then shifted by amounts taken independently from a certain delay distribution, for which we used a half-Gaussian function for simplicity (Fig. 5, green filled curves in the top row and the leftmost column). Figure 5 shows the resulting postsynaptic spike phase distributions. Increasing the delay in recurrent inhibition (from left to right in Fig. 5) systematically shifted the distribution to the right, whereas the effect of increasing delay in recurrent excitation (from top to bottom) depended on the delay in inhibition. In the case of zero delay in inhibition with a large mean delay of 9.6 ms in excitation, there was very good consistency between the presynaptic and postsynaptic distributions, as shown in the figure. Under this scenario, although the excitatory AMPA conductance (red solid line in Fig. 5) is still slightly γ modulated, the modulation is greatly weakened and shifted to the right by the distributed delay, so as almost to coincide in timing with the modulation of the inhibitory conductance (blue solid line). In this circumstance, it seems that γ modulation of the recurrent excitation could be uniformly masked by γ modulation of the inhibition so that it does not shift the postsynaptic spike phase distribution but simply broadens it by weakening the impact of γ-modulated inhibition on spike timing.
Comparison of point versus distributed synaptic input in a numerical model
Postsynaptic integration could also contribute to the demodulation of excitation, because glutamatergic synapses are distributed extensively over the dendrites of pyramidal cells. The effect of such a distributed input may not be adequately reproduced by a point conductance input at the soma. To examine whether this is the case, we performed morphologically detailed simulations of a layer 2/3 pyramidal cell using the NEURON simulation environment (Hines and Carnevale, 1997), with voltage-dependent conductances based on the model of Mainen et al. (1995) (see Materials and Methods). We found that distributing either the excitatory or the inhibitory inputs had only small effects on the position of the peak in spike density and mainly affected the scaling or amplitude of the spike density distribution. Figure 6 shows spike density histograms with γ-modulated excitation and inhibition and without presynaptic delays, which produced a similar spike distribution to that observed experimentally for point somatic input (Fig. 2Da). Distributing both excitation and inhibition over the dendrites produced a small reduction in peak firing rate during the gamma cycle, with a slight shift of the spike density toward the right (Fig. 6Ca,Cd). Distributing the excitation while keeping somatic inhibition, the condition that probably most closely resembles the natural distribution of inputs, depresses the firing rate but has little impact on the position of the peak density (Fig. 6Cb,Ce). This would indicate that excitatory inputs applied proximally have a stronger weight than distal inputs, even in the case of active dendrites. Conversely, with distributed inhibition but point somatic excitation, firing rates are boosted but again without a marked effect on the position of the peak (Fig. 6Cc,Cf). The effects on firing rate were more pronounced when dendrites were passive (Fig. 6Cd–Cf) than when they were active (Fig. 6Ca–Cc), presumably reflecting compensation of dendritic attenuation by active amplification. Thus, these simulations suggest that, although dendritic integration and propagation delays could contribute to the overall demodulation, they are unlikely to be a major component.
Gamma phase encoding of synaptic inputs
A recent study (Fries et al., 2007) proposed that the strength of excitatory input to pyramidal cells could be encoded by the phase of firing, with more strongly excited cells firing earlier in the gamma cycle. In Figure 7, A and B, we demonstrate that different “frozen noise” instances of stochastic gamma input can give quite reliable spike-time encoding at different phases of the gamma cycle. However, when the synaptic input preceding spikes is averaged over many stochastic instances, or “reverse correlated” (Fig. 7C,D), we found that spikes early in the gamma cycle are associated with strong preceding reductions in inhibition and only very weak transients of excitation. Thus, our results support the idea that the phase of firing can be a reliable function of the input, but we suggest that, at least for the input scenario that we have used, the level of inhibition is a stronger determinant of spike timing than the level of excitation. It is possible, however, that, if excitatory conductance also underwent modulations at a slower timescale, encoding of the level of excitatory input as suggested by Fries et al. could occur, and this is an interesting avenue for future research.
Discussion
Possible input scenario shaping γ oscillations during sustained activity
We have shown that the phase preferences of RS and FS cellular spikes observed in vivo during UP states (Hasenstaub et al., 2005) are consistent with an input scenario in which RS cells receive strong, low-latency inhibitory input from FS cells, which is prominently modulated by the LFP γ rhythm to the same extent as the presynaptic FS spike generation probability, in combination with excitatory conductance from other RS cells that have little or no γ modulation. The low latency for the inputs from FS cells corresponds to two known facts; first, that axons of FS cells (proximally targeting interneurons) are mostly thick and well myelinated (for review, see Thomson and Bannister, 2003) and so conduction velocity should be high, and second, that most GABAergic synapses made by FS cells are seen on the somata or perisomatic dendrites so that delay attributable to dendritic integration should be short (Kawaguchi and Kubota, 1997). It is also in line with a proposed mechanism for many kinds of γ oscillations in which γ-modulated firing of principal pyramidal cells is driven by synchronized oscillatory GABAergic inputs (Whittington et al., 1995; Buhl et al., 1998; Fisahn et al., 1998; Penttonen et al., 1998; Mann et al., 2005), suggesting that the same principle is also applicable to the background γ oscillations that accompany self-sustained UP states.
Conversely, apart from several modeling studies (Whittington et al., 1997; Kopell et al., 2000; Brunel and Wang, 2003; Geisler et al., 2005; Kanamaru, 2006), relatively little is known about how recurrent excitation between pyramidal cells is involved in the γ rhythm, although such excitatory reverberation is thought to underlie sustained activity. We found that, if there is phasic modulation in the excitatory conductance in an RS cell, it has a significant impact on the spike timing of the cell, which is very difficult to cancel out by phasic modulation in the inhibition. In particular, if recurrent excitatory inputs are γ modulated at the stage of the postsynaptic somatic conductance as prominently as at the original stage of presynaptic firing probability, it seems to be impossible to match postsynaptic and presynaptic spike phase distributions. Therefore, if the UP state activity is sustained predominantly by local recurrent inputs as believed (Sanchez-Vives and McCormick, 2000; Shu et al., 2003; Haider et al., 2006), phasic RS firing is likely to be somehow transformed in the network into postsynaptic conductance that is quite evenly dispersed in time. We have shown that a distributed (half-Gaussian) delay of on average ∼10 ms on the recurrent excitation could weaken its γ modulation to the expected extent (see Fig. 5). Such a distribution of delay could result from RS cells collecting recurrent excitation from many other pyramidal cells at a variety of distances via axonal collaterals, because, in contrast to axons of FS cells, pyramidal axonal collaterals are essentially unmyelinated, and thus the conduction velocity is low (≤0.1 m/s) (Thomson and Bannister, 2003). Dendritic integration could also contribute in part to the delay (Fig. 6). Theoretical studies of the effect of delay on the γ oscillation are few and limited to simple cases such as fixed delay between two populations of neurons (Kanamaru, 2006). Extension of such models to the case of distributed delays on recurrent excitatory connections would be interesting in the light of our results.
In addition to the effects of local recurrence delay, it is likely that a decay in spatial synchronization of the γ oscillation with distance will contribute to the weakening of γ modulation of recurrent input, through integration of distal inputs. Other possible mechanisms such as stochastic propagation of action potentials in local RS recurrent connections (Faisal et al., 2005) or hypothesized random occurrence of ectopic spikes in pyramidal axons coupled by axo-axonic gap junctions (Draguhn et al., 1998) could also play a part in diluting the γ modulation of recurrent excitation. In entorhinal cortex, it has been shown that kainate receptors (KARs) play a major role in generating UP states (Cunningham et al., 2006). Kainate receptor-mediated transmission is often associated with significantly slower conductance transients than AMPA receptor (AMPAR)-mediated transmission (Lerma, 2003), and it has been suggested that KARs could effectively act as a low-pass filter of input signals (Frerking and Nicoll, 2000). KAR-mediated transmission is present in the neocortex (Kidd and Isaac, 1999) but forms a much smaller fraction of fast transmission than do AMPARs (Ali, 2003), and there are also presynaptic kainate receptors that can facilitate excitatory transmission (Lerma, 2003). It is conceivable, however, that under UP state conditions, with widespread glutamate spillover, postsynaptic KAR activation might be larger and relatively slow in time course. Applying CNQX to block AMPAR-mediated excitation also blocks KAR-mediated transmission, whose contribution may therefore previously have been underestimated (Castillo et al., 1997; Vignes and Collingridge, 1997). Therefore, we examined the effect of using much slower unitary excitatory conductance events (rise time constant of 0.5 ms, decay time constant of 100 ms) on the spike phase distribution (Fig. 8A). As shown in Figure 8B, using exclusively slow KAR-like unitary kinetics can also effectively eliminate the γ modulation of the excitatory conductance, producing good consistency between the input and output RS firing phase distributions. With 50% AMPAR, 50% KAR kinetics, there is only a partial shift of the distribution toward the target presynaptic distribution. Thus, it appears possible that KAR-mediated transmission could account for some of the demodulation of recurrent excitatory input conductance, although more quantitative estimates of the KAR contribution during UP states will be required to assess the importance of this potential mechanism.
Advantages and potential drawbacks of our approach
The genesis of the γ rhythm is a complex, variable network phenomenon. Quantitative insight into how the structure of input determines spike responses is difficult during such a global, distributed activity pattern. To understand how individual cells participate in γ rhythms, it is necessary to reconstruct the synaptic input that they receive and to show how this input is integrated into γ-modulated firing. To address this question, the approach that we have taken of injecting artificial synaptic conductances into neurons in vitro has several key advantages: it realistically reproduces the electrical nature of synaptic input, but, unlike for in vivo γ oscillations, the different fractions of conductance input are known precisely and can be systematically varied according to different models. Unlike in numerical simulations, we are studying the responses of the actual spike-generating mechanisms of the neuron, whose impact on the network oscillation may significantly differ from that of simple models (Geisler et al., 2005). Applying this approach to different kinds of oscillatory activity patterns should shed light on common and distinct mechanisms. A potential criticism of this approach is that conductance is injected only at the soma. However, it is known, as already described, that, although glutamatergic synapses are distributed over the somatodendritic axis of pyramidal cells, most GABAergic synapses made by FS cells are seen on the somata or perisomatic dendrites rather than on distal dendrites (Kawaguchi and Kubota, 1997). Thus, this method reproduces the most important nonlinear characteristic of synaptic input, the shunting nature of proximal inhibition, near to the site of spike initiation. The conductance nature of excitation at the soma is less important, because its reversal potential is far from spike threshold, and, in accordance with this, results of numerical simulations of these experiments showed no major qualitative differences in spike density distributions between point somatic or distributed excitation (Fig. 6).
We have not explicitly included a drive by fast rhythmic bursting (FRB) or chattering cells (Gray and McCormick, 1996; Steriade et al., 1998), which can intrinsically generate bursts of spikes at a gamma frequency and may be important for generating cortical gamma oscillations in particular (Cunningham et al., 2004). However, our results suggest that FRB cell input to RS neurons, like recurrent input from other RS cells, should also be subject to a distributed delay and effective demodulation. If this was not the case, then reproducing the in vivo RS cell spike density distributions should require more strongly γ-modulated excitatory input.
Another aspect that was not simulated by our conductance inputs was the conductance attributable to activation of other types of synaptic receptors, such as metabotropic glutamate and muscarinic acetylcholine receptors, which are less well characterized in terms of kinetics and distribution. However, during naturally evoked gamma oscillations in vivo, the proportion of the total conductance of the membrane resulting from these conductances is likely to be low relative to that of the AMPA, NMDA, and GABA receptors, and, because of their slow activation and deactivation time courses, they are not expected to show fast temporal modulation during the gamma cycle. Nevertheless, we cannot rule out a significant influence of these receptors on synaptic integration during in vivo cortical gamma oscillations.
Conclusion
We have reconstructed recurrent synaptic inputs that RS cells are expected to receive during self-sustained UP states accompanied by γ oscillations and have used these to stimulate actual RS cells and to explore the input scenarios under which the measured postsynaptic spike phase distribution matches the presynaptic distribution. Our results indicate that RS cells are likely to receive strongly γ-modulated, low-latency inhibition from FS cells and excitation with little or no γ modulation from other RS cells, possibly through several mechanisms including long distributed delays. This structure of input during γ oscillations indicates a possible separation of function in the network between excitatory and inhibitory connections. Inhibitory inputs from FS cells are responsible for setting a reliable rhythm, whereas recurrent excitation between RS cells has no overall effect on the gamma rhythm but still contributed a strong reinforcement to the maintenance of the sustained activity. The lack of overall phase modulation in RS–RS cell recurrent excitation would allow a large capacity for encoding information with reference to a γ clock signal, because the uniform distribution of recurrent excitatory inputs through the γ period permits a great number of different arrangements of recurrent input timing, without impacting on the timing of the clock itself.
Footnotes
This work was supported by grants from European Community Framework Programme 6 (H.P.C.R.), the Daiwa Foundation (K.A., H.P.C.R.), a Grant-in-Aid for Scientific Research on Priority Areas (Higher-Order Brain Functions) from Ministry of Education, Culture, Sports, Science, and Technology Japan Grant 17022012 (K.A.), and Japan Society for the Promotion of Science Research Fellowship for Young Scientists Grant 10834 (K.M.). K.M. thanks Dr. Kojiro Yano for help and advice with experimental procedures.
References
- Ali AB. Involvement of post-synaptic kainate receptors during synaptic transmission between unitary connections in rat neocortex. Eur J Neurosci. 2003;17:2344–2350. doi: 10.1046/j.1460-9568.2003.02677.x. [DOI] [PubMed] [Google Scholar]
- Amit D, Mongillo G. Selective delay activity in the cortex: phenomena and interpretation. Cereb Cortex. 2003;13:1139–1150. doi: 10.1093/cercor/bhg103. [DOI] [PubMed] [Google Scholar]
- Brunel N, Wang X. What determines the frequency of fast network oscillations with irregular neural discharges? I. Synaptic dynamics and excitation-inhibition balance. J Neurophysiol. 2003;90:415–430. doi: 10.1152/jn.01095.2002. [DOI] [PubMed] [Google Scholar]
- Buhl EH, Tamas G, Fisahn A. Cholinergic activation and tonic excitation induce persistent gamma oscillations in mouse somatosensory cortex in vitro. J Physiol (Lond) 1998;513:117–126. doi: 10.1111/j.1469-7793.1998.117by.x. [DOI] [PMC free article] [PubMed] [Google Scholar]
- Buzsaki G, Chrobak JJ. Temporal structure in spatially organized neuronal ensembles: a role for interneuronal networks. Curr Opin Neurobiol. 1995;5:504–510. doi: 10.1016/0959-4388(95)80012-3. [DOI] [PubMed] [Google Scholar]
- Castillo PE, Malenka RC, Nicoll RA. Kainate receptors mediate a slow postsynaptic current in hippocampal CA3 neurons. Nature. 1997;388:182–186. doi: 10.1038/40645. [DOI] [PubMed] [Google Scholar]
- Cowan RL, Wilson CJ. Spontaneous firing patterns and axonal projections of single corticostriatal neurons in the rat medial agranular cortex. J Neurophysiol. 1994;71:17–32. doi: 10.1152/jn.1994.71.1.17. [DOI] [PubMed] [Google Scholar]
- Csicsvari J, Jamieson B, Wise KD, Buzsaki G. Mechanisms of gamma oscillations in the hippocampus of the behaving rat. Neuron. 2003;37:311–322. doi: 10.1016/s0896-6273(02)01169-8. [DOI] [PubMed] [Google Scholar]
- Cunningham MO, Whittington MA, Bibbig A, Roopun A, LeBeau FE, Vogt A, Monyer H, Buhl EH, Traub RD. A role for fast rhythmic bursting neurons in cortical gamma oscillations in vitro. Proc Natl Acad Sci USA. 2004;101:7152–7157. doi: 10.1073/pnas.0402060101. [DOI] [PMC free article] [PubMed] [Google Scholar]
- Cunningham MO, Pervouchine DD, Racca C, Kopell NJ, Davies CH, Jones RS, Traub RD, Whittington MA. Neuronal metabolism governs cortical network response state. Proc Natl Acad Sci USA. 2006;103:5597–5601. doi: 10.1073/pnas.0600604103. [DOI] [PMC free article] [PubMed] [Google Scholar]
- Deans MR, Gibson JR, Sellitto C, Connors BW, Paul DL. Synchronous activity of inhibitory networks in neocortex requires electrical synapses containing connexin36. Neuron. 2001;31:477–485. doi: 10.1016/s0896-6273(01)00373-7. [DOI] [PubMed] [Google Scholar]
- Draguhn A, Traub RD, Schmitz D, Jefferys JG. Electrical coupling underlies high-frequency oscillations in the hippocampus in vitro. Nature. 1998;394:189–192. doi: 10.1038/28184. [DOI] [PubMed] [Google Scholar]
- Faisal AA, White JA, Laughlin SB. Ion-channel noise places limits on the miniaturization of the brain's wiring. Curr Biol. 2005;15:1143–1149. doi: 10.1016/j.cub.2005.05.056. [DOI] [PubMed] [Google Scholar]
- Fisahn A, Pike FG, Buhl EH, Paulsen O. Cholinergic induction of network oscillations at 40 Hz in the hippocampus in vitro. Nature. 1998;394:186–189. doi: 10.1038/28179. [DOI] [PubMed] [Google Scholar]
- Frerking M, Nicoll RA. Synaptic kainate receptors. Curr Opin Neurobiol. 2000;10:342–351. doi: 10.1016/s0959-4388(00)00094-5. [DOI] [PubMed] [Google Scholar]
- Fries P, Nikolic D, Singer W. The gamma cycle. Trends Neurosci. 2007;30:309–316. doi: 10.1016/j.tins.2007.05.005. [DOI] [PubMed] [Google Scholar]
- Galarreta M, Hestrin S. Electrical and chemical synapses among parvalbumin fast-spiking GABAergic interneurons in adult mouse neocortex. Proc Natl Acad Sci USA. 2002;99:12438–12443. doi: 10.1073/pnas.192159599. [DOI] [PMC free article] [PubMed] [Google Scholar]
- Geisler C, Brunel N, Wang X. Contributions of intrinsic membrane dynamics to fast network oscillations with irregular neuronal discharges. J Neurophysiol. 2005;94:4344–4361. doi: 10.1152/jn.00510.2004. [DOI] [PubMed] [Google Scholar]
- Gibson JR, Beierlein M, Connors BW. Functional properties of electrical synapses between inhibitory interneurons of neocortical layer 4. J Neurophysiol. 2005;93:467–480. doi: 10.1152/jn.00520.2004. [DOI] [PubMed] [Google Scholar]
- Gillespie DT. Exact numerical simulation of the Ornstein-Uhlenbeck process and its integral. Phys Rev E Stat Phys Plasmas Fluids Relat Interdiscip Topics. 1996;54:2084–2091. doi: 10.1103/physreve.54.2084. [DOI] [PubMed] [Google Scholar]
- Goldman-Rakic P. Cellular basis of working memory. Neuron. 1995;14:477–485. doi: 10.1016/0896-6273(95)90304-6. [DOI] [PubMed] [Google Scholar]
- Gray CM, McCormick DA. Chattering cells: superficial pyramidal neurons contributing to the generation of synchronous oscillations in the visual cortex. Science. 1996;274:109–113. doi: 10.1126/science.274.5284.109. [DOI] [PubMed] [Google Scholar]
- Haider B, Duque A, Hasenstaub A, McCormick D. Neocortical network activity in vivo is generated through a dynamic balance of excitation and inhibition. J Neurosci. 2006;26:4535–4545. doi: 10.1523/JNEUROSCI.5297-05.2006. [DOI] [PMC free article] [PubMed] [Google Scholar]
- Harsch A, Robinson HPC. Postsynaptic variability of firing in rat cortical neurons: the roles of input synchronization and synaptic NMDA receptor conductance. J Neurosci. 2000;20:6181–6192. doi: 10.1523/JNEUROSCI.20-16-06181.2000. [DOI] [PMC free article] [PubMed] [Google Scholar]
- Hasenstaub A, Shu Y, Haider B, Kraushaar U, Duque A, McCormick DA. Inhibitory postsynaptic potentials carry synchronized frequency information in active cortical networks. Neuron. 2005;47:423–435. doi: 10.1016/j.neuron.2005.06.016. [DOI] [PubMed] [Google Scholar]
- Hines ML, Carnevale NT. The NEURON simulation environment. Neural Comput. 1997;9:1179–1209. doi: 10.1162/neco.1997.9.6.1179. [DOI] [PubMed] [Google Scholar]
- Hormuzdi SG, Pais I, LeBeau FE, Towers SK, Rozov A, Buhl EH, Whittington MA, Monyer H. Impaired electrical signaling disrupts gamma frequency oscillations in connexin 36-deficient mice. Neuron. 2001;31:487–495. doi: 10.1016/s0896-6273(01)00387-7. [DOI] [PubMed] [Google Scholar]
- Kanamaru T. Analysis of synchronization between two modules of pulse neural networks with excitatory and inhibitory connections. Neural Comput. 2006;18:1111–1131. doi: 10.1162/089976606776241039. [DOI] [PubMed] [Google Scholar]
- Kawaguchi Y, Kubota Y. GABAergic cell subtypes and their synaptic connections in rat frontal cortex. Cereb Cortex. 1997;7:476–486. doi: 10.1093/cercor/7.6.476. [DOI] [PubMed] [Google Scholar]
- Kidd FL, Isaac JT. Developmental and activity-dependent regulation of kainate receptors at thalamocortical synapses. Nature. 1999;400:569–573. doi: 10.1038/23040. [DOI] [PubMed] [Google Scholar]
- Kopell N, Ermentrout GB, Whittington MA, Traub RD. Gamma rhythms and beta rhythms have different synchronization properties. Proc Natl Acad Sci USA. 2000;97:1867–1872. doi: 10.1073/pnas.97.4.1867. [DOI] [PMC free article] [PubMed] [Google Scholar]
- Lerma J. Roles and rules of kainate receptors in synaptic transmission. Nat Rev Neurosci. 2003;4:481–495. doi: 10.1038/nrn1118. [DOI] [PubMed] [Google Scholar]
- Mainen ZF, Joerges J, Huguenard JR, Sejnowski TJ. A model of spike initiation in neocortical pyramidal neurons. Neuron. 1995;15:1427–1439. doi: 10.1016/0896-6273(95)90020-9. [DOI] [PubMed] [Google Scholar]
- Mann EO, Radcliffe CA, Paulsen O. Hippocampal gamma-frequency oscillations: from interneurones to pyramidal cells, and back. J Physiol (Lond) 2005;562:55–63. doi: 10.1113/jphysiol.2004.078758. [DOI] [PMC free article] [PubMed] [Google Scholar]
- Penttonen M, Kamondi A, Acsady L, Buzsaki G. Gamma frequency oscillation in the hippocampus of the rat: intracellular analysis in vivo. Eur J Neurosci. 1998;10:718–728. doi: 10.1046/j.1460-9568.1998.00096.x. [DOI] [PubMed] [Google Scholar]
- Quintana J, Fuster J. From perception to action: temporal integrative functions of prefrontal and parietal neurons. Cereb Cortex. 1999;9:213–221. doi: 10.1093/cercor/9.3.213. [DOI] [PubMed] [Google Scholar]
- Robinson HPC, Kawai N. Injection of digitally synthesized synaptic conductance transients to measure the integrative properties of neurons. J Neurosci Methods. 1993;49:157–165. doi: 10.1016/0165-0270(93)90119-c. [DOI] [PubMed] [Google Scholar]
- Sanchez-Vives MV, McCormick DA. Cellular and network mechanisms of rhythmic recurrent activity in neocortex. Nat Neurosci. 2000;3:1027–1034. doi: 10.1038/79848. [DOI] [PubMed] [Google Scholar]
- Sharp AA, O'Neil MB, Abbott LF, Marder E. Dynamic clamp: computer-generated conductances in real neurons. J Neurophysiol. 1993;69:992–995. doi: 10.1152/jn.1993.69.3.992. [DOI] [PubMed] [Google Scholar]
- Shu Y, Hasenstaub A, McCormick DA. Turning on and off recurrent balanced cortical activity. Nature. 2003;423:288–293. doi: 10.1038/nature01616. [DOI] [PubMed] [Google Scholar]
- Steriade M, Nunez A, Amzica F. A novel slow (<1 Hz) oscillation of neocortical neurons in vivo: depolarizing and hyperpolarizing components. J Neurosci. 1993;13:3252–3265. doi: 10.1523/JNEUROSCI.13-08-03252.1993. [DOI] [PMC free article] [PubMed] [Google Scholar]
- Steriade M, Timofeev I, Durmuller N, Grenier F. Dynamic properties of corticothalamic neurons and local cortical interneurons generating fast rhythmic (30–40 Hz) spike bursts. J Neurophysiol. 1998;79:483–490. doi: 10.1152/jn.1998.79.1.483. [DOI] [PubMed] [Google Scholar]
- Tateno T, Harsch A, Robinson HP. Threshold firing frequency-current relationships of neurons in rat somatosensory cortex: type 1 and type 2 dynamics. J Neurophysiol. 2004;92:2283–2294. doi: 10.1152/jn.00109.2004. [DOI] [PubMed] [Google Scholar]
- Thomson A, Bannister A. Interlaminar connections in the neocortex. Cereb Cortex. 2003;13:5–14. doi: 10.1093/cercor/13.1.5. [DOI] [PubMed] [Google Scholar]
- Traub RD, Bibbig A, LeBeau FE, Buhl EH, Whittington MA. Cellular mechanisms of neuronal population oscillations in the hippocampus in vitro. Annu Rev Neurosci. 2004;27:247–278. doi: 10.1146/annurev.neuro.27.070203.144303. [DOI] [PubMed] [Google Scholar]
- Vignes M, Collingridge GL. The synaptic activation of kainate receptors. Nature. 1997;388:179–182. doi: 10.1038/40639. [DOI] [PubMed] [Google Scholar]
- Wang X. Synaptic reverberation underlying mnemonic persistent activity. Trends Neurosci. 2001;24:455–463. doi: 10.1016/s0166-2236(00)01868-3. [DOI] [PubMed] [Google Scholar]
- Wang XJ, Buzsaki G. Gamma oscillation by synaptic inhibition in a hippocampal interneuronal network model. J Neurosci. 1996;16:6402–6413. doi: 10.1523/JNEUROSCI.16-20-06402.1996. [DOI] [PMC free article] [PubMed] [Google Scholar]
- Whittington MA, Traub RD, Jefferys JG. Synchronized oscillations in interneuron networks driven by metabotropic glutamate receptor activation. Nature. 1995;373:612–615. doi: 10.1038/373612a0. [DOI] [PubMed] [Google Scholar]
- Whittington MA, Traub RD, Faulkner HJ, Stanford IM, Jefferys JG. Recurrent excitatory postsynaptic potentials induced by synchronized fast cortical oscillations. Proc Natl Acad Sci USA. 1997;94:12198–12203. doi: 10.1073/pnas.94.22.12198. [DOI] [PMC free article] [PubMed] [Google Scholar]