

Abstract
Lipoprotein lipase (LPL) plays a central role in incorporating plasma lipids into tissues and regulates lipid metabolism and energy balance in the human body. Conversely, LPL expression is almost absent in normal adult livers. Therefore, its physiological role in the liver remains unknown. We aimed to elucidate the role of LPL in the pathophysiology of nonalcoholic steatohepatitis (NASH), a hepatic manifestation of obesity. Hepatic stellate cell (HSC)–specific LPL‐knockout (LplHSC‐KO) mice, LPL‐floxed (Lplfl/fl) mice, or double‐mutant toll‐like receptor 4–deficient (Tlr4−/−) LplHSC‐KO mice were fed a high‐fat/high‐cholesterol diet for 4 weeks to establish the nonalcoholic fatty liver model or an high‐fat/high‐cholesterol diet for 24 weeks to establish the NASH model. Human samples, derived from patients with nonalcoholic fatty liver disease, were also examined. In human and mouse NASH livers, serum obesity‐related factors, such as free fatty acid, leptin, and interleukin‐6, dramatically increased the expression of LPL, specifically in HSCs through signal transducer and activator of transcription 3 signaling, as opposed to that in hepatocytes or hepatic macrophages. In the NASH mouse model, liver fibrosis was significantly reduced in LplHSC‐KO mice compared with that in Lplfl/fl mice. Nonenzymatic LPL‐mediated cholesterol uptake from serum lipoproteins enhanced the accumulation of free cholesterol in HSCs, which amplified TLR4 signaling, resulting in the activation of HSCs and progression of hepatic fibrosis in NASH. Conclusion: The present study reveals the pathophysiological role of LPL in the liver, and furthermore, clarifies the pathophysiology in which obesity, as a background factor, exacerbates NASH. The LPL‐mediated HSC activation pathway could be a promising therapeutic target for treating liver fibrosis in NASH.
Abbreviations
- ALT
alanine aminotransferase
- Bambi
bone morphogenetic protein and activin membrane–bound inhibitor
- BW
body weight
- CE
cholesterol ester
- Col1a1
collagen 1a1
- Col1a2
collagen 1a2
- DAPI
4′,6‐diamidino‐2‐phenylindole
- FC
free cholesterol
- FFA
free fatty acid
- GFAP
glial fibrillary acidic protein
- GTT
glucose tolerance test
- HDL
high‐density lipoprotein
- H&E
hematoxylin and eosin
- HFC
high fat/high cholesterol
- HSC
hepatic stellate cell
- IL
interleukin
- ITT
insulin tolerance test
- LDL
low‐density lipoprotein
- LPL
lipoprotein lipase
- LPS
lipopolysaccharide
- mRNA
messenger RNA
- MT
Masson trichrome
- MβCD
methyl‐β‐cyclodextrin
- NAFL
nonalcoholic fatty liver
- NAFLD
nonalcoholic fatty liver disease
- NASH
nonalcoholic steatohepatitis
- PBS
phosphate‐buffered saline
- pSTAT3
phosphorylated signal transducer and activator of transcription 3
- PTT
pyruvate tolerance test
- SMA
smooth muscle actin
- STAT3
signal transducer and activator of transcription 3
- TC
total cholesterol
- TG
triglyceride
- TGF‐β
transforming growth factor‐β
- TLR4
toll‐like receptor 4
- VLDL
very low‐density lipoprotein
With the increase in the incidence of obesity, the number of patients with nonalcoholic fatty liver disease (NAFLD) has increased worldwide, reaching approximately 25% of adults in the United States.1 NAFLD is considered a hepatic manifestation of obesity and metabolic syndrome (including dyslipidemia, hypertension, and impaired glucose tolerance), because many patients with NAFLD manifest these conditions as background factors. Nonalcoholic steatohepatitis (NASH), which accounts for 20% to 30% of NAFLD, is a progressive liver disease that results in liver cirrhosis and liver cancer. In the United States, approximately 6% of adults are diagnosed with NASH, and approximately 2% progress to cirrhosis due to NASH; therefore, NASH is expected to become the leading cause of liver transplantation in the United States by 2020.1, 2
Because the number of patients with NASH is rapidly increasing worldwide, establishing treatment methods and evaluating its pathophysiological mechanisms represent urgent issues. Although the two‐hit theory3 and multiple parallel–hit hypothesis4 have been proposed as the pathophysiological mechanisms of NASH, the details are not yet clear. The extent of hepatic fibrosis has been recently considered the most important liver tissue finding for evaluating the prognosis of patients with NASH.1, 5, 6 Furthermore, it is assumed that metabolic syndrome and obesity, as background factors, modify the pathophysiological mechanism of NASH.
Lipoprotein lipase (LPL) is widely known to play a central role in incorporating plasma lipids into tissues and regulating lipid metabolism and the energy balance in the human body.7 LPL is produced primarily by parenchymal cells in the adipose tissue, heart, and skeletal muscle. LPL hydrolyzes triglycerides (TGs) from serum lipoproteins and functions in incorporating free fatty acids (FFAs) produced as a result of hydrolysis in each tissue. In recent years, LPL has also been reported to promote the binding of lipoproteins to their receptors, and its involvement in diseases associated with atherosclerosis has been noted.7, 8 Furthermore, its role in many aspects of obesity, such as insulin resistance and dyslipidemia, has also been reported.9 In contrast, LPL expression in the liver is relatively high at birth but gradually decreases; in adults, almost no expression is observed.10 Therefore, the role of hepatic LPL in human pathology has not yet been clarified, although pathological changes following introduction of the LPL gene into the liver in a mouse model have been observed.9, 11
In the present study, we demonstrate that LPL expression is elevated, specifically in hepatic stellate cells (HSCs), but not in liver parenchymal cells, as human NAFLD progresses. Furthermore, an HSC‐specific LPL‐deficient mouse strain was used to clarify the mechanistic details underlying the role of LPL in the development of NASH pathology.
Materials and Methods
Animal Studies
Eight‐week‐old male C57BL6/J mice and Wistar rats were purchased from CLEA Japan (Tokyo, Japan). B6.129S4‐Lpltm1Ijg/J mice (LPL‐floxed [Lplfl/fl] mice) were purchased from the Jackson Laboratory (Bar Harbor, ME). HSC‐specific LPL‐deficient (LplHSC‐KO) mice were obtained by mating glial fibrillary acidic protein (Gfap)‐Cre transgenic (CreTg) mice12 with Lplfl/fl mice. B6.129‐Tlr4tm1Aki/Obs (toll‐like receptor 4 [Tlr4]−/− mice) were purchased from Oriental BioService (Kyoto, Japan). Tlr4−/−Lplfl/fl and Tlr4−/−LplHSC‐KO mice were obtained by mating LplHSC‐KO mice with Tlr4−/− mice. Lplfl/fl, LplHSC‐KO, Tlr4−/−Lplfl/fl, or Tlr4−/−LplHSC‐KO mice were fed a CE‐2 (CLEA Japan) or a high‐fat/high‐cholesterol (HFC) diet (CLEA Japan) for 4 or 24 weeks to induce the NAFLD model as described.13 The glucose tolerance test (GTT), insulin tolerance test (ITT), and pyruvate tolerance test (PTT) were performed using LabAssay Glucose (FUJIFILM Wako Pure Chemicals) as described.12 For GTT, at 21 weeks into the diet, the mice were given glucose (1.5 g/kg body weight [BW]) intraperitoneally after being fasted for 16 hours. For ITT, at 22 weeks into the diet, the mice were given insulin (0.5 U/kg BW) intraperitoneally after being fasted for 4 hours. For PTT, at 23 weeks into the diet, the mice were given pyruvate (2 g/kg BW) intraperitoneally after being fasted for 16 hours. For acute administration experiments, intralipid (20 mg/g BW), recombinant leptin (5 mg/g BW), or recombinant interleukin‐6 (IL‐6) (500 mg/g BW) was given to 8‐week‐old male C57BL6/J mice. Four hours after administration, mouse livers were extracted.
The mice were maintained under specific pathogen‐free conditions at the Center for Laboratory Animal Science, National Defense Medical College. All animals received humane care in compliance with the National Research Council criteria outlined in the Guide for the Care and Use of Laboratory Animals prepared by the U.S. National Academy of Sciences and published by the U.S. National Institutes of Health (Bethesda, MD). All experimental protocols were approved by the National Defense Medical College Animal Use and Care Committee, and all methods were carried out in accordance with relevant guidelines and regulations.
Statistical Analysis
All data are expressed as the means ± SEMs. Statistical analyses were undertaken using an unpaired two‐tailed Student t test or a one‐way analysis of variance using Tukey’s post hoc test for multiple comparisons. Pearson’s correlation was used to verify the relationship between the variables. A P value of less than 0.05 was considered to indicate statistically significant differences.
Results
Serum Obesity‐Related Factors Elevate LPL Expression, Specifically in HSCs, in Mice and Patients With NAFLD
LPL messenger RNA (mRNA) expression was significantly higher in the liver of patients with NAFLD than in that of normal subjects (Fig. 1A). Furthermore, in liver samples derived from patients with NASH, the expression of LPL mRNA was significantly increased compared with that in the liver of patients with nonalcoholic fatty liver (NAFL). Immunofluorescence double staining of LPL and GFAP revealed that LPL is expressed specifically in HSCs and that, in the liver of patients with NAFLD, LPL expression is significantly enhanced, specifically in HSCs (Fig. 1A). In addition, with the progression of NAFLD, its expression significantly increased (Fig. 1A). A significant correlation was also observed between the levels of serum obesity‐related factors, such as FFAs, leptin, and IL‐6, and the number of LPL‐positive HSCs in patients with NAFLD (Fig. 1B). Similarly, a significant correlation was observed between the respective serum levels and hepatic LPL expression (Fig. 1C). Furthermore, the intravenous administration of intralipid, leptin, and IL‐6 significantly increased Lpl mRNA expression in both mouse livers and HSCs (Fig. 1D). Moreover, immunofluorescence double staining of GFAP and LPL revealed that LPL expression was elevated following the administration of these factors, specifically in HSCs (Fig. 1E). In mouse primary cultured HSCs, the administration of FFA, leptin, and IL‐6 additively increased Lpl mRNA expression (Fig. 1F).
Figure 1.
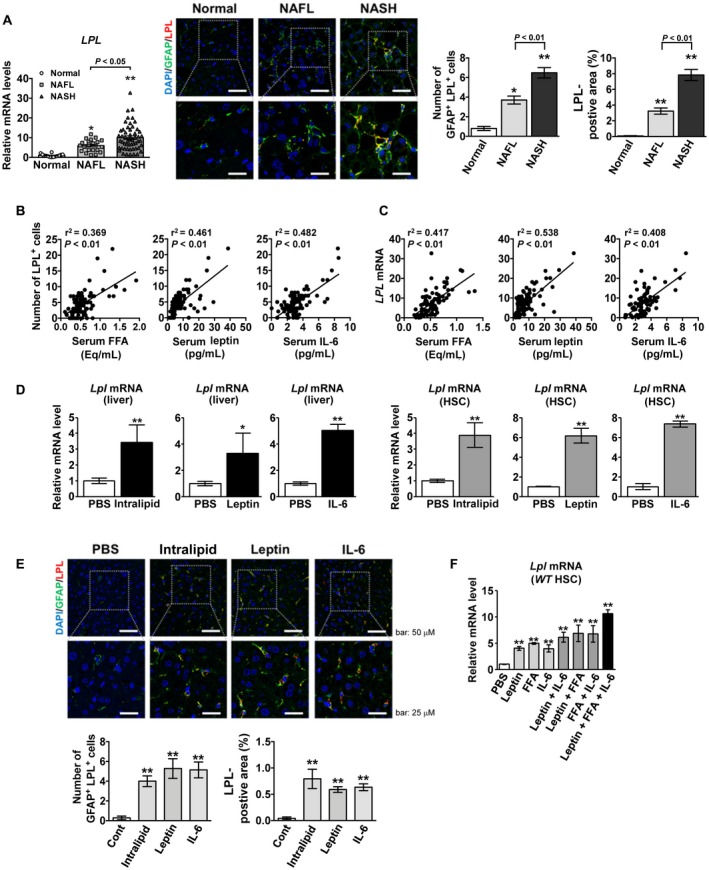
Serum obesity‐related factors elevate LPL expression, specifically in HSCs, in mice and patients with NAFLD. (A‐C) Human serum and liver tissue samples from controls (n = 14), patients with NAFL (n = 21), and patients with NASH (n = 54). (A) (Left panel) Hepatic LPL mRNA expression. (Middle panel) Representative immunofluorescence double‐staining images of GFAP (green) and LPL (red); co‐staining (yellow). Nuclei were stained with 4′,6‐diamidino‐2‐phenylindole (DAPI) (blue). Scale bars: 50 μM (upper) and 25 μM (lower). (Right panel) Quantification of GFAP/LPL double‐positive cells and LPL staining. **P < 0.01 and *P < 0.05 versus control (normal) liver samples. (B) Correlation between the number of hepatic LPL‐positive cells and FFA, leptin, or IL‐6 serum levels. (C) Correlation between hepatic LPL expression and serum FFA, leptin, or IL‐6 levels. (D) Lpl mRNA levels in the liver (left panel) and freshly isolated HSCs (right panel) in wild‐type mice after intravenous administration of phosphate‐buffered saline (PBS), intralipid, leptin, or IL‐6 (n = 5/group). **P < 0.01 and *P < 0.05 versus the PBS‐treated group. (E) (Upper panel) Representative immunofluorescence double‐staining images for GFAP (green) and LPL (red). (Lower panel) Quantification of GFAP/LPL double‐positive cells and LPL staining in liver tissue samples from 8‐week‐old male wild‐type C57BL6/J mice 4 hours after intravenous administration of PBS, intralipid, leptin, or IL‐6 (n = 5/group); co‐staining (yellow). Nuclei were stained with DAPI (blue). Scale bars: 50 μM (upper) and 25 μM (lower). **P < 0.01 versus the PBS‐treated group. (F) Lpl mRNA levels in primary wild‐type C57BL6/J HSCs, freshly isolated, cultured overnight, and treated with various combinations of palmitate (200 μM), leptin (100 ng/mL), and IL‐6 (100 ng/mL) for 6 hours (n = 5/group). **P < 0.01 versus PBS‐treated HSCs.
Serum Obesity‐Related Factors Elevate LPL Expression Through Signal Transducer and Activator of Transcription 3 Signaling in HSCs in Human and Murine NAFLD
Immunofluorescence double staining of phosphorylated signal transducer and activator of transcription 3STAT3 (pSTAT3) and LPL in mouse liver tissues after the intravenous administration of obesity‐related factors revealed that LPL expression is elevated, specifically in pSTAT3‐positive cells (Supporting Fig. S1). In addition, the elevation of LPL mRNA expression in human and mouse primary cultured HSCs following the addition of obesity‐related factors was abolished by the simultaneous administration of a STAT3 inhibitor (Supporting Fig. S1). Immunofluorescence double staining of pSTAT3 and LPL in human NAFLD liver tissues showed that LPL‐positive and pSTAT3‐positive cells almost overlapped (Fig. 2A). The number of pSTAT3/LPL double‐positive cells increased significantly with the progression of NAFLD (Fig. 2A). The number of GFAP/pSTAT3 double‐positive cells was significantly correlated with the number of LPL‐positive cells (Fig. 2A).
Figure 2.
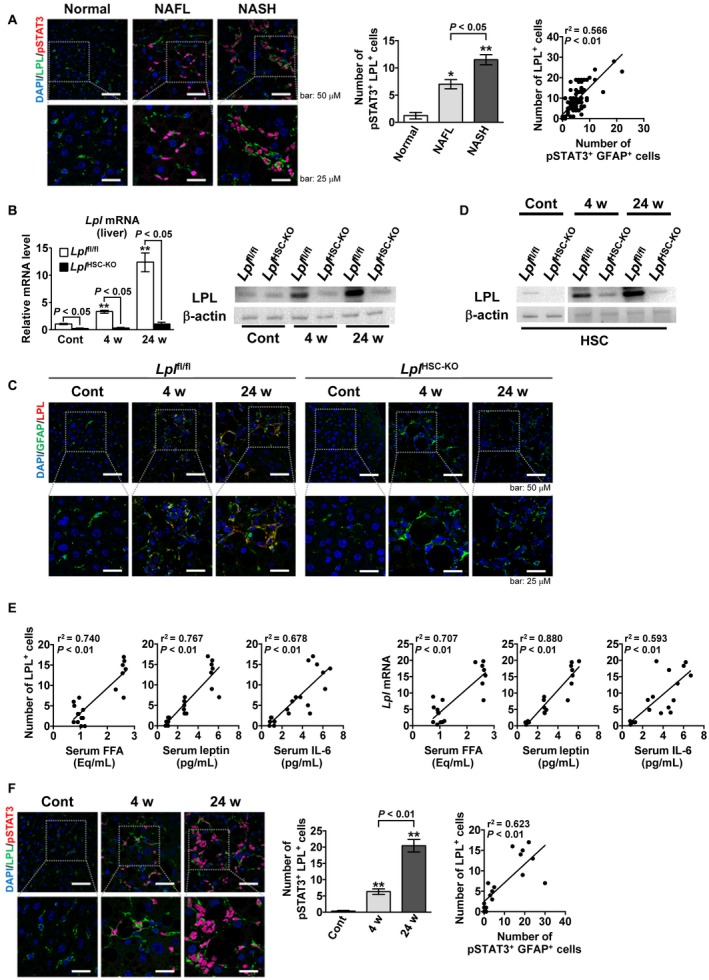
Serum obesity‐related factors elevate LPL expression through STAT3 signaling in HSCs from patients with NAFLD and in a mouse model of NAFLD. (A) Human liver tissue samples from controls (n = 14), patients with NAFL (n = 21), and patients with NASH (n = 54). (Left panel) Representative immunofluorescence double‐staining images of LPL (green) and pSTAT3 (red). Nuclei were stained with DAPI (blue). pSTAT3/nucleus co‐staining (purple). Scale bars: 50 μM (upper) and 25 μM (lower). (Middle panel) Quantification of pSTAT3/LPL double‐positive cells. (Right panel) Correlation between LPL‐positive and pSTAT3/GFAP double‐positive cells. **P < 0.01 and *P < 0.05 versus control (normal) liver samples. (B‐G) Eight‐week‐old male Lplfl/fl and LplHSC‐KO mice were fed an HFC diet for 4 weeks (n = 6/group) or 24 weeks (n = 7/group) to induce the NAFLD mouse model or a control diet for 24 weeks (n = 6/group). (B) (Left panel) Hepatic Lpl mRNA expression. (Right panel) Hepatic LPL expression. **P < 0.01 versus Lplfl/fl mice fed a control diet. (C) Representative immunofluorescence double‐staining images for GFAP (green) and LPL (red) in liver tissue samples; co‐staining (yellow). Nuclei were stained with DAPI (blue). Scale bars: 50 μM (upper) and 25 μM (lower). (D) LPL expression in freshly isolated HSCs. (E) (Left panels) Correlation between the number of hepatic LPL‐positive cells and FFA, leptin, or IL‐6 serum levels in Lplfl/fl mice. (Right panels) Correlation between the hepatic Lpl mRNA expression and FFA, leptin, or IL‐6 serum levels in Lplfl/fl mice. (F) (Left panel) Representative immunofluorescence double‐staining images for LPL (green) and pSTAT3 (red) in liver tissue samples from Lplfl/fl mice. Nuclei were stained with DAPI (blue). pSTAT3/nucleus co‐staining (purple). Scale bars: 50 μM (upper) and 25 μM (lower). (Middle panel) Quantification of hepatic pSTAT3/LPL double‐positive cells in Lplfl/fl mice. (Right panel) Correlation between the number of hepatic LPL‐positive and hepatic pSTAT3/GFAP double‐positive cells in Lplfl/fl mice. **P < 0.01 versus Lplfl/fl mice fed a control diet.
Next, to elucidate the role of LPL in HSCs on NAFLD pathology, LplHSC‐KO mice were generated. LplHSC‐KO mice were obtained by crossing Lplfl/fl mice with Gfap‐CreTg mice. CRE expression was specifically localized in the GFAP‐positive HSCs in the livers of LplHSC‐KO mice as described12 (Supporting Fig. S2). Lplfl/fl and LplHSC‐KO mice were fed an HFC diet for 4 weeks to induce the NAFL model and an HFC diet for 24 weeks to induce the NASH model. Similar to that in human NAFLD, the hepatic Lpl mRNA levels increased significantly with NAFLD progression in our mouse model (Fig. 2B). In LplHSC‐KO mouse livers, the expression of LPL mRNA and protein was scarcely observed (Fig. 2B). Moreover, immunofluorescence double staining of GFAP and LPL showed that LPL is localized to HSCs, and its expression increased with NAFLD progression (Fig. 2C). Using HSCs isolated from the livers of NAFLD mice, we also observed that LPL expression in HSCs significantly increased with the progression of NAFLD (Fig. 2D). Furthermore, the serum levels of obesity‐related factors, such as FFA, leptin and IL‐6, were significantly correlated with the number of LPL‐positive HSCs in the mouse NAFLD model (Fig. 2E). The levels of serum FFA, leptin, and IL‐6 were also significantly correlated with hepatic Lpl mRNA expression (Fig. 2E). Furthermore, immunofluorescence double staining of pSTAT3 and LPL in liver tissues revealed that LPL‐positive and pSTAT3‐positive cells overlap in mouse NAFLD liver similar to the pattern observed in human NAFLD (Fig. 2F). As NAFLD progressed, the number of pSTAT3/LPL double‐positive cells increased significantly (Fig. 2F). Moreover, a significant correlation was observed between the numbers of GFAP/pSTAT3 double‐positive and LPL‐positive cells (Fig. 2F).
LPL Deficiency in HSCs Reduces the Progression of Liver Fibrosis in Murine NAFLD
Lplfl/fl and LplHSC‐KO mice were fed either a control or an HFC diet for 24 weeks to induce NASH. In the NASH mouse model, hepatic fibrosis was significantly enhanced compared with that in control mice; liver fibrosis was significantly reduced in LplHSC‐KO mice compared with that in Lplfl/fl mice, as shown by Masson trichrome (MT) and α‐smooth muscle actin (SMA) staining in the liver (Fig. 3A). The hepatic expression of collagen 1a1 (Col1a1), Col1a2, αSMA (Acta2), and transforming growth factor‐β (Tgfb) mRNA was significantly increased in the NASH model; the hepatic expression of Col1a1, Col1a2, and Acta2 mRNA was significantly reduced in LplHSC‐KO mice compared with that in Lplfl/fl mice (Fig. 3B). In the NASH model, serum alanine aminotransferase (ALT) and liver TG levels were significantly elevated compared with those in control mice. In contrast, no significant differences were observed between Lplfl/fl and LplHSC‐KO mice regarding these levels (Fig. 3C,D). BW, serum TG level, total cholesterol (TC) level, and glucose tolerance were also not significantly different between Lplfl/fl and LplHSC‐KO mice (Supporting Fig. S3). GTT, ITT, and PTT results were not significantly different between Lplfl/fl and LplHSC‐KO mice at each time point (0, 30, 60, and 120 minutes; Supporting Fig. S3). In addition, the hepatic expression of Tnf, Adgre1 and Cd68, markers of Kupffer cell activation and accumulation in the liver, significantly increased in the liver in the NASH model when compared with that in control mice, whereas no significant differences were observed between Lplfl/fl and LplHSC‐KO mice (Fig. 3E). In addition, we did not detect any significant differences in macrophage recruitment to the liver between Lplfl/fl and LplHSC‐KO mice (Supporting Fig. S4).
Figure 3.
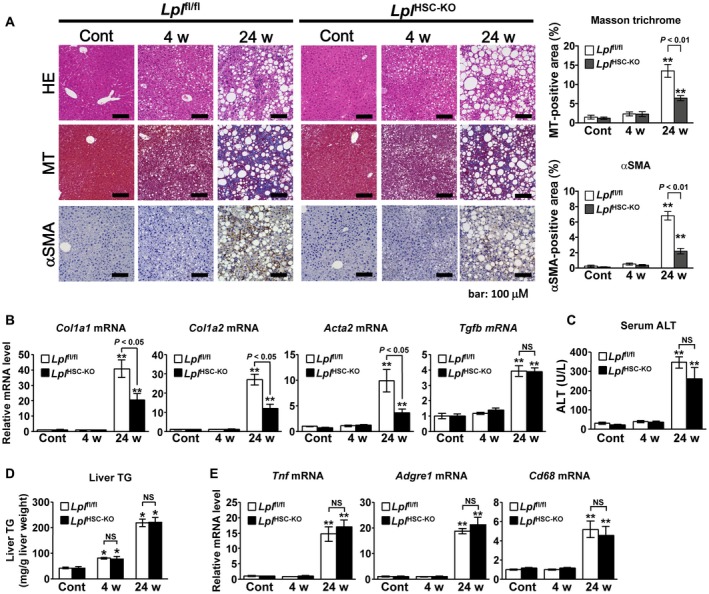
LPL deficiency in HSCs reduces the progression of liver fibrosis in murine NAFLD. Eight‐week‐old male Lplfl/fl and LplHSC‐KO mice were fed an HFC diet for 4 weeks (n = 6/group) or 24 weeks (n = 7/group) to induce an NAFLD mouse model or were fed a control diet for 24 weeks (n = 6/group). (A) (Left panel) Representative hematoxylin and eosin (H&E)–stained, MT‐stained, and αSMA‐immunostained liver sections. Scale bars: 200 μM (H&E‐stained and MT‐stained sections) and 100 μM (αSMA‐immunostained sections). (Right panel) Quantification of MT staining and αSMA staining in liver sections. (B) Hepatic levels of Col1a1, Col1a2, Acta2, and Tgfb mRNA. (C) Serum ALT levels. (D) Hepatic TG levels. (E) Hepatic levels of Tnf, Adgre1, and Cd68 mRNA. **P < 0.01 versus Lplfl/fl mice fed a control diet.
In Murine NASH, LPL Deficiency in HSCs Reduces the Activation of HSCs in a TLR4‐Dependent Manner, Leading to Alleviation of Liver Fibrosis
The Col1a1, Col1a2, and Acta2 mRNA expression in HSCs in the NASH mouse model increased significantly compared with that in HSCs from control mice; this increase in expression was significantly reduced in LplHSC‐KO HSCs compared with that in Lplfl/fl HSCs (Fig. 4A). In Lplfl/fl HSCs, the mRNA levels of bone morphogenetic protein and activin membrane–bound inhibitor (Bambi), a pseudoreceptor of TGF‐β, were significantly lower in the NASH mouse model than in control mice; in addition, they were significantly higher in LplHSC‐KO HSCs than in Lplfl/fl HSCs (Fig. 4A). In Lplfl/fl HSCs, TLR4 protein levels significantly increased in NASH mice when compared with those in control mice; this increase was significantly suppressed in LplHSC‐KO HSCs compared with that in Lplfl/fl HSCs (Fig. 4B). However, we also observed no significant differences in Tlr4 mRNA levels in HSCs among these groups (Fig. 4B).
Figure 4.
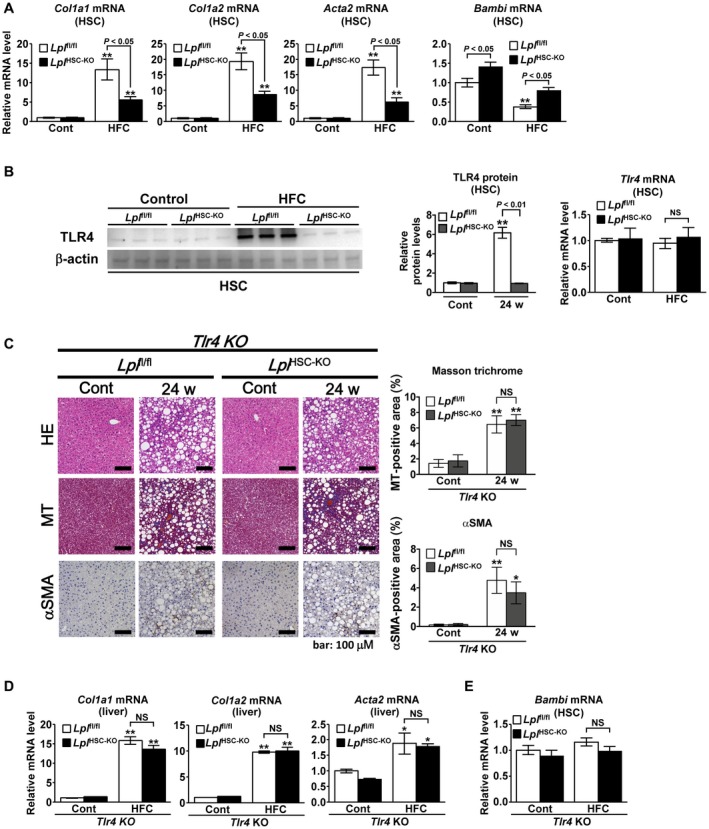
LPL deficiency in HSCs reduces the activation of HSCs in a TLR4‐dependent manner in murine NASH. (A,B) Eight‐week‐old male Lplfl/f l and LplHSC‐KO mice were fed a control diet (n = 6/group) or an HFC diet (n = 7/group) for 24 weeks. (A) Quantification of Col1a1, Col1a2, Acta2, and Bambi mRNA in HSCs freshly isolated from mice. (B) (Left panel) Western blot analysis and quantification of TLR4 protein levels in freshly isolated HSCs. (Right panel) Quantification of Tlr4 mRNA in freshly isolated HSCs. **P < 0.01 versus HSCs from Lplfl/fl mice fed a control diet. (C‐E) Eight‐week‐old male Tlr4−/−Lplfl/fl and Tlr4−/−LplHSC‐KO mice were fed a control diet or an HFC diet for 24 weeks (n = 5/group). (C) (Left panel) Representative H&E‐stained, MT‐stained, and αSMA‐immunostained liver sections. Scale bars: 200 μM (H&E‐stained and MT‐stained sections) and 100 μM (αSMA‐immunostained sections). (Right panel) Quantification of MT staining and αSMA staining in liver sections. (D) Hepatic levels of Col1a1, Col1a2, and Acta2 mRNA. (E) Quantification of Bambi mRNA in freshly isolated HSCs. **P < 0.01 and *P < 0.05 versus Tlr4−/−Lplfl/fl mice fed a control diet.
Therefore, we generated double‐mutant Tlr4−/−Lplfl/fl and Tlr4−/−LplHSC‐KO mice, to clarify whether LPL expression in HSCs exacerbates liver fibrosis in NASH through TLR4 signaling. The double‐mutant mice were fed an HFC diet for 24 weeks to induce NASH; we could not observe any significant differences in liver fibrosis and HSC activation between Tlr4−/−Lplfl/fl and Tlr4−/−LplHSC‐KO mice, as shown by MT and αSMA staining (Fig. 4C). Moreover, no significant differences in the hepatic mRNA expression of Col1a1, Col1a2, and Acta2 or in Bambi mRNA levels in HSCs were observed between these mouse strains (Fig. 4D,E). These results and the results in Fig. 3 revealed that LPL deficiency in HSCs reduces the progression of liver fibrosis in murine NAFLD in a TLR4‐dependent manner. Furthermore, no significant differences in serum ALT levels or the hepatic mRNA levels of Tnf, Adgre1, and Cd68 were observed between Tlr4−/−Lplfl/fl and Tlr4−/−LplHSC‐KO mice (Supporting Fig. S5).
Nonenzymatic Effect of LPL Plays a Key Role in Cholesterol Uptake in HSCs in Murine NASH
Lplfl/fl and LplHSC‐KO mice were fed either a control or an HFC diet for 24 weeks to induce NASH. The accumulation of TC and free cholesterol (FC) in HSCs significantly increased in NASH mice when compared with that in control mice; the increase was significantly reduced in HSCs derived from LplHSC‐KO mice compared with that in HSCs from Lplfl/fl mice (Fig. 5A). No significant differences in TC and FC accumulation were observed between the livers of LplHSC‐KO and Lplfl/fl mice (Fig. 5B). Next, to investigate the role of LPL in cholesterol uptake in HSCs, we examined cholesterol uptake into HSCs when intravenously administering 14C‐labeled lipoproteins to NASH or control mice. The 14C‐labeled chylomicron uptake into HSCs in Lplfl/fl mice was significantly elevated in the NASH mouse model compared with that in control mice; this increase was significantly suppressed in LplHSC‐KO mice compared with that in Lplfl/fl mice (Fig. 5C). Furthermore, the uptake was not affected by the pre‐administration of an LPL enzyme inhibitor, orlistat, into the mice (Fig. 5C). Similarly, the 14C‐labeled very low‐density lipoprotein (VLDL) or low‐density lipoprotein (LDL) uptake into HSCs in Lplfl/fl mice was significantly elevated in the NASH mouse model compared with that in control mice; this increase was significantly suppressed in LplHSC‐KO mice compared with that in Lplfl/fl mice (Fig. 5D,E). Uptake levels were not affected by the pre‐administration of orlistat into the mice (Fig. 5D,E). Orlistat inhibits the enzyme activity of LPL, but it does not inhibit the nonenzymatic function of LPL, which means that nonenzymatic effect of LPL plays a key role in cholesterol uptake in HSCs in murine NASH. In contrast, the uptake of 14C‐labeled high‐density lipoprotein (HDL) into HSCs did not lead to any significant differences among the treated groups and was not affected by the pre‐administration of orlistat into the mice (Fig. 5F). Furthermore, the total liver uptake of each of the 14C‐labeled chylomicrons, VLDL, LDL and HDL, did not show any significant differences among the treated groups (Fig. 5C‐F).
Figure 5.
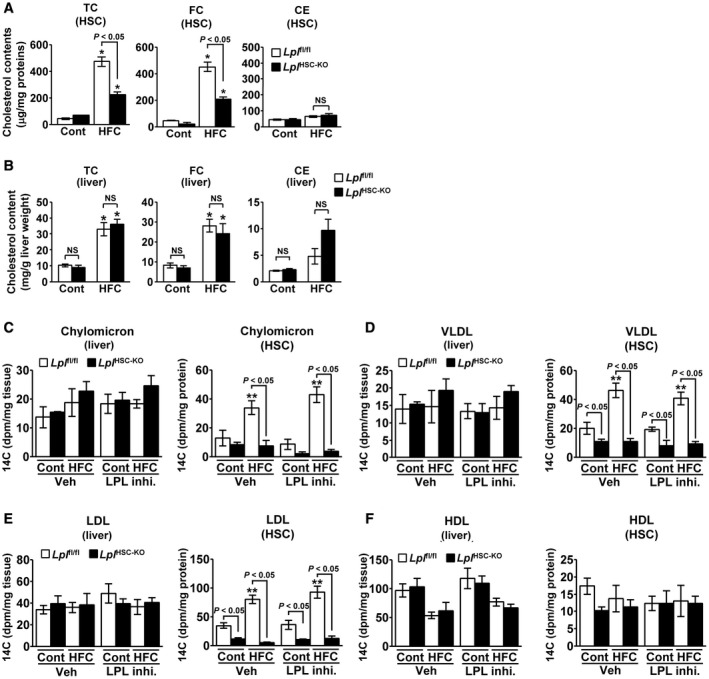
Nonenzymatic effect of LPL plays an important role in cholesterol uptake in HSCs in murine NASH. (A,B) Eight‐week‐old male Lplfl/f l and LplHSC‐KO mice were fed a control diet (n = 6/group) or an HFC diet (n = 7/group) for 24 weeks. (A) Quantification of the TC, FC, and cholesterol ester (CE) content in HSCs freshly isolated from mice. (B) Hepatic levels of TC, FC, and CE. *P < 0.05 versus Lplfl/fl mice fed a control diet. (C‐F) Livers of Lplfl/f l or LplHSC‐KO mice, which had been fed a control diet or an HFC diet for 24 weeks and then given the LPL enzyme inhibitor orlistat or vehicle, were perfused with 14C‐labeled lipoproteins (n = 5/group). (C) Quantification of 14C‐labeled chylomicrons in livers and freshly isolated HSCs. (D) Quantification of 14C‐labeled VLDL in livers and freshly isolated HSCs. (E) Quantification of 14C‐labeled LDL in livers and freshly isolated HSCs. (F) Quantification of 14C‐labeled HDL in livers and freshly isolated HSCs. **P < 0.01 versus Lplfl/fl mice fed a control diet and administered vehicle.
Nonenzymatic Cholesterol Uptake Into HSCs Through LPL Promotes TGF‐β‐Induced HSC Activation
The effect of cholesterol uptake by LPL on HSC activation was examined using primary cultured Lplfl/fl and LplHSC‐KO HSCs. The administration of chylomicrons or LDL significantly increased the amount of TC and FC in Lplfl/fl HSCs, whereas LPL deficiency significantly suppressed this increase (Fig. 6A). Cholesterol uptake was not affected by the simultaneous administration of orlistat (Fig. 6A). Furthermore, the simultaneous administration of methyl‐β‐cyclodextrin (MβCD), a membrane‐impermeable cholesterol‐binding agent that depletes cholesterol,14, 15 depleted FC in HSCs (Fig. 6A).
Figure 6.
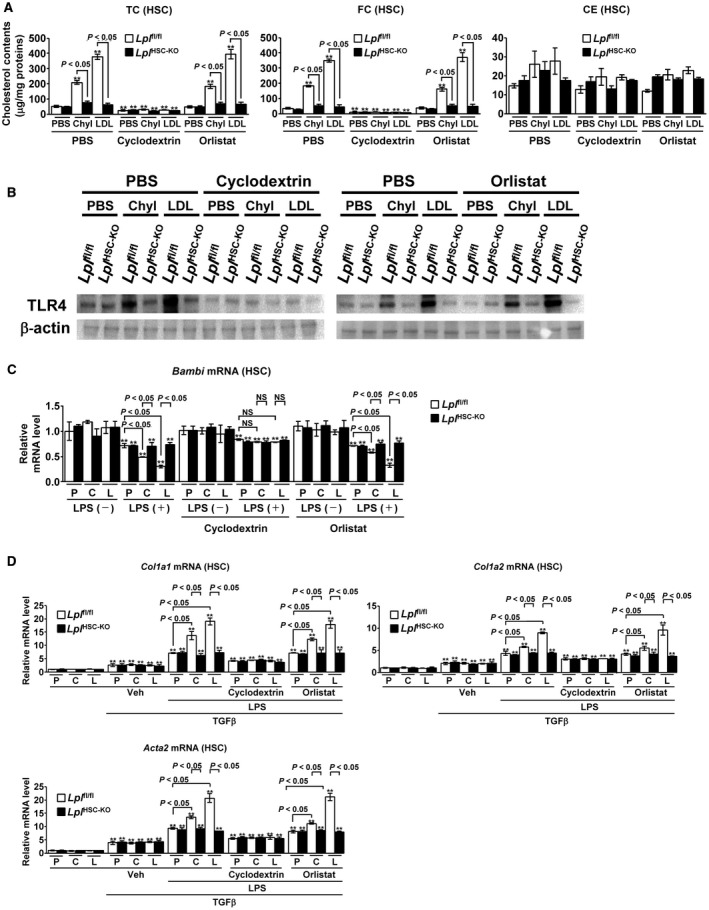
Nonenzymatic cholesterol uptake into HSCs by LPL promotes the TGF‐β‐induced HSC activation. (A,B) Primary Lplfl/f l or LplHSC‐KO HSCs were freshly isolated, cultured overnight, and treated with PBS, chylomicrons (200 μg/mL), or LDL (200 μg/mL) for 6 hours after the addition of PBS, MβCD (4 mM), or orlistat (75 μM) (n = 5/group). (A) Quantification of TC, FC, and CE levels in HSCs. (B) TLR4 protein levels in HSCs. **P < 0.01 versus control Lplfl/fl HSCs treated with PBS. (C,D) Primary Lplfl/f l or LplHSC‐KO HSCs were freshly isolated, cultured overnight, and treated with PBS, chylomicrons (200 μg/mL), or LDL (200 μg/mL) for 6 hours after the addition of PBS, MβCD (4 mM), or orlistat (75 μM). The HSCs were further treated with LPS (100 ng/mL) for 6 hours and then stimulated with TGF‐β (1 ng/mL) for 6 hours (n = 5/group). (C) Quantification of Bambi mRNA in HSCs. (D) Quantification of Col1a1, Col1a2, and Acta2 mRNA in HSCs. **P < 0.01 versus control Lplfl/fl HSCs treated with PBS.
Next, we evaluated the TLR4 protein levels in HSCs. The TLR4 protein expression was consistent with the intracellular FC level in HSCs; TLR4 levels significantly increased following the administration of chylomicrons or LDL in Lplfl/fl HSCs, whereas this increase was significantly suppressed in LplHSC‐KO HSCs compared with that in Lplfl/fl HSCs (Fig. 6B). The concurrent administration of MβCD dramatically decreased TLR4 protein levels in HSCs, whereas the levels were not affected by the simultaneous administration of orlistat (Fig. 6B). Accumulation of FC in HSCs increases TLR4 protein levels through the suppression of the endosomal‐lysosomal TLR4 pathway.13, 16 These results clarified that the nonenzymatic effect of LPL to increase TLR4 protein in HSCs was intracellular FC‐dependent. Lipopolysaccharide (LPS) administration reduced the mRNA expression of Bambi, a downstream molecule in TLR4 signaling, in primary cultured HSCs. Furthermore, the concurrent pre‐administration of chylomicrons or LDL significantly decreased the Bambi mRNA levels in Lplfl/fl HSCs, whereas the decrease was not observed in LplHSC‐KO HSCs (Fig. 6C). Treatment with orlistat did not affect the expression of Bambi mRNA, and the simultaneous administration of cyclodextrin abolished the changes in Bambi expression induced by the administration of chylomicrons or LDL (Fig. 6C).
Finally, we examined the effect of LPL expression in HSCs on the TGF‐β‐induced HSC activation. The expression of Col1a1, Col1a2, and Acta2 mRNA significantly increased following the administration of TGF‐β, but was not affected by the pre‐administration of chylomicrons or LDL (Fig. 6D). LPS pre‐administration enhanced the TGF‐β‐induced HSC activation, and significantly enhanced the increase in Col1a1, Col1a2, and Acta2 mRNA expression caused by TGF‐β. In addition, in Lplfl/fl HSCs, Col1a1, Col1a2, and Acta2 expression was significantly increased by the pre‐administration of chylomicrons or LDL, but these changes were not observed in LplHSC‐KO HSCs (Fig. 6D). The increase in Col1a1, Col1a2, and Acta2 mRNA expression induced by the pre‐administration of chylomicrons or LDL was abolished following cholesterol depletion by cyclodextrin. In addition, the simultaneous administration of orlistat did not affect the expression of Col1a1, Col1a2, and Acta2 mRNA in HSCs (Fig. 6D).
LPL expression in HSCs did not significantly increase in the livers of patients with autoimmune hepatitis as another type of underlying human liver disease (Supporting Fig. S6). Hepatic LPL mRNA expression was not significantly correlated with liver fibrosis stages in patients with NASH (Supporting Fig. S7). LPL expression in HSCs also did not significantly increase in the mouse carbon tetrachloride (CCl4) model of liver fibrosis (Supporting Fig. S8). Furthermore, there were no significant differences in liver fibrosis progression in the mouse CCl4 model of liver fibrosis between Lplfl/fl and LplHSC‐KO mice (Supporting Fig. S8).
Discussion
In the present study, we revealed a pathogenic mechanism underlying NASH development and a role for LPL in the pathology of this disease. In NASH, serum obesity‐related factors increased LPL expression, specifically in HSCs, through STAT3 signaling. The increase in LPL expression enhanced the accumulation of FC in HSCs by increasing cholesterol uptake, which promoted TLR4 signaling and the suppression of Bambi expression. As a result, HSCs became susceptible to TGF‐β‐induced HSC activation, and liver fibrosis was promoted in NASH.
LPL has been known to play a central role in the regulation of the lipid metabolism and control of the energy balance in the body by exerting its action primarily in the adipose tissue, skeletal muscle and heart,7 whereas LPL is barely expressed in the normal adult liver.10 Therefore, the roles of hepatic LPL in human pathology have remained unclear. Some studies17, 18 report that the expression of hepatic LPL mRNA is significantly elevated in human NAFL livers compared with that in normal livers; these reports did not address in which liver cells LPL expression was detected. Moreover, LPL overexpression in the mouse liver causes liver‐specific insulin resistance and exacerbates the accumulation of TG in the liver19; this is presumed to be due to LPL overexpression in hepatocytes in an artificial state.
In the present study, we demonstrated that LPL expression is enhanced in HSCs, not in hepatocytes, in human and mouse NAFLD. In addition, the change in LPL expression in HSCs did not affect the hepatic TG accumulation, dyslipidemia, or insulin tolerance. Most previous reports on LPL expression in the liver have assumed that LPL is expressed only in hepatocytes; therefore, it is necessary to reexamine LPL expression in HSCs.
We have also shown that serum obesity‐related factors, such as leptin, IL‐6 and FFA, increase LPL expression in HSCs through STAT3 signaling in both humans and mice. NASH is often accompanied by obesity as a background factor, and it is assumed that obesity triggers NASH development. In obesity, the mobilization of FFA from the adipose tissue to the liver increases, which results in an exacerbation of fatty liver20 and the elevation of serum FFA.21 In addition, the serum concentrations of proinflammatory adipocytokines, such as leptin and IL‐6, significantly increase in obesity.22 In contrast, some reports, including ours,12, 21, 22, 23, 24, 25 have shown that the serum levels of obesity‐related factors significantly increase with the progression of NAFLD in humans and mice. Each obesity‐related factor is known to enhance STAT3 signaling.26, 27, 28 We have recently shown that these serum obesity‐related factors enhance STAT3 signaling in HSCs as NAFLD progresses.12 Furthermore, it has been reported that the putative STAT3‐binding site is present in the LPL promoter and that STAT3 signaling increases LPL expression.29 Our in vivo and in vitro studies have revealed that these elevated levels of serum obesity‐related factors increase LPL expression in HSCs in NAFLD through the activation of STAT3 signaling.
In the present in vivo and in vitro studies, the increased LPL expression in HSCs enhanced cholesterol uptake from serum lipoproteins into HSCs in an autocrine manner, independent of LPL activity. LPL is known to be a lipase with a key role in hydrolyzing TGs from TG‐rich lipoproteins, whereas many reports have shown that it has an additional bridging function, promoting the binding of different lipoproteins to their receptors, independent of its enzyme activity.8, 9, 30 LPL enhances lipoprotein uptake into various cells by pathways that are independent of LPL enzyme activity but require LPL as a molecular bridge between lipoproteins and heparan sulfate proteoglycans (HSPGs) or lipoprotein receptors.31, 32, 33, 34, 35 Thus, LPL can bridge lipoproteins and HSPGs, which could concentrate lipoproteins in the vicinity of receptors, resulting in a rapid receptor‐dependent uptake.34, 36 Alternatively, bound lipoproteins could be taken up by cells along with proteoglycans as the latter are recycled.34, 36 In our study, LPL in HSCs significantly increased cholesterol uptake into HSCs from each of the serum lipoproteins tested (chylomicrons, VLDL, and LDL), independent of its enzyme activity. We also revealed that LPL in HSCs plays a central role in the uptake of cholesterol into HSCs and the subsequent enhanced accumulation of FC in HSCs, as its deficiency significantly inhibits this uptake and decreases the accumulation of FC. LPL in HSCs had no effect on lipoprotein uptake or FC accumulation in the whole liver, which means that LPL in HSCs acts in an autocrine manner.
The increase in LPL expression led to the accumulation of FC in HSCs, which in turn increased the TLR4 protein levels. We showed that FC accumulation in HSCs increases TLR4 protein levels through the suppression of the endosomal‐lysosomal TLR4 pathway and, as a result, enhances TLR4 signaling.13, 16 In the present study, the administration of chylomicrons or LDL significantly increased the amount of FC in HSCs through nonenzymatic LPL function, and then the FC accumulation significantly increased TLR4 protein levels in HSCs. These results clarified that the LPL‐induced increase in TLR4 protein in HSCs was intracellular FC‐dependent, not transcriptionally mediated. Furthermore, we have shown that the exacerbation of the progression of liver fibrosis in NASH, due to the enhanced LPL expression in HSCs, is TLR4‐dependent. In HSCs with enhanced LPL expression, the expression of the TGF‐β‐pseudoreceptor Bambi, a downstream molecule involved in TLR4 signaling, decreased with TLR4 signal potentiation. This triggered the HSC susceptibility to TGF‐β‐mediated activation and resulted in the exacerbation of liver fibrosis in NASH. Conversely, LPL deficiency in HSCs had no effect on hepatocellular damage or macrophage activation in NASH, which suggests that HSC‐derived LPL could modulate the pathology of NASH, primarily by acting in an autocrine fashion.
Thus, in this study, we reveal pathological mechanisms underlying liver fibrosis in NASH and the role of LPL in the pathology of this disease. We showed that in NAFLD, serum obesity‐related factors increase LPL production, specifically in HSCs, but not in hepatocytes. The enhanced expression of LPL in HSCs increases cholesterol uptake from serum lipoproteins into HSCs, independently of LPL activity. Moreover, it makes HSCs susceptible to TGF‐β‐induced activation through FC accumulation, followed by an increase in TLR4 signaling; this further results in the exacerbation of liver fibrosis in NASH. Therefore, this LPL‐mediated HSC activation pathway may represent a promising therapeutic target for liver fibrosis in NASH, and large‐scale future clinical investigations should be considered.
Supporting information
Supported by a Grant‐in‐Aid for Scientific Research from the Ministry of Education, Culture, Sports, Science, and Technology of Japan (15K09031).
Potential conflict of interest: Nothing to report.
References
Author names in bold designate shared co‐first authorship.
- 1. Diehl AM, Day C. Cause, pathogenesis, and treatment of nonalcoholic steatohepatitis. N Engl J Med 2017;377:2063‐2072. [DOI] [PubMed] [Google Scholar]
- 2. Wong RJ, Aguilar M, Cheung R, Perumpail RB, Harrison SA, Younossi ZM, et al. Nonalcoholic steatohepatitis is the second leading etiology of liver disease among adults awaiting liver transplantation in the United States. Gastroenterology 2015;148:547‐555. [DOI] [PubMed] [Google Scholar]
- 3. Day CP, James OF. Steatohepatitis: a tale of two “hits”? Gastroenterology 1998;114:842‐845. [DOI] [PubMed] [Google Scholar]
- 4. Tilg H, Moschen AR. Evolution of inflammation in nonalcoholic fatty liver disease: the multiple parallel hits hypothesis. Hepatology 2010;52:1836‐1846. [DOI] [PubMed] [Google Scholar]
- 5. Ekstedt M, Hagstrom H, Nasr P, Fredrikson M, Stal P, Kechagias S, et al. Fibrosis stage is the strongest predictor for disease‐specific mortality in NAFLD after up to 33 years of follow‐up. Hepatology 2015;61:1547‐1554. [DOI] [PubMed] [Google Scholar]
- 6. Angulo P, Kleiner DE, Dam‐Larsen S, Adams LA, Bjornsson ES, Charatcharoenwitthaya P, et al. Liver fibrosis, but no other histologic features, is associated with long‐term outcomes of patients with nonalcoholic fatty liver disease. Gastroenterology 2015;149:389‐397, e310. [DOI] [PMC free article] [PubMed] [Google Scholar]
- 7. Li Y, He PP, Zhang DW, Zheng XL, Cayabyab FS, Yin WD, et al. Lipoprotein lipase: from gene to atherosclerosis. Atherosclerosis 2014;237:597‐608. [DOI] [PubMed] [Google Scholar]
- 8. Kobayashi J, Mabuchi H. Lipoprotein lipase and atherosclerosis. Ann Clin Biochem 2015;52:632‐637. [DOI] [PubMed] [Google Scholar]
- 9. Wang H, Eckel RH. Lipoprotein lipase: from gene to obesity. Am J Physiol Endocrinol Metab 2009;297:E271‐E288. [DOI] [PubMed] [Google Scholar]
- 10. Peinado‐Onsurbe J, Staels B, Deeb S, Ramirez I, Llobera M, Auwerx J. Neonatal extinction of liver lipoprotein lipase expression. Biochim Biophys Acta 1992;1131:281‐286. [DOI] [PubMed] [Google Scholar]
- 11. Perry RJ, Samuel VT, Petersen KF, Shulman GI. The role of hepatic lipids in hepatic insulin resistance and type 2 diabetes. Nature 2014;510:84‐91. [DOI] [PMC free article] [PubMed] [Google Scholar]
- 12. Teratani T, Tomita K, Suzuki T, Furuhashi H, Irie R, Nishikawa M, et al. Aortic carboxypeptidase‐like protein, a WNT ligand, exacerbates nonalcoholic steatohepatitis. J Clin Invest 2018;128:1581‐1596. [DOI] [PMC free article] [PubMed] [Google Scholar]
- 13. Tomita K, Teratani T, Suzuki T, Shimizu M, Sato H, Narimatsu K, et al. Free cholesterol accumulation in hepatic stellate cells: mechanism of liver fibrosis aggravation in nonalcoholic steatohepatitis in mice. Hepatology 2014;59:154‐169. [DOI] [PubMed] [Google Scholar]
- 14. Mandal SK, Iakhiaev A, Pendurthi UR, Rao LV. Acute cholesterol depletion impairs functional expression of tissue factor in fibroblasts: modulation of tissue factor activity by membrane cholesterol. Blood 2005;105:153‐160. [DOI] [PMC free article] [PubMed] [Google Scholar]
- 15. Tomita K, Teratani T, Suzuki T, Shimizu M, Sato H, Narimatsu K, et al. Acyl‐CoA:cholesterol acyltransferase 1 mediates liver fibrosis by regulating free cholesterol accumulation in hepatic stellate cells. J Hepatol 2014;61:98‐106. [DOI] [PubMed] [Google Scholar]
- 16. Teratani T, Tomita K, Suzuki T, Oshikawa T, Yokoyama H, Shimamura K, et al. A high‐cholesterol diet exacerbates liver fibrosis in mice via accumulation of free cholesterol in hepatic stellate cells. Gastroenterology 2012;142:152‐164.e110. [DOI] [PubMed] [Google Scholar]
- 17. Westerbacka J, Kolak M, Kiviluoto T, Arkkila P, Siren J, Hamsten A, et al. Genes involved in fatty acid partitioning and binding, lipolysis, monocyte/macrophage recruitment, and inflammation are overexpressed in the human fatty liver of insulin‐resistant subjects. Diabetes 2007;56:2759‐2765. [DOI] [PubMed] [Google Scholar]
- 18. Pardina E, Baena‐Fustegueras JA, Llamas R, Catalan R, Galard R, Lecube A, et al. Lipoprotein lipase expression in livers of morbidly obese patients could be responsible for liver steatosis. Obes Surg 2009;19:608‐616. [DOI] [PubMed] [Google Scholar]
- 19. Kim JK, Fillmore JJ, Chen Y, Yu C, Moore IK, Pypaert M, et al. Tissue‐specific overexpression of lipoprotein lipase causes tissue‐specific insulin resistance. Proc Natl Acad Sci U S A 2001;98:7522‐7527. [DOI] [PMC free article] [PubMed] [Google Scholar]
- 20. Cohen JC, Horton JD, Hobbs HH. Human fatty liver disease: old questions and new insights. Science 2011;332:1519‐1523. [DOI] [PMC free article] [PubMed] [Google Scholar]
- 21. Zhang J, Zhao Y, Xu C, Hong Y, Lu H, Wu J, et al. Association between serum free fatty acid levels and nonalcoholic fatty liver disease: a cross‐sectional study. Sci Rep 2014;4:5832. [DOI] [PMC free article] [PubMed] [Google Scholar]
- 22. Ouchi N, Parker JL, Lugus JJ, Walsh K. Adipokines in inflammation and metabolic disease. Nat Rev Immunol 2011;11:85‐97. [DOI] [PMC free article] [PubMed] [Google Scholar]
- 23. Tiniakos DG, Vos MB, Brunt EM. Nonalcoholic fatty liver disease: pathology and pathogenesis. Annu Rev Pathol 2010;5:145‐171. [DOI] [PubMed] [Google Scholar]
- 24. Duarte N, Coelho IC, Patarrao RS, Almeida JI, Penha‐Goncalves C, Macedo MP. How inflammation impinges on NAFLD: a role for Kupffer cells. Biomed Res Int 2015;2015:984578. [DOI] [PMC free article] [PubMed] [Google Scholar]
- 25. Polyzos SA, Aronis KN, Kountouras J, Raptis DD, Vasiloglou MF, Mantzoros CS. Circulating leptin in non‐alcoholic fatty liver disease: a systematic review and meta‐analysis. Diabetologia 2016;59:30‐43. [DOI] [PubMed] [Google Scholar]
- 26. Meng F, Wang K, Aoyama T, Grivennikov SI, Paik Y, Scholten D, et al. Interleukin‐17 signaling in inflammatory, Kupffer cells, and hepatic stellate cells exacerbates liver fibrosis in mice. Gastroenterology 2012;143:765‐776, e763. [DOI] [PMC free article] [PubMed] [Google Scholar]
- 27. Saxena NK, Ikeda K, Rockey DC, Friedman SL, Anania FA. Leptin in hepatic fibrosis: evidence for increased collagen production in stellate cells and lean littermates of ob/ob mice. Hepatology 2002;35:762‐771. [DOI] [PMC free article] [PubMed] [Google Scholar]
- 28. Mashili F, Chibalin AV, Krook A, Zierath JR. Constitutive STAT3 phosphorylation contributes to skeletal muscle insulin resistance in type 2 diabetes. Diabetes 2013;62:457‐465. [DOI] [PMC free article] [PubMed] [Google Scholar]
- 29. Rozovski U, Grgurevic S, Bueso‐Ramos C, Harris DM, Li P, Liu Z, et al. Aberrant LPL expression, driven by STAT3, mediates free fatty acid metabolism in CLL cells. Mol Cancer Res 2015;13:944‐953. [DOI] [PMC free article] [PubMed] [Google Scholar]
- 30. Bharadwaj KG, Hiyama Y, Hu Y, Huggins LA, Ramakrishnan R, Abumrad NA, et al. Chylomicron‐ and VLDL‐derived lipids enter the heart through different pathways: in vivo evidence for receptor‐ and non‐receptor‐mediated fatty acid uptake. J Biol Chem 2010;285:37976‐37986. [DOI] [PMC free article] [PubMed] [Google Scholar]
- 31. Rumsey SC, Obunike JC, Arad Y, Deckelbaum RJ, Goldberg IJ. Lipoprotein lipase‐mediated uptake and degradation of low density lipoproteins by fibroblasts and macrophages. J Clin Invest 1992;90:1504‐1512. [DOI] [PMC free article] [PubMed] [Google Scholar]
- 32. Williams KJ, Fless GM, Petrie KA, Snyder ML, Brocia RW, Swenson TL. Mechanisms by which lipoprotein lipase alters cellular metabolism of lipoprotein(a), low density lipoprotein, and nascent lipoproteins. Roles for low density lipoprotein receptors and heparan sulfate proteoglycans. J Biol Chem 1992;267:13284‐13292. [PubMed] [Google Scholar]
- 33. Chappell DA, Fry GL, Waknitz MA, Muhonen LE, Pladet MW, Iverius PH, et al. Lipoprotein lipase induces catabolism of normal triglyceride‐rich lipoproteins via the low density lipoprotein receptor‐related protein/alpha 2‐macroglobulin receptor in vitro: a process facilitated by cell‐surface proteoglycans. J Biol Chem 1993;268:14168‐14175. [PubMed] [Google Scholar]
- 34. Merkel M, Kako Y, Radner H, Cho IS, Ramasamy R, Brunzell JD, et al. Catalytically inactive lipoprotein lipase expression in muscle of transgenic mice increases very low density lipoprotein uptake: direct evidence that lipoprotein lipase bridging occurs in vivo . Proc Natl Acad Sci U S A 1998;95:13841‐13846. [DOI] [PMC free article] [PubMed] [Google Scholar]
- 35. Nykjaer A, Bengtsson‐Olivecrona G, Lookene A, Moestrup SK, Petersen CM, Weber W, et al. The alpha 2‐macroglobulin receptor/low density lipoprotein receptor‐related protein binds lipoprotein lipase and beta‐migrating very low density lipoprotein associated with the lipase. J Biol Chem 1993;268:15048‐15055. [PubMed] [Google Scholar]
- 36. Mulder M, Lombardi P, Jansen H, van Berkel TJ, Frants RR, Havekes LM. Low density lipoprotein receptor internalizes low density and very low density lipoproteins that are bound to heparan sulfate proteoglycans via lipoprotein lipase. J Biol Chem 1993;268:9369‐9375. [PubMed] [Google Scholar]
Associated Data
This section collects any data citations, data availability statements, or supplementary materials included in this article.
Supplementary Materials