

Abstract
Previous positron emission tomography (PET) studies with levodopa analogs have revealed a modestly increased capacity for dopamine synthesis in the striatum of patients with schizophrenia compared with healthy age-matched control subjects. We hypothesized that not just the synthesis but also the turnover of radiolabeled dopamine is elevated in patients. To test the hypothesis, we reanalyzed 2-h-long [18F]fluorodopa (FDOPA)/PET recordings from eight unmedicated patients with schizophrenia and 15 healthy age-matched control subjects, using new methods for the quantification of [18F]fluorodopamine steady-state kinetics. The fractional rate constant for the catabolism and elimination of [18F]fluorodopamine was elevated nearly twofold in striatum, the largest biochemical difference in brain of schizophrenics yet reported. The magnitude of the intrinsic blood–brain FDOPA clearance with correction for this loss of [18F]fluorodopamine metabolites was increased by 20% in caudate and putamen and by 50% in amygdala and midbrain of the patients. However, the magnitude of the steady-state storage of FDOPA and its decarboxylated metabolites (Vd) was reduced by one-third in the caudate nucleus and amygdala of the schizophrenic group. Thus, reduced steady-state storage of [18F]fluorodopamine occurs in the midst of accelerated synthesis in brain of untreated patients. Positive scores of the positive and negative syndrome scale correlated inversely with the magnitude of Vd in amygdala, suggesting an association between positive symptoms and impaired steady-state storage of FDOPA metabolites in that structure.
Keywords: FDOPA, PET, schizophrenia, dopamine, turnover, steady-state storage
Introduction
Positron emission tomography (PET) studies with the l-3,4-dihydroxyphenylalanine (DOPA) decarboxylase substrates [18F]fluorodopa (FDOPA) (Gjedde et al., 1991; Huang et al., 1991; Kuwabara et al., 1993; Cumming et al., 2001) and l-[11C]DOPA reveal the retention of decarboxylated metabolites in synaptic vesicles, which are highly concentrated in nigrostriatal dopamine fibers. In an early quantitative FDOPA/PET study, the relative activity of DOPA decarboxylase (K3D, (min−1) was increased in the striatum of unmedicated patients with schizophrenia (Reith et al., 1994), a finding subsequently replicated in several other studies with FDOPA (Hietala et al., 1995, 1999; Meyer-Lindenberg et al., 2002) and l-[11C]DOPA (Lindström et al., 1999; Gefvert et al., 2003); particularly high net clearance of FDOPA to the ventral striatum was noted in a group of patients with schizophrenia (McGowan et al., 2004). These previous PET studies of schizophrenia, in analogy to the classic deoxyglucose model for measuring metabolic rate (Gjedde, 1981, 1982; Patlak et al., 1983; Patlak and Blasberg, 1985), have all assumed irreversible trapping of tracer metabolites formed in brain. However, this assumption was shown to be violated in one of the earliest presentations of the FDOPA compartmental analysis (Huang et al., 1991; Cumming and Gjedde, 1998), a violation resulting in underestimation of the true magnitude of FDOPA utilization in living brain (Cumming et al., 2001). To date, PET studies with DOPA decarboxylase substrates in patients with schizophrenia have used incomplete kinetic models, not accommodating the dynamics of the entire pathway for dopamine synthesis and turnover but incorrectly assuming irreversible trapping of the decarboxylated radiotracers.
To correct for violation of the assumption of irreversible metabolite trapping, steady-state FDOPA kinetics have been estimated from time–activity curves recorded during 240 min (Holden et al., 1997; Cumming et al., 2001; Sossi et al., 2001), a requirement that can be very difficult to satisfy in clinical PET studies. Early attempts to estimate FDOPA steady-state kinetics during 120 min recordings failed to yield stable parameter estimates (Danielsen et al., 1999). Consequently, we recently developed advanced methods for calculating the intrinsic unidirectional clearance of FDOPA to brain (K, ml · g−1 · min−1), the fractional rate constant for elimination of [18F]fluorodopamine and its metabolites from brain (kloss) (min−1), and the steady-state distribution volume of the total radioactive tracer concentration in brain (Vd, ml/g) (Kumakura et al., 2005, 2006), using time–activity curves of only 120 min duration. We hypothesized that not just the rate of synthesis but also the steady-state turnover of [18F]fluorodopamine is elevated in striatum of untreated patients with schizophrenia. To test this hypothesis, we used our new methods to calculate the magnitudes of the steady-state parameters K, kloss, and Vd in brain of eight nonmedicated male patients with schizophrenia and in 15 age-matched healthy male control subjects.
Materials and Methods
Subject recruitment.
Eight male patients with diagnosis of schizophrenia (Diagnostic and Statistical Manual of Mental Disorders, Ed 4; age, 37.3 ± 6.3 years) and 15 male healthy volunteers (mean ± SD age, 37.3 ± 6.4 years) were selected from cohorts in previously published FDOPA/PET studies; in the present reanalysis of subjects from the original group of nine unmedicated patients with schizophrenia (Gründer et al., 2003), a single patient was excluded as a result of uncorrectable head motion during the later PET scanning period (60–120 min), i.e., in the interval that had been excluded from the previous non-steady-state analysis. The present control subjects were selected from several previously published cohorts of normal subjects (Gründer et al., 2003; Heinz et al., 2005; Vernaleken et al., 2006) so as to obtain an age composition identical to that of the eight patients. All subjects had provided written informed consent for the previous studies, which had been approved by the Research and Ethics Committee of the University of Mainz. Exclusion criteria for the control group included current neurological, psychiatric, or systemic disease and current use of drugs affecting the CNS. Patients were free from any psychoactive medication for at least 6 months before the PET study. Three patients were entirely drug-naive, whereas the remainder had been treated previously with various doses of oral neuroleptics, with pause of medication to the PET session. Trained raters assessed psychopathological symptoms on the day of the PET scan (Gründer et al., 2003). The mean positive and negative syndrome scale (PANSS) was 80.1 ± 4.7, of which the positive score was 15.4 ± 3.5 and the negative score was 23.6 ± 4.0.
PET scanning and plasma sampling procedures.
Subjects fasted overnight before the PET recording. Carbidopa (Merck Sharp & Dohme, Whitehouse Station, NJ) was administered at a dose of 2 mg/kg (orally) 1 h before the PET recording to minimize the decarboxylation of FDOPA in peripheral tissues (Cumming et al., 1993). Subjects reclined on the scanning bed of the ECAT EXACT 47 whole-body PET (CTI/Siemans, Knoxville, TN), with their heads comfortably immobilized using a custom-made head holder. One of the eight patients had been scanned with the GE4096 tomograph (GE Healthcare, Little Chalfont, UK). After a brief attenuation scan, dynamic three-dimensional emission recording of 120 min duration was initiated at the moment of intravenous bolus injection of FDOPA (200 MBq). A series of 40 arterial blood samples was collected at intervals increasing from 1 s to 10 min, and the total [18F] radioactivity in plasma was measured in a well counter cross-calibrated to the tomograph. The fractions of untransformed FDOPA and its major plasma metabolite 3-O-methyl-FDOPA (OMFD) were measured in nine selected plasma samples (5, 10, 15, 20, 30, 45, 60, 90, and 120 min) by reverse-phase HPLC (Cumming et al., 1993). Continuous plasma input functions for FDOPA and OMFD were calculated by fitting biexponential functions to the measured fractions (Gillings et al., 2001).
Image preprocessing for kinetic analysis.
The dynamic PET sequences were realigned and corrected framewise for head motion and then summed and registered to the Montreal Neurological Institute (MNI) stereotaxic brain using the AIR (automatic image registration) algorithm (Woods et al., 1992) and the mutual information maximization algorithm (Collignon et al., 1995), as described previously (Kumakura et al., 2004). Time–radioactivity curves (TACs) were then extracted by masking volumes of interest (VOIs) for bilateral caudate (8.5 cm3 total), bilateral putamen (9.7 cm3 total), bilateral amygdala (3.7 cm3 total), midbrain (5.9 cm3), bilateral ventral striatum (2.3 cm3), and cerebellum (48.3 cm3) based on the magnetic resonance imaging (MRI) gray matter probabilistic atlas of the MNI stereotaxic brain (Fig. 1).
Figure 1.

An example of PET image registration to the MNI stereotaxic brain, displayed together with template VOI. A–G, Spatially normalized maps of the total distribution volume of FDOPA (Vd, ml/g) from a patient with schizophrenia (A), the MRI gray matter template of the MNI stereotaxic brain (B), the Vd image superimposed onto the MRI template (C), and template VOIs for caudate, putamen, midbrain amygdala, and ventral striatum drawn on the MNI stereotaxic brain (D–G).
Conventional quantification of unidirectional blood–brain clearance.
Magnitudes of the unidirectional net blood–brain clearance of FDOPA in VOIs were calculated by graphical analysis (Kinapp, ml · g−1 · min−1) (Martin et al., 1989) based on the definition of the unidirectional blood–brain clearance of a tracer (Gjedde, 1981, 1982; Patlak et al., 1983; Patlak and Blasberg, 1985). Metabolite-corrected arterial inputs for FDOPA and emission frames recorded in the interval of 20–60 min were used for this linear graphical analysis. The method of Kinapp implicitly assumes no loss of decarboxylated metabolites from brain tissue for the initial period of 60 min and uses framewise subtraction of total radioactivity in cerebellum, in which tissue the radioactivity fractions for FDOPA and OMFD are continuously changing (Kumakura et al., 2005).
Outline of new compartment model.
A reversible trapping model for FDOPA was first introduced in 1991 (Huang et al., 1991) but suffered from instability when only 2-h FDOPA emission recordings were available (Danielsen et al., 1999). A modified graphical method with a correction term for loss of decarboxylated metabolites was introduced for the analysis of FDOPA/PET studies (Holden et al., 1997; Sossi et al., 2001). However, this model required very prolonged (4 h) emission recordings to satisfy the implicit requirement that the total radioactivity concentration of the cerebellum could serve as a surrogate for the brain concentration of the inert plasma metabolite OMFD. To circumvent this problem, we used a constrained compartmental analysis to calculate the OMFD curve in cerebellum (Gjedde et al., 1991; Huang et al., 1991). The dynamic OMFD brain curve was then subtracted from the entire brain volume to isolate TACs consisting only of the composite radioactivities attributable to FDOPA and its decarboxylated metabolites (Kumakura et al., 2005). Finally, we have shown that the “cleaned-up” TACs (i.e., with mathematical subtraction of the contribution to brain radioactivity of OMFD) could be analyzed using a robust linear solution for a model with reversible kinetics (Kumakura et al., 2006), described in terms of the three steady-state kinetic parameters: K, kloss, and Vd (definitions of kinetic terms are summarized in Table 1).
Table 1.
Definitions of abbreviations and kinetic terms used in the text
| Term | Units | Definition |
|---|---|---|
| FDOPA | 6-[18F]fluoro-3,4,-dihydroxyphenyl-l-alanine | |
| OMFD | O-methyl-FDOPA | |
| K1 | ml · g−1 · min−1 | Unidirectional blood–brain clearance of a tracer, K1D for FDOPA and K1M for OMFD |
| k2 | min−1 | Fractional rate constant for the diffusion of a tracer from brain, K2D for FDOPA and K2M for OMFD |
| Ve | ml/g | The equilibrium distribution volume of a tracer in a nonbinding region (K1/k2) |
| K3D | min−1 | The relative activity of DOPA decarboxylase with respect to FDOPA, calculated assuming irreversible trapping of decarboxylated metabolites in brain |
| Kinapp | ml · g−1· min−1 | The net blood–brain clearance of FDOPA in a region of interest calculated by graphical analysis, with subtraction of the total radioactivity measured in a nonbinding region and assuming no loss of decarboxylated metabolites |
| K | ml · g−1 · min−1 | The intrinsic blood–brain clearance of a tracer defined kinetically in terms of K1, k2, and k3. |
| kloss | min−1 | The rate constant for the elimination of decarboxylated FDOPA metabolites from brain |
| EDV | ml/g | The ratio K/kloss, an index of the dopamine storage capacity in brain, following our previous definition of EDV2 (Kumakura et al., 2005, 2006). |
| V0 | ml/g | Effective plasma volume |
| Vf | ml/g | Distribution volume of precursor pool |
| Vd | ml/g | Total distribution volume in brain tissue (= EDV +Vf +V0) |
Calculation of brain OMFD TAC for mathematical subtraction.
Each frame of the dynamic emission recording was corrected for the radioactivity contribution from the brain-penetrating FDOPA metabolite OMFD. To this end, individual cerebellum TACs were analyzed by a modified one-tissue compartment model to calculate the blood–brain clearance (K1, ml · g−1 · min−1), the diffusion rate constant from brain (k2, min−1), and their ratio (Ve, ml/g) in the presence of a dual plasma input consisting of changing proportions of FDOPA and OMFD. This model entails the constraints of a common blood–brain partition ratio for the two large neutral amino acids (FDOPA, K1D/K2D; OMFD, K1M/K2M; ml/g) and that the unidirectional clearances of the two large neutral amino acids (K1M/K1D) should be in a constant ratio (q) (Gjedde et al., 1991) of magnitude fixed at 1.5 based on the mean of all published estimates (Cumming and Gjedde, 1998) and based on a systematic study of the effect of q on the calculation of FDOPA kinetics (Leger et al., 1998). The global brain TAC of OMFD for each experimental subject was then recovered from the following calculation:
 |
where MM is total mass of OMFD in brain tissue, CpM is OMFD plasma input function, and V0 is effective plasma volume in brain tissue, which was set to 5% for this calculation. OMFD radioactivity at each time point in the recovered TACs was subtracted from the appropriate dynamic emission time frame, assuming uniform distribution of OMFD in brain. The OMFD subtraction process and its underlying assumptions have been described in detail previously (Kumakura et al., 2005).
Quantification of turnover and steady-state storage.
The reversible pharmacokinetic model used in the present study has been described in detail previously (Kumakura et al., 2006). This reversible model for FDOPA kinetics (implemented after mathematical subtraction of brain OMFD radioactivity) has recently been simplified by our concept of an “inlet and outlet” model (Fig. 2), which accommodates the intrinsic blood–brain clearance of FDOPA corrected for elimination of the decarboxylated metabolites (K, ml · g−1 · min−1) and a first-order rate constant, expressing the diffusion from brain of [18F]fluorodopamine together with its acidic metabolites from brain as a single compartment (kloss, min−1). Of necessity, and by definition, the term kloss is a kinetic simplification based on the assumption that an equilibrium is obtained between the sum of all [18F]fluorodopamine pools in the vesicles and cytosol of dopamine neurons, and other cells containing DOPA decarboxylase, and the several pools of deaminated metabolites, regardless of their site of formation (Cumming et al., 1997; Deep et al., 1997a,b). The magnitude of the ratio K/kloss is a quantitative measurement of the distribution volume specifically for decarboxylated FDOPA metabolites trapped in brain, and the ratio K/kloss was defined as the steady-state effective distribution volume (EDV, ml/g) in this article, following our previous definition (EDV2, ml/g) (Kumakura et al., 2005, 2006) and modified from a similar method using subtraction of total cerebellum radioactivity (Martin et al., 1989; Holden et al., 1997; Sossi et al., 2001) The “content” of brain radioactivity then includes the effective plasma volume (V0, ml/g), the distribution volume of the precursor pool (Vf, ml/g) (which approaches a constant after 10–20 min after the tracer administration), and the EDV (ml/g). The composite of these three distribution volumes (V0, Vf, and EDV) constitutes the total tracer distribution volume (Vd, ml/g), which is the index of the steady-state dopamine storage used in the present study (Fig. 2). This inlet and outlet model can be described by a set of first-order differential equations, which rearranges to the linearized solution below (Kumakura et al., 2006):
 |
where M is the total mass of the tracer in VOIs after subtraction of OMFD, and Cp is the arterial FDOPA concentration. By applying multiple time points of OMFD-subtracted brain TACs to this linearized solution, a set of system equations enables calculation for the magnitudes of the three coefficients (macroparameters) on the right-hand side: p(1) = Vd = {EDV + (Vf + V0)}, p(2) = 1/kloss, p(3) = (Vf + V0)/kloss. Here, Vd equals p(1). The parameter kloss was calculated as the reciprocal of the second macroparameter, p(2), and K was calculated from the magnitudes of EDV and kloss, using all three macroparameters.
Figure 2.
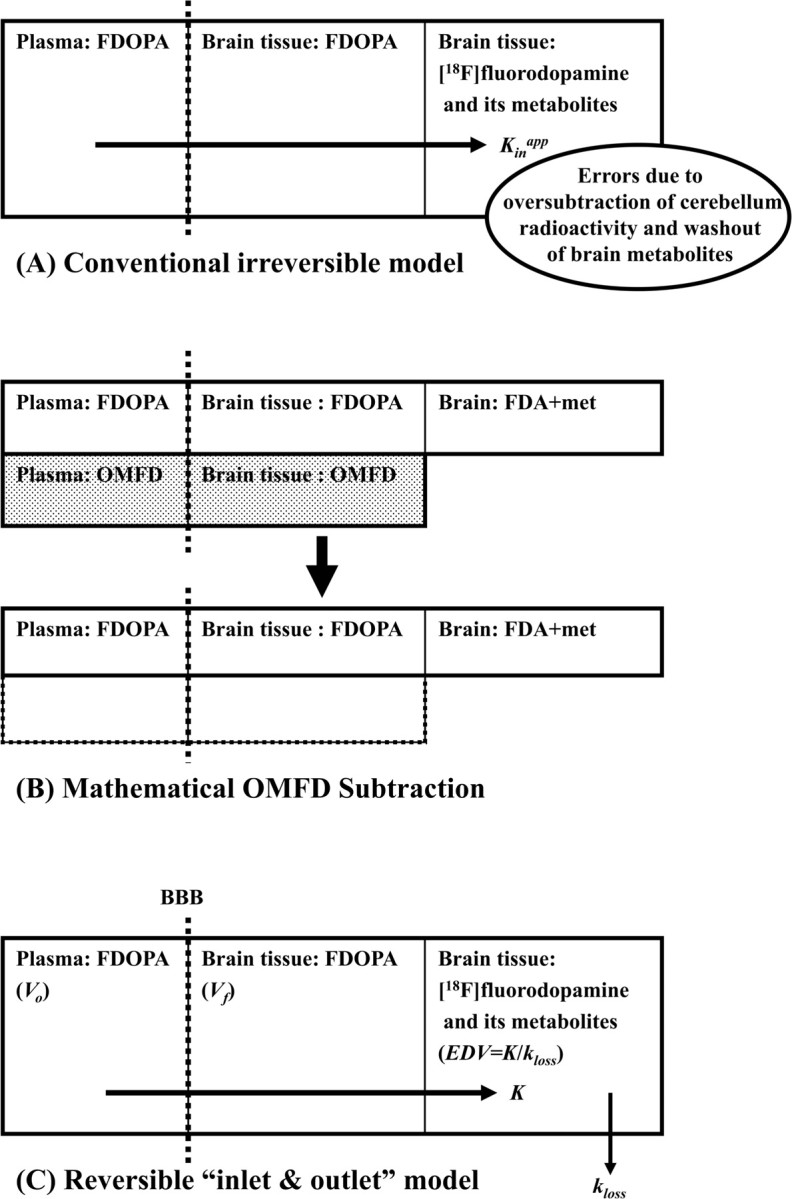
A schema describing distinctions between conventional (A) and new kinetic (B, C) models of [18F]FDOPA. For clarity, the radioactivity contribution from OMFD, which has undergone mathematical subtraction (dark boxes of B), is not included in C. The conventional irreversible model (A) defines the net unidirectional uptake, not correctly accounting for the progressive loss of [18F]fluorodopamine and its metabolites from brain during the recording period. The new reversible inlet and outlet kinetic model (C) in the present study defines the intrinsic blood–brain clearance of FDOPA (K, ml · g−1 · min−1) and the first-order rate constant for the diffusion of decarboxylated metabolites ([18F]fluorodopamine and its subsequent metabolites) from brain (kloss, min−1). The total distribution volume (Vd, ml/g) reported in the present study comprises three compartments: intravascular space (Vo, ml/g), extravascular tissue (precursor pool, Vf, ml/g), and metabolite compartment (trapped tracer, EDV, ml/g).
Statistics for VOI-based analysis.
Significance of differences in the mean estimates between groups was tested using the two-tailed unpaired Student's t test in cases of equal variances and Welch's unpaired t test in cases of unequal variances. Because of relatively small sample size in the group of patients with schizophrenia, we also used the Mann–Whitney nonparametric test for significant differences in medians.
Parametric mapping.
Parametric maps of the total distribution volume (Vd, ml/g) were calculated voxelwise by Matlab (MathWorks, Natick, MA) as the magnitude of the first macroparameter p(1) of the linearized equation (Eq. 2) using the head-motion-corrected dynamic PET recordings in the native PET space, as described previously (Kumakura et al., 2006). All parametric maps were transformed into the MNI stereotaxic space using the individual transformation matrices obtained from the previous image preprocessing. For visual presentation, the mean parametric images were then calculated for the groups of normal controls and patients with schizophrenia.
Correlation analysis.
Using a simple linear regression model, the PNASS positive and negative scores were correlated with individual estimates of the magnitudes of Kinapp, K, kloss, and Vd in bilateral caudate, putamen, amygdala, midbrain, and ventral striatum.
Mean input functions and tissue TACs normalized to a common FDOPA area under the curve.
The individual magnitudes of the area under the curve (AUC) for plasma FDOPA inputs during the 120 min recording interval were calculated for each subject and normalized to a common plasma FDOPA availability with an arbitrary AUC of 500 MBq · ml−1 · min−1. Individual plasma OMFD inputs were then rescaled using the same individual normalization factors. The group mean normalized FDOPA and OMFD inputs were then calculated. Likewise, individual tissue TACs extracted from VOIs of putamen and amygdala with and without mathematical subtraction of OMFD radioactivity were also rescaled using the same individual normalization factors, and the corresponding group mean normalized tissue TACs were calculated for the two VOI regions.
Results
The kinetic results of VOIs for caudate, putamen, amygdala, midbrain, and ventral striatum are summarized in Table 2. Results from the patient scanned with the GE4096 were within the range of estimates from the Siemens tomograph. Mean magnitudes of the conventional unidirectional net blood–brain clearance of FDOPA (Kinapp, ml · g−1 · min−1) did not reveal any significant difference between normal controls and patients with schizophrenia in the five regions analyzed. However, the intrinsic FDOPA clearance, corrected for loss of [18F]fluorodopamine (K, ml · g−1 · min−1), was 20–50% greater in all VOIs of the schizophrenic group than in the control group, whereas the fractional rate constant for [18F]fluorodopamine elimination (kloss, min−1), was 75–90% greater in all VOIs of the schizophrenic group. The magnitude of the total distribution volume of FDOPA (Vd, ml/g) was 37% lower in caudate and 27% lower in amygdala of the schizophrenic group. The mean magnitude of the common distribution volume for FDOPA and OMFD in cerebellum (Ve) was 0.72 ± 0.18 ml/g in the normal controls and 0.75 ± 0.11 ml/g in the patients with schizophrenia (p = 0.7), indicating nearly identical blood–brain distribution of the large neutral amino acids in the two subject groups.
Table 2.
Summary of kinetic estimates for FDOPA utilization and turnover in brain regions of age-matched control subjects and drug-free patients with schizophrenia
| Controls (n = 15) | Schizophrenia (n = 8) | p value | |
|---|---|---|---|
| Caudate | |||
| Kinapp | 0.0081 ± 0.0018 | 0.0071 ± 0.0021 | (p = 0.24), p′ = 0.458 |
| K | 0.0144 ± 0.0033 | 0.0175 ± 0.0028 | (p = 0.033), p′ = 0.0421 |
| kloss | 0.0041 ± 0.0012 | 0.0080 ± 0.0038 | [p = 0.026], p′ = 0.0003 |
| Vd | 4.04 ± 1.82 | 2.53 ± 0.77 | [p = 0.012], p′ = 0.0185 |
| Putamen | |||
| Kinapp | 0.0117 ± 0.0019 | 0.0126 ± 0.0019 | (p = 0.29), p′ = 0.29 |
| K | 0.0181 ± 0.0036 | 0.0237 ± 0.0042 | (p = 0.0032), p′ = 0.0074 |
| kloss | 0.0037 ± 0.0015 | 0.0063 ± 0.0029 | [p = 0.043], p′ = 0.0061 |
| Vd | 5.92 ± 2.70 | 4.29 ± 1.13 | [p = 0.056], p′ = 0.208 |
| Amygdala | |||
| Kinapp | 0.0038 ± 0.0013 | 0.0027 ± 0.0015 | (p = 0.077), p′ = 0.147 |
| K | 0.0116 ± 0.0026 | 0.0177 ± 0.0054 | [p = 0.018], p′ = 0.013 |
| kloss | 0.0090 ± 0.0024 | 0.0166 ± 0.0057 | [p = 0.0070], p′ = 0.0014 |
| Vd | 1.61 ± 0.66 | 1.17 ± 0.22 | [p = 0.031], p′ = 0.0759 |
| Midbrain | |||
| Kinapp | 0.0033 ± 0.0012 | 0.0030 ± 0.0006 | (p = 0.51) p′ = 0.54 |
| K | 0.0113 ± 0.0031 | 0.0172 ± 0.0064 | [p = 0.042], p′ = 0.0421 |
| kloss | 0.0087 ± 0.0029 | 0.0150 ± 0.0057 | [p = 0.017], p′ = 0.0061 |
| Vd | 1.78 ± 0.93 | 1.35 ± 0.24 | [p = 0.12], p′ = 0.186 |
| Ventral striatum | |||
| Kinapp | 0.0109 ± 0.0024 | 0.0114 ± 0.0018 | (p = 0.57), p′ = 0.50 |
| K | 0.0198 ± 0.0044 | 0.0238 ± 0.0036 | (p = 0.039), p′ = 0.049 |
| kloss | 0.0053 ± 0.0015 | 0.0074 ± 0.0023 | (p = 0.020), p′ = 0.031 |
| Vd | 4.15 ± 1.68 | 3.41 ± 0.72 | [p = 0.16], p′ = 0.38 |
The magnitude of the net blood–brain clearance of FDOPA during 60 min (Kinapp, ml · g−1 · min−1) was calculated using the conventional method based on Patlak linear graphical analysis (Martin et al., 1989). The intrinsic blood–brain FDOPA clearance corrected for loss of trapped metabolites (K, ml · g−1 · min−1), the fractional rate constant for elimination of decarboxylated FDOPA metabolites during 120 min (kloss, min−1), and steady-state storage of [18F]DOPA and its metabolites (Vd, ml/g) were calculated using the linear solution (Kumakura et al., 2006). Each estimate is the mean ± SD of 15 normal controls or eight patients with schizophrenia. p values in parentheses were calculated using Welch's t test for the cases of different variances, whereas those in brackets denote use of an unpaired t test. p values were also calculated using Mann–Whitney nonparametric test for differences in median, as denoted as p′.
Mean parametric maps of Vd in the three horizontal planes are illustrated in Figure 3, along with the MRI gray matter brain template of the Montreal Neurological Institute. The magnitude of Vd was conspicuously lower in the extended striatum of the patient group than in the control group. Linear regression analysis revealed a significant negative correlation between the positive score of PANSS and the individual steady-state storage (Vd) in the bilateral amygdala (Fig. 4) (r = −0.775; p = 0.024). There were no significant correlations between the negative PANSS scores and the kinetic estimates.
Figure 3.
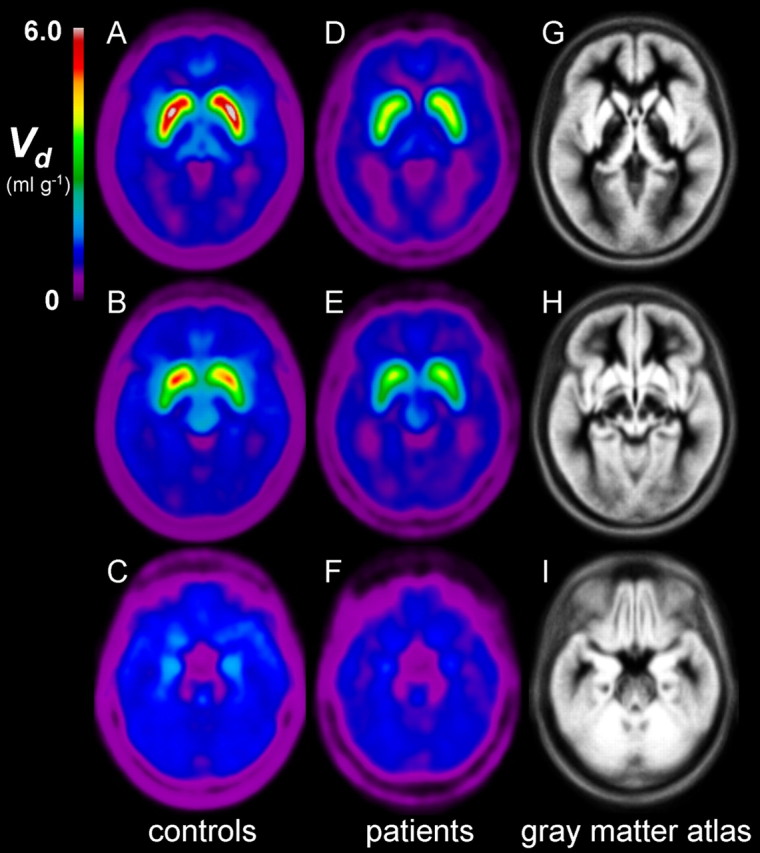
Group mean parametric maps of the total distribution volume (Vd, ml/g) of the FDOPA, representing the steady-state storage of FDOPA together with its decarboxylated metabolites. A–I, Each map is the mean of individual Vd maps obtained from healthy age-matched controls (n = 15) (A–C), and drug-free patients with schizophrenia (n = 8) (D–F), after spatial transformation to the gray matter atlas in common stereotaxic coordinates (G–I). Planes in each row are passing through caudate and putamen (A, D, G), ventral striatum (B, E, H), and amygdala (C, F, I).
Figure 4.

Linear regression analysis for correlation between the positive score of the PANSS in patients with schizophrenia and FDOPA kinetics. There was a significant negative correlation between the positive PANSS score and the magnitude of the steady-state storage capacity for [18F]fluorodopamine (Vd) in the bilateral amygdala.
Whereas the normalized plasma FDOPA inputs were nearly identical in the two groups (Fig. 5A), plasma OMFD inputs were higher in the schizophrenia group (Fig. 5D), apparently attributable to relatively slow elimination of OMFD from plasma (data not shown). Also illustrated for the two populations are the mean normalized total TACs for amygdala (Fig. 5B) and after subtraction of OMFD (Fig. 5C), as well as the mean normalized total TACs for putamen (Fig. 5E) and after subtraction of OMFD (Fig. 5F).
Figure 5.
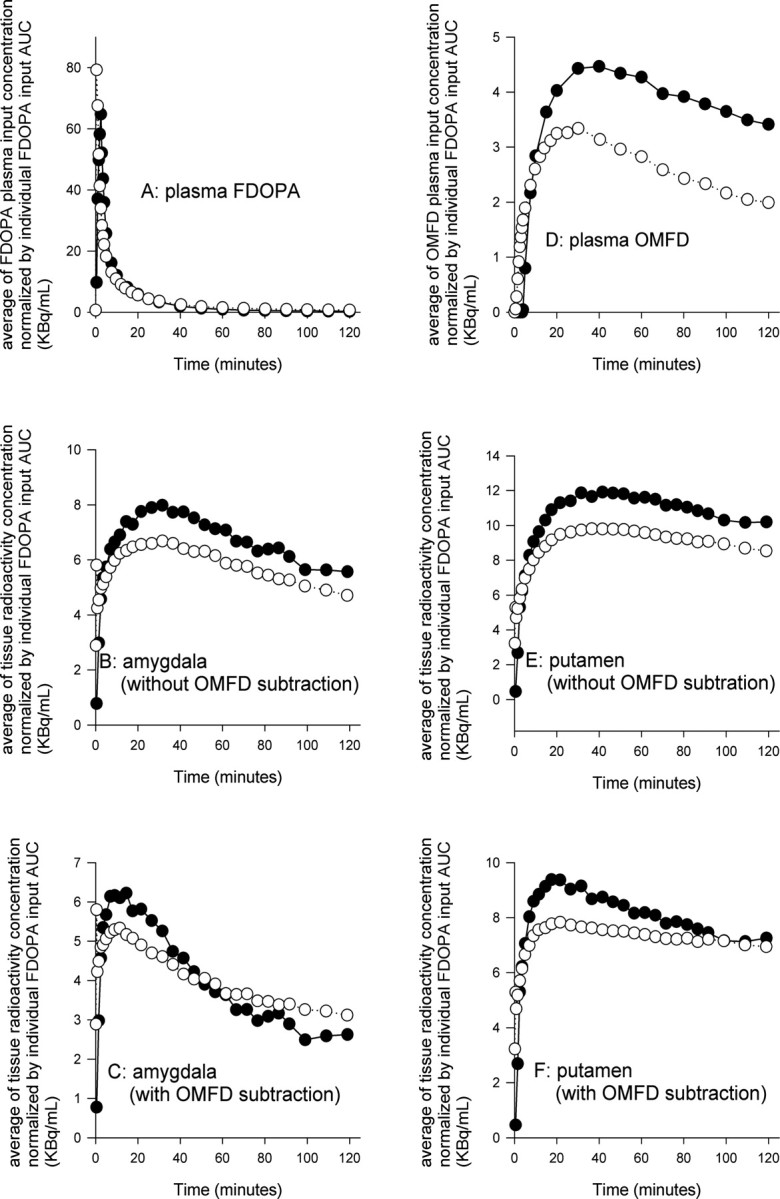
The mean normalized plasma FDOPA inputs (A) and mean normalized plasma OMFD inputs (D), all scaled to an arbitrary common AUC for FDOPA. Also illustrated are the mean normalized total TACs for amygdala (B) and after subtraction of OMFD (C), and the mean normalized total TACs for putamen (E) and after subtraction of OMFD (F). Each point represents the mean for eight patients with schizophrenia (•) or 15 healthy control subjects (○).
Discussion
Since the first PET study showing increased uptake of FDOPA in striatum of patients suffering from epilepsy with interictal psychosis and in patients with schizophrenia (Reith et al., 1994), increased capacity for dopamine synthesis in the basal ganglia of patients with schizophrenia has been reported in several laboratories (Hietala et al., 1995, 1999; Lindström et al., 1999; Meyer-Lindenberg et al., 2002; Gefvert et al., 2003; McGowan et al., 2004). This robust finding may be consistent with other PET studies showing elevated psychostimulant-evoked dopamine release in the benzamide competitive binding paradigm (Laruelle et al., 1996; Breier et al., 1997; Abi-Dargham et al., 1998). Together, these findings lend support to a hypothesis linking the positive symptoms of schizophrenia with a functional excess of dopamine (McKenna, 1987; Davis et al., 1991), thus supporting aspects of a dopamine model of schizophrenia.
The interpretation of previous DOPA-decarboxylase PET studies of schizophrenia is complicated by two main issues. First, pharmacokinetic models have incorrectly assumed irreversible trapping of [18F]fluorodopamine formed in brain during the recording interval (Gjedde et al., 1991; Cumming et al., 2001). Second, graphical analysis of unidirectional FDOPA clearance has been applied previously to brain TACs that are incompletely corrected for OMFD, which ultimately constitutes the majority of radioactivity in most brain regions (Cumming and Gjedde, 1998; Leger et al., 1998). These approximations in pharmacokinetic analysis result in biased estimates of the rate of substrate utilization (Kumakura et al., 2005), whereas failing to correct for the turnover of [18F]fluorodopamine results in underestimation of the true rate of FDOPA consumption in brain (Huang et al., 1991; Kuwabara et al., 1993; Cumming and Gjedde, 1998; Cumming et al., 2001; Kumakura et al., 2005). No compartmental PET model can accommodate the entire complexity of the catecholamine pathway; of necessity, the [18F]fluorodopamine formed in living brain is assumed in the present study to occupy a single compartment together with its deaminated metabolites, a condition that is satisfied when an dynamic equilibrium is obtained between these compartments (Deep et al., 1997a,b).
In the present study, we calculated the intrinsic utilization of plasma FDOPA (K) in brain, using an accurate subtraction of brain OMFD, and a correction for the eventual loss of [18F]fluorodopamine and its acidic metabolites. Although the magnitude of Kinapp did not significantly differ between groups, the magnitude of K was elevated in caudate and putamen of the patients with schizophrenia, indicating that FDOPA utilization in striatum is inherently elevated. Furthermore, the magnitude of K was also elevated in extrastriatal structures, i.e., amygdala and midbrain of the patients. Trapping of DOPA decarboxylase substrates may also be associated with serotonin innervations in extrastriatal regions (Cumming et al., 1997; Brown et al., 1999). Thus, the extrastriatal findings in the present study may in part reflect the composite contributions of serotonin and dopamine fibers to FDOPA metabolism, especially, perhaps, in the amygdala.
Unlike previous FDOPA/PET studies of schizophrenia, we also calculate the magnitude of the rate constant for the elimination of [18F]fluorodopamine and its deaminated metabolites [18F]fluoro-DOPAC and [18F]fluoro-homovanillic acid (HVA) from brain (kloss). As noted above, uncorrected loss of these acidic metabolites from brain progressively results in the observed underestimation of FDOPA utilization. The magnitude of kloss was nearly twofold elevated in striatum, midbrain, and amygdala of the patients relative to age-matched control subjects, whereas K was increased only by 25–50%. The increase in kloss suggests a primary abnormality in the storage or retention of labeled dopamine within synaptic vesicles in brain of unmedicated patients with schizophrenia; the estimated half-life of striatal [18F]fluorodopamine was 2 h in the healthy young control group versus 1 h in the patients. With respect to retention of decarboxylated FDOPA metabolites in brain, the present young adult schizophrenic group (mean age of 37 years) resembles the condition of healthy elderly subjects, in whom the half-life of striatal [18F]fluorodopamine is reduced by 50% relative to healthy young control subjects (Kumakura et al., 2006), with the important distinction that K is significantly increased in the patients with schizophrenia.
The shapes of the mean normalized plasma FDOPA inputs are nearly identical in the two groups (Fig. 5A), indicating that the differences in steady-state kinetics cannot be attributed to the precursor availability. In contrast, the mean normalized plasma OMFD input in the patient group exceeded that in the control group (Fig. 5D), a difference attributable to an inexplicable impairment in the elimination of OMFD from plasma in the subjects with schizophrenia. Thus, the more rapid washout of total radioactivity from amygdala (Fig. 5B) and putamen (Fig. 5E) in the patient group might plausibly be a trivial consequence of different pharmacokinetics of plasma of OMFD. However, the present methods are designed to isolate mathematically the brain TACs from the contribution of plasma OMFD. After subtraction of OMFD from the brain TACs, it is evident that the early phase of net FDOPA clearance to amygdala (Fig. 5C) and putamen (Fig. 5F), which reflects the magnitude of K, is enhanced in the patients. Conversely, the washout phase is more rapid in the patient group in both tissues, entirely consistent with the kinetic finding of elevated kloss in the brain of the patients. Thus, we conclude that the present findings of elevated [18F]fluorodopamine turnover cannot be attributed to pharmacokinetic differences in the handling of OMFD, although PET studies with concomitant catechol-O-methyltransferase inhibition might be required to prove this conjecture.
Our pharmacokinetic approach uses a robust linearized equation, with three macroparameters used to calculate the magnitudes of Kd, kloss, and Vd. Two parameters at most can be optimized simultaneously, because the third necessarily entails a combination of the other two. In general, the propagation of measurement error into parameter error is dependent on the model formulation describing the relationship between the measured data and the fitted parameters. However, it has been argued that robustness of fits can compensate for the risk of inappropriate propagation of measurement error to parameter error (Holden et al., 2002), although this risk must always be considered. Furthermore, the present inlet and outlet model, from which the linearized equation was derived (Kumakura et al., 2006), is substantiated by previous knowledge of the underlying biochemistry and physiology of dopamine, which has a half-life of close to 2 h in rodent striatum.
Parametric maps of Vd show globally decreased steady-state storage in the patients with schizophrenia (Fig. 3). However, the abundance of vesicular monoamine transporters (VMAT2) in synaptic vesicles measured by [11C]dihydrotetrabenazine-PET was normal in patients (Taylor et al., 2000), so the present finding cannot be attributed to inadequate storage capacity per se, assuming that VMAT2 function is normal in patients with schizophrenia. Indeed, important linkage to VMAT2 polymorphism has been excluded (Persico et al., 1995). Furthermore, the activity of monoamine oxidase is entirely normal in postmortem brain of patients dying with schizophrenia (Crow et al., 1979). Thus, the present findings in the patient group are likely occurring in the presence of a biochemically normal dopamine innervation and must consequently reflect a functional dysregulation of dopamine catabolism. Most likely, the reduced Vd is an indication of increased efflux of [18F]fluorodopamine from a secure vesicular compartment, resulting in more rapid catabolism and washout.
Reduced task-related cerebral blood flow activation of the frontal cortex correlates with increased FDOPA utilization in striatum of patients with schizophrenia (Meyer-Lindenberg et al., 2002), consistent with our finding of increased turnover of [3H]dopamine in the striatum of rats treated with an NMDA antagonist (Reith et al., 1998), a pharmacological treatment intended to emulate loss of corticostriatal input. Abnormal dopamine transmission in schizophrenia may thus reflect the cerebrometabolic response of a striatal dopamine innervation that is “mis-informed” with respect to its modulation by the frontal cortex. Indeed, dopamine has been described previously as the “wind propagating the fire of schizophrenia” (Laruelle and Abi-Dargham, 1999).
The present finding of increased kloss in brain of patients with schizophrenia predicts that the turnover of endogenous dopamine should likewise be elevated. Whereas the dopamine concentration was elevated in postmortem caudate and putamen of patients with schizophrenia, the concentration of acidic dopamine metabolites was not significantly increased (Crow et al., 1979). The concentration of HVA may actually be decreased in plasma and CSF of patients with schizophrenia (Davidson and Davis, 1988; Tuckwell and Koziol, 1993). However, previous studies have reported elevated HVA concentration in CSF of patients with schizophrenia compared with other psychiatric groups (Bowers et al., 1969; Rimón et al., 1971) and higher in schizophrenic patients with a family history of schizophrenia (Sedvall and Wode-Helgodt, 1980). Furthermore, factor analysis has revealed dispersion of cerebrospinal HVA levels between clinical subgroups of patients (Frecska et al., 1989) and a negative correlation between CSF HVA and the extent of atrophy of the prefrontal cortex (Doran et al., 1987). Of course, FDOPA kinetics cannot be extrapolated directly to predictions about the flux of native dopamine, which is primarily determined by the activity of tyrosine hydroxylase, the classical rate-limiting step for catecholamine synthesis. However, we contend that [18F]fluorodopamine should have obtained equilibrium with native dopamine in the present study. If so, the elevated [18F]fluorodopamine turnover in brain of the schizophrenic patients predicts increased turnover of endogenous dopamine.
We report a significant negative correlation between steady-state storage (Vd) in bilateral amygdala and the severity of positive PANSS scores of a group of drug-free patients. The amygdala is a key locus for the modulation of emotional processing by dopamine (Fudge and Emiliano, 2003; Salgado-Pineda et al., 2005). In a recent PET study, the density of dopamine D2/3 receptors was reduced in the amygdala of patients with schizophrenia (Buchsbaum et al., 2006), which might be consistent with our present observation of decreased Vd. Dampening by dopamine of the inhibition of neurons in the basolateral amygdala evoked by stimulation of the prefrontal cortex (Grace and Rosenkranz, 2002) suggests a mechanism by which elevated dopamine turnover in the extended amygdala might contribute to the positive and affective symptoms of schizophrenia. In summary, the present steady-state analysis revealed reduced storage of FDOPA metabolites in brain, suggesting that schizophrenia may be characterized by “poverty in the midst of plenty,” with respect to the dynamics of dopamine metabolism.
Footnotes
This work was supported by grants from the University of Mainz and the state of Rheinland-Pfalz and by the Basic Science Foundation of Denmark.
References
- Abi-Dargham A, Gil R, Krystal J, Baldwin RM, Seibyl JP, Bowers M, van Dyck CH, Charney DS, Innis RB, Laruelle M. Increased striatal dopamine transmission in schizophrenia: confirmation in a second cohort. Am J Psychiatry. 1998;155:761–767. doi: 10.1176/ajp.155.6.761. [DOI] [PubMed] [Google Scholar]
- Bowers MB, Jr, Heninger GR, Gerbode F. Cerebrospinal fluid 5-hydroxyindoleactiic acid and homovanillic acid in psychiatric patients. Int J Neuropharmacol. 1969;8:255–262. doi: 10.1016/0028-3908(69)90046-x. [DOI] [PubMed] [Google Scholar]
- Breier A, Su TP, Saunders R, Carson RE, Kolachana BS, de Bartolomeis A, Weinberger DR, Weisenfeld N, Malhotra AK, Eckelman WC, Pickar D. Schizophrenia is associated with elevated amphetamine-induced synaptic dopamine concentrations: evidence from a novel positron emission tomography method. Proc Natl Acad Sci USA. 1997;94:2569–2574. doi: 10.1073/pnas.94.6.2569. [DOI] [PMC free article] [PubMed] [Google Scholar]
- Brown WD, Taylor MD, Roberts AD, Oakes TR, Schueller MJ, Holden JE, Malischke LM, DeJesus OT, Nickles RJ. FluoroDOPA PET shows the nondopaminergic as well as dopaminergic destinations of levodopa. Neurology. 1999;53:1212–1218. doi: 10.1212/wnl.53.6.1212. [DOI] [PubMed] [Google Scholar]
- Buchsbaum MS, Christian BT, Lehrer DS, Narayanan TK, Shi B, Mantil J, Kemether E, Oakes TR, Mukherjee J. D2/D3 dopamine receptor binding with [F-18]fallypride in thalamus and cortex of patients with schizophrenia. Schizophr Res. 2006;85:232–244. doi: 10.1016/j.schres.2006.03.042. [DOI] [PubMed] [Google Scholar]
- Collignon A, Maes F, Delaere D, Vandermeulen D, Suetens P, Marchal G. Automated multimodality image registration based on information theory. In: Bizais Y, Barillot C, Di Paola R, editors. Information processing in medical imaging. Dordrecht, The Netherlands: Kluwer Academic; 1995. pp. 263–274. [Google Scholar]
- Crow TJ, Baker HF, Cross AJ, Joseph MH, Lofthouse R, Longden A, Owen F, Riley GJ, Glover V, Killpack WS. Monoamine mechanisms in chronic schizophrenia: post-mortem neurochemical findings. Br J Psychiatry. 1979;134:249–256. doi: 10.1192/bjp.134.3.249. [DOI] [PubMed] [Google Scholar]
- Cumming P, Gjedde A. Compartmental analysis of dopa decarboxylation in living brain from dynamic positron emission tomograms. Synapse. 1998;29:37–61. doi: 10.1002/(SICI)1098-2396(199805)29:1<37::AID-SYN4>3.0.CO;2-C. [DOI] [PubMed] [Google Scholar]
- Cumming P, Léger GC, Kuwabara H, Gjedde A. Pharmacokinetics of plasma 6-[18F]fluoro-l-3,4-dihydroxyphenylalanine ([18F]Fdopa) in humans. J Cereb Blood Flow Metab. 1993;13:668–675. doi: 10.1038/jcbfm.1993.85. [DOI] [PubMed] [Google Scholar]
- Cumming P, Ljubic-Thibal V, Laliberte C, Diksic M. The effect of unilateral neurotoxic lesions to serotonin fibres in the medial forebrain bundle on the metabolism of [3H]DOPA in the telencephalon of the living rat. Brain Res. 1997;747:60–69. doi: 10.1016/s0006-8993(96)01227-9. [DOI] [PubMed] [Google Scholar]
- Cumming P, Munk OL, Doudet D. Loss of metabolites from monkey striatum during PET with FDOPA. Synapse. 2001;41:212–218. doi: 10.1002/syn.1077. [DOI] [PubMed] [Google Scholar]
- Danielsen EH, Smith DF, Gee AD, Venkatachalam TK, Hansen SB, Hermansen F, Gjedde A, Cumming P. Cerebral 6-[(18)F]fluoro-l-DOPA (FDOPA) metabolism in pig studied by positron emission tomography. Synapse. 1999;33:247–258. doi: 10.1002/(SICI)1098-2396(19990915)33:4<247::AID-SYN1>3.0.CO;2-6. [DOI] [PubMed] [Google Scholar]
- Davidson M, Davis KL. A comparison of plasma homovanillic acid concentrations in schizophrenic patients and normal controls. Arch Gen Psychiatry. 1988;45:561–563. doi: 10.1001/archpsyc.1988.01800300057006. [DOI] [PubMed] [Google Scholar]
- Davis KL, Kahn RS, Ko G, Davidson M. Dopamine in schizophrenia: a review and reconceptualization. Am J Psychiatry. 1991;148:1474–1486. doi: 10.1176/ajp.148.11.1474. [DOI] [PubMed] [Google Scholar]
- Deep P, Gjedde A, Cumming P. On the accuracy of an [18F]FDOPA compartmental model: evidence for vesicular storage of [18F]fluorodopamine in vivo. J Neurosci Methods. 1997a;76:157–165. doi: 10.1016/s0165-0270(97)00094-0. [DOI] [PubMed] [Google Scholar]
- Deep P, Kuwabara H, Gjedde A, Cumming P. The kinetic behaviour of [3H]DOPA in living rat brain investigated by compartmental modelling of static autoradiograms. J Neurosci Methods. 1997b;78:157–168. doi: 10.1016/s0165-0270(97)00147-7. [DOI] [PubMed] [Google Scholar]
- Doran AR, Boronow J, Weinberger DR, Wolkowitz OM, Breier A, Pickar D. Structural brain pathology in schizophrenia revisited. Prefrontal cortex pathology is inversely correlated with cerebrospinal fluid levels of homovanillic acid. Neuropsychopharmacology. 1987;1:25–32. doi: 10.1016/0893-133x(87)90006-6. [DOI] [PubMed] [Google Scholar]
- Frecska E, Bagdy G, Perenyi A, Arato M, Degrell I, Mogyorosy Z. Multivariate analysis of monoamine indices in patients with chronic schizophrenia. J Neuropsychiatry Clin Neurosci. 1989;1:291–295. doi: 10.1176/jnp.1.3.291. [DOI] [PubMed] [Google Scholar]
- Fudge JL, Emiliano AB. The extended amygdala and the dopamine system: another piece of the dopamine puzzle. J Neuropsychiatry Clin Neurosci. 2003;15:306–316. doi: 10.1176/jnp.15.3.306. [DOI] [PMC free article] [PubMed] [Google Scholar]
- Gefvert O, Lindström LH, Waters N, Waters S, Carlsson A, Tedroff J. Different corticostriatal patterns of l-DOPA utilization in patients with untreated schizophrenia and patients treated with classical antipsychotics or clozapine. Scand J Psychol. 2003;44:289–292. doi: 10.1111/1467-9450.00347. [DOI] [PubMed] [Google Scholar]
- Gillings NM, Bender D, Falborg L, Marthi K, Munk OL, Cumming P. Kinetics of the metabolism of four PET radioligands in living minipigs. Nucl Med Biol. 2001;28:97–104. doi: 10.1016/s0969-8051(00)00187-6. [DOI] [PubMed] [Google Scholar]
- Gjedde A. High- and low-affinity transport of d-glucose from blood to brain. J Neurochem. 1981;36:1463–1471. doi: 10.1111/j.1471-4159.1981.tb00587.x. [DOI] [PubMed] [Google Scholar]
- Gjedde A. Calculation of cerebral glucose phosphorylation from brain uptake of glucose analogs in vivo: a re-examination. Brain Res. 1982;257:237–274. doi: 10.1016/0165-0173(82)90018-2. [DOI] [PubMed] [Google Scholar]
- Gjedde A, Reith J, Dyve S, Léger G, Guttman M, Diksic M, Evans A, Kuwabara H. Dopa decarboxylase activity of the living human brain. Proc Natl Acad Sci USA. 1991;88:2721–2725. doi: 10.1073/pnas.88.7.2721. [DOI] [PMC free article] [PubMed] [Google Scholar]
- Grace AA, Rosenkranz JA. Regulation of conditioned responses of basolateral amygdala neurons. Physiol Behav. 2002;77:489–493. doi: 10.1016/s0031-9384(02)00909-5. [DOI] [PubMed] [Google Scholar]
- Gründer G, Vernaleken I, Müller MJ, Davids E, Heydari N, Buchholz HG, Bartenstein P, Munk OL, Stoeter P, Wong DF, Gjedde A, Cumming P. Subchronic haloperidol downregulates dopamine synthesis capacity in the brain of schizophrenic patients in vivo. Neuropsychopharmacology. 2003;28:787–794. doi: 10.1038/sj.npp.1300103. [DOI] [PubMed] [Google Scholar]
- Heinz A, Siessmeier T, Wrase J, Buchholz HG, Gründer G, Kumakura Y, Cumming P, Schreckenberger M, Smolka MN, Rosch F, Mann K, Bartenstein P. Correlation of alcohol craving with striatal dopamine synthesis capacity and D2/3 receptor availability: a combined [18F]DOPA and [18F]DMFP PET study in detoxified alcoholic patients. Am J Psychiatry. 2005;162:1515–1520. doi: 10.1176/appi.ajp.162.8.1515. [DOI] [PubMed] [Google Scholar]
- Hietala J, Syvälahti E, Vuorio K, Räkköläinen V, Bergman J, Haaparanta M, Solin O, Kuoppamäki M, Kirvelä O, Ruotsalainen U, Salokangas RKR. Presynaptic dopamine function in striatum of neuroleptic-naive schizophrenic patients. Lancet. 1995;346:1130–1131. doi: 10.1016/s0140-6736(95)91801-9. [DOI] [PubMed] [Google Scholar]
- Hietala J, Syvälahti E, Vilkman H, Vuorio K, Rakkolainen V, Bergman J, Haaparanta M, Solin O, Kuoppamaki M, Eronen E, Ruotsalainen U, Salokangas RK. Depressive symptoms and presynaptic dopamine function in neuroleptic-naive schizophrenia. Schizophr Res. 1999;35:41–50. doi: 10.1016/s0920-9964(98)00113-3. [DOI] [PubMed] [Google Scholar]
- Holden JE, Doudet D, Endres CJ, Chan GL, Morrison KS, Vingerhoets FJ, Snow BJ, Pate BD, Sossi V, Buckley KR, Ruth TJ. Graphical analysis of 6-fluoro-l-dopa trapping: effect of inhibition of catechol-O-methyltransferase. J Nucl Med. 1997;38:1568–1574. [PubMed] [Google Scholar]
- Holden JE, Jivan S, Ruth TJ, Doudet DJ. In vivo receptor assay with multiple ligand concentrations: an equilibrium approach. J Cereb Blood Flow Metab. 2002;22:1132–1141. doi: 10.1097/00004647-200209000-00011. [DOI] [PubMed] [Google Scholar]
- Huang SC, Yu DC, Barrio JR, Grafton S, Melega WP, Hoffman JM, Satyamurthy N, Mazziotta JC, Phelps ME. Kinetics and modeling of l-6-[18F]fluoro-dopa in human positron emission tomographic studies. J Cereb Blood Flow Metab. 1991;11:898–913. doi: 10.1038/jcbfm.1991.155. [DOI] [PubMed] [Google Scholar]
- Kumakura Y, Danielsen EH, Reilhac A, Gjedde A, Cumming P. Levodopa effect on [18F]fluorodopa influx to brain: normal volunteers and patients with Parkinson's disease. Acta Neurol Scand. 2004;110:188–195. doi: 10.1111/j.1600-0404.2004.00299.x. [DOI] [PubMed] [Google Scholar]
- Kumakura Y, Vernaleken I, Gründer G, Bartenstein P, Gjedde A, Cumming P. PET studies of net blood-brain clearance of FDOPA to human brain: age-dependent decline of [18F]fluorodopamine storage capacity. J Cereb Blood Flow Metab. 2005;25:807–819. doi: 10.1038/sj.jcbfm.9600079. [DOI] [PubMed] [Google Scholar]
- Kumakura Y, Gjedde A, Danielsen EH, Christensen S, Cumming P. Dopamine storage capacity in caudate and putamen of patients with early Parkinson's disease: correlation with asymmetry of motor symptoms. J Cereb Blood Flow Metab. 2006;26:358–370. doi: 10.1038/sj.jcbfm.9600202. [DOI] [PubMed] [Google Scholar]
- Kuwabara H, Cumming P, Reith J, Léger G, Diksic M, Evans AC, Gjedde A. Human striatal l-dopa decarboxylase activity estimated in vivo using 6-[18F]fluoro-dopa and positron emission tomography: error analysis and application to normal subjects. J Cereb Blood Flow Metab. 1993;13:43–56. doi: 10.1038/jcbfm.1993.7. [DOI] [PubMed] [Google Scholar]
- Laruelle M, Abi-Dargham A. Dopamine as the wind of the psychotic fire: new evidence from brain imaging studies. J Psychopharmacol. 1999;13:358–371. doi: 10.1177/026988119901300405. [DOI] [PubMed] [Google Scholar]
- Laruelle M, Abi-Dargham A, van Dyck CH, Gil R, D'Souza CD, Erdos J, McCance E, Rosenblatt W, Fingado C, Zoghbi SS, Baldwin RM, Seibyl JP, Krystal JH, Charney DS, Innis RB. Single photon emission computerized tomography imaging of amphetamine-induced dopamine release in drug-free schizophrenic subjects. Proc Natl Acad Sci USA. 1996;93:9235–9240. doi: 10.1073/pnas.93.17.9235. [DOI] [PMC free article] [PubMed] [Google Scholar]
- Leger G, Gjedde A, Kuwabara H, Guttman M, Cumming P. Effect of catechol O-methyltransferase inhibition on brain uptake of [18F]fluorodopa: implications for compartmental modelling and clinical usefulness. Synapse. 1998;30:351–361. doi: 10.1002/(SICI)1098-2396(199812)30:4<351::AID-SYN2>3.0.CO;2-2. [DOI] [PubMed] [Google Scholar]
- Lindström LH, Gefvert O, Hagberg G, Lundberg T, Bergström M, Hartvig P, Långström B. Increased dopamine synthesis rate in medial prefrontal cortex and striatum in schizophrenia indicated by l-(beta-11C) DOPA and PET. Biol Psychiatry. 1999;46:681–688. doi: 10.1016/s0006-3223(99)00109-2. [DOI] [PubMed] [Google Scholar]
- Martin WR, Palmer MR, Patlak CS, Calne DB. Nigrostriatal function in humans studied with positron emission tomography. Ann Neurol. 1989;26:535–542. doi: 10.1002/ana.410260407. [DOI] [PubMed] [Google Scholar]
- McGowan S, Lawrence AD, Sales T, Quested D, Grasby P. Presynaptic dopaminergic dysfunction in schizophrenia: a positron emission tomographic [18F]fluorodopa study. Arch Gen Psychiatry. 2004;61:134–142. doi: 10.1001/archpsyc.61.2.134. [DOI] [PubMed] [Google Scholar]
- McKenna PJ. Pathology, phenomenology and the dopamine hypothesis of schizophrenia. Br J Psychiatry. 1987;151:288–301. doi: 10.1192/bjp.151.3.288. [DOI] [PubMed] [Google Scholar]
- Meyer-Lindenberg A, Miletich RS, Kohn PD, Esposito G, Carson RE, Quarantelli M, Weinberger DR, Berman KF. Reduced prefrontal activity predicts exaggerated striatal dopaminergic function in schizophrenia. Nat Neurosci. 2002;5:267–271. doi: 10.1038/nn804. [DOI] [PubMed] [Google Scholar]
- Patlak CS, Blasberg RG. Graphical evaluation of blood-to-brain transfer constants from multiple-time uptake dat. Generalizations. J Cereb Blood Flow Metab. 1985;5:584–590. doi: 10.1038/jcbfm.1985.87. [DOI] [PubMed] [Google Scholar]
- Patlak CS, Blasberg RG, Fenstermacher JD. Graphical evaluation of blood-to-brain transfer constants from multiple-time uptake data. Generalizations. J Cereb Blood Flow Metab. 1983;3:1–7. doi: 10.1038/jcbfm.1983.1. [DOI] [PubMed] [Google Scholar]
- Persico AM, Wang ZW, Black DW, Andreasen NC, Uhl GR, Crowe RR. Exclusion of close linkage between the synaptic vesicular monoamine transporter locus and schizophrenia spectrum disorders. Am J Med Genet. 1995;60:563–565. doi: 10.1002/ajmg.1320600616. [DOI] [PubMed] [Google Scholar]
- Reith J, Benkelfat C, Sherwin A, Yasuhara Y, Kuwabara H, Andermann F, Bachneff S, Cumming P, Diksic M, Dyve SE, Etienne P, Evans AC, Lal S, Shevell M, Savard G, Wong DF, Chouinard G, Gjedde A. Elevated dopa decarboxylase activity in living brain of patients with psychosis. Proc Natl Acad Sci USA. 1994;91:11651–11654. doi: 10.1073/pnas.91.24.11651. [DOI] [PMC free article] [PubMed] [Google Scholar]
- Reith J, Cumming P, Gjedde A. Enhanced [3H]DOPA and [3H]dopamine turnover in striatum and frontal cortex in vivo linked to glutamate receptor antagonism. J Neurochem. 1998;70:1979–1985. doi: 10.1046/j.1471-4159.1998.70051979.x. [DOI] [PubMed] [Google Scholar]
- Rimón R, Roos BE, Räkköläinen V, Alanen Y. The content of 5-hydroxyindoleacetic acid and homovanillic acid in the cerebrospinal fluid of patients with acute schizophrenia. J Psychosom Res. 1971;15:375–378. doi: 10.1016/0022-3999(71)90051-1. [DOI] [PubMed] [Google Scholar]
- Salgado-Pineda P, Delaveau P, Blin O, Nieoullon A. Dopaminergic contribution to the regulation of emotional perception. Clin Neuropharmacol. 2005;28:228–237. doi: 10.1097/01.wnf.0000185824.57690.f0. [DOI] [PubMed] [Google Scholar]
- Sedvall GC, Wode-Helgodt B. Aberrant monoamine metabolite levels in CSF and family history of schizophrenia. Their relationships in schizophrenic patients. Arch Gen Psychiatry. 1980;37:1113–1116. doi: 10.1001/archpsyc.1980.01780230031004. [DOI] [PubMed] [Google Scholar]
- Sossi V, Doudet DJ, Holden JE. A reversible tracer analysis approach to the study of effective dopamine turnover. J Cereb Blood Flow Metab. 2001;21:469–476. doi: 10.1097/00004647-200104000-00015. [DOI] [PubMed] [Google Scholar]
- Taylor SF, Koeppe RA, Tandon R, Zubieta JK, Frey KA. In vivo measurement of the vesicular monoamine transporter in schizophrenia. Neuropsychopharmacology. 2000;23:667–675. doi: 10.1016/S0893-133X(00)00165-2. [DOI] [PubMed] [Google Scholar]
- Tuckwell HC, Koziol JA. A meta-analysis of homovanillic acid concentrations in schizophrenia. Int J Neurosci. 1993;73:109–114. doi: 10.3109/00207459308987216. [DOI] [PubMed] [Google Scholar]
- Vernaleken I, Kumakura Y, Cumming P, Buchholz HG, Siessmeier T, Stoeter P, Müller MJ, Bartenstein P, Gründer G. Modulation of [18F]fluorodopa (FDOPA) kinetics in the brain of healthy volunteers after acute haloperidol challenge. NeuroImage. 2006;30:1332–1339. doi: 10.1016/j.neuroimage.2005.11.014. [DOI] [PubMed] [Google Scholar]
- Woods RP, Cherry SR, Mazziotta JC. Rapid automated algorithm for aligning and reslicing PET images. J Comput Assist Tomogr. 1992;16:620–633. doi: 10.1097/00004728-199207000-00024. [DOI] [PubMed] [Google Scholar]