

Abstract
One of the major challenges faced by the developing visual system is how to stably process visual information, yet at the same time remain flexible enough to accommodate growth and plasticity induced by visual experience. We find that in the Xenopus retinotectal circuit, during a period in development when the retinotectal map undergoes activity-dependent refinement and visual inputs strengthen, tectal neurons adapt their intrinsic excitability such that a stable relationship between the total level of synaptic input and tectal neuron spike output is conserved. This homeostatic balance between synaptic and intrinsic properties is maintained, in part, via regulation of voltage-gated Na+ currents, resulting in a stable neuronal input–output function. We experimentally manipulated intrinsic excitability or synapse strengthening in developing tectal neurons in vivo by electroporation of a leak K+ channel gene or a peptide that interferes with normal AMPA receptor trafficking. Both manipulations resulted in a compensatory increase in voltage-gated Na+ currents. This suggests that intrinsic neuronal properties are actively regulated as a function of the total level of neuronal activity experienced during development. We conclude that the coordinated changes between synaptic and intrinsic properties allow developing optic tectal neurons to remain within a stable dynamic range, even as the pattern and strength of visual inputs changes over development, suggesting that homeostatic regulation of intrinsic properties plays a central role in the functional development of neural circuits.
Keywords: homeostatic plasticity, development, Xenopus, vision, intrinsic excitability, in vivo
Introduction
One unique feature of developing neural circuits is their ability to rapidly evolve into highly specialized networks that process and relay information. A central question surrounding this process is how do these neural circuits maintain the ability to function stably during development, despite massive changes in neuronal architecture and synaptic organization (Turrigiano and Nelson, 2004; Marder and Goaillard, 2006). Neural circuit development is generally described in relation to the development of synaptic connections (Cohen-Cory, 2002; Scheiffele, 2003; McLaughlin and O'Leary, 2005). However, to fully understand how these well characterized changes in synaptic organization affect circuit function, it is important to also understand how these inputs interact with the intrinsic properties of their postsynaptic target neurons. Intrinsic neuronal properties are determined by the number and distribution of voltage-gated and non-voltage-gated ion channels expressed by a neuron and ultimately control whether synaptic inputs will lead to an action potential. Thus, the combined expression of both intrinsic and synaptic properties together shape how neurons receive, integrate, and convey information. Understanding the expression of intrinsic properties in the context of changing synaptic input during development will be essential for understanding strategies used by a developing neural circuit to function stably yet remain plastic. We address this question in the developing visual system of Xenopus laevis tadpoles.
The optic tectum of the Xenopus tadpole receives direct synaptic input from the contralateral retina. This retinotectal projection is topographically arranged so that near-neighbor retinal ganglion cells (RGCs) project onto near-neighbor tectal neurons. Initial formation of the retinotopic map is dependent on molecular cues (Holt and Harris, 1983), whereas later refinement is known to require patterned neural activity (Cline, 1991; Debski and Cline, 2002). Retinotectal synapses are glutamatergic, and developmental refinement of the retinotectal map is believed to be mediated by Hebbian plasticity, requiring activation of postsynaptic spiking and NMDA receptors (NMDARs) (Constantine-Paton et al., 1990). Because postsynaptic spiking is a critical component of Hebbian plasticity (Hebb, 1949; Linden, 1999), understanding the relationship between synaptic and intrinsic properties during development will not only allow us to understand how developmental changes in synaptic inputs are processed by tectal neurons but will also allow us to make predictions about the ease by which the circuit can undergo synaptic plasticity at different times.
To maintain a stable electrophysiological identity, neurons can homeostatically adjust their levels of intrinsic excitability in response to long-term changes in synaptic input (Turrigiano et al., 1994; Marder et al., 1996; Desai et al., 1999; Schulz, 2006). In the Xenopus visual system, short periods (4 h) of enhanced visual activity cause coordinated changes in intrinsic and synaptic properties, resulting in increased sensitivity to visual stimuli (Aizenman et al., 2002, 2003). This allows the visual system to adapt its response properties to changes in the visual environment. However, it is not clear whether these homeostatic mechanisms can also allow the visual system to adapt to changes in input levels and circuit organization that occur during development. Here, we first describe developmental changes in both intrinsic and synaptic properties expressed in individual tectal neurons. Next, we test whether this is a homeostatic mechanism used by the visual system to maintain a constant input–output function during development. Finally, we probe whether developmental regulation of synaptic and intrinsic properties are mechanistically linked by using in vivo electroporation of gene constructs that selectively reduce intrinsic excitability or synapse strengthening in developing tectal neurons.
Materials and Methods
Electrophysiology.
All animal experiments were done in accordance with Institutional Animal Care and Use Committee standards. Wild-type X. laevis tadpoles were raised on a 12 h light/dark cycle at 23°C in 10% Steinberg's solution. Developmental stages of tadpoles were determined according to Nieuwkoop and Faber (1994). Generally, under our rearing conditions, tadpoles reach stage 42 ∼6–7 d postfertilization (dpf), stages 44–46 at 9–12 dpf, and 49 at 18–20 dpf. For whole-brain recordings, tadpole brains were prepared as described by Wu et al. (1996) and Aizenman et al. (2003). In brief, tadpoles were anesthetized in 0.01% tricaine methane sulphonate (MS-222). To access the ventral surface of the tectum, brains were filleted along the dorsal midline and dissected in HEPES-buffered extracellular saline (in mm: 115 NaCl, 2 KCl, 3 Cacl2, 3 MgCl2, 5 HEPES, 10 glucose, and 0.1 picrotoxin, pH 7.2; osmolarity, 255 mOsm). Brains were then pinned to a submerged block of Sylgard in a recording chamber and maintained at room temperature (∼25°C) with continuous perfusion of external saline. To access the tectal cells, the ventricular membrane surrounding the tectum was carefully removed using a broken glass pipette. For input–output and minimal stimulation experiments, a bipolar stimulating electrode (FHC, Bowdoin, ME) was placed on the optic chiasm to activate RGC axons.
Cells were visualized using a Nikon (Tokyo, Japan) E600FN light microscope with a 60× fluorescent water-immersion objective, in combination with a Hamamatsu (Hamamatsu City, Japan) infrared (IR) CCD camera. To record from transfected neurons, enhanced green fluorescent protein (EGFP)-expressing neurons were identified using fluorescence, and recordings were obtained after switching to an IR filter. Whole-cell voltage-clamp and current-clamp recordings were made using glass micropipettes (8–12 MΩ) filled with K+ gluconate intracellular saline (in mm: 100 K-gluconate, 8 KCl, 5 NaCl, 1.5 MgCl2, 20 HEPES, 10 EGTA, 2 ATP, and 0.3 GTP, pH 7.2; osmolarity, 255 mOsm). To compare tectal neurons across the different stages of development, we consistently restricted our recordings to retinorecipient neurons in the middle third of the tectum, thus avoiding any developmental variability existing along the rostrocaudal axis (Wu et al., 1996). Electrical signals were measured with an Axopatch 200B and a Multiclamp 700B amplifier (Molecular Devices, Union City, CA), digitized at 10 kHz using a Digidata 1322A analog-to-digital board, and acquired using pClamp 8 software. Leak subtraction was done in real time using the acquisition software. Membrane potential in the figures was not adjusted to compensate for a predicted 12 mV liquid junction potential. Data were analyzed using AxographX software (Molecular Devices). Spontaneous synaptic events were collected and quantified using a variable amplitude template (Clements and Bekkers, 1997). The number of spikes elicited by current injection was quantified using the following criteria. To qualify as a spike, the height of the spike had to be at least half the height of its preceding spike and no wider than three times the width of the first original spike. Minimal stimulation experiments were performed by collecting EPSCs evoked by stimulating the optic chiasm at a stimulus intensity that evoked a failure at least 50% of the time. EPSCs collected at this stimulus intensity have been shown to be responses resulting from activation of a single axon (Liao et al., 1995; Wu et al., 1996; Cantallops et al., 2000). Nonparametric tests (Mann–Whitney) were used for all statistics. Error bars are SEM. For each experimental condition, data from at least four different tadpoles were used.
Whole-brain electroporation.
Tectal neurons were transfected by whole-brain electroporation (Haas et al., 2002): tadpoles were anesthetized with 0.02% MS-222, and plasmid DNA (1 μg/μl in external saline colored with fast green) was pressure injected into the middle ventricle using a glass micropipette. Next, the DNA was electroporated into the tectal cells by placing two platinum electrodes (1–2 mm) on either side of the midbrain, to target transfection to the tectum, and delivering three to five pulses at ∼30 V with an exponential decay of 70 ms. Immediately after electroporation, the tadpoles were transferred back into a bowl containing normal rearing solution (10% Steinberg's solution). Tadpoles were screened to identify those with relatively low transfection rates to minimize possible network effects of the transfection. Under these conditions, electroporation typically yielded between 5 and 20 readily identifiable neurons per tectum available for electrophysiological recordings. Tectal neuron recordings were done between 2 and 5 d after electroporation.
To overexpress the K+ leak channel, cells were transfected with a bicistronic EGFP-IRES-Kir2.1 construct (kindly provided by V. Murthy, Harvard University, Boston, MA) (Burrone et al., 2002). To alter synaptic strength, cells were transfected with GluR2ct, the C-terminal domain of the rat AMPA receptor (AMPAR) subunit GluR2 (813–862) (kindly provided by K. Haas, University of British Columbia, Vancouver, British Columbia, Canada). The GluR2ct gene is fused to EGFP and is expressed in a Clontech (Mountain View, CA) pEGFP vector (Shi et al., 2001; Haas et al., 2006). For GFP controls, cells were transfected with pEGFP-C1 vector (Clontech). Drugs and chemicals were obtained from Sigma (St. Louis, MO).
Results
Whole-cell recordings were made from optic tectal neurons in a whole-brain preparation (Aizenman et al., 2002) from a range of key and anatomically well characterized developmental stages (Nieuwkoop and Faber, 1994). Specifically, we focus on three periods of early development of the retinotectal circuit: stage 42/43, stages 44–46, and stage 49 (see Materials and Methods for timing of stages). After RGC axons first reach their target tectum around developmental stage 39 (Holt, 1989; Dingwell et al., 2000), they begin to make functional synapses and convey visual information (stage 42/43). This is followed by a dynamic phase of synaptic formation and loss, as tectal cell dendrites grow and become more complex, and RGC axon terminals are highly motile (stages 44–46) (Cline et al., 1997). By stage 49, RGC axons become more focused, resulting in a reduction in tectal cell receptive field size (Tao and Poo, 2005), glutamatergic synapses have acquired a more mature phenotype, retinotectal inputs strengthen (Tao and Poo, 2005; Akerman and Cline, 2006), and GABAA reversal potential becomes more hyperpolarizing (Akerman and Cline, 2006).
Intrinsic excitability transiently peaks during developmental stages 44–46
We first characterized intrinsic excitability by measuring the ability of a tectal neuron to generate action potentials. In general, tectal neurons have been shown to have significant spike adaptation and fire few spikes in response to a depolarizing step (Aizenman et al., 2003). We performed current-clamp recordings and measured the maximum number of action potentials that a tectal cell could fire in response to a series of 200 ms depolarizing current injections, while holding the membrane potential at −60 mV, in tadpoles of different developmental stages (Fig. 1 A). We found that intrinsic excitability peaks during stages 44–46. Between stage 42/43 and 44–46, there is a marked decrease in spike adaptation, resulting in a greater number of spikes (Fig. 1 A,C, top and middle traces) (stage 42, 2.4 ± 0.47 spikes; stages 44–46, 5.4 ± 0.96 spikes; p = 0.0075). This increase in excitability was significant and transient. By stage 49, the maximum number of evoked spikes had decreased again and was comparable to stage 42 neurons (Fig. 1 A,C, bottom trace) (2.4 ± 0.76 spikes; p = 0.022). The full current versus spike curve is shown in Figure 1 B. Recordings performed during stage 47/48 showed variable amounts of excitability (Fig. 1 A), suggesting that this is a transitional period.
Figure 1.

Intrinsic excitability of tectal neurons increases transiently during development. A, Average maximum number of spikes a cell fires in response to current injection, between stages 42 and 49. The maximum number of spikes peaks between stages 44 and 48; however, responses at stage 48 are more variable. *p < 0.05. B, Averaged input–output curves plotting the number of action potentials in response to injection of square current pulses of varying amplitudes. Neurons from stage 44–46 (open circles) tadpoles fire significantly more spikes than neurons from younger (stage 42, open triangles) and older (stage 49, filled circles) tadpoles (n is the same as in A). Max, Maximum. C, Sample traces showing spiking evoked by a 30 pA current injection, recorded from tectal cells at different stages in development.
We measured the characteristics of the first spike in the train and found that, between stages 44–46 and stage 49, the threshold to spike increased, the rate of rise of the action potential decreased, action potential rise time (measured at 20–80% of peak) became slower, and the half-width of the action potential broadened (Table 1). These changes are consistent with changes in voltage-gated Na+ currents. Changes in spiking were not attributable to changes in the passive properties of the tectal cells during development. Resting membrane potential and input resistance remained constant between the different stages (Table 1).
Table 1.
Development of active and passive intrinsic neuronal properties
| Stage 42–43 | Stage 44–46 | Stage 49 | |
|---|---|---|---|
| AP threshold (mV) | −23.96 ± 1.4 (n = 9) | −24.7 ± 1.1 (n = 11) | −20 ± 2 (n = 11) |
| AP height (mV) | 31.2 ± 2.8 (n = 9) | 31.2 ± 3.32 (n = 11) | 28.6 ± 2.5 (n = 11) |
| AP rise time (20–80%; ms) | 0.767 ± 0.06 (n = 9) | 0.77 ± 0.08 (n = 11) | 1.3 ± 0.4 (n = 11) |
| AP rate of rise (mV/ms) | 27.7 ± 5.2 (n = 9) | 28.8 ± 4.4 (n = 11) | 16.5 ± 3.9 (n = 11) |
| AP half-width (ms) | 3.24 ± 0.47 (n = 9) | 2.61 ± 0.35 (n = 11) | 3.63 ± 0.35 (n = 11) |
| Resting membrane potential (mV) | 40.6 ± 2.2 (n = 23) | 42.3 ± 1.6 (n = 39) | 43.8 ± 1.3 (n = 61) |
| Input resistance (GΩ) | 1.0 ± 0.11 (n = 30) | 0.9 ± 0.05 (n = 42) | 0.97 ± 0.04 (n = 81) |
AP, Action potential.
Tectal neurons from Xenopus tadpoles display a variety of voltage-gated currents, including a voltage-activated, TTX-sensitive Na+ current, transient and steady-state K+ currents, and a small steady-state Ca2+ current (Aizenman et al., 2003). The size of the Na+ current has been shown to directly correlate with the number of action potentials a tectal cell fires when it is depolarized and can be measured as the peak inward current evoked by a depolarizing pulse. In this preparation, it has previously been demonstrated that blocking the outward K+ current, using a Tris-based internal saline, does not affect the peak amplitude of the inward Na+ current. This shows that inward and outward currents are sufficiently temporally distinct to permit accurate separation of both Na+ and K+ peak amplitudes from a mixed-current response (Aizenman et al., 2003). Furthermore, Na+ currents in Xenopus tadpoles are relatively small and slow compared with their mammalian counterparts, facilitating the accurate measurement of relative changes in the maximum evoked Na+ current amplitude in whole-cell voltage-clamp mode during development. Our analysis was limited only to the maximal Na+ current response, because analysis of activation and inactivation kinetics becomes impractical in a whole-cell configuration because of possible space-clamp issues, particularly at more positive membrane potentials (see also Aizenman et al., 2003). At all developmental stages studied, 1 μm TTX abolished the fast inward current (data not shown), confirming that it is mediated by voltage-gated Na+ channels during this developmental period. We measured both the Na+ current and the peak K+ current (which reflects both the transient and steady-state currents) during the development. I–V plots were generated by measuring either the peak inward or the peak outward current in response to a series of depolarizing pulses, ranging from −60 to +20 mV (Fig. 2 A). Between stage 42/43 and stages 44–46, we identified a small increase in maximal Na+ current amplitude (Fig. 2 B,C) (stage 42/43, 396.2 ± 41 pA; stages 44–46, 509 ± 39 pA; p = 0.077). Na+ current amplitude then decreased significantly between stages 44–46 and stage 49 (stage 49, 254 ± 20 pA; p < 0.0001). In contrast, K+ currents remained relatively constant during stages 42/43 and 44–46 (Fig. 2 B,C) (stage 42/43, 636 ± 59 pA; stage 44–46, 628 ± 42 pA). K+ currents showed a small but nonsignificant decrease by stage 49 (540 ± 45 pA). Full I—V curves are shown in Figure 2 C.
Figure 2.
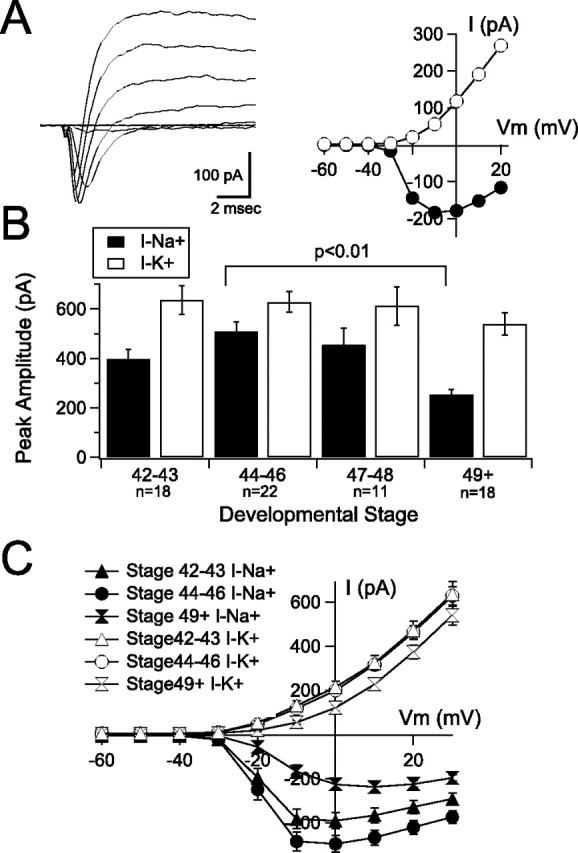
Voltage-gated Na+ currents, but not K+ currents, peak during stages 44–46. A, Sample voltage-clamp recording (left) and I–V plot (right) from a tectal neuron held at −60 mV in response to a series of depolarizing steps. Recordings are leak subtracted to show only the active currents. The current–voltage plot (right) shows the peak inward (Na+; filled circles) and outward (K+; open circles) components of the mixed currents as a function of voltage. B, Average peak Na+ (filled bars) and K+ (open bars) currents across development show a peak in Na+ currents between stages 44 and 46 followed by a significant decrease by stage 49. Only a nonsignificant decrease in K+ current was observed. C, Averaged current–voltage plots from tectal neurons across the three developmental stages (n is the same as in B).
In the mature animal, the tectal circuitry can become very complex, consisting of a variety of neuronal types (Lázár and Székely, 1967). During early developmental stages, anatomical studies show that locally projecting interneurons, which can be either excitatory or inhibitory, constitute up to 30% of all tectal neurons (Wu and Cline 2003), but these have not been shown to be electrophysiologically distinct. In this study, we were unable to distinguish different electrophysiological phenotypes within a specific developmental stage, suggesting that much of the complexity that characterizes the adult tectum has not yet developed. This is consistent with anatomical observations from stage 49 tectum (Lázár, 1973). Therefore, although we may be sampling from a population of neurons that ultimately might differentiate into different cell classes, during these early stages, we lack strong reason to believe that the principles and mechanisms regulating their early electrophysiological development vary greatly between different types of retinorecipient cells.
Together, these data show a transient increase in neuronal excitability that peaks during stages 44–46 and decreases by stage 49. The decrease in Na+ current amplitude between stages 44–46 and stage 49 closely correlates with a fewer number of spikes evoked by a depolarizing pulse, a slower spike rise time and rate of rise, and an increase in threshold to spike (Table 1). Together with the fact that K+ currents, as well as input resistance, do not change significantly, this strengthens the idea that the drop in excitability is being affected by a decrease in voltage-gated Na+ currents. Interestingly, the increase in spike number between stages 42/43 and 44–46 does not correspond with a similarly large increase in Na+ currents and therefore could involve additional mechanisms.
Excitatory synaptic drive increases during development
During the range of developmental stages studied, tectal neuron dendrites and retinal axon terminals undergo a period of rapid growth, followed by stabilization (Wu et al., 1999; Zou and Cline, 1999). We tested whether this period of growth corresponded to an overall increase in excitatory synaptic drive. To facilitate study of excitatory synapses, inhibitory transmission was blocked with picrotoxin. Cells were voltage clamped at −65 mV. We found that spontaneous EPSC (sEPSC) frequency increased throughout development but did so more robustly between stages 44–46 and stage 49 (Fig. 3 A,C) (stage 42/43: 1.28 ± 0.23 events/s, n = 11; stages 44–46: 2.05 ± 0.3 events/s, n = 18; stage 49: 5.09 ± 1.13 events/s, n = 14; p < 0.005 between stages 42 vs 49 and 45 vs 49), whereas sEPSC amplitude decreased (Fig. 3 A,C) (stage 42/43, 11.48 ± 0.86 pA; stages 44–46, 9.71 ± 0.69 pA; stage 49, 5.7 ± 0.32 pA; p < 0.0005 between stages 42 vs 49 and 45 vs 49). We calculated total synaptic drive by multiplying sEPSC size by sEPSC frequency. Because the increase in frequency was greater than the decrease in amplitude, the overall excitatory synaptic drive received by tectal neurons increased (Fig. 3 B) (stage 42/43, 13.7 ± 0.21 pA/Hz; stages 44–46, 20.3 ± 3.4 pA/Hz; stage 49, 28 ± 6.6 pA/Hz; p = 0.0507 between stages 42 vs 49). A second measure of synaptic drive was obtained by calculating the total charge resulting from spontaneous excitatory drive. Charge was integrated over 1 s epochs and averaged. The average charge increased throughout development, but the increase was more pronounced between stages 44–46 and stage 49 (Fig. 3 A,C) (stage 42/43, 0.076 ± 0.033 pC; stages 44–46, 0.136 ± 0.02 pC; stage 49, 0.44 ± 0.14 pC; p = 0.004 between stages 42 vs 49 and p = 0.04 between stages 45 vs 49). This was partly because of the appearance of spontaneous barrages of excitatory transmission during the later developmental stages (Fig. 3 D). We found that spontaneous barrages occurred in 50% (7 of 14 cells) of stage 49 neurons, whereas they were rare in younger animals [stage 42, 9% (1 of 11); stage 45, 11% (2 of 18)]. In cells that displayed barrages, they occurred at a frequency of 2.1 ± 0.5 barrages/min and lasted <1 s. These barrages have been also observed in vivo in stage 49 tadpoles without inhibitory blockade, suggesting that they also occur under more physiological conditions (data not shown) (see also Zhang et al., 2000).
Figure 3.
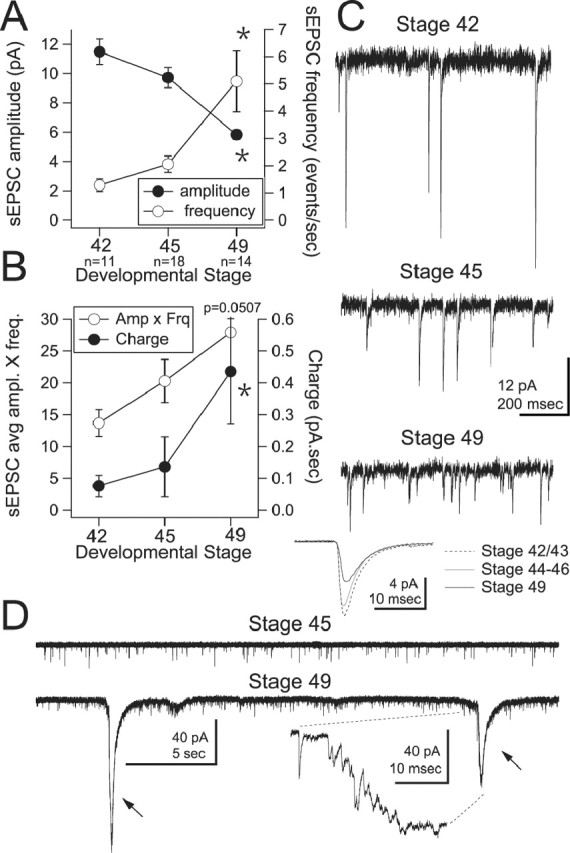
Total synaptic drive increases during development. A, Average sEPSC amplitude (filled circles) increases, whereas sEPSC frequency (open circles) decreases between stages 42, 44–46, and 49. B, Average (avg) synaptic charge (filled circles; in picoamperes per second) and total synaptic drive received by individual neurons increase during these stages. For a given cell, synaptic drive is calculated by multiplying average sEPSC amplitude (Amp; in picoamperes) by sEPSC frequency (Frq; events per second). Because an increase in frequency of events was greater than the decrease in amplitude, the overall amount of synaptic drive increases developmentally. *p < 0.05. C, Representative voltage-clamp recordings of sEPSCs at stages 42, 45, and 49. Bottom traces show averaged sEPSC waveforms expressed by tectal neurons at the three developmental stages; each trace is an average of 10 cells. D, Representative voltage-clamp recordings showing characteristic synaptic barrages expressed by stage 49 tectal neurons (arrows; bottom). The inset shows a barrage at an expanded time scale. Barrages are not present earlier, during stage 45 (top). Statistical measures in A and B indicate significance between stages 42 and 49. For additional comparisons, see Results.
Next, we tested whether the strength of individual RGC inputs changes during this developmental period. We performed minimal stimulation experiments (see Materials and Methods) to selectively stimulate a single retinotectal axon (Wu et al., 1996). We found that retinotectal transmission can first be reliably evoked by stage 42/43. During these stages, responses evoked by minimal stimulation were relatively large (Fig. 4) (18.6 ± 2 pA; n = 5 cells), consistent with the large sEPSC size that was observed. The fact that these responses are larger is consistent with the notion that these are very immature, nascent synapses (Rohrbough and Spitzer, 1999; Desai et al., 2002; Aizenman and Cline, 2007). By stages 44–46, responses evoked by minimal stimulation were significantly smaller (9.7 ± 0.8 pA; n = 11 cells; p < 0.001), and by stage 49, they had increased again by almost 50% (13.6 ± 1 pA; n = 12 cells; p < 0.01). Cumulative probability histograms for all combined responses are shown in Figure 4 B, and average amplitudes are shown in Figure 4 C.
Figure 4.

Developmental regulation of EPSC amplitude evoked by minimal stimulation of RGC axons. A, Examples of minimally evoked EPSCs, including failures, recorded from a stage 42, 45, and 49 tectal neuron. B, Cumulative probability plot of minimally stimulated EPSCs for stage 42–43, 44–46, and stage 49 tadpoles, showing a decrease (leftward shift) of EPSC amplitudes between stages 42 and 45 and a subsequent increase (rightward shift) between stages 45 and 49. Data points represent the range of EPSC amplitudes recorded from all the cells of a given stage. We plotted an equal number of events from each cell so that each cell is represented equally. The failures are excluded. *p < 0.01. C, Averaged minimal stimulation-evoked EPSC amplitudes as a function of developmental stage.
These data show that after retinotectal synapses go through a nascent stage in which quantal size is large (stage 42/43), the strength of retinotectal synaptic transmission weakens by stages 44–46. Retinotectal inputs again strengthen between stages 44–46 and stage 49. This strengthening is consistent with an increase in complexity of tectal neuron dendrites and retinal axons (Zou and Cline, 1999). The level of spontaneous background excitatory synaptic drive also increases significantly during this period, adding to the total amount of synaptic drive received by stage 49 neurons. The further appearance of spontaneous synaptic barrages suggests that the tectum may also be undergoing a developmental rearrangement of local excitatory synaptic connectivity.
Tectal neurons maintain stable input–output properties during development
Our data show that between stage 42 and stage 49 there is a reciprocal relationship between synaptic drive and intrinsic excitability. We tested whether this relationship held true for individual neurons, rather than groups of neurons. We used a subset of the cells recorded (n = 40), in which we had a full set of data describing both synaptic and intrinsic properties for each cell, to create a correlation matrix where we compared the following independent measures: sEPSC amplitude, sEPSC frequency, integrated synaptic charge, peak I Na +, and peak I K +. The correlation matrix is shown in Table 2. Among the most significant correlations, sEPSC frequency was negatively correlated with peak Na+ current amplitude and sEPSC amplitude. This suggests that neurons that receive a higher frequency of excitatory synapses will be the ones less likely to spike. sEPSC amplitudes, however, were positively correlated with peak Na+ and K+ currents. The fact that lower synaptic frequency is coupled with increased intrinsic excitability, whereas higher synaptic frequency is coupled with decreased intrinsic excitability, suggests that this homeostatic balance may serve to maintain the input–output function of a tectal cell stable across development.
Table 2.
Correlation matrix of synaptic and intrinsic properties in individual tectal neurons
| Pearson r correlation coefficient (r values and significance; n = 40) |
Na + Max | K + Max | |||
|---|---|---|---|---|---|
| sEPSC amp | sEPSC freq | Syn charge | |||
| sEPSC amp | 1 | −0.421 (p < 0.01) | −0.331 (p < 0.05) | 0.493 (p < 0.01) | 0.444 (p < 0.01) |
| sEPSC freq | 1 | 0.483 (p < 0.01) | −0.351 (p < 0.05) | −0.225 (N.S.) | |
| Syn charge | 1 | −0.234 (N.S.) | −0.069 (N.S.) | ||
| Na + Max | 1 | 0.45 (p < 0.01) | |||
amp, Amplitude; freq, frequency; Syn charge, synaptic charge; Max, maximum; N.S., not significant.
Functional consequences of input–output stability during development
If tectal neurons homeostatically adjust their intrinsic excitability in response to strengthening retinal inputs to maintain relatively invariant response properties, then we predict that activation of a given number of synapses, at the different developmental time points, should result in relatively consistent spike output. To test this, we generated input–output curves for stage 44–46 and stage 49 tadpoles, in which we plotted the probability of postsynaptic spiking in response to synaptic stimuli of varying strengths. We focused on these two stages because this is where we had observed the greatest transformation of synaptic and intrinsic properties. Simultaneous cell-attached and field potential recordings were performed while stimulating the retinotectal pathway at the optic chiasm. The direct monosynaptic component of the field potential, identified by the first negative-going peak (Fig. 5 A1, arrow) (Chung et al., 1974a,b), was used to normalize the stimulus intensity. The minimum stimulus intensity was the one that evoked the first measurable field EPSP, and the maximum was defined as the lowest intensity at which the synaptic component first reaches its largest amplitude (Fig. 5 A1,A2). Using this range of stimulus intensities, we plotted both the probability of eliciting a spike in the cell-attached recording (Fig. 5 A3), and the average number of spikes elicited (in a 50 ms window) across trials. Summary input–output curves are shown in Figure 5 B. Remarkably, the input–output curves from stage 44–46 and stage 49 tadpoles were very similar. For example, a stimulus of 40% of maximal evoked a similar number of spikes per response in younger and older tadpoles (stages 44–46, 1.52 ± 0.39 spikes, n = 9 vs stage 49, 1.65 ± 0.59 spikes, n = 8). A second prediction is that, because of observed differences in intrinsic excitability, a stage 49 tectal cell will require a larger absolute EPSP amplitude to evoke a spike than a stage 44–46 tectal cell. To test this, we performed current-clamp recordings and used pairs of synaptic stimuli (interstimulus interval, 100 ms) at a stimulus intensity that resulted in spiking ∼50% of the time (between 33 and 66%) (Fig. 5 C, inset); this was defined as the threshold stimulus. Using paired stimuli allowed us to observe how tectal cells integrate responses over multiple stimuli, particularly because visual inputs occur as bursts of action potentials. Interestingly, unlike with cell-attached recordings, the majority of cells would rarely fire a spike with a single EPSP (Aizenman et al., 2002). We measured the amplitude of the second EPSP evoked at threshold stimulus intensity (calculated from trials in which there was no spike) and found that, in stage 44–46 tadpoles, an EPSP of 11.9 ± 2.1 mV (n = 7) was sufficient to drive the cell to threshold, whereas stage 49 tadpoles cells required an EPSP of 16.3 ± 2 mV to reach threshold (Fig. 5 C, left) (n = 6; p = 0.101). This is consistent with the observation that the threshold to spike is higher in stage 49 tadpoles (Table 1). The lack of statistical significance of this observation was attributable to a single outlier (p < 0.05, Dixon's Q-test): a stage 46 neuron in which the EPSP size required to evoke a spike was more than double the average of other stage 44–46 neurons (24.6 mV). We also performed voltage-clamp recordings in these cells and used the amplitude of the EPSC to define the maximal and minimal stimulus intensities. We then expressed the threshold stimulus intensity as a percentage of the maximal intensity. In stage 44–46 tadpoles, threshold intensity was 54 ± 10% of maximal, and in stage 49 tadpoles, it was 64 ± 8% of maximal. These values were not significantly different. The latency to the first spike was also not significantly different between both conditions (Fig. 5 C, middle) (stages 44–46, 16 ± 1.8 ms; stage 49, 18 ± 2 ms). Both the cell-attached and whole-cell data suggest that synaptic and intrinsic properties are balanced, such that the cell maintains a stable dynamic range during development.
Figure 5.
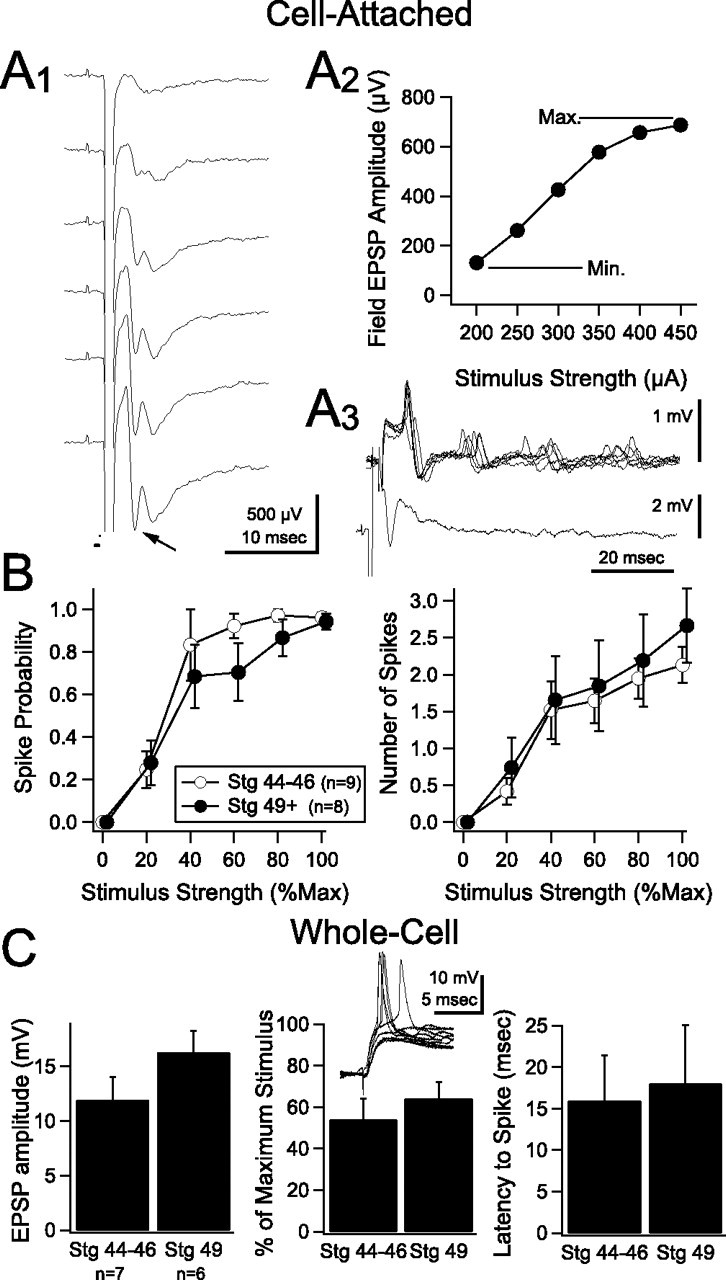
Functional consequences of maintaining stable input–output properties throughout stages 44–46 and 49. A1, An example of a field potential recording in response to increasing stimulation of RGC axons. The first negative-going peak (see arrow) is the monosynaptic RGC response. A2, Field potential amplitude is plotted as a function of stimulus strength and used to identify minimum (Min.) and maximum (Max.) stimulus intensities for each experiment (see Results). A3, Superimposed sweeps from a cell-attached recording showing spikes in response to RGC stimulation (top trace) and corresponding simultaneous field potential recording (bottom trace). B, Average spike probability (left) and number of evoked spikes (right) versus normalized stimulus strength for stage 44–46 and stage 49 tectal neurons. Curves from both developmental stages do not show significant differences. C, Average data obtained from whole-cell current-clamp recordings in response to a paired synaptic stimulus (see Results). Left, Compared with stage 44–46 (n = 7), stage 49 (n = 6) tectal neurons showed a tendency toward requiring a larger absolute EPSP to spike 50% of the time. Middle, When the EPSP amplitude is expressed as percentage of the maximal response for that cell, as shown in B, there are no significant differences between stages. Right, There were no significant differences in latency to spike. The inset shows an example of a whole-cell current-clamp recording from a tectal neuron that is being driven repeatedly at its threshold stimulus intensity. At this stimulation intensity, the cell is firing an action potential ∼50% of the time. Stg, Stage.
Homeostatic regulation of intrinsic excitability
Neurons of various types are known to use a series of homeostatic mechanisms to maintain their synaptic and intrinsic properties within a stable functional range or to maintain a specific firing pattern (LeMasson et al., 1993; Turrigiano et al., 1994; Marder et al., 1996; Desai et al., 1999; Aizenman et al., 2003). We tested whether the reciprocal regulation of synaptic and intrinsic properties, observed between stages 44–46 and stage 49, was a homeostatic process. Are tectal neurons actively balancing spike output with synaptic drive, or are these properties regulated independently? To directly address this, we selectively altered either postsynaptic intrinsic excitability or synaptic drive in individual neurons during development and tested whether synaptic and intrinsic properties were affected. Intrinsic excitability was reduced by introducing a DNA plasmid containing the gene for the K+ leak channel KIR2.1 into stage 46 tectal neurons by using in vivo whole-brain electroporation (Haas et al., 2002). This plasmid contained an internal ribosome entry site promoter that drives expression of the channel gene as well as of GFP (Burrone et al., 2002), allowing us to target electroporated neurons for recording. This ion channel has been successfully used to electrically silence neurons by increasing the leak K+ current, making it more difficult for the cells to reach spike threshold (Burrone et al., 2002). Tadpoles were transfected at stage 46 and allowed to develop for 3–5 d after electroporation. Transfected cells were compared with nontransfected neighboring cells in the same animal. Coexpression of the KIR2.1 channel in GFP-expressing neurons was confirmed by the fact that transfected neurons had a significant decrease in input resistance (KIR2.1: 0.497 ± 0.08 GΩ, n = 10; control: 1.08 ± 0.22 GΩ, n = 9; p < 0.01) (Fig. 6 E) and a more negative resting membrane potential compared with controls (KIR2.1, −56.2 ± 2.8 mV; control, −45.6 ± 4.8 mV; p = 0.1) (Fig. 6 E). Control neurons had resting membrane potentials and input resistances comparable to those of untransfected animals (Table 1), minimizing the possibility that these may be weakly expressing KIR. Interestingly, we found that KIR2.1-expressing neurons were able to generate normal action potentials in response to direct current injection, despite the decrease in input resistance (Fig. 6 A) (spike threshold, −22.67 ± 1.56 mV; spike height, 31.43 ± 3 mV; n = 8). This was attributable to a significant upregulation of voltage-gated Na+ currents in transfected cells (KIR2.1, 1017 ± 209 pA; control, 416 ± 67 pA; p = 0.004) (Fig. 6 B,C). Voltage-gated K+ currents were not significantly different (KIR2.1, 993 ± 127 pA; control, 733 ± 131 pA) (Fig 6 B,C). Full averaged I–V curves are shown in Figure 6 C. In contrast, we failed to detect any significant difference in the amplitude and frequency of sEPSCs (amplitude: KIR2.1, 6.9 ± 0.54 pA; control, 7.4 ± 0.64 pA; frequency: KIR2.1, 8.3 ± 2 events/s; control, 9.6 ± 2.2 events/s) (Fig 6 D). This suggests that tectal neurons can selectively upregulate voltage-gated Na+ currents in response to a decrease in postsynaptic excitability to restore normal spiking, yet do not show evidence of scaling of excitatory synaptic inputs (Turrigiano et al., 1998; Burrone et al., 2002).
Figure 6.

Reducing intrinsic excitability in vivo during development induces upregulation of voltage-gated Na+ currents. A, Representative traces showing normal spiking response in Kir2.1-transfected neurons and nontransfected controls. B, Average peak voltage-gated Na+ and K+ currents in tectal neurons transfected with Kir2.1 for 3–5 d compared with untransfected control neurons. Notice the selective increase in Na+ current amplitude. K+ currents showed a small but nonsignificant difference (n is the same for subsequent panels). max, Maximum. C, Averaged I–V curves for voltage-gated Na+ and K+ currents in transfected and nontransfected neurons show a selective increase in Na+ currents. D, Kir2.1 transfection had no effect on sEPSC amplitude (ampl.) or frequency (freq.). E, Kir2.1-transfected neurons had a more negative resting membrane potential (RMP; left) and reduced input resistance (middle). The trace (right) shows a sample recording of a hyperpolarizing voltage step showing the characteristic decrease in input resistance in Kir2.1-transfected cells. *p < 0.05.
In a second set of experiments, we reduced excitatory drive by electroporating tectal neurons with GluR2ct. This manipulation has been shown to decrease excitatory transmission in Xenopus tectal neurons by interfering with basal trafficking of GluR2 subunits (Shi et al., 2001; Haas et al., 2006). In this experiment, recordings of untransfected neighbors were not practical, because of a lack of an independent measure of transfection (e.g., such as a change in R input). This would make it difficult to distinguish nontransfected cells from weakly transfected cells. Therefore, GluR2ct-transfected neurons were compared with neurons from age-matched controls that were transfected with a plasmid only containing GFP. Tadpoles were transfected at stage 46, and recordings were made 2–4 d after transfection. We found that GluR2ct-expressing neurons had smaller sEPSCs than GFP controls, as predicted (GluR2ct: 7.85 ± 0.46 pA, n = 22; GFP: 10.2 ± 0.86 pA, n = 15; p = 0.026) (Fig. 7 D). This confirms that GluR2ct-expressing cells experience an overall reduced level of excitatory synaptic drive during the transfection period. We then tested whether this manipulation affected intrinsic currents. GluR2ct-expressing cells were found to have larger voltage-gated Na+ currents than the GFP controls (GluR2ct: 799 ± 73 pA, n = 24; GFP: 569 ± 58 pA, n = 18; p = 0.04) (Fig. 7 A). Averaged I–V curves of GluR2ct- and GFP-expressing tectal neurons are shown in Figure 7 C. K+ currents were not different between GluR2ct-expressing cells and GFP controls (GluR2ct, 1248 ± 119 pA; GFP, 1312 ± 134 pA) (Fig. 7 B). Although transfection rates with GluR2ct tended to be higher than for KIR, transfection rates were relatively sparse (see Materials and Methods). This would minimize the possibility that the compensatory effect is a result of an overall decrease in network activity attributable to GluR2ct expression in neighboring neurons. However, this possibility cannot be fully ruled out, but in either case, the interpretation of the results would remain consistent.
Figure 7.

Developmentally dampening AMPAR-mediated synaptic transmission in vivo induces upregulation of voltage-gated Na+ currents. A, B, Average peak voltage-gated Na+ and K+ currents in tectal neurons transfected with GluR2ct after 2–4 d after transfection compared with matched controls expressing only GFP. Notice the selective increase in Na+ current amplitude. max, Maximum. C, Averaged I–V curves for voltage-gated Na+ and K+ currents in GluR2ct-transfected neurons show a selective increase in Na+ currents relative to GFP-expressing controls (n is the same as in A). D, GluR2ct-transfected neurons show a significant decrease in AMPA-mediated sEPSC amplitude (amp.). The inset shows averaged sEPSCs from GluR2ct- and GFP-expressing cells. *p < 0.05.
The results from these two experiments show that manipulations that cause a reduction in neuronal excitability, either by hyperpolarizing the cell or decreasing synaptic drive, result solely in an upregulation of Na+ currents, but not in a scaling up of synaptic inputs. This is consistent with observations that alterations in the visual environment can result in changes in voltage-gated Na+ currents even over a period of 4 h (Aizenman et al., 2003). These data, however, do not rule out the possibility that if the cell were prevented from upregulating Na+ currents, it would not compensate by increasing the size of synaptic inputs.
Discussion
Together, these observations show that retinotectal circuit development moves through a transient phase of increased intrinsic excitability. During this phase, overall excitatory synaptic drive received by tectal neurons steadily increases. As synaptic drive increases, intrinsic excitability begins to decrease. Reciprocal regulation of intrinsic and synaptic properties results in a stable input–output function during development. Experimentally decreasing synaptic drive or intrinsic excitability in vivo results in upregulation of voltage-gated Na+ currents, suggesting that this is an active homeostatic process. These mechanisms have important implications for the development of the retinotectal circuit. On one hand, they allow tectal neurons to maintain stable function in the face of significant anatomical and functional synaptic rearrangement. On the other hand, the transient period of increased excitability during stages 44–46 may facilitate induction of synaptic plasticity and be required for anatomical refinement of the retinotectal map.
Developmental regulation of intrinsic excitability
Evidence from this study and others suggest that the observed changes in excitability are attributable, at least in part, to changes in the peak amplitude of voltage-gated Na+ currents (Aizenman et al., 2003). Between stages 44–46 and stage 49, the observed decrease in peak Na+ current amplitude could be attributable to a change in the density of voltage-gated Na+ channels or to a change in their modulation (Huguenard et al., 1988; Bevan and Storey, 2002; Chen et al., 2005). The fact that the decrease in the peak Na+ current is accompanied by an increase in the spike rise time and rate of rise (Table 1), suggests that a change in the number of functional channels is the likely mechanism underlying a decrease in spike rate. However, the increase in excitability that occurs between stage 42/43 and stages 44–46 does not correlate with a similarly large increase in peak Na+ currents or with a change in the ratio between Na+ and K+ currents. One possibility is that during earlier stages, tectal neurons are expressing an immature subtype of a voltage-gated Na+ channel that has different gating characteristics, as has been observed previously (Park and Ahmed, 1991; Pineda et al., 2005).
We therefore propose that the initial maturation of excitability, between stage 42/43 and stages 44–46, represents a maturational program that follows along similar lines as has been described for several cell types in which intrinsic excitability increases developmentally (Gardette et al., 1985; MacDermott and Westbrook, 1986; Ramoa and McCormick, 1994; Spitzer and Ribera, 1998). In contrast, we propose that the decrease in excitability occurring by stage 49 may be attributable to an activity-driven downregulation of voltage-gated Na+ currents. This is supported by our observations that as synaptic transmission strengthens, Na+ currents decrease. Interfering with synaptic strengthening during development by Glur2ct transfection (Fig. 7), or dampening excitability with Kir2.1 transfection (Fig. 6), results in enlarged Na+ currents, further supporting a mechanistic link between the level of neuronal activity and regulation of Na+ current amplitude.
Maturation of synaptic transmission
In this study, we find that although the increased individual RGC input strength and sEPSC frequency observed between stages 44–46 and stage 49 are consistent with an increase in the complexity of individual retinal axon terminals, it is surprising to find that immature retinotectal inputs during stage 42 evoke significantly larger synaptic responses than those evoked at later stages (Fig. 4). Furthermore, sEPSCs are larger in immature tadpoles, decreasing significantly during development (Fig. 3). The observation that unitary synaptic current size is initially large in nascent synapses is consistent with observations in immature Xenopus spinal cord (Rohrbough and Spitzer, 1999) and in immature rat visual cortex (Desai et al., 2002), but it is not consistent with observations in the developing rat superior colliculus or lateral geniculate nucleus, where quantal size remains constant during development (Chen and Regehr, 2000; Lu and Constantine-Paton, 2004). This may be because of the possibility that the developmental stages looked at in these studies do not directly compare with the ones described here. The fact that quantal size decreases, yet minimally evoked retinotectal response amplitude increases (Figs. 3, 4), further suggests that the increase in RGC input strength is attributable to an increase in the number of synaptic contacts made by a given RGC axon onto a tectal cell, rather than to strengthening of individual synapses.
One interesting observation is that sEPSC amplitude is inversely correlated with sEPSC frequency (Table 2). Similar observations have been made in immature visual cortex, where mEPSC frequency is inversely correlated with amplitude (Desai et al., 2002), and in the superior colliculus, where RGC inputs are weak in neurons that receive input from a large number of RGCs, whereas RGC inputs are stronger in neurons receiving input from few RGCs (Chandrasekaran et al., 2007). This observation suggests that EPSC amplitude is not necessarily the best indicator of total synaptic drive, because we see a developmental increase in total synaptic drive despite a decrease in sEPSC amplitude. Thus, the activity of the entire network of neurons plays an important role in setting postsynaptic excitability.
Homeostatic regulation of synaptic and intrinsic properties
Which processes determine the reciprocal interaction between synaptic and intrinsic properties? We show that intrinsic excitability is determined by total levels of AMPAR-mediated synaptic drive, because reducing AMPAR-mediated synaptic drive via GluR2ct electroporation results in upregulation of voltage-gated Na+ currents. This is consistent with evidence from stage 48 tadpoles, in which a decrease in AMPAR-mediated synaptic drive, caused by a 4 h period of enhanced visual stimulation in vivo, resulted in an increase in intrinsic excitability and voltage-gated Na+ currents (Aizenman et al., 2002, 2003). Together, these data show that voltage-gated Na+ currents can be modulated during development by changes in the level of excitatory synaptic drive. The fact that Kir2.1 transfection alone also results in a change in voltage-gated Na+ currents suggests that the overall level of postsynaptic activation may be important for setting intrinsic excitability, rather than just the amount of excitatory synaptic transmission.
Functional implications
We have observed that, during the development of the retinotectal circuit, tectal cells maintain a constant input–output function although the pattern and magnitude of synaptic inputs are changing significantly. Reciprocal regulation of intrinsic excitability and synaptic drive during development allow the cell to maintain this balance, which keeps the cell within a useful dynamic range (Fig. 5 C). This allows the cell to rapidly encode increases and decreases in synaptic drive. The strong relationship between the amount of synaptic drive received by a neuron and its level of intrinsic excitability demonstrates that the homeostatic regulation of intrinsic excitability previously described in invertebrates and in cultured neurons (Turrigiano et al., 1994; Marder et al., 1996; Thoby-Brisson and Simmers, 1998; Desai et al., 1999; Bucher et al., 2005) is also present in vivo during the development of the vertebrate visual system.
We find that tectal neuron excitability peaks during a period in which tectal neuron morphology is undergoing rapid growth, new synapses are being established, and refinement of tectal neuron receptive field properties is occurring (Cline et al., 1997; Tao and Poo, 2005). Could this transient increase in intrinsic excitability be important for facilitating such rapid changes as the retinotectal circuit becomes established? Retinotectal circuit refinement is believed to involve Hebbian-based mechanisms in which postsynaptic spiking determines which RGC inputs are strengthened and which are lost (Constantine-Paton and Cline, 1998). Changes in intrinsic excitability will determine the ease by which Hebbian plasticity can be induced in a given cell (Debanne et al., 2003; Zhang and Linden, 2003). Thus, in combination with other factors, the increase in excitability during stages 44–46 may signal the start of an important period of growth in the early development of the retinotectal circuit. (1) During these stages, excitatory transmission is predominantly mediated by NMDARs, and GABAA receptor-mediated transmission facilitates activation of NMDARs (Akerman and Cline, 2006). (2) Presynaptic RGC axons are more dynamic at this stage than later in development (E. S. Ruthazer, personal communication). (3) During stage 45, BDNF expression peaks in the optic tectum (Cohen-Cory et al., 1996), and BDNF has been shown to enhance RGC axon arbor complexity and to promote synapse formation and stabilization (Sanchez et al., 2006). Together, these properties may work to facilitate the induction of synaptic plasticity and maturation and therefore create a permissive environment for activity-dependent refinement of retinotectal projections.
In conclusion, we propose a model in which the homeostatic regulation of intrinsic and synaptic properties during development serves a dual purpose. First, it allows the retinotectal circuit to maintain a stable dynamic range even as the pattern and strength of synaptic inputs changes. Second, the transient increase in excitability during stages 44–46 may facilitate induction of synaptic plasticity and therefore will permit refinement of the retinotectal projection during a time when the retinotectal circuit is being established.
Footnotes
K.G.P. was supported by a National Research Service Award from the National Eye Institute, and C.D.A. was supported by a generous grant from the Klingenstein Foundation. We thank Irina Sears for technical assistance and members of the Aizenman laboratory for discussion. We thank Kendal Jensen for assistance with whole-brain electroporation and Venkatesh Murthy and Kurt Haas for providing the Kir2.1 and GluR2ct plasmids. We thank Holly Cline, Julie Kauer, Scott Cruikshank, and Barry Connors for comments on this manuscript.
References
- Aizenman CD, Cline HT. Enhanced visual activity in vivo forms nascent synapses in the developing retinotectal projection. J Neurophysiol. 2007;97:2949–2957. doi: 10.1152/jn.00452.2006. [DOI] [PubMed] [Google Scholar]
- Aizenman CD, Munoz-Elias G, Cline HT. Visually driven modulation of glutamatergic synaptic transmission is mediated by the regulation of intracellular polyamines. Neuron. 2002;34:623–634. doi: 10.1016/s0896-6273(02)00674-8. [DOI] [PubMed] [Google Scholar]
- Aizenman CD, Akerman CJ, Jensen KR, Cline HT. Visually driven regulation of intrinsic neuronal excitability improves stimulus detection in vivo. Neuron. 2003;39:831–842. doi: 10.1016/s0896-6273(03)00527-0. [DOI] [PubMed] [Google Scholar]
- Akerman CJ, Cline HT. Depolarizing GABAergic conductances regulate the balance of excitation to inhibition in the developing retinotectal circuit in vivo . J Neurosci. 2006;26:5117–5130. doi: 10.1523/JNEUROSCI.0319-06.2006. [DOI] [PMC free article] [PubMed] [Google Scholar]
- Bevan S, Storey N. Modulation of sodium channels in primary afferent neurons. Novartis Found Symp. 2002;241:144–153. [PubMed] [Google Scholar]
- Bucher D, Prinz AA, Marder E. Animal-to-animal variability in motor pattern production in adults and during growth. J Neurosci. 2005;25:1611–1619. doi: 10.1523/JNEUROSCI.3679-04.2005. [DOI] [PMC free article] [PubMed] [Google Scholar]
- Burrone J, O'Byrne M, Murthy VN. Multiple forms of synaptic plasticity triggered by selective suppression of activity in individual neurons. Nature. 2002;420:414–418. doi: 10.1038/nature01242. [DOI] [PubMed] [Google Scholar]
- Cantallops I, Haas K, Cline HT. Postsynaptic CPG15 promotes synaptic maturation and presynaptic axon arbor elaboration in vivo. Nat Neurosci. 2000;3:1004–1011. doi: 10.1038/79823. [DOI] [PubMed] [Google Scholar]
- Chandrasekaran AR, Shah RD, Crair MC. Developmental homeostasis of mouse retinocollicular synapses. J Neurosci. 2007;27:1746–1755. doi: 10.1523/JNEUROSCI.4383-06.2007. [DOI] [PMC free article] [PubMed] [Google Scholar]
- Chen C, Regehr WG. Developmental remodeling of the retinogeniculate synapse. Neuron. 2000;28:955–966. doi: 10.1016/s0896-6273(00)00166-5. [DOI] [PubMed] [Google Scholar]
- Chen Y, Cantrell AR, Messing RO, Scheuer T, Catterall WA. Specific modulation of Na+ channels in hippocampal neurons by protein kinase C epsilon. J Neurosci. 2005;25:507–513. doi: 10.1523/JNEUROSCI.4089-04.2005. [DOI] [PMC free article] [PubMed] [Google Scholar]
- Chung SH, Bliss TV, Keating MJ. The synaptic organization of optic afferents in the amphibian tectum. Proc R Soc Lond B Biol Sci. 1974a;187:421–447. doi: 10.1098/rspb.1974.0086. [DOI] [PubMed] [Google Scholar]
- Chung SH, Keating MJ, Bliss TV. Functional synaptic relations during the development of the retino-tectal projection in amphibians. Proc R Soc Lond B Biol Sci. 1974b;187:449–459. doi: 10.1098/rspb.1974.0087. [DOI] [PubMed] [Google Scholar]
- Clements JD, Bekkers JM. Detection of spontaneous synaptic events with an optimally scaled template. Biophys J. 1997;73:220–229. doi: 10.1016/S0006-3495(97)78062-7. [DOI] [PMC free article] [PubMed] [Google Scholar]
- Cline HT. Activity-dependent plasticity in the visual systems of frogs and fish. Trends Neurosci. 1991;14:104–111. doi: 10.1016/0166-2236(91)90071-2. [DOI] [PubMed] [Google Scholar]
- Cline HT, Wu G-Y, Malinow R. In vivo development of neuronal structure and function. Cold Spring Harbor Symp Quant Biol. 1997;LXI:95–104. [PubMed] [Google Scholar]
- Cohen-Cory S. The developing synapse: construction and modulation of synaptic structures and circuits. Science. 2002;298:770–776. doi: 10.1126/science.1075510. [DOI] [PubMed] [Google Scholar]
- Cohen-Cory S, Escandon E, Fraser SE. The cellular patterns of BDNF and trkB expression suggest multiple roles for BDNF during Xenopus visual system development. Dev Biol. 1996;179:102–115. doi: 10.1006/dbio.1996.0244. [DOI] [PubMed] [Google Scholar]
- Constantine-Paton M, Cline HT. LTP and activity-dependent synaptogenesis: the more alike they are, the more different they become. Curr Opin Neurobiol. 1998;8:139–148. doi: 10.1016/s0959-4388(98)80017-2. [DOI] [PubMed] [Google Scholar]
- Constantine-Paton M, Cline HT, Debski E. Patterned activity, synaptic convergence, and the NMDA receptor in developing visual pathways. Annu Rev Neurosci. 1990;13:129–154. doi: 10.1146/annurev.ne.13.030190.001021. [DOI] [PubMed] [Google Scholar]
- Debanne D, Daoudal G, Sourdet V, Russier M. Brain plasticity and ion channels. J Physiol (Paris) 2003;97:403–414. doi: 10.1016/j.jphysparis.2004.01.004. [DOI] [PubMed] [Google Scholar]
- Debski EA, Cline HT. Activity-dependent mapping in the retinotectal projection. Curr Opin Neurobiol. 2002;12:93–99. doi: 10.1016/s0959-4388(02)00295-7. [DOI] [PubMed] [Google Scholar]
- Desai NS, Rutherford LC, Turrigiano GG. Plasticity in the intrinsic excitability of cortical pyramidal neurons. Nat Neurosci. 1999;2:515–520. doi: 10.1038/9165. [DOI] [PubMed] [Google Scholar]
- Desai NS, Cudmore RH, Nelson SB, Turrigiano GG. Critical periods for experience-dependent synaptic scaling in visual cortex. Nat Neurosci. 2002;5:783–789. doi: 10.1038/nn878. [DOI] [PubMed] [Google Scholar]
- Dingwell KS, Holt CE, Harris WA. The multiple decisions made by growth cones of RGCs as they navigate from the retina to the tectum in Xenopus embryos. J Neurobiol. 2000;44:246–259. [PubMed] [Google Scholar]
- Gardette R, Debono M, Dupont JL, Crepel F. Electrophysiological studies on the postnatal development of intracerebellar nuclei neurons in rat cerebellar slices maintained in vitro. II. Membrane conductances. Brain Res. 1985;352:97–106. doi: 10.1016/0165-3806(85)90091-4. [DOI] [PubMed] [Google Scholar]
- Haas K, Jensen K, Sin WC, Foa L, Cline HT. Targeted electroporation in Xenopus tadpoles in vivo—from single cells to the entire brain. Differentiation. 2002;70:148–154. doi: 10.1046/j.1432-0436.2002.700404.x. [DOI] [PubMed] [Google Scholar]
- Haas K, Li J, Cline HT. AMPA receptors regulate experience-dependent dendritic arbor growth in vivo. Proc Natl Acad Sci USA. 2006;103:12127–12131. doi: 10.1073/pnas.0602670103. [DOI] [PMC free article] [PubMed] [Google Scholar]
- Hebb DO. Growth of the assembly. New York: Wiley; 1949. The organization of behavior, Chap 4; p. 62. [Google Scholar]
- Holt CE. A single-cell analysis of early RGC differentiation in Xenopus: from soma to axon tip. J Neurosci. 1989;9:3123–3145. doi: 10.1523/JNEUROSCI.09-09-03123.1989. [DOI] [PMC free article] [PubMed] [Google Scholar]
- Holt CE, Harris WA. Order in the initial retinotectal map in Xenopus: a new technique for labelling growing nerve fibres. Nature. 1983;301:150–152. doi: 10.1038/301150a0. [DOI] [PubMed] [Google Scholar]
- Huguenard JR, Hamill OP, Prince DA. Developmental changes in Na+ conductances in rat neocortical neurons: appearance of a slowly inactivating component. J Neurophysiol. 1988;59:778–795. doi: 10.1152/jn.1988.59.3.778. [DOI] [PubMed] [Google Scholar]
- Lázár G. The development of the optic tectum in Xenopus laevis: a Golgi study. J Anat. 1973;116:347–355. [PMC free article] [PubMed] [Google Scholar]
- Lázár G, Székely G. Golgi studies on the optic center of the frog. J Hirnforsch. 1967;9:329–344. [PubMed] [Google Scholar]
- LeMasson G, Marder E, Abbott LF. Activity-dependent regulation of conductances in model neurons. Science. 1993;259:1915–1917. doi: 10.1126/science.8456317. [DOI] [PubMed] [Google Scholar]
- Liao D, Hessler NA, Malinow R. Activation of postsynaptically silent synapses during pairing-induced LTP in CA1 region of hippocampal slice. Nature. 1995;375:400–404. doi: 10.1038/375400a0. [DOI] [PubMed] [Google Scholar]
- Linden DJ. The return of the spike: postsynaptic action potentials and the induction of LTP and LTD. Neuron. 1999;22:661–666. doi: 10.1016/s0896-6273(00)80726-6. [DOI] [PubMed] [Google Scholar]
- Lu W, Constantine-Paton M. Eye opening rapidly induces synaptic potentiation and refinement. Neuron. 2004;43:237–249. doi: 10.1016/j.neuron.2004.06.031. [DOI] [PubMed] [Google Scholar]
- MacDermott AB, Westbrook GL. Early development of voltage-dependent sodium currents in cultured mouse spinal cord neurons. Dev Biol. 1986;113:317–326. doi: 10.1016/0012-1606(86)90167-3. [DOI] [PubMed] [Google Scholar]
- Marder E, Goaillard JM. Variability, compensation and homeostasis in neuron and network function. Nat Rev Neurosci. 2006;7:563–574. doi: 10.1038/nrn1949. [DOI] [PubMed] [Google Scholar]
- Marder E, Abbott LF, Turrigiano GG, Liu Z, Golowasch J. Memory from the dynamics of intrinsic membrane currents. Proc Natl Acad Sci USA. 1996;93:13481–13486. doi: 10.1073/pnas.93.24.13481. [DOI] [PMC free article] [PubMed] [Google Scholar]
- McLaughlin T, O'Leary DD. Molecular gradients and development of retinotopic maps. Annu Rev Neurosci. 2005;28:327–355. doi: 10.1146/annurev.neuro.28.061604.135714. [DOI] [PubMed] [Google Scholar]
- Nieuwkoop PD, Faber J. New York: Garland; 1994. Normal table of Xenopus laevis (Daudin) [Google Scholar]
- Park CC, Ahmed Z. Characterization of sodium current in developing rat diencephalic neurons in serum-free culture. J Neurophysiol. 1991;65:1011–1021. doi: 10.1152/jn.1991.65.5.1011. [DOI] [PubMed] [Google Scholar]
- Pineda RH, Heiser RA, Ribera AB. Developmental, molecular, and genetic dissection of INa in vivo in embryonic zebrafish sensory neurons. J Neurophysiol. 2005;93:3582–3593. doi: 10.1152/jn.01070.2004. [DOI] [PubMed] [Google Scholar]
- Ramoa AS, McCormick DA. Developmental changes in electrophysiological properties of LGNd neurons during reorganization of retinogeniculate connections. J Neurosci. 1994;14:2089–2097. doi: 10.1523/JNEUROSCI.14-04-02089.1994. [DOI] [PMC free article] [PubMed] [Google Scholar]
- Rohrbough J, Spitzer NC. Ca2+-permeable AMPA receptors and spontaneous presynaptic transmitter release at developing excitatory spinal synapses. J Neurosci. 1999;19:8528–8541. doi: 10.1523/JNEUROSCI.19-19-08528.1999. [DOI] [PMC free article] [PubMed] [Google Scholar]
- Sanchez AL, Matthews BJ, Meynard MM, Hu B, Javed S, Cohen Cory S. BDNF increases synapse density in dendrites of developing tectal neurons in vivo. Development. 2006;133:2477–2486. doi: 10.1242/dev.02409. [DOI] [PubMed] [Google Scholar]
- Scheiffele P. Cell-cell signaling during synapse formation in the CNS. Annu Rev Neurosci. 2003;26:485–508. doi: 10.1146/annurev.neuro.26.043002.094940. [DOI] [PubMed] [Google Scholar]
- Schulz DJ. Plasticity and stability in neuronal output via changes in intrinsic excitability. J Exp Biol. 2006;209:4821–4827. doi: 10.1242/jeb.02567. [DOI] [PubMed] [Google Scholar]
- Shi S, Hayashi Y, Esteban JA, Malinow R. Subunit-specific rules governing AMPA receptor trafficking to synapses in hippocampal pyramidal neurons. Cell. 2001;105:331–343. doi: 10.1016/s0092-8674(01)00321-x. [DOI] [PubMed] [Google Scholar]
- Spitzer NC, Ribera AB. Development of electrical excitability in embryonic neurons: mechanisms and roles. J Neurobiol. 1998;37:190–197. [PubMed] [Google Scholar]
- Tao HW, Poo MM. Activity-dependent matching of excitatory and inhibitory inputs during refinement of visual receptive fields. Neuron. 2005;45:829–836. doi: 10.1016/j.neuron.2005.01.046. [DOI] [PubMed] [Google Scholar]
- Thoby-Brisson M, Simmers J. Neuromodulatory inputs maintain expression of a lobster motor pattern-generating network in a modulation-dependent state: evidence from long-term decentralization in vitro . J Neurosci. 1998;18:2212–2225. doi: 10.1523/JNEUROSCI.18-06-02212.1998. [DOI] [PMC free article] [PubMed] [Google Scholar]
- Turrigiano G, Abbott LF, Marder E. Activity-dependent changes in the intrinsic properties of cultured neurons. Science. 1994;264:974–977. doi: 10.1126/science.8178157. [DOI] [PubMed] [Google Scholar]
- Turrigiano GG, Nelson SB. Homeostatic plasticity in the developing nervous system. Nat Rev Neurosci. 2004;5:97–107. doi: 10.1038/nrn1327. [DOI] [PubMed] [Google Scholar]
- Turrigiano GG, Leslie KR, Desai NS, Rutherford LC, Nelson SB. Activity-dependent scaling of quantal amplitude in neocortical neurons. Nature. 1998;391:892–896. doi: 10.1038/36103. [DOI] [PubMed] [Google Scholar]
- Wu G, Malinow R, Cline HT. Maturation of a central glutamatergic synapse. Science. 1996;274:972–976. doi: 10.1126/science.274.5289.972. [DOI] [PubMed] [Google Scholar]
- Wu GY, Cline HT. Time-lapse in vivo imaging of the morphological development of Xenopus optic tectal interneurons. J Comp Neurol. 2003;459:392–406. doi: 10.1002/cne.10618. [DOI] [PubMed] [Google Scholar]
- Wu GY, Zou DJ, Rajan I, Cline H. Dendritic dynamics in vivo change during neuronal maturation. J Neurosci. 1999;19:4472–4483. doi: 10.1523/JNEUROSCI.19-11-04472.1999. [DOI] [PMC free article] [PubMed] [Google Scholar]
- Zhang LI, Tao HW, Poo M. Visual input induces LTP of developing retinotectal synapses. Nat Neurosci. 2000;3:708–715. doi: 10.1038/76665. [DOI] [PubMed] [Google Scholar]
- Zhang W, Linden DJ. The other side of the engram: experience-driven changes in neuronal intrinsic excitability. Nat Rev Neurosci. 2003;4:885–900. doi: 10.1038/nrn1248. [DOI] [PubMed] [Google Scholar]
- Zou D-J, Cline HT. Coordinated regulation of retinal axon and tectal cell growth by endogenous CaMKII in vivo . J Neurosci. 1999;19:8909–8918. [Google Scholar]