

Abstract
Neurons may possess activity-dependent homeostatic mechanisms that permit them to globally alter synaptic strength as activity varies. We used the retinotectal projection of goldfish to test this idea in the intact adult CNS. We first altered tectal neuron activity by selectively manipulating excitatory input. When excitatory synaptic drive to tectal neurons was eliminated by blocking optic fibers, current evoked at optic synapses increased by 183% within 90 min. With partial activity blockade, the increase in synaptic strength scaled with the magnitude of activity depression. This silence-induced potentiation was also rapidly reversible. Conversely, an increase in optic input was followed by a decrease in evoked synaptic current. When optic drive was not altered and tectal neuronal activity was instead increased or decreased pharmacologically via GABAA receptors, synaptic strength again changed inversely with activity, indicating that synaptic strength changed in response to neuronal activity and not excitatory drive. Furthermore, altered synaptic strength tended to return ongoing activity to baseline. Changes in synaptic strength could also be detected in heterosynaptic pathways, indicating a global response. Finally, changes in synaptic strength were associated with corresponding changes in ongoing and evoked firing rates, indicating that the responsivity of tectal neurons was altered. Thus, tectal neurons exhibit archetypical homeostasis, one of the first robust examples in the intact adult CNS.
Keywords: in vivo, visual, activity, homeostasis, synaptic plasticity, retinotectal
Introduction
Theoretical and experimental work suggests that neurons need to maintain an optimal activity level to remain responsive to continually variable input and function properly within their parent neural networks (Abraham and Bear, 1996; Marder et al., 1996; Buonomano and Merzenich, 1998; Spitzer, 1999; Turrigiano, 1999; Marder and Prinz, 2002). Neurons must maintain this activity homeostasis even as currents at individual synapses are altered by Hebbian mechanisms or by sustained changes in input signal. To account for this, it has been proposed that neurons might globally alter excitability or synaptic strength to compensate for changes in activity (Soto-Trevino et al., 2001; Marder and Prinz, 2002; Turrigiano and Nelson, 2004; Houweling et al., 2005). In this manner, individual neurons would maintain activity within functional boundaries, preventing them from reaching activity saturation or falling silent, thereby maintaining network stability and optimizing function.
The most compelling experimental evidence for this “activity homeostasis” comes from studies of cultured neuron networks (Turrigiano et al., 1994, 1998; Desai et al., 1999; Watt et al., 2000; Leslie et al., 2001; Burrone et al., 2002; Wierenga et al., 2005). Suppressing activity in these networks results in a postsynaptically mediated enhancement of both miniature EPSCs (mEPSCs) and evoked EPSCs; conversely, enhancing activity decreases their amplitudes. This response to altered activity has been referred to as “synaptic scaling.” Parallel changes in intrinsic excitability have also been reported.
A major outstanding issue is the extent to which activity homeostasis might explain how activity is regulated in the intact adult nervous system. Although homeostatic changes have been seen in vivo (Desai et al., 2002; Aizenman et al., 2003; Maffei et al., 2004; Chandrasekaran et al., 2007), these are mainly studies in which activity was altered during development (Turrigiano and Nelson, 2004). Similar manipulations after the critical period have not been reported to produce homeostatic changes.
Another important issue is whether activity homeostasis can be rapid. Previous studies report that homeostatic changes typically take place over ∼2 d, sometimes longer (Turrigiano et al., 1994, 1998; Desai et al., 1999; Watt et al., 2000; Leslie et al., 2001; Burrone et al., 2002; Wierenga et al., 2005). This slow response contrasts with the rapid synaptic plasticity demonstrated for many CNS neurons. Long-term potentiation (LTP) and long-term depression (LTD) occur within minutes (Malenka and Bear, 2004; Thiagarajan et al., 2007). To explain network stability, homeostatic responses should have a similar timescale.
To address these issues, we used the intact retinotectal system of the adult goldfish to conduct an in situ electrophysiological study of optic tectum under conditions in which ongoing activity was preserved. When optic fibers were silenced, current evoked at optic synapses began to increase within 10 min and nearly doubled in ∼60 min. This response was reversible and scaled: partial reduction produced partial augmentation and increased activity-produced depression of evoked synaptic current. When tectal activity was altered pharmacologically without changing optic drive, similar homeostatic changes were observed.
Materials and Methods
Animals.
Common goldfish, Carassius auratus, 7–10 cm in standard length, were used in all experiments. These animals were maintained in 20 gallon aquaria at room temperature (20–22°C) under a 12 h light/dark cycle.
Surgery.
To perform optic nerve crush, fish were anesthetized by immersion in tricaine methanesulfonate (50 mg/100 ml; Sigma, St. Louis, MO), immobilized by injection of d-tubocurare (2 μg/g body weight; Sigma), wrapped in moist surgical gauze, and placed in a paraffin holder under a dissecting microscope. The optic nerve was exposed in the orbit and crushed with sterile fine jeweler's forceps until an obvious clear zone was observable in the optic nerve within 1 mm of its exit from the back of the eyeball. Fish were then prepared for placement into the recording apparatus (see below).
In vivo electrophysiology: preparation.
Goldfish were anesthetized by immersion in tricaine methanesulfonate (50 mg/100 ml) and then immobilized by injection of d-tubocurare (2 μg/g body weight). A small plate of dorsal cranium was removed to expose both optic tecta; in addition, a semicircular piece of bone was removed above each orbit to expose the optic nerves. Fish were wrapped in wetted gauze and placed in a modified Plexiglas holder (Meyer and Brink, 1988a). A small glass tube was placed in the fish's mouth to provide continuous irrigation of the gills with aerated water. Balanced salt solution was continuously superfused over both tecta at 0.5 ml/min. A ground wire was inserted into the cranium just posterior to the cerebellum. Wound sites were treated with procaine (Sigma). Because the eye is 40–60 diopters myopic, fish viewed a highly defocused and unchanging image during the experiment except as noted.
In vivo electrophysiology: recording.
Forked, stainless steel bipolar stimulating electrodes were placed onto the surface of the optic nerve within 1 mm of the back of the eyeball. DataWave Systems (Richmond, British Columbia, Canada) was used to control the stimulus protocol, which was one stimulus every 2 min unless specified otherwise. Stimulating current was generated with a constant-current photoisolation unit and adjusted to be just supramaximal (∼6 mA). Field EPSPs (fEPSPs) and multiunit tectal activity were recorded using glass-encased tungsten electrodes with exposed tips of 20–50 μm, plated with platinum. These electrodes were inserted into dorsal tectum to a depth of 125–175 μm, which corresponds to the middle of the stratum fibrosum et griseum superficiale (SFGS). Signals were recorded with a bandwidth of 0.3–10 kHz using a high-impedance microelectrode alternating current amplifier. The signal was then split into two channels and differentially filtered to produce optimal recordings of field EPSPs on one channel and multiunit activity on the other. Field EPSPs and multiunit activity were digitally recorded at 50 kHz using DataWave Systems running on personal computer, monitored in real time using both a digital oscilloscope and personal computer monitor, and stored for later analysis. For photostimulation, a Grass Instruments (Quincy, MA) photostimulator was set at 10 μs duration and 0.003 lumen · s−1 · cm2 intensity.
Application of pharmacological agents.
Intraocular injections of tetrodotoxin (TTX) or marcaine sulfate (Sigma) were made into vitreous through a small hole in the limbus using a 1.0 μl syringe fitted with 50-μm-diameter tapered glass tip. For acute injection during electrophysiologic recording, the tip of the syringe was held in the vitreous with a micromanipulator at the beginning of the experiment, and drug was injected during the recording session. All injections were 70 nl of 1.2 mm TTX in balanced salt solution. Pharmacologic agents [piperidine-4-sufonic acid (P4S), β-hydrastine (BH), CNQX, APV, and alanine; Sigma] applied directly to tectum were dissolved in balanced salt solution and superfused onto the tectal surface at a rate of 0.5 ml/min.
Data analysis.
Data were analyzed off-line using the DataWave Systems analysis software. The field EPSP, evoked in the primary optic layer of tectum (SFGS) by electrical stimulation of the optic nerve, was used to assess retinotectal transmission (Schmidt, 1979; Langdon and Freeman, 1986; Langdon et al., 1988). The fEPSP magnitude was measured as the peak negative deflection from the isoelectric line (zero voltage) expressed in millivolts, reported as the average of five fEPSPs evoked during each 10 min time block (bin). Baseline fEPSP magnitude represents the average magnitude for all evoked fEPSPs during the 30 min before experimental treatment for most experiments; for nerve crush/scotoma experiments, the first 10 min bin served as baseline. For each 10 min bin, fEPSP magnitude was then expressed as a percentage of the baseline fEPSP magnitude; each value is the average of all animals tested and is plotted at a time coincident with the end of the 10 min bin for which it was calculated.
Slope of the fEPSP waveform was measured off-line using DataWave Systems analysis package. Slope was determined for the first third of the waveform after the presynaptic fiber volley (see Fig. 3, asterisk). As measured with this method, the slope included an increasingly negative region of the fEPSP waveform. Alternatively, we also measured slope at 1 ms after the fiber volley, a time that corresponds to one-third of the 2.9 ms between fiber volley and waveform peak in control animals.
Figure 3.

Diagram of retinotectal circuitry. Top, Type XIV pyramidal neurons have a soma in the periventricular layer (SPV) of tectum and extend an apical dendrite into the primary optic layer of tectum (SFGS) in which it branches profusely. Optic fibers, which form 40% of the synapses in SFGS, terminate primarily onto these apical dendrites. Bottom, fEPSP. Stimulation of the optic nerve generates a current sink in the SFGS and a source in SPV. Electrodes placed in the SFGS record a field EPSP reflecting current at optic synapses. The stimulus artifact (arrow) and presynaptic fiber volley (*) are identified. SO, Stratum opticum; SGC, stratum griseum centrale; SAC, stratum album centrale; SPV, stratum periventriculare.
Tectal activity was assessed by recording multiunit activity from SFGS of tectum using the previously described tungsten electrodes. Activity data are reported as spikes per second averaged over each 10 min experimental time block (bin). The threshold for spike detection was set at 133% of the background noise level; each electrical event that exceeded the threshold was counted as a spike. Baseline activity was calculated as average spike rate for the 30 min before experimental treatment. Activity for each 10 min bin was then expressed as a percentage of the baseline spike rate.
Results
Retinal ganglion cells in goldfish, like other vertebrates, exhibit tonic activity. This is spontaneous in the sense that it is maintained in the absence of visual stimulation, such as constant darkness, or diffuse, unchanging illumination as used in the present study. The large majority of optic fibers terminate in a single layer in tectum, SFGS, in which they comprise 40% of all synapses in this lamina (see Fig. 3). Tectal neurons in the SFGS also show tonic activity that is independent of visual stimuli. Perhaps not surprisingly, this tonic activity in tectal neurons is primarily driven by spontaneous retinal activity. When retinal input to SFGS is eliminated, such as by crushing the optic nerve, tectal activity immediately decreases by 90% (Kolls and Meyer, 2000). A previous study (Kolls and Meyer, 2000) showed that, when the optic nerve is crushed, tectal neurons regain normal levels of spontaneous activity by 30 d in the absence of optic drive. This raises the possibility that tectal neurons might be responding to reduced synaptic drive in a homeostatic manner. We explored the possibility of homeostasis further in a series of acute experiments that could determine whether tectal neurons might be able to respond to altered activity in a rapid dynamic manner.
Elimination of optic drive induces a rapid compensatory increase in tectal activity
We first asked how tonic tectal activity might change after optic axotomy. For this, we crushed one optic nerve near the back of the eye. Within 10–15 min of crush, microelectrodes were lowered into the SFGS to record “spontaneous” unit activity of primary postsynaptic neurons in the denervated tectum. Activity was recorded as individual spikes for several hours and expressed as spikes per second averaged over 10 min bins. Each time point in our analyses corresponds to the end of a 10 min bin.
Unit activity in the tectum was quite low at 0.99 spikes/s (Fig. 1, top) immediately after denervation. This contrasts with the innervated tectum of normal fish in which ongoing unit activity in the absence of visual stimulation (uniform diffuse retinal illumination) averaged 39.9 ± 2.4 spikes/s (Fig. 1, bottom, Time 0). Thus, nerve crush decreased ongoing activity by >95% in line with previous work. Activity in the denervated tectum appeared to progressively increase over time and, by 80 min after crush, had increased to 3.98 ± 0.8 spikes/s (Fig. 1, top), which was significantly different from the 10 min time point (p < 0.001, ANOVA; n = 5). Although this spike rate was still well below normal, it nevertheless represented a fourfold increase in ongoing activity in the absence of retinal input.
Figure 1.

Time-dependent changes in ongoing tectal unit activity after nerve crush or TTX eye injection. Top, Intrinsic tectal activity increased significantly after elimination of spontaneous optic input to tectum by optic nerve crush (*p < 0.001). Bottom, Intrinsic tectal activity also increased significantly after elimination of spontaneous optic input to tectum by intraocular TTX injection (**p < 0.001). Time 0 represents baseline activity for 30 min before TTX; other bars represent activity 30–120 min after TTX. Data points are average spike rates for 10 min bins that ended at time indicated on x-axis; error bars are SEM.
This increase in tectal activity might represent a compensatory response to a loss of optic drive. However, it alternatively might somehow be induced by the nerve injury perhaps by producing activity in the severed axons. To distinguish between these alternatives, we left the nerve intact and eliminated optic nerve activity by intraocular TTX injection. The injection was done without disturbing the recording electrodes (see Materials and Methods) so the same units were monitored for 30 min before TTX and for up to 2 h after TTX. Again, rates were averaged over 10 min bins, expressed as spikes per second, and plotted as described above.
The results were closely comparable with what was observed with nerve crush. Baseline tectal activity before TTX was 39.9 ± 2.4 spikes/s. TTX injection produced >90% decline in activity to 1.99 + 0.38 spikes/s within 30 min (Fig. 1, bottom). Subsequently, tectal activity increased to 2.58 ± 0.5 spikes/s at 90 min and to 3.75 ± 0.81 spikes/s within 2 h. Mean tectal activity for 90 and 120 min after TTX were significantly greater than activity recorded 30 min after TTX injection (p < 0.001, ANOVA; n = 6). Thus, “intrinsic” activity of tectal neurons, that is, spike activity not driven by optic input, progressively increased several fold in response to silencing optic fibers.
One issue that has been raised in the early electrophysiological literature is that the units recorded in tectum originate from the arbors of optic fibers (Lettvin et al., 1959). Although this would not affect the main finding here because optic input was eliminated and thus only postsynaptic cells were recorded as reported previously (Meyer and Brink, 1988b), it could affect the estimate of how much ongoing tectal activity is driven by spontaneous retinal activity. More recent work indicates that only postsynaptic cells, not optic axons, are sampled in these extracellular unit recordings (Grant and Lettvin, 1991; Stirling et al., 1998, 2001). To further confirm this in our preparation, a mixture of receptor antagonists (100 μm CNQX for the AMPA receptors, 100 μm APV for the NMDA receptors, and 100 μm alanine for glycine receptors) was superfused over tectum while recording ongoing activity from normal tecta. This treatment blocked synaptic transmission between optic fibers and tectal neurons as evidenced by the near-complete suppression of evoked fEPSPs (Fig. 2). Concurrently, spontaneous tectal activity was suppressed to 5% of normal levels, and no activity could be evoked with visual stimulation (data not shown), consistent with a postsynaptic origin of recorded unit activity.
Figure 2.

Temporal changes in ongoing unit activity and fEPSP after tectal superfusion of a glutamate–glycine receptor antagonist mixture. Blocking synaptic transmission eliminates the fEPSP generated by stimulation of the optic nerve (filled circles). Tectal units coincidentally decline by >95% (open circles), although presynaptic activity in the optic nerve was still present.
Elimination of optic drive with nerve crush increases efficacy of optic synapses
The increase in unit activity could represent a homeostatic response. There are two general ways this could occur. One is that tectal neurons could increase their intrinsic excitability. This is known to occur in cultured neuronal networks when activity is suppressed (Turrigiano et al., 1994, 1999; Desai et al., 1999). We did not explore this possibility for a couple of reasons. The described changes in excitability of cultured neurons occur over days and thus would be too slow to account for the increased activity we found. Analyzing changes in excitability would likely require patching onto the tectal cells in vivo in the adult. The small size of these cells would make this challenging for in vivo time course studies. The fEPSP, described below, provides a much more convenient and effective method of long-term recording.
The other way that tectal cells could respond homeostatically is to increase their synaptic gain (Turrigiano et al., 1998; Turrigiano, 1999). This would render them more sensitive to synaptic input from non-optic sources and cause them to fire more frequently. We explored this possibility for two reasons. Changes in synaptic gain such as LTP are known to occur relatively rapidly and thus could account for the changes in activity levels we observed. And, synaptic current can be continuously monitored in a stable and reliable manner in this system by recording the evoked fEPSP of optic fibers.
The electrically evoked fEPSP in the retinotectal system is closely comparable with that routinely used to monitor synaptic strength in hippocampus in studies of synaptic plasticity (Malenka and Bear, 2004; Lynch et al., 2007; Thiagarajan et al., 2007). Because the retinotectal fEPSP is not so well known as the hippocampus, we briefly describe it. The anatomy of the system is ideal for this measurement. Optic fibers terminate on type XIV neurons, which constitute 90% of neurons in tectum (Vanegas et al., 1974; Romeskie and Sharma, 1979; Meek, 1983). These pyramidal cells have a cell body located in the deepest cell layer in tectum (periventricular layer) and an apical dendrite that extends into the main optic innervation layer, the SFGS, in superficial tectum (Fig. 3, top). Consequently, synchronous activation of optic synapses by electrical stimulation of optic nerve produces a local current sink in the SFGS and source in deeper tectum as demonstrated by current source density analysis (Sutterlin and Prosser, 1970; Schmidt, 1979; Teyler et al., 1981; Langdon et al., 1988; van Deusen and Meyer, 1990). This current can be recorded within the SFGS as a negative potential of several millivolts (Fig. 3, bottom), which becomes positive in deeper tectum. The magnitude of this negative potential has been shown to covary with the current. Pharmacological analysis has further shown that glutamate antagonists block both the negative potential and the current sink in SFGS (Langdon and Freeman, 1986, 1987; van Deusen and Meyer, 1990). For these reasons, amplitude of the optic fEPSP has been the measure of choice to assess changes in current at the retinotectal synapse (Schmidt, 1991; Zhang and Schmidt, 1998, 1999). A critical feature of the fEPSP for these studies is its reproducibility and stability. It can be continually monitored for several hours during an experiment, allowing temporal changes to be readily observed. It also allows comparison between different experiments.
We therefore used the fEPSP to look for changes in synaptic strength at primary optic synapses after loss of activity in optic fibers. We first eliminated optic input to tectum by crushing the optic nerve. The fish were then prepared for recording. A bipolar stimulating electrode was placed distal to the crush, and a recording electrode was placed in SFGS to measure the fEPSP. Recording began as rapidly after nerve crush as feasible. The fEPSP was recorded every 2 min during alternate 10 min intervals and averaged in 10 min bins. The first 10 min bin was used to establish the baseline fEPSP and is plotted as time 0 from crush in Figure 4 (top). The fEPSP magnitude increased after crush for all seven fish tested. The average increase was 163.9 ± 12% of baseline (range, 138–221%), a significant change (p < 0.001, ANOVA; n = 7). Mean time-to-peak potentiation from the time of crush was just under 2 h, although the range was quite variable (75–180 min). Some of this variability was attributable to the variable delay between crush and initiation of the recording, which ranged from 15 to 45 min.
Figure 4.
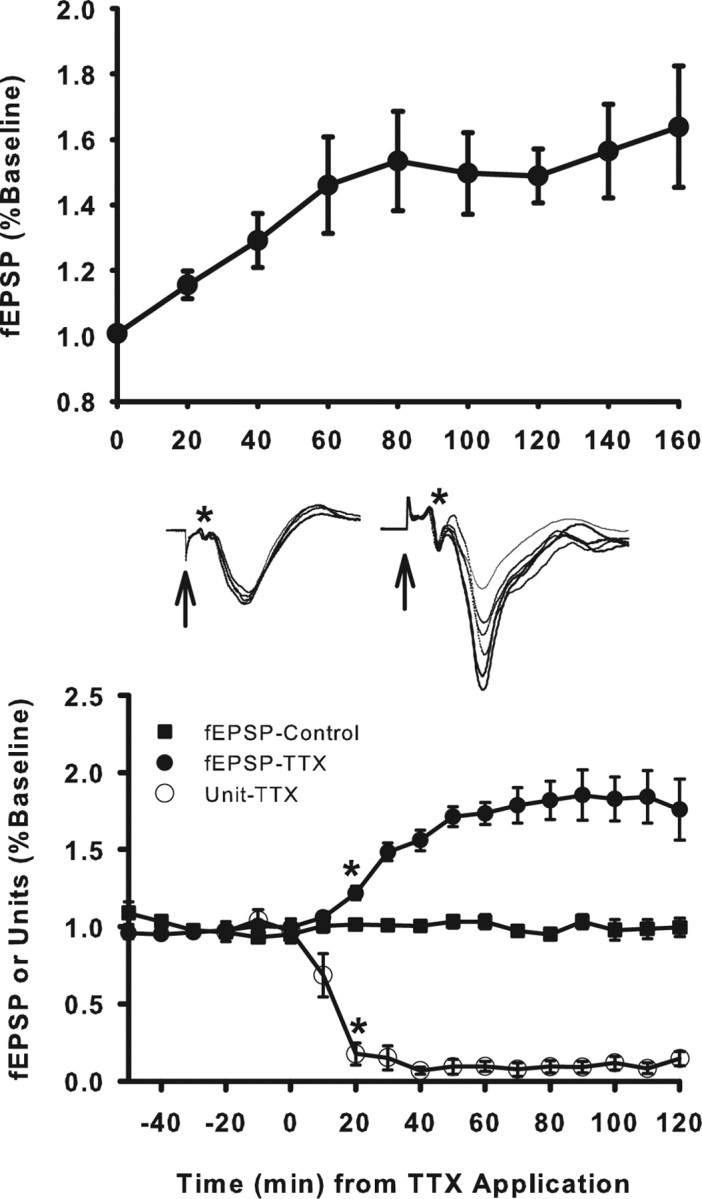
Elimination of optic drive to tectum induces rapid enhancement of current at optic synapses. Top, Changes in fEPSPs evoked in tectum by optic nerve stimulation after optic nerve crush. The fEPSP increased significantly by 20 min (**p < 0.001) and progressively increased, reaching a plateau at ∼60–80 min. Bottom, Changes in fEPSP after intraocular injection of TTX. TTX eliminated optic input to tectum, causing unit activity in tectum to rapidly decline by >90% (open circles). The evoked fEPSPs (filled circles and sample waveform traces at right) increased significantly above baseline by 20 min (*p < 0.001) and reached a plateau at ∼60–80 min. Evoked fEPSPs in contralateral control tecta remained unchanged (filled squares and fEPSP traces at left). Evoked fEPSP magnitudes were calculated as the average of five fEPSPs evoked during each 10 min bin and expressed as a percentage of the average fEPSP for the first 10 min bin of the recording session (nerve crush) or baseline period before injection (time −50 to 0). Each plotted data point is an average for all animals and represents the fEPSP magnitude for the 10 min bin that ended at the time the point is plotted. Error bars indicate SEM. Arrows and asterisks on fEPSP traces represent stimulus artifact and presynaptic fiber volley, respectively.
Elimination of optic drive with intraocular TTX increases efficacy of optic synapses
Two interpretations of the nerve-crush data are possible. The loss of optic drive could have produced a compensatory increase in excitatory synaptic current or injury to the optic nerve could have produced impulse activity in the optic nerve, which produced an LTP-like enhancement of synaptic transmission. To distinguish between these possibilities, we left both optic nerves intact while eliminating spontaneous activity in one eye with TTX. Because this could be done while continual recording the fEPSP, this also provided a more accurate assessment of the chronology of any changes. The evoked fEPSPs were first recorded from the SFGS of both tecta for a 30 min baseline period. TTX was then injected into the vitreous of one eye (time 0 in all experiments) while continuously recording fEPSPs from both tecta every 2 min during and for 2–4 h after injection. Unit activity was also recorded to monitor the efficacy of the TTX blockade. Previous studies have shown that TTX injected into the vitreal chamber is effectively confined to the globe of the injected eye (Meyer, 1982; Schmidt and Edwards, 1983). It does not block conduction in the optic nerve and does leak out to alter tectal activity directly. This was also evident in the present study from the continued effectiveness of electrical stimulation of the nerve of the injected eye and absence of any change in the activity of ipsilateral tectum that is closest to the injected eye.
In tectum that received only signals from the TTX-injected retina (TTX pathway), there was no apparent effect on visual response during the first 5 min after injection, but, by 10 min after injection, visual response to light flashes and moving stimuli within the visual field were eliminated. Spontaneous unit activity decreased to 17.6 ± 7.0% of baseline by 10 min after TTX and to 6.7 ± 2.4% at 20 min (Fig. 4, bottom). In the opposite control tectum, which continued to receive normal retinal input, ongoing activity was unaltered.
In the control pathway, evoked fEPSPs exhibited no significant change in amplitude for the duration of the experiment (Fig. 4, middle left), whereas in the TTX pathway evoked fEPSPs steadily increased in amplitude for all nine fish tested (Fig. 4, middle right). A significant increase in mean fEPSP was detectable within 20 min after TTX (122 ± 4.4% of baseline). By 60 min after injection, mean fEPSP amplitude increased to 175 ± 7.2% of the preinjection baseline value, reaching a maximum of 183 ± 14.0% of baseline within 90 min. Beginning with the 20 min bin, all fEPSP amplitudes were significantly greater than baseline (p < 0.001, ANOVA; n = 9); values recorded at 60 min after TTX and thereafter were not significantly different from potentiation observed after optic nerve crush (p = 0.8, one-way ANOVA). A rapid initial rise in fEPSP amplitude during the 40–50 min immediately after TTX accounted for ∼80% of the enhancement. Thereafter, amplitude increased much more slowly toward an asymptotic value, which was reached ∼90 min after TTX.
In theory, a possible complication with the preceding analysis is that the peak amplitude of the fEPSP might be contaminated by induced spike activity in neurons. This is thought to occur in hippocampus. In the retinotectal system, this is unlikely because spike activity generated by optic nerve stimulation reportedly begins after the fEPSP peak (Schmidt, 1979). However, to be sure, we measured two early components of the fEPSP similarly to that done in hippocampal studies and compared these measures with the peak amplitude measures. First, slope was measured at 1 ms after the fiber volley peak (Fig. 4, middle, shown at asterisk). Because the negative peak of the fEPSP occurs 2.9 ± 0.1 ms after the fiber volley peak, a time course not altered by potentiation (p < 0.001, Student's t test), this effectively corresponded to the slope at the initial third of the fEPSP. Correlation between slope and fEPSP amplitude was 0.74 (p < 0.0001, Pearson's product moment correlation coefficient). However, with this calculation, the first third of the waveform changed continuously as potentiation occurred. To mitigate this complication, we also measured the slope at a fixed negative value of the waveform. A value of −0.9 mV was chosen because it was one-third of the baseline fEPSP amplitude of −2.7 + 0.1 mV. Correlation between this slope measure and fEPSP amplitude was 0.94 (p < 0.0001, Pearson's product moment correlation coefficient). Thus, the early measures of the fEPSP waveform correlated strongly with amplitude, arguing against any contamination of the peak current by postsynaptic action potentials.
During these experiments, the optic nerve was being continuously stimulated every 2 min both before and after TTX. Although this stimulation protocol did not produce potentiation of the fEPSP in the normal tectum, it is conceivable that it might in the silenced tectum because stimulation would be the major source of activity. To eliminate this possibility, electrical stimulation was stopped immediately after intraocular TTX injection and resumed 60 min later (Fig. 5). The first post-TTX time point at 70 min (60–70 min bin) revealed a potentiated fEPSP that was 168 ± 12.8% of baseline. This value was significantly greater than baseline and control fEPSPs (p < 0.00001, one-way ANOVA; n = 7) and was not significantly different from that observed in the continuous stimulation protocol (p = 0.83, one-way ANOVA). Thus, we conclude that potentiation of the fEPSP was not attributable to the stimulation protocol.
Figure 5.

Silenced-induced potentiation occurs in the absence of continuous nerve stimulation. fEPSPs were evoked by optic nerve shock and recorded from SFGS of tectum every 2 min during a 30 min baseline period. At time 0, TTX was injected into one eye, and the protocol for evoking fEPSPs was suspended. The stimulus protocol was resumed at time 60. The first fEPSPs evoked in the silenced pathway (60–70 min bin; filled circles) exhibited a significant potentiation (*p < 0.00001), whereas fEPSPs from contralateral control tecta (open circles) were unaffected. fEPSP magnitudes were calculated and expressed as in TTX experiment of Figure 4. Error bars indicate SEM.
Synaptic enhancement is spatially restricted to silenced regions
If the observed potentiation of fEPSPs represents a homeostatic response, it should only occur in silenced tectal neurons. It should not be a global response of the tectum as a whole. In initial experiments done to test this hypothesis, one-half of the optic nerve was crushed, the fish was placed in the recording apparatus, a silenced area of tectum was located by probing with an electrode, and evoked fEPSPs were then recorded continuously from the silenced and an adjacent active area of the same tectum. This approach allowed for easy location of the silenced area of tectum and for continuous recording of changes is fEPSPs. In these experiments, fEPSP in the silent (denervated) area showed significant potentiation (paired t test, p < 0.04; n = 3), reaching 153.4 ± 9.0% of the time 0 baseline at 60 min after crush and 166.7 ± 26.7% at 120 min (Fig. 6). Adjacent, active (innervated) regions showed no significant change. The somewhat smaller enhancement compared with TTX experiments is likely an artifact of the delay between lesion and the onset of recording, which would have allowed some enhancement to occur before measurements were taken.
Figure 6.

Enhancement is restricted to locally silenced regions of tectum. Partial nerve crush was used to silence local regions of tectum, and fEPSPs were evoked continuously for 120 min (left and middle sets of bars). Evoked fEPSPs increased significantly (*p < 0.04) in silenced tectal regions (Denervated) at 60 and 120 min after crush compared with fEPSPs recorded immediately after crush (time 0). Evoked fEPSPs in adjacent active regions (Innervated) of the same tectum showed no change. In another set of experiments, small scotomas were created in retina to silence very small regions of tectum. After 60 min, fEPSPs were sampled in silenced regions and expressed as a percentage of the fEPSP recorded in adjacent active regions of the same tectum. This fEPSP (Scotoma) was significantly larger (*p < 0.01). Error bars represent SEM.
In the preceding procedure, the size of the scotoma was large, approximately half of tectum. In a refined procedure, small retinal scotomas were created by cauterizing local regions of retina. This procedure selectively eliminates optic input to ∼5–10% of tectum but preserves optic fibers in the remaining tectum (Meyer, 1978). Because of the additional time needed to locate the small silenced area of tectum, it was not possible to do a time course analysis. Instead, fEPSPs in the silenced and adjacent active areas of each tectum were compared at 60 min after producing the scotoma. Five separate sites were sampled in the silent and active regions, and the fEPSP values were compared. The difference of each silenced area was calculated as a percentage of the active area fEPSP. Significantly higher fEPSPs were detected in the silenced regions in all three fish (Fig. 6, scotomas), with a mean enhancement of 147 ± 7.3% (paired t test, p < 0.01; n = 3). Although this enhancement appeared smaller than with TTX, one should be cautious in reading too much into this difference because of the significant differences in the way the measurements were taken. Thus, synaptic potentiation was spatially restricted to regions in which optic input was eliminated.
Enhancement is proportional to reduced synaptic drive
In the preceding experiments, optic drive was completely eliminated. It is conceivable that potentiation of fEPSPs was a specific response to the virtually complete suppression of activity. If potentiation represents a genuine homeostatic response, enhancement should also occur with partial reduction of optic input. Enhancement should “scale,” that is, be proportional to change in synaptic drive. To test this, we lowered the concentration of TTX to partially block activity in one retina, whereas the contralateral retina and tectum were unaltered (control). Units and evoked fEPSPs were then recorded continuously in both tecta for 120 min after injection (Fig. 7). Application of 1.2 mm TTX reduced tectal activity to 6.7% of baseline and was associated with a 183% enhancement of fEPSP amplitude (Fig. 5; included in Fig. 7 for comparison). Reducing TTX from 1.2 to 0.45 mm TTX decreased tectal activity to 30% of baseline, and this in turn resulted in a 150% enhancement of fEPSP amplitude. Further reducing TTX concentration to 0.30 mm reduced tectal activity to only 50% of baseline and was associated with a 130% enhancement of fEPSP amplitude. (Values stated above for 0.45 and 0.30 mm TTX are averages of the 80–110 min post-TTX time points). All fEPSP values at time points 60 min and later were significantly greater than fEPSPs in contralateral control tecta (p < 0.001, ANOVA; n = 9 for 1.2 mm, n = 3 for 0.45 mm, n = 3 for 0.03 mm). Thus, as predicted, the response scaled, and enhancement can occur when there is residual activity in optic fibers and tectal neurons.
Figure 7.

Potentiation of fEPSP scales with degree of retinal activity blockade. Different concentrations of intraocular TTX were used to differentially reduce activity in one retina (circles, 0.3 mm TTX; triangles, 0.45 mm TTX; squares, 1.2 mm TTX). Changes in tectal unit activity (open symbols) and in the fEPSP (filled symbols) were monitored. The fEPSP increased significantly (p < 0.01) by 60 min for all concentrations, but the increase was proportional to the reduction in activity. No such changes were observed in contralateral control tecta (dashed line with open octagons). Units and fEPSPs calculated as in Figure 4. Error bars indicate SEM.
Enhancement is rapidly reversible
If fEPSP potentiation represents a dynamic homeostatic response to altered activity, then one might expect it to be reversible. To evaluate this expectation, we injected a short-acting local anesthetic, marcaine sulfate (2 μl injection of 200 mm), into one eye to block retinal activity, whereas the contralateral retina and tectum (control) remained fully active. We then monitored unit activity and fEPSPs in both tecta for up to 3 h after injection (Fig. 8). In the pathway affected by marcaine sulfate, tectal activity had declined significantly to 11.5% of baseline at 60 min after injection (p < 0.001, ANOVA; n = 5), and the fEPSP had potentiated to 157.3 ± 7.2%, a significant enhancement (p < 0.001, ANOVA; n = 5) comparable with that obtained with TTX. At 180 min after injection, the effect of marcaine had diminished sufficiently in most fish to allow tectal activity and fEPSP to recovery to 61.6 and 103.2 ± 1.2% of baseline, respectively; neither value was significantly different from baseline (p = 0.07 and p = 0.69, respectively, ANOVA; n = 5). The control pathway showed no such changes (p = 0.23). Thus, fEPSP potentiation was reversible on a timescale comparable with its induction.
Figure 8.

Activity-induced potentiation of fEPSP is rapidly reversible. The fEPSP in control tecta (white bars) as well as tectal activity (gray bars) and fEPSPs (black bars) in the contralateral experimental tecta were recorded. After a 30 min baseline (bars denoted as time 0), the short-acting anesthetic marcaine sulfate (3.0 μl of 200 mm) was injected into one eye (experimental). At 60 min (bars denoted 60), tectal activity declined significantly (*p < 0.001), whereas the fEPSP potentiated significantly (*p < 0.001). As the effect of marcaine sulfate diminished during the subsequent 2 h (bars denoted 180), tectal activity primarily recovered and the fEPSP returned to baseline. Control pathway fEPSPs (white bars) and tectal activity (data not shown) did not change significantly over the course of the experiment. Tectal activity and fEPSPs were recorded and expressed as described in Figure 4. Error bars are SEM.
Increased activity induces synaptic depression
In the preceding experiments, activity of tectal neurons was altered by reducing excitatory drive. The homeostasis theory predicts that neurons also should respond homeostatically to an increase in excitatory drive that increases activity. Therefore, an increase in optic drive and tectal activity should be followed by a reduction in synaptic efficacy. To test this hypothesis, visual activity was elevated with stroboscopic illumination while periodically recording the electrically stimulated fEPSP as before. A flash rate of 2 Hz increased total tectal cell activity to 204% of baseline within 20 min; average increase in unit activity from 20–60 min was 194 ± 5.9% (Fig. 9). The fEPSP progressively declined to ∼64.1 ± 2.5% of baseline, a significant depression of synaptic current (p < 0.001, t test; n = 4). The time course for fEPSP depression after increased visual input was comparable with that seen when fEPSP potentiated after depression of visual input. Thus, increasing visual activity induced depression of optic synapses.
Figure 9.

Increased optic drive decreases optic synaptic gain. After a baseline recording period of ongoing tectal unit activity and fEPSP, continuous stroboscopic illumination at 2 Hz was commenced at time 0. Tectal activity (open symbols) increased substantially and was associated with a significant (*p < 0.001) depression of evoked fEPSPs (filled symbols). Unit activity and fEPSPs were calculated and presented as described in Figure 4. Error bars are indicate SEM.
Selectively altering postsynaptic activity changes synaptic efficacy
In previously discussed experiments, optic drive was altered, which in turn altered tectal activity. It is conceivable that this response could be strictly presynaptic. Perhaps optic fibers could respond to altered activity by changing the amount of transmitter released with the postsynaptic neurons playing no active role. Homeostasis predicts that the postsynaptic neuron should itself respond to altered activity. We tested this by altering postsynaptic activity without disturbing ongoing optic drive to tectum directly.
To suppress postsynaptic activity, the GABAA agonist P4S (100 μm) was superfused onto tectum. Vehicle was first superfused while both unit activity and fEPSPs were recorded for a 30 min baseline period. This was followed by continuous superfusion of P4S. Unit activity began to decrease and, at 60 min, was reduced to 53.5 ± 5.7% of baseline (Fig. 10, P4S). At this time, the fEPSP had increased to 136.1 ± 2.4%, a significant enhancement (p < 0.001, t test; n = 4). The increase in fEPSP was not statistically different (p = 0.07, t test) from the enhancement seen when tectal activity was similarly reduced with partial blockade of optic input using 0.3 mm TTX (Fig. 7).
Figure 10.

Pharmacologically induced changes in tectal activity alter optic synaptic gain. Superfusion of GABAA agonist (P4S) onto tectum for 60 min depressed activity (black bar, P4S-60) relative to baseline (black bar, P4S-0). Concurrently, the evoked fEPSPs (white bar, P4S-60) was significantly enhanced (**p < 0.001) compared with baseline fEPSP (white bar, P4S-0). Conversely, superfusion of GABAA antagonist (BH) for 60 min increased tectal activity (black bar, BH-60) relative to baseline (black bar, BH-0), resulting in a significant depression of evoked fEPSPs (white bar, BH-60; *p < 0.002) compared with baseline (white bar, BH-0). Bars for P4S-0 and BH-0 represent mean values for the 30 min baseline period; bars for P4S-60 and BH-60 represent 10 min bins ending at 60 min after superfusion began. Error bars are SEM.
To increase tectal activity, tectum was continuously superfused with a 25 μm solution of the GABAA antagonist BH. Tectal unit activity increased to 162 ± 5.7% of baseline after 60 min of drug application (Fig. 10), whereas the fEPSP showed a significant decrease in magnitude to 64 ± 8.2% of baseline (p < 0.002, t test; n = 5), which was not significantly different from in the strobe study. The effect was reversible, because both activity (99 ± 15% of baseline) and fEPSP (88 ± 4.6% of baseline) returned toward baseline after washout of BH (data not shown). Thus, as predicted, a change in postsynaptic activity, and not necessarily a change in synaptic drive, can alter evoked fEPSPs and efficacy of optic synapses.
Changes in synaptic efficacy affect the responsivity of tectal neurons in a homeostatic manner
In theory, an important function of homeostatic compensation is to maintain the capacity of postsynaptic neurons to effectively respond to axonal input. For example, when postsynaptic activity becomes reduced, the homeostatic response of increased synaptic gain should enable the postsynaptic neuron to respond more robustly to input and thus maintain its activity. Conversely, when postsynaptic activity increases above some critical level, a change in synaptic efficacy should reduce response of the postsynaptic neuron, thus lowering activity and preventing activity saturation. Although the increase in spontaneous tectal neuron activity after input deprivation (Figs. 1, 2) was consistent with this prediction, we tested this more directly.
We first asked whether tectal neurons might fire more readily in response to optic nerve stimulation after input deprivation. After blocking optic drive to tectum with TTX, we used low current stimulation of the optic nerve to elicit evoked unit activity in tectum at both 60 and 120 min after injection. Electrical stimulation of the optic nerve produces evoked unit responses lasting tens of milliseconds as shown in the activity histogram (Fig. 11, top, white bars). The early evoked units (6–10 ms after stimulation) are most probably monosynaptically evoked spikes generated by tectal neurons immediately postsynaptic to optic fibers; the later units likely include circuit activity generated by downstream tectal neurons (Schmidt, 1979; Meyer and Brink, 1988b). After input deprivation, a significant enhancement of evoked units was observed 6–10 ms after stimulus compared with units evoked shortly after the injection when TTX first blocked retinal activity (time 0). Evoked units increased by 43.5% at 60 min (p < 0.02, t test; n = 5) and 45.5% at 120 min (p < 0.01, t test; n = 5). Thus, the same stimulus generates a much greater tectal unit response after synaptic potentiation as predicted from homeostasis. Although units evoked from downstream neurons tended to increase after TTX injection, especially in the 14–16 ms range, these changes were not statistically significant (p = 0.10, t test). (Note that we did not use pre-TTX for the comparison for a couple of reasons. Before TTX, the ongoing rate of activity is much higher than after TTX. This would add to the evoked activity and give an artificially high count. Also, the ongoing activity could itself affect the amount of evoked activity. The critical question is whether there is a time-dependent change in evoked units that would correspond to the time-dependent enhancement of synaptic current. For this reason, we compare acute TTX with 60 and 120 min TTX.)
Figure 11.

Potentiation at optic synapses is associated with greater evoked unit activity in tectum. Top, Activity histogram of evoked units generated by weak stimulation of the optic nerve immediately (0 min, white bars), 60 min (gray bars), and 120 min (black bars) after intraocular TTX injection. The 0 min recordings were meant as a control for the acute effects of the TTX injection because the potentiation developed relatively slowly compared with the effect of TTX on retinal activity. In this example from a single animal, greater evoked unit activity is seen at most poststimulus times at the 60 and 120 min after TTX. Activity was expressed as spikes per second. Bottom, Same experiment as above, but data were pooled from all animals for the 6–10 and 14–20 ms time bins for averaging and statistical testing. The number of spikes evoked at 6–10 ms were significantly greater at both 60 min (gray bar; *p < 0.02) and 120 min (black bar; *p < 0.01) relative to units evoked immediately after injection (white bar). The increase in units evoked from downstream neurons at 14–20 ms did not reach significance. Pre-Stim bars represent intrinsic tectal activity before the stimulus.
We then asked whether increased tectal activity would reduce the responsivity. As described above (Fig. 10), superfusion of GABAA antagonist onto tectum increases tectal neuron activity and produces a decrease in the fEPSP, which represents a decrease in efficacy of optic synapses. If the change in synaptic efficacy represents a homeostatic response to higher than normal activity, we would expect it to eventually reduce optically driven tectal activity, returning it toward baseline. To test this prediction, we simply monitored tectal unit activity as well as the fEPSP while superfusing 25 μm β-hydrastine continuously onto tectum; this procedure followed a 20 min baseline period (Fig. 12). Tectal neuron activity increased and peaked at 162 ± 5.7% of baseline 60 min after superfusion began. Thereafter, ongoing tectal activity progressively decreased and returned to baseline by 120 min (p = 0.05, ANOVA). This return to baseline activity was associated with a progressive decline in fEPSP amplitude to 64 ± 8.0% of baseline by 80 min after infusion (p < 0.01, t test; n = 5) and to 57.0 ± 6.5% of baseline at 120 min. Thus, reduced synaptic efficacy apparently counteracted optic drive and returned tectal activity to baseline. (In addition, it is possible that inhibitory synapses were also increasing their gain to reduce activity.) These data suggest that the change in synaptic efficacy helped maintain activity levels in a homeostatic manner.
Figure 12.

Activity-induced depression of synaptic efficacy returns activity to baseline. After a 20 min baseline recording period, 25 μm β-hydrastine was continuously superfused over tectum for 2 h. The GABAA antagonist slowly increased tectal activity (open circles) to 162 ± 5.7% of baseline 60 min after initiation of superfusion. The increase in tectal activity was associated with a significant (*p < 0.01, t test) depression of the fEPSP (filled circles). Subsequently, tectal activity returned to baseline (p = 0.05), whereas synaptic efficacy remained significantly depressed. Units and fEPSPs were calculated and expressed as in Figure 4. Error bars indicate SEM.
The activity-dependent change in synaptic efficacy is heterosynaptic
If the activity-dependent changes in synaptic efficacy we observed are classically homeostatic, they should also occur at non-optic synapses onto tectal neurons. To address this question, we looked at a second projection into tectum from the torus longitudinalis (TL). The TL is a long cylindrical nucleus that courses along much of the medial edge of each tectum. It sends axons in a mediolateral direction into the most superficial layer of tectum, the stratum marginale (SM). There they form glutamatergic synapses exclusively onto the apical dendrite of type I tectal cells, which are essentially the only postsynaptic neurons in this layer. The soma of these cells resides in the subadjacent SFGS. There optic fibers heavily innervate the proximal segments of its dendrites. Thus, type I cells have two major excitatory inputs, TL fibers and optic axons (Ito, 1970; Laufer and Vanegas, 1974; Ito and Kishida, 1978; Ito et al., 1980; Meek, 1981).
Stimulation of the TL with a bipolar electrode generates a toral field EPSP (Fig. 13, inset). The negative component of this potential occurs between 4 and 10 ms after stimulus represents synaptic current at toral–tectal synapses as shown by current source density analysis that identifies a corresponding sink in SM and source in SFGS (Vanegas et al., 1979; van Deusen and Meyer, 1990). This negative component is blocked by glutamate antagonists (Vanegas et al., 1979; van Deusen and Meyer, 1990). Several established criteria were used to confirm that the recordings were evoked toral fEPSPs. First, because toral fibers project mediolaterally across the tectal surface, the fEPSPs had to be detected lateral to the stimulating electrode (on-beam) but not at sites anterior or posterior to this position. Second, the negative peak at 4–10 ms after stimulus had to be detected at a depth of 25–50 μm in SM but not at 125 μm, corresponding to the SFGS. Third, the waveform needs to have a large negative peak at 4–10 ms and have no negative peak at 1–2 ms. The latter short-latency peak is known to be produced by stimulation of optic fibers within tectum.
Figure 13.

Silencing retina potentiates the toral fEPSP. Visual activity in one eye was blocked by intraocular TTX injection (time 0) after a baseline recording period (time −30 to 0). Toral fEPSPs (filled circles and inset) evoked in one tectum by stimulation of the torus longitudinalis exhibited a significant potentiation to 191.6 ± 30.3% of baseline within 90 min (*p < 0.01). The toral fEPSP in control fish (open circles) that had not received TTX in either eye exhibited no significant change over a similar period of time. Toral fEPSPs were calculated and expressed as in Figure 4. Error bars indicate SEM. Calibration: 6 ms, 0.1 mV.
The TL was stimulated every 2 min to generate toral fEPSPs for a 30 min baseline period in one tectum. The retina was then silenced with an intraocular TTX injection, while continuing to generate and record toral fEPSPs every 2 min for at least 90 min (Fig. 13). The toral fEPSP progressively potentiated in all eight fish tested. The time course and magnitude of this potentiation was remarkably similar to that seen in the optic fEPSP (Fig. 4). Mean potentiation was 191.6 ± 31.3% of baseline (range, 137–303%) within 90 min, a value significantly greater than baseline (p < 0.01, t test; n = 8) and, interestingly, not significantly different from potentiation observed at the retinotectal synapse (p = 0.18, one-way ANOVA). The toral fEPSP in control fish that received no TTX injection was unchanged during 1.5 h of stimulation. This finding indicates that synaptic enhancement observed after elimination of spontaneous optic input is heterosynaptic in nature and is not restricted to optic synapses, suggesting that it represents a global scaling of synaptic strength by tectal neurons.
Discussion
We conducted an acute electrophysiological study on the visual system of the intact adult goldfish with ongoing activity. Activity of tectal neurons was altered in several ways while monitoring impulse activity and evoked synaptic current. Tectal cells responded rapidly, within tens of minutes, in a manner consistent with classical homeostasis theory.
Tectal neurons exhibit activity homeostasis
Although the term homeostasis has come to be broadly used, there is an archetypical homeostasis hypothesis based on the consideration of how a neuron should behave in a circuit. Neurons must maintain a certain level of activity for the circuit to function properly. Because synaptic input can vary and gain can change by synaptic plasticity, the neuron itself should be able to monitor and actively maintain its level of activity, activity homeostasis. This has been postulated to be a whole-cell response in which altered activity at a subset of synapses alters the efficacy of all synapses (Spitzer, 1999; Stemmler and Koch, 1999; Turrigiano, 1999; Watt et al., 2000; Marder and Prinz, 2002). Experimental evidence for global scaling of synaptic gain has come from studies of networks of cultured pyramidal neurons. When TTX eliminated firing, mEPSC amplitudes increased by 192% after TTX removal. When only excitatory transmission was interrupted, evoked EPSCs were enhanced by 195% after alleviation of the block (Turrigiano et al., 1998).
From these considerations, a number of key features of activity homeostasis have been articulated. The following were observed in tectal neurons.
Maintenance of activity rates
Ongoing activity rates should be actively maintained so that perturbations of activity rates induce a corrective response back toward nominal activity. As expected, decreased tectal activity (intraocular TTX) was followed by a doubling of tectal activity. Increased tectal activity (GABAA antagonist) was followed by a return to basal levels.
Compensatory synaptic gain
Gain should change in the direction to restore normal activity. As expected, optic synapses increased gain when tectal activity was reduced. Gain was decreased when activity was elevated.
Synaptic scaling
The changes in synaptic gain should be proportional to the degree of altered activity (within boundary conditions). As predicted, three different levels of suppression of tectal activity using different doses of intraocular TTX produced three different levels of synaptic gain.
Neuronal impulse activity regulates the response
The homeostatic response should be generated by a change in tectal activity regardless of synaptic activity. The hypothesis is that the detector is the postsynaptic neuron (not the synapse), and it detects impulse activity (not synaptic activity per se). As predicted, synaptic gain increased when tectal activity was reduced by either suppressing optic fiber activity or by suppressing tectal activity directly with GABA agonists. In the latter case, optic synaptic activity was normal. Contrariwise, synaptic gain decreased when tectal activity was increased by increasing optic activity (strobe) or by increasing tectal activity directly with GABA antagonists, leaving optic activity unaltered. Thus, optic synaptic gain was altered independently of optic activity.
Heterosynaptic response
The homeostatic response should be global and affect all synapses. In line with this, silencing optic fibers induced increased gain at both the optic and toral synapses.
Compensatory change in responsivity
The outcome of the homeostatic response is to restore circuit function, in particular, response to input. Consistent with this, the homeostatic response to retinal silencing was associated with increased responsiveness to optic input.
In conclusion, these results constitute one of the first robust examples of activity homeostasis in the intact adult CNS.
Activity homeostasis in the adult CNS
The pioneering studies that demonstrated activity homeostasis in cultured neurons stimulated a search for homeostasis in the intact adult CNS (Burrone and Murthy, 2003; Turrigiano and Nelson, 2004). Unfortunately, clear multifaceted examples of activity homeostasis have been elusive. Developmental studies have provided evidence for some homeostatic changes in CNS. During development, most notably of the visual system, correlated activity is used as a developmental cue to reinforce coactive synapses and thereby increase synaptic convergence. This process is actually nonhomeostatic because it increases synaptic drive and responsiveness. However, several studies have identified concomitant compensatory changes in the circuit that tend to preserve drive and responsivity (Desai et al., 2002; Aizenman et al., 2003; Maffei et al., 2004). Unfortunately, similar changes have not been seen after the critical period of development.
Disuse enhancement is a compensatory response that has been seen in the intact adult CNS. Blocking monosynaptic sensory input to spinal motor neurons by tenotomy, nerve section, or TTX blockade (Robbins and Nelson, 1970; Gallego et al., 1979; Manabe et al., 1989) leads to an enhanced evoked EPSP after several days. A similar enhancement has been seen after blocking preganglionic fibers to superior cervical ganglion (Gallego and Geijo, 1987). However, these responses were not activity homeostasis. In spinal cord, active inputs onto the same motor neuron did not show enhancement (Miyata and Yasuda, 1988). In the autonomic system, selective blockade of collaterals to superior cervical ganglion produced an enhancement in unblocked collaterals to stellate ganglion (Gallego and Geijo, 1987). These results are consistent with a presynaptic response to reduced axonal activity (e.g., sprouting) rather than the predicted global postsynaptic response. Analogous changes have been seen in long-term hippocampal slices when activity is suppressed (Murthy et al., 2001).
Despite the lack of examples, activity homeostasis may be widespread in the adult CNS. Homeostatic changes have been observed in slice preparations of late postnatal animals, including hippocampus, striatum, and amygdala (Royer and Pare, 2003; Fan et al., 2005; Fino et al., 2005). These changes were all associated with the induction of LTP or LTD (see metaplasticity below), and some changes were nonglobal so they might not represent strict activity homeostasis. Nevertheless, these findings argue that homeostasis likely occurs in the intact nervous system. It is possible that demonstrating homeostasis in vivo may require specific experimental conditions. In the present experiment, the nervous system was left intact, and, importantly, ongoing activity was preserved by avoiding general anesthetics. These conditions have rarely been met in previous studies.
Rapid homeostasis
Previous examples of archetypical activity homeostasis involving changes in either synaptic gain or excitability have typically occurred over ∼2 d with detectable changes in ∼1 d. Other investigations of homeostatic synaptic change, in cultured neurons or slices, reported similar time courses (Desai et al., 1999, 2002; Leslie et al., 2001; Murthy et al., 2001; Kilman et al., 2002). All these changes are relatively slow compared with synaptic plasticity such as LTP and LTD, which take minutes. [In Xenopus tadpoles, increasing tectal activity with intense visual stimulation for 4–5 h produced compensatory changes in tectum detectable in several hours of subsequent recordings (Aizenman et al., 2003). In contrast to our findings, tectal excitability actually increased instead of decreasing and thus would not be “archetypical” homeostasis. However, there was also a homeostatic decrease evoked synaptic current, indicating that changes can occur in development on the order of hours.] In contrast, synaptic enhancement observed in our experiments was significant within 10–20 min and fully expressed within 60–90 min. Thus, the observed synaptic potentiation could quickly counter rapid reductions in total synaptic drive generated by Hebbian mechanisms or changes in afferent signals such as associated with different environmental conditions.
Rapid compensatory changes have been observed previously, but these are distinct from activity homeostasis. Most of these involve changes associated with the induction of LTP or LTD that tend to mitigate the overall effect of the enhancement or depression (Royer and Pare, 2003; Fan et al., 2005; Fino et al., 2005). For example, induction of LTP at one set of synapses can cause depression at others (Royer and Pare, 2003), and, the sign of plasticity, enhancement versus repression, can depend on the history of activity in the neuron referred to as metaplasticity (Abraham and Bear, 1996; Malenka and Bear, 2004). These types of compensatory changes might help explain why LTP does not cause run away excitation or LTD depression, but they do not directly explain how a neuron maintains an optimal level of activity particularly in systems in which LTP or LTD may not be important. The adult retinotectal system is a case in point because homeostatic change occurred without inducing LTP or LTD and little if any LTP can be induced in the intact projection (Schmidt, 1990).
Two similar examples of rapid homeostasis have been reported recently. One is the neuromuscular junction of Drosophila larva (Frank et al., 2006). Receptor blockade was found to induce an increase in mEPSP within minutes. The other was observed in dissociated hippocampal cultures (Sutton et al., 2006) in which NMDA receptor blockade induced a rapid increase in synaptic strength. In both cases, the compensatory change required blockade of minis. It was unaffected by either presynaptic or postsynaptic impulse activity, that is, blocking impulse activity had no such effect. This is very different from activity homeostasis and from our results in particular. In our case, blocking either presynaptic or postsynaptic activity while leaving minis intact induced a homeostatic gain in synaptic function.
The present study shows that activity homeostasis can occur in the adult CNS. How prevalent activity homeostasis is and whether different types of homeostatic mechanism participate in regulating CNS function remains open.
Footnotes
This work was supported by National Institutes of Health Grant R01 EY013586 (R.L.M.).
References
- Abraham WC, Bear MF. Metaplasticity: the plasticity of synaptic plasticity. Trends Neurosci. 1996;19:126–130. doi: 10.1016/s0166-2236(96)80018-x. [DOI] [PubMed] [Google Scholar]
- Aizenman CD, Akerman CJ, Jensen KR, Cline HT. Visually driven regulation of intrinsic neuronal excitability improves stimulus detection in vivo. Neuron. 2003;39:831–842. doi: 10.1016/s0896-6273(03)00527-0. [DOI] [PubMed] [Google Scholar]
- Buonomano DV, Merzenich MM. Cortical plasticity: from synapses to maps. Annu Rev Neurosci. 1998;21:149–186. doi: 10.1146/annurev.neuro.21.1.149. [DOI] [PubMed] [Google Scholar]
- Burrone J, Murthy VN. Synaptic gain control and homeostasis. Curr Opin Neurobiol. 2003;13:560–567. doi: 10.1016/j.conb.2003.09.007. [DOI] [PubMed] [Google Scholar]
- Burrone J, O'Byrne M, Murthy VN. Multiple forms of synaptic plasticity triggered by selective suppression of activity in individual neurons. Nature. 2002;420:414–418. doi: 10.1038/nature01242. [DOI] [PubMed] [Google Scholar]
- Chandrasekaran AR, Shah RD, Crair MC. Developmental homeostasis of mouse retinocollicular synapses. J Neurosci. 2007;27:1746–1755. doi: 10.1523/JNEUROSCI.4383-06.2007. [DOI] [PMC free article] [PubMed] [Google Scholar]
- Desai NS, Rutherford LC, Turrigiano GG. Plasticity in the intrinsic excitability of cortical pyramidal neurons. Nat Neurosci. 1999;2:515–520. doi: 10.1038/9165. [DOI] [PubMed] [Google Scholar]
- Desai NS, Cudmore RH, Nelson SB, Turrigiano GG. Critical periods for experience-dependent synaptic scaling in visual cortex. Nat Neurosci. 2002;5:783–789. doi: 10.1038/nn878. [DOI] [PubMed] [Google Scholar]
- Fan Y, Fricker D, Brager DH, Chen X, Lu HC, Chitwood RA, Johnston D. Activity-dependent decrease of excitability in rat hippocampal neurons through increases in I(h) Nat Neurosci. 2005;8:1542–1551. doi: 10.1038/nn1568. [DOI] [PubMed] [Google Scholar]
- Fino E, Glowinski J, Venance L. Bidirectional activity-dependent plasticity at corticostriatal synapses. J Neurosci. 2005;25:11279–11287. doi: 10.1523/JNEUROSCI.4476-05.2005. [DOI] [PMC free article] [PubMed] [Google Scholar]
- Frank CA, Kennedy MJ, Goold CP, Marek KW, Davis GW. Mechanisms underlying the rapid induction and sustained expression of synaptic homeostasis. Neuron. 2006;52:663–677. doi: 10.1016/j.neuron.2006.09.029. [DOI] [PMC free article] [PubMed] [Google Scholar]
- Gallego R, Geijo E. Chronic block of the cervical trunk increases synaptic efficacy in the superior and stellate ganglia of the guinea-pig. J Physiol (Lond) 1987;382:449–462. doi: 10.1113/jphysiol.1987.sp016377. [DOI] [PMC free article] [PubMed] [Google Scholar]
- Gallego R, Kuno M, Nunez R, Snider WD. Disuse enhances synaptic efficacy in spinal mononeurones. J Physiol (Lond) 1979;291:191–205. doi: 10.1113/jphysiol.1979.sp012807. [DOI] [PMC free article] [PubMed] [Google Scholar]
- Grant A, Lettvin J. Sources of electrical transients in tectal neuropil of the frog, Rana pipiens. Brain Res. 1991;560:106–121. doi: 10.1016/0006-8993(91)91221-l. [DOI] [PubMed] [Google Scholar]
- Houweling AR, Bazhenov M, Timofeev I, Steriade M, Sejnowski TJ. Homeostatic synaptic plasticity can explain post-traumatic epileptogenesis in chronically isolated neocortex. Cereb Cortex. 2005;15:834–845. doi: 10.1093/cercor/bhh184. [DOI] [PMC free article] [PubMed] [Google Scholar]
- Ito H. Fine structures of the carp tectum opticum. J Hirnforsch. 1970;12:325–354. [PubMed] [Google Scholar]
- Ito H, Kishida R. Afferent and efferent fiber connections of the carp torus longitudinalis. J Comp Neurol. 1978;181:465–475. doi: 10.1002/cne.901810303. [DOI] [PubMed] [Google Scholar]
- Ito H, Butler AB, Ebbesson SO. An ultrastructural study of the normal synaptic organization of the optic tectum and the degenerating tectal afferents from retina, telencephalon, and contralateral tectum in a teleost, Holocentrus rufus. J Comp Neurol. 1980;191:639–659. doi: 10.1002/cne.901910409. [DOI] [PubMed] [Google Scholar]
- Kilman V, van Rossum MC, Turrigiano GG. Activity deprivation reduces miniature IPSC amplitude by decreasing the number of postsynaptic GABAA receptors clustered at neocortical synapses. J Neurosci. 2002;22:1328–1337. doi: 10.1523/JNEUROSCI.22-04-01328.2002. [DOI] [PMC free article] [PubMed] [Google Scholar]
- Kolls BJ, Meyer RL. Increased spontaneous unit activity and appearance of spontaneous negative potentials in the goldfish tectum during refinement of the optic projection. J Neurosci. 2000;20:338–350. doi: 10.1523/JNEUROSCI.20-01-00338.2000. [DOI] [PMC free article] [PubMed] [Google Scholar]
- Langdon RB, Freeman JA. Antagonists of glutaminergic neurotransmission block retinotectal transmission in goldfish. Brain Res. 1986;398:169–174. doi: 10.1016/0006-8993(86)91263-1. [DOI] [PubMed] [Google Scholar]
- Langdon RB, Freeman JA. Pharmacology of retinotectal transmission in the goldfish: effects of nicotinic ligands, strychnine and kynurenic acid. J Neurosci. 1987;7:760–773. doi: 10.1523/JNEUROSCI.07-03-00760.1987. [DOI] [PMC free article] [PubMed] [Google Scholar]
- Langdon R, Manis P, Freeman J. Goldfish retinotectal transmission in vitro: component current sink-source pairs isolated by varying calcium and magnesium levels. Brain Res. 1988;441:299–308. doi: 10.1016/0006-8993(88)91408-4. [DOI] [PubMed] [Google Scholar]
- Laufer M, Vanegas H. The optic tectum of a perciform teleost. II. Fine structure. J Comp Neurol. 1974;154:61–95. doi: 10.1002/cne.901540105. [DOI] [PubMed] [Google Scholar]
- Leslie KR, Nelson SB, Turrigiano GG. Postsynaptic depolarization scales quantal amplitude in cortical pyramidal neurons. J Neurosci. 2001;21(RC170):1–6. doi: 10.1523/JNEUROSCI.21-19-j0005.2001. [DOI] [PMC free article] [PubMed] [Google Scholar]
- Lettvin J, Maturana H, McCulloch W, Pitts W. What the frog's eye tells the frog's brain. Proc Inst Radio Engr. 1959;47:1940–1951. [Google Scholar]
- Lynch G, Rex CS, Gall CM. LTP consolidation: substrates, explanatory power, and functional significance. Neuropharmacology. 2007;52:12–23. doi: 10.1016/j.neuropharm.2006.07.027. [DOI] [PubMed] [Google Scholar]
- Maffei A, Nelson SB, Turrigiano GG. Selective reconfiguration of layer 4 visual cortical circuitry by visual deprivation. Nat Neurosci. 2004;7:1353–1359. doi: 10.1038/nn1351. [DOI] [PubMed] [Google Scholar]
- Malenka RC, Bear MF. LTP and LTD: an embarrassment of riches. Neuron. 2004;44:5–21. doi: 10.1016/j.neuron.2004.09.012. [DOI] [PubMed] [Google Scholar]
- Manabe T, Kaneko S, Kuno M. Disuse-induced enhancement of Ia synaptic transmission in spinal motoneurons of the rat. J Neurosci. 1989;9:2455–2461. doi: 10.1523/JNEUROSCI.09-07-02455.1989. [DOI] [PMC free article] [PubMed] [Google Scholar]
- Marder E, Prinz AA. Modeling stability in neuron and network function: the role of activity in homeostasis. BioEssays. 2002;24:1145–1154. doi: 10.1002/bies.10185. [DOI] [PubMed] [Google Scholar]
- Marder E, Abbott LF, Turrigiano GG, Liu Z, Golowasch J. Memory from the dynamics of intrinsic membrane currents. Proc Natl Acad Sci USA. 1996;93:13481–13486. doi: 10.1073/pnas.93.24.13481. [DOI] [PMC free article] [PubMed] [Google Scholar]
- Meek J. A Golgi-electron microscopic study of goldfish optic tectum. I. Description of afferents, cell types, and synapses. J Comp Neurol. 1981;199:149–173. doi: 10.1002/cne.901990202. [DOI] [PubMed] [Google Scholar]
- Meek J. Functional anatomy of the tectum mesencephali of the goldfish: an explorative analysis of the functional implication of the laminar structure organization of the tectum. Brain Res Rev. 1983;6:247–297. doi: 10.1016/0165-0173(83)90008-5. [DOI] [PubMed] [Google Scholar]
- Meyer RL. Autoradiographic mapping of retinotectal fibers in normal goldfish and after regeneration following nerve crush. Soc Neurosci Abstr. 1978;4:477. [Google Scholar]
- Meyer RL. Tetrodotoxin blocks the formation of ocular dominance columns in goldfish. Science. 1982;218:589–591. doi: 10.1126/science.7123262. [DOI] [PubMed] [Google Scholar]
- Meyer RL, Brink DL. Locally correlated activity in the goldfish tectum in the absence of optic innervation. Brain Res. 1988a;469:25–36. doi: 10.1016/0165-3806(88)90166-6. [DOI] [PubMed] [Google Scholar]
- Meyer RL, Brink DL. Locally correlated activity in the goldfish tectum in the absence of optic innervation. Dev Brain Res. 1988b;41:25–36. doi: 10.1016/0165-3806(88)90166-6. [DOI] [PubMed] [Google Scholar]
- Miyata Y, Yasuda H. Enhancement of Ia synaptic transmission following muscle nerve section: dependence upon protein synthesis. Neurosci Res. 1988;5:338–346. doi: 10.1016/0168-0102(88)90035-1. [DOI] [PubMed] [Google Scholar]
- Murthy VN, Schikorski T, Stevens CF, Zhu Y. Inactivity produces increases in neurotransmitter release and synapse size. Neuron. 2001;32:673–682. doi: 10.1016/s0896-6273(01)00500-1. [DOI] [PubMed] [Google Scholar]
- Robbins N, Nelson PG. Tenotomy and the spinal monosynaptic reflex. Exp Neurol. 1970;27:66–75. doi: 10.1016/0014-4886(70)90202-5. [DOI] [PubMed] [Google Scholar]
- Romeskie M, Sharma SC. The goldfish optic tectum: a golgi study. Neuroscience. 1979;4:625–642. doi: 10.1016/0306-4522(79)90139-8. [DOI] [PubMed] [Google Scholar]
- Royer S, Pare D. Conservation of total synaptic weight through balanced synaptic depression and potentiation. Nature. 2003;422:518–522. doi: 10.1038/nature01530. [DOI] [PubMed] [Google Scholar]
- Schmidt JT. The laminar organization of optic nerve fibers in the tectum of goldfish. Proc R Soc Lond B Biol Sci. 1979;205:287–306. doi: 10.1098/rspb.1979.0066. [DOI] [PubMed] [Google Scholar]
- Schmidt JT. Long-term potentiation and activity-dependent retinotopic sharpening in the regenerating retinotectal projection of goldfish: common sensitive period and sensitivity to NMDA blockers. J Neurosci. 1990;10:233–246. doi: 10.1523/JNEUROSCI.10-01-00233.1990. [DOI] [PMC free article] [PubMed] [Google Scholar]
- Schmidt JT. Long-term potentiation during the activity-dependent sharpening of the retinotopic map in goldfish. Ann NY Acad Sci. 1991;627:10–25. doi: 10.1111/j.1749-6632.1991.tb25910.x. [DOI] [PubMed] [Google Scholar]
- Schmidt JT, Edwards DL. Activity sharpens the map during the regeneration of the retinotectal projection in goldfish. Brain Res. 1983;269:29–39. doi: 10.1016/0006-8993(83)90959-9. [DOI] [PubMed] [Google Scholar]
- Soto-Trevino C, Thoroughman KA, Marder E, Abbott LF. Activity-dependent modification of inhibitory synapses in models of rhythmic neural networks. Nat Neurosci. 2001;4:297–303. doi: 10.1038/85147. [DOI] [PubMed] [Google Scholar]
- Spitzer NC. New dimensions of neuronal plasticity. Nat Neurosci. 1999;2:489–491. doi: 10.1038/9132. [DOI] [PubMed] [Google Scholar]
- Stemmler M, Koch C. How voltage-dependent conductances can adapt to maximize the information encoded by neuronal firing rate. Nat Neurosci. 1999;2:521–527. doi: 10.1038/9173. [DOI] [PubMed] [Google Scholar]
- Stirling R, Dunlop S, Beazley L. An in vitro technique for electrophysiological mapping of reptilian retinotectal projections. J Neurosci Methods. 1998;81:85–89. doi: 10.1016/s0165-0270(98)00020-x. [DOI] [PubMed] [Google Scholar]
- Stirling R, Bartlett C, Dunlop S, Beazley L. Light-evoked responses recorded from the optic tectum in the goldfish are postsynaptic. the 34th Annual Meeting of the International Union of Physiological Sciences; August; Christchurch, New Zealand. 2001. Presented at. [Google Scholar]
- Sutterlin AM, Prosser CL. Electrical properties of goldfish tectum. J Neurophysiol. 1970;33:36–45. doi: 10.1152/jn.1970.33.1.36. [DOI] [PubMed] [Google Scholar]
- Sutton MA, Ito HT, Cressy P, Kempf C, Woo JC, Schuman EM. Miniature neurotransmission stabilizes synaptic function via tonic suppression of local dendritic protein synthesis. Cell. 2006;125:785–799. doi: 10.1016/j.cell.2006.03.040. [DOI] [PubMed] [Google Scholar]
- Teyler TJ, Lewis D, Shashoua VE. Neurophysiological and biochemical properties of the goldfish optic tectum maintained in vitro. Brain Res Bull. 1981;7:45–56. doi: 10.1016/0361-9230(81)90097-6. [DOI] [PubMed] [Google Scholar]
- Thiagarajan TC, Lindskog M, Malgaroli A, Tsien RW. LTP and adaptation to inactivity: overlapping mechanisms and implications for metaplasticity. Neuropharmacology. 2007;52:156–175. doi: 10.1016/j.neuropharm.2006.07.030. [DOI] [PubMed] [Google Scholar]
- Turrigiano G, Abbott LF, Marder E. Activity-dependent changes in the intrinsic properties of cultured neurons. Science. 1994;264:974–977. doi: 10.1126/science.8178157. [DOI] [PubMed] [Google Scholar]
- Turrigiano GG. Homeostatic plasticity in neuronal networks: the more things change, the more they stay the same. Trends Neurosci. 1999;22:221–227. doi: 10.1016/s0166-2236(98)01341-1. [DOI] [PubMed] [Google Scholar]
- Turrigiano GG, Nelson SB. Homeostatic plasticity in the developing nervous system. Nat Rev Neurosci. 2004;5:97–107. doi: 10.1038/nrn1327. [DOI] [PubMed] [Google Scholar]
- Turrigiano GG, Leslie KR, Desai NS, Rutherford LC, Nelson SB. Activity-dependent scaling of quantal amplitude in neocortical neurons. Nature. 1998;391:892–896. doi: 10.1038/36103. [DOI] [PubMed] [Google Scholar]
- van Deusen EB, Meyer RL. Pharmacologic evidence for NMDA, APB and kainate/quisqualate retinotectal transmission in the isolated whole tectum of goldfish. Brain Res. 1990;536:86–96. doi: 10.1016/0006-8993(90)90012-z. [DOI] [PubMed] [Google Scholar]
- Vanegas H, Laufer M, Amat J. The optic tectum of a perciform teleost. I. General configuration and cytoarchitecture. J Comp Neurol. 1974;154:43–60. doi: 10.1002/cne.901540104. [DOI] [PubMed] [Google Scholar]
- Vanegas H, Williams B, Freeman JA. Responses to stimulation of marginal fibers in the teleostean optic tectum. Exp Brain Res. 1979;34:335–349. doi: 10.1007/BF00235677. [DOI] [PubMed] [Google Scholar]
- Watt AJ, van Rossum MC, MacLeod KM, Nelson SB, Turrigiano GG. Activity coregulates quantal AMPA and NMDA currents at neocortical synapses. Neuron. 2000;26:659–670. doi: 10.1016/s0896-6273(00)81202-7. [DOI] [PubMed] [Google Scholar]
- Wierenga CJ, Ibata K, Turrigiano GG. Postsynaptic expression of homeostatic plasticity at neocortical synapses. J Neurosci. 2005;25:2895–2905. doi: 10.1523/JNEUROSCI.5217-04.2005. [DOI] [PMC free article] [PubMed] [Google Scholar]
- Zhang C, Schmidt JT. Adenosine A1 receptors mediate retinotectal presynaptic inhibition: uncoupling by C-kinase and role in LTP during regeneration. J Neurophysiol. 1998;79:501–510. doi: 10.1152/jn.1998.79.2.501. [DOI] [PubMed] [Google Scholar]
- Zhang Z, Schmidt JT. Adenosine A1 and class II metabotropic glutamate receptors mediate shared presynaptic inhibition of retinotectal transmission. J Neurophysiol. 1999;82:2947–2955. doi: 10.1152/jn.1999.82.6.2947. [DOI] [PubMed] [Google Scholar]