

Abstract
We investigated the role of retinotopic visual cortex and motion-sensitive areas in representing the content of visual awareness during ambiguous structure-from-motion (SFM), using functional magnetic resonance imaging (fMRI) and multivariate statistics (support vector machines). Our results indicate that prediction of perceptual states can be very accurate for data taken from dorsal visual areas V3A, V4D, V7, and MT+ and for parietal areas responsive to SFM, but to a lesser extent for other visual areas. Generalization of prediction was possible, because prediction accuracy was significantly better than chance for both an unambiguous stimulus and a different experimental design. Detailed analysis of eye movements revealed that strategic and even encouraged beneficial eye movements were not the cause of the prediction accuracy based on cortical activation. We conclude that during perceptual rivalry, neural correlates of visual awareness can be found in retinotopic visual cortex, MT+, and parietal cortex. We argue that the organization of specific motion-sensitive neurons creates detectable biases in the preferred direction selectivity of voxels, allowing prediction of perceptual states. During perceptual rivalry, retinotopic visual cortex, in particular higher-tier dorsal areas like V3A and V7, actively represents the content the visual awareness.
Keywords: perceptual bistability, structure-from-motion, fMRI, visual cortex, ambiguously rotating spheres, multivariate classification
Introduction
An important goal of neuroscience is to explain how the brain represents our conscious experience in terms of neural mechanisms. Especially useful are ambiguous stimuli: viewing such stimuli results in randomly occurring alternations between perceptual states (Blake and Logothetis, 2002), dissociating perceptual from underlying sensory processes.
Here, we use ambiguous structure-from-motion (SFM), a powerful cue that allows reconstruction of an object in depth from motion cues alone (Miles, 1931; Wallach and O'Connell, 1953). Such stimuli can be made perceptually bistable: ambiguously rotating spheres, perceived to rotate in opposite directions (Treue et al., 1991; Andersen and Bradley, 1998; Hol et al., 2003). Exploiting its ambiguous nature, single-cell studies found correlations between MT activity and perceived direction (Bradley et al., 1998; Dodd et al., 2001).
In a parallel study, we revealed transient activation correlating with alternations, but no significant sustained activation related to perceptual states was found using conventional univariate statistical methods (G. J. Brouwer, F. Tong, P. Hagoort, and R. van Ee, unpublished observations). Finding sustained activation related to perceptual states using functional magnetic resonance imaging (fMRI) is inherently difficult: although perception-specific modulations in neural activation can be found throughout visual cortex (Logothetis and Schall, 1989; Leopold and Logothetis, 1996, 1999), few fMRI studies have been able to show neural correlates of perceptual phases (Tong et al., 1998; Polonsky et al., 2000). Although individual neurons can show perception-related modulations, a voxel contains many neurons, some responsive during one, some during the other perceptual state. As a result, no net activation changes are observed between states. Investigation of perceptual phases, therefore, requires a departure of conventional univariate approaches. Several groups used multivariate approaches to model and classify brain activation (McIntosh et al., 1996; Haxby et al., 2001; Cox and Savoy, 2003). Recently, multivariate methods have been used to classify perceived orientation and motion direction using activation from visual areas (Kamitani and Tong, 2005, 2006), although theoretically the resolution of fMRI is below that of orientation-columns within these areas. Furthermore, it is possible to predict perceptual states during binocular rivalry using activation from visual cortex (Haynes and Rees, 2005b). The underlying hypothesis of the multivariate approach is that one voxel can still show selectivity, brought about by variations in the underlying topography of neuronal selectivity.
Here, we use a multivariate approach to investigate the role of retinotopic visual cortex and motion-sensitive areas in representing the content of visual awareness during the viewing of ambiguously rotating spheres that rotate about the vertical axis. We focus on perceptual states. This then complements our study using the ambiguous sphere in which we investigated fMRI activity associated with perceptual alternations (Brouwer, Tong, Hagoort, and van Ee, unpublished observations).
In the present study, subjects viewed ambiguously rotating spheres and indicated their perceptual states. Multivariate classifiers were then trained on imaging data taken from several regions of interest (ROIs), and the accuracy of prediction was determined. Results indicate that accurate prediction of perceptual states is possible using activation taken from area MT+, dorsal areas V3A, V7, and V4D, and parietal areas responsive to SFM.
Materials and Methods
Subjects
Five subjects participated, and informed written consent was obtained before every scanning session. Subjects had normal or corrected-to-normal vision. All procedures were approved by the FC Donders Centre for Cognitive NeuroImaging.
Stimuli
Stimulus presentation.
Stimuli were presented using an EIKI projector (model LC-X986, resolution 800 × 600 pixels; EIKI International, Rancho Santa Margarita, CA) onto a transparent screen positioned at the rear end of the MR scanner. Subjects viewed stimuli through a mirror attached to the head coil. Distance to the screen via the mirror was 80 cm.
Ambiguous and unambiguous sphere stimuli.
Spheres (width and height, 8.2°, 500 dots), rotating around the vertical axis, were created using custom software. Individual dots measured 5.8 arcmin in width and height. All stimuli contained a central fixation dot of 11.7 arcmin; angular velocity of the sphere was 16°/s. This low velocity ensured that perceptual phases were relatively long lasting, as we have demonstrated previously (Brouwer and van Ee, 2006). Average dot speed was ∼ 0.75°/s, but note that dot speed depended on dot position. We presented both ambiguous and unambiguous spheres. For the ambiguous spheres, only nondirectional ambient lighting was simulated, making all dots equal in luminance and rotational direction ambiguous. To examine the possibility of generalization, we also presented subjects with unambiguous spheres. For the unambiguous spheres, we added a light source in front of and above the sphere pointing toward its center, increasing the illumination of the dots that ought to appear closer to the observer, disambiguating its rotational direction and stabilizing perception to a single perceived rotation. During these runs, the sphere physically changed direction at randomly chosen times (randomly between 4 and 10 s) to mimic the stochastic nature of the bistable process. The same disambiguated stimulus was also used for the SFM localization runs (see below).
Procedure
Ambiguous and unambiguous sphere experiments.
During the main ambiguous sphere experiments, subjects viewed an ambiguous sphere continuously for 200 s. They were instructed to strictly fixate the central dot and to press one button when the front surface reversed from a rightward to a leftward direction [clockwise (CW)] and another button when the opposite occurred [counterclockwise (CCW)]. Subjects can also perceive the stimulus as two convex surfaces or two concave surfaces (Hol et al., 2003); however, they still perceive one surface to be in front of the other, meaning that they could still do the task. Scanning started 20 s after the start of the experiment to remove any stimulus onset-specific activation. All subjects performed 10 of such runs. For the disambiguated runs, subjects were instructed to fixate and detect the physical changes in rotation but did not report these alternations. Subjects performed four of such runs.
Anatomy.
A high-resolution T1-weighted anatomical scan (three-dimensional magnetization-prepared rapid gradient echo; field of view, 256 × 256; 1 × 1 × 1 mm3 voxel size) was obtained for segmentation and flattening purposes.
Localization of SFM-responsive areas within parietal cortex.
To identify activation specifically related to the area of the stimulus and to localize areas sensitive to SFM, we ran two same-session localization runs. In a conventional block design of 16 s epochs interleaved with 16 s blank fixation screens, we alternated stationary spheres with rotating spheres. The contrast between spheres and fixation screens localizes activation within retinotopic cortex associated with the size and location within the visual field of our stimulus. This enables us to limit mapped visual areas such that they include only voxels truly activated by the stimulus itself. The statistical threshold for including voxels as being activated by the stimulus was set to p < 0.001, corrected. The contrast between stationary and rotating sphere localizes motion-sensitive areas in general and SFM sensitive areas in particular. Previous studies have shown the existence of four SFM-sensitive areas within parietal cortex, two of which are located on the posterior side of the intraparietal sulcus (IPS), ventral IPS and parieto-occipital IPS, and two on the anterior part of IPS, dorsal IPS medial and dorsal IPS anterior. We combined all anterior voxels significantly activated by the contrast (rotating spheres > stationary spheres; p < 0.001 corrected) into a single region of interest [SFM-anterior IPS (aIPS)]; the same principle was applied to the more posterior voxels [SFM-posterior IPS (pIPS)].
Polar retinotopic mapping and localization of MT+, fusiform face area, parahippocampal place area, and frontal eye field.
Polar retinotopic mapping was done using methods described previously in detail (DeYoe et al., 1996; Tootell et al., 1998; Wandell, 2000; Brouwer et al., 2005a). All subjects performed three polar mapping runs, consisting of 10 cycles (full hemifield rotation), lasting a total of 456 s. Subjects performed two runs of MT+ localization. MT+ localization runs (400 s) consisted of six 16 s epochs of stationary dots and six 16 s epochs of moving dots, interleaved with 16 s blank fixation screens. Voxels on the middle temporal gyrus were included as part of MT+ when the significance of the contrast for that voxel (moving dots > stationary dots) exceeded a preset statistical threshold; p < 0.001, corrected). It is important to note that the full-field method we used did not allow us to dissociate between MT and its satellite areas, medial superior temporal visual area and fundus of the superior temporal visual area. We therefore refer to the localized activation as MT+. We identified the fusiform face area (FFA) (responsive to faces), the parahippocampal place area (PPA) (responsive to scenery and landscapes) and the frontal eye fields (FEFs) in all subjects using standard methods. In short, we presented subjects with photographs of houses, scenery and landscapes, human faces, and scrambled versions of these images, as described previously in detail (Kourtzi and Kanwisher, 2000). Contrasting faces with all other areas localizes the FFA on the fusiform gyrus. Contrasting scenery and landscapes with all other images localizes the parahippocampal place area. For the localization of the frontal eye fields, we used a simple saccade/fixation task (Luna et al., 1998): subjects either fixated a stationary target in the center of the screen (12 s epochs) or fixated a target changing to a randomly chosen new position within a 15° visual aperture every 2 s (12 s epochs), requiring subjects to make saccades to fixate the target. Contrasting epochs containing saccades with fixation epochs localizes the frontal eye fields on the lateral part of the precentral sulcus. For all three functionally defined areas, voxels were included in the region of interest when the significance of the contrast for that voxel exceeded a preset statistical threshold: p < 0.001 (Bonferonni corrected).
Magnetic resonance imaging
All images were acquired using a 3 Tesla Siemens (Erlangen, Germany) TRIO with exception of the high-resolution T1 anatomical scan, which was acquired using 1.5 Tesla Siemens Sonata. Scanners were located at the FC Donders Institute for NeuroImaging (Nijmegen, The Netherlands). All functional images were recorded using gradient echo planar imaging using an eight-channel phase-array head coil. The same sequence was used for all experiments [repetition time (TR), 2000 ms; echo time (TE), 35; 64 × 64 matrix; voxel size, 3 × 3 × 3 mm], with exception of the retinotopic mapping experiment (TR, 3000 ms).
Cortical flattening and area border delineation
The cortical sheets of the individual subjects were reconstructed as polygon meshes based on the high-resolution T1 scans. The white-gray matter boundary was segmented, reconstructed, smoothed, inflated, and flattened (Kriegeskorte and Goebel, 2001). Area border delineation using the polar retinotopic mapping was done using methods described previously (Brouwer et al., 2005a; Tootell et al., 1997, 1998; Wandell, 2000). Using the correlation between wedge position and neural activity, borders were identified on the basis of field sign alternations, and areas were drawn in on the flattened sheet manuallya.
Preprocessing of imaging data
We used BrainVoyager (BrainInnovation, Maastricht, The Netherlands) for preprocessing of the functional data as well as for the creation of flattened cortical representations. Before analysis, we removed the first three volumes of every scan. All remaining functional images were subjected to a minimum of preprocessing steps: motion correction, slice timing correction, and transformation of the functional data into Talairach coordinate space (Talairach and Tournoux, 1988).
Classification and prediction
The methods described below are almost identical to those described by Haynes and Rees (2005b), with the exception of the used classifier. Whereas Haynes and Rees (2005b) used Fisher Linear Discriminant analysis, we used the Support Vector Machine algorithm (Burges, 1998; Vapnik, 1998) (see supplemental methods, available at www.jneurosci.org as supplemental material). We extracted all 10 time courses (intensity values over volumes) for a particular group of voxels from a ROI. These time courses were normalized to a mean of zero and a SD of one (z-score). Each volume was then assigned to a particular perceptual state. Because the blood-oxygen-dependent signal (BOLD) signal is delayed relative to events, we convolved the perceptual state time course with the canonical hemodynamic response function of the SPM2 package (http://www.fil.ion.ucl.ac.uk/spm), creating a model time course for each perceptual state (Fig. 1b). These two model time courses were subtracted from each other. Negative values were assigned 1 (associated with CW), and positive values were assigned −1 (CCW). The main effect of this convolution is a temporal shift of the perceptual states, although it also smoothes out short perceptual durations. Justification for the use of the particular hemodynamic response function is given in the supplemental methods and in supplemental Figure 2 (available at www.jneurosci.org as supplemental material). We did not correct for the time between experiencing an alternation and pressing the button to indicate it. Using a leave-one-out approach, we trained our classifier on 9 of 10 data sets and used the 10th data set for testing. For the SVM, training results in the creation of support vectors within the multidimensional feature space (with features = voxels) that maximize the separation between intensity values belonging to each perceptual state. For the perceptron model, this results in the creation of a particular set of weights for each voxel within the ROI such that if voxel intensities are multiplied with these weights, summed, and thresholded, it outputs a perceptual state associated with these voxel intensities during a volume. Finally, for the differential mean, we obtain two weight vectors (one for each perceptual state) that can be multiplied with voxel intensities and summed (dot-product between the voxel and weight vector). The predicted perceptual state is then equal to the perceptual state belonging to the weight vector with the highest associated dot-product between voxel intensities and the weight vector. After training, we used the resulting classifiers to predict perceptual state on the basis of voxel intensities during a particular volume of the test data. Because both the SVM and differential mean produce a continuous prediction value, we determined the sign of the prediction. By definition, the perceptron model output is already binary, because it was thresholded internally. Accuracy was determined comparing the predicted sign with the actual sign of the perceptual state for each volume (87 volumes in total). Leaving each run out in turn results in a mean accuracy and a SD, allowing statistical testing of significance of the accuracy. For an overview of the procedure, see Figure 1.
Figure 1.

Multivariate analysis method. A, A priori, we identified ROIs by independent mapping procedures. B, The reported perceptual states, as indicated by the subject using button presses, were convolved with a canonical hemodynamic response function (HRF). This created two separate models for expected neural activation: one for activation as a function of perceiving CW rotation and one for activation as a function of perceiving CCW rotation. The resulting two time courses were subtracted and thresholded. As a result, whenever the predicted signal for CW perceived rotation is higher than the expected signal for CCW perceived rotation, that point in time was assigned to CW perceived rotation and vice versa. The main effect of this convolution approach is a temporal shift to account for the hemodynamic delay associated with the BOLD signal. C, We extracted voxel time courses from a particular ROI. These time courses were normalized (z-score normalization) and each volume of the voxel time course associated with a particular perceptual state, which were obtained from the time courses in B. D, Nine of 10 runs were then used to train our classifiers (SVM, perceptron, and differential mean) (see supplemental methods, available at www.jneurosci.org as supplemental material). For the SVM, this results in the creation of support vectors within the multidimensional feature space (features = voxels). For the perceptron model, this results in a weight vector such that if voxel intensities are multiplied with this vector, summed and thresholded, the model outputs a predicted perceptual state associated with these voxel intensities for a volume. Finally, for the differential mean approach, we obtained two weight vectors (one for each perceptual state) that were multiplied with voxel intensities and summed (dot-product between the voxel and weight vector). The predicted perceptual state is then equal to the perceptual state belonging to the weight vector with the highest associated dot-product between voxel intensities and the weight vector. E, The resulting classifiers were then used to predict the perceptual states for each volume in the remaining run. Both the SVM and differential mean produced a graded, continuous output and these were thresholded by determining, per volume, the sign of the output. The predictions were then compared with the actual perceived states over time and the accuracy of prediction calculated through dividing the number of correct predictions by the total number of predictions.
Eye movement recording and analysis
Eye movements were recorded during scanning using a custom-made camera and mirror system. The camera, positioned at the feet of the subjects, pointed toward the head coil where a mirror reflected the image of one eye toward the camera. An infrared LED was used to illuminate the eye so that it was visible for the camera. The iView software package was used to record eye movements at a frequency of 50 HZ. For our off-line eye tracking experiments, we used a commercial head-mounted infrared eye tracker (Eyelink2; SMI, Berlin, Germany), sampling eye position at 250 Hz. Native gaze positions were rotated, sheared, and scaled to align the fixation positions maximally with the location of the calibration points (specified in visual angle). After this, we median filtered the data (van Dam and van Ee, 2005) and applied drift correction, removing all components with a frequency below 0.1 Hz. Velocities were calculated using a sliding window of five samples [for details, see van Dam and van Ee (2005)]. Blinks were detected as samples in which no gaze positions were recorded (no pupil) and included all preceding and subsequent samples with a velocity >12°/s. (Micro)saccades were identified as excursions (lasting more than two samples) to velocities >12°/s. The direction of the saccades was determined by calculating the angle between the start and end points.
For the off-line experiments, eye movements of all five subjects were recorded during strict fixation in a design identical to the main imaging experiment. In addition, two subjects also participated in a second experiment during which beneficial eye movements were encouraged. During scanning, we measured eye movements during strict fixation for two subjects, while three subjects participated in a second imaging experiment during which eye movements were allowed and encouraged. We calculated gaze position densities for each perceptual state to determine whether average gaze position differed between perceptual states. In addition, we determined whether alternations were preceded or followed by specific eye movements. Finally, we used eye movement data to train an SVM to classify, using these eye movements, the perceptual state of the subject (CW/CCW). These measures included horizontal and vertical position per sample, horizontal and vertical displacement (velocity) between samples, and the presence of a blink during a sample. Similar to the imaging experiments, we used 90% of the data to train (9/10 runs) and the remaining run to test the accuracy of the SVM. Because the gaze position data were sampled at a frequency of 50 Hz, a very large number of examples were available for training and testing compared with the imaging data (acquired at a frequency of 0.5 Hz; TR, 2000 ms). Therefore, we resampled the eye movement data to contain an equal number of samples as the imaging data and retrained the SVM for a fair comparison between methods.
Results
Psychophysics
We deliberately had the stimulus rotate (Fig. 2a) at a low angular velocity to ensure that perceptual phases were relatively long lasting (Brouwer and van Ee, 2006). Mean percept duration was 9.4 s. Figure 2b shows the distribution of perceptual phase durations. The distribution of the perceptual durations (bars) can be approximated by a gamma-distribution (solid line), as has been found for numerous other bistable stimuli. The fitted shape and scale parameter for this distribution were 2.5 and 3.8, respectively, and the fit quality was high: no significant difference was found between fit and data (p = 0.35; as quantified by a Kolmogorov–Smirnov test) (Brascamp et al., 2005; Brouwer and van Ee, 2005). This indicates that our particular stimulus is a representative example of a bistable stimulus; even when its rotation has been slowed down to evoke relatively long-lasting perceptual phases.
Figure 2.

Stimulus and psychophysics. A, Arrows indicate the two perceived rotation direction of the front surface of the sphere: CW or CCW. B, The distribution of the perceptual phase durations (bars) during viewing of the ambiguously rotating sphere can be approximated by a gamma-distribution (solid line), as has been found for numerous other bistable stimuli. This indicates that our particular stimulus is a representative example of a bistable stimulus, even when its rotation has been slowed down to evoke relatively long-lasting perceptual phases (mean, 9.4 s; dotted line).
Predicting perceived rotation during ambiguous SFM
We first determined whether the activation of visual areas could be used to predict the time course of perception. Using a leave-one-out strategy, we trained a classifier (support vector machine with a linear kernel) to predict perceptual states. The data from the remaining run were then used to predict, per volume, the perceptual state. Finally, the accuracy of this prediction was determined. We used the voxels of separate visual areas, including only those voxels that were significantly activated (p < 0.001, corrected) by the stimulus. When the raw and thresholded (using a sign function) prediction of the classifier trained on the voxel data of V7 is compared with the actual perceptual time courses (Fig. 3a), it is apparent that the prediction of the classifier (linear SVM) can be highly accurate over the course of a 180 s experiment. Activation of MT+, higher dorsal visual areas V3A, V4D, and V7, as well as the localized regions responsive to SFM (SFM-aIPS, SFM-pIPS) could be used to predict perceived rotation accurately: for these areas, the average accuracy was significantly greater than chance (p < 0.001) for all individual subjects (Fig. 3b). Prediction on the basis of the remaining visual areas was less accurate, although significantly greater than chance in some areas in some subjects.
Figure 3.

SVM accuracy. A, Raw SVM (black lines), thresholded predictions (blue lines), and actual perceived states (red lines) based on the activation of V7 in three subjects, demonstrating the striking accuracy of the prediction. Error bars represent SD of the mean. B, Average accuracy of SVMs per subject per ROI. Prediction was accurate for retinotopic areas V3A, V7, and V4D, as well as area MT+ and the parietal areas sensitive to structure-from-motion. For the other visual areas, accuracy is lower but in most cases still significantly greater than chance. For the FEFs, FFA, and PPA, prediction was at chance level. The asterisks indicate the areas for which in all individual subjects, accuracy was significantly greater than chance (p < 0.001).
In an additional analysis, we also determined whether the activation of other, commonly localized visual areas could be used to predict perceptual states. We localized the FFA, PPA, and FEFs in all subjects. Prediction accuracy on the basis of these areas was not significantly greater than chance (Fig. 3b). This demonstrates that prediction accuracy is limited to a subset of visually responsive areas and is not an aspecific meta-effect.
One issue with accurate prediction of the time course of perception on the basis of BOLD data is the relatively low temporal resolution of fMRI, compared with the average duration of perceptual phases. If perceptual phases are short lasting, at least compared with the BOLD signal, the BOLD signal can no longer accurately reflect the temporal dynamics of the perceptual phases. We specifically slowed down the rotation of the ambiguously rotating sphere to increase the length of these perceptual durations. Although this was successful in all subjects, the accuracy of the prediction still depends on the length of perceptual phases: as perceptual durations increase in length, so does the accuracy of prediction. This is shown in Figure 4a for areas V1 and V7. It also explains the relatively low accuracy found for subject JX: the perceptual durations for this subject are relatively short, compared with the other four subjects.
Figure 4.

Intersubject differences in accuracy. A, Dependency of the accuracy (based on the voxels of V1 and V7) on the mean perceptual durations per subject (color coding) for all 10 runs. As perceptual durations decreased in length, so did the accuracy. This explains the relatively poor performance for JX, as well as the high performance for AK. B, Comparison of sustained and transient models. For the data of V7, the sustained model (assuming signal changes correlate with the perceptual durations) outperforms the transient model (assuming signal change correlate with the transitions between perceptual states) in terms of the accuracy of the classifier that has been trained. For the data of V1, sustained and transient models do not differ in the accuracy. Error bars represent SD of the mean.
In an additional analysis, we verified whether the accurate prediction relied on sustained activation related to perceptual phases or was related more to transient activation related to transitions between perceptual states. For our original sustained model, used for all experiments, we modeled the duration of perceptual states by convolving these states with a canonical hemodynamic response function. This is important because the BOLD signal that is measures is delayed, relative to the timing of perceptual states. We compared this sustained model with a transient model, which was created by convolving not the duration of perceptual states but alternations between these states, resulting in a model that captures activation associated with both types of alternations. Given the temporal sluggishness of the BOLD signal, transient and sustained models inevitably show some correlation. Testing both models on the data acquired from visual areas V1 and V7, it becomes apparent that signals from area V7 indeed reflect sustained activation, because the accuracies for the sustained model are significantly higher in four of five subjects (Fig. 4b). For subject JX, the sustained model does produce higher accuracies, although not significantly higher. As pointed out above, the perceptual states of this subject were relatively short, thereby making the transient and sustained model for this subject more similar. In contrast, performance between both models does not differ for the signal changes from V1.
Between-design, between-stimuli, between-session generalization
Although we have demonstrated that within-stimulus, same-session prediction is indeed possible and in some instances very accurate, it is important to establish whether the classifiers can generalize over sessions and/or different stimuli. To test this, we first used an identical design containing disambiguated spheres (see Materials and Methods). At random times, these spheres changed rotational direction, mimicking as closely as possible the perceptual alternations subjects would experience when viewing ambiguous spheres. Subjects were instructed not to report such changes in direction. In addition to being disambiguated, the spheres also rotated at a higher velocity as did the ambiguous spheres but were identical in size. We hypothesize that even in light of these changes (no behavioral response and different velocities), generalization should still be possible if the classifiers are sensitive to the neural activation related to perceived rotation, rather than the specific behavioral response or stimulus velocity.
The disambiguated data were used to train a classifier. Applying the classifier to the data of each ambiguous run, we again obtained an average accuracy. Results show that generalized prediction is poorer but follows the same trend as obtained previously (Fig. 5). Again, MT+ and visual areas V3A, V4D, and V7, as well as the parietal SFM-responsive areas, show an accuracy that is significantly greater than chance (p < 0.001) than the remaining visual areas. Perhaps more important, activation of these areas can be used for generalized prediction (from disambiguated spheres to ambiguous spheres) with an accuracy significantly higher than chance.
Figure 5.

Generalization. Accuracy of the prediction when the SVM was trained on the data from the disambiguated sphere experiment (black discs) and on the data from an entirely different experiment (gray discs) of Brouwer et al. (2007). Accuracy is reduced, but significantly greater than chance for areas V3A, V7, and MT+ and the two parietal areas SFM-aIPS and SFM-pIPS. This indicates that generalization, a key feature in prediction, is possible between sessions and stimuli. Error bars represent SD of the mean.
As a second generalization, assessing the influence of our particular design (short runs, slow rotating spheres) on prediction, we used the data obtained in a previous experiment (Brouwer, Tong, Hagoort, and van Ee, unpublished observations) consisting of much longer runs and a sphere rotating at a much higher velocity to predict perceptual states. More specifically, we trained classifiers on the data acquired in the present study and predicted perceptual states using the data acquired in the previous experiment performed on the same subjects. This produced a similar pattern to those obtained for the disambiguated spheres: accuracy of the prediction was poor but still significantly better than chance for V3A, V7, MT+, and the parietal areas (Fig. 5). Somewhat interesting, accuracy for area V4D was less robust and not significantly greater than chance.
Eyey movements
A possible underlying source for the predictive accuracy of our classifiers could be strategic eye movements. High accuracy in our experiment was found within retinotopic visual cortex, areas that are quite sensitive to eye movements. Two possible eye movement strategies could, in principle, affect activation within visual cortex in such a way that activation changes become consistent with perceptual states and could therefore be used by our classifiers to predict perceptual states. First, subjects could exhibit a difference in mean gaze position for the two perceptual states (e.g., during CW perceived rotation, fixation could be displaced slightly leftward, compared with CCW perceived rotation). This will shift the stimulus on the retina and activate different parts of retinotopically organized areas as a function of perceptual states. A second and more subtle effect could be that subjects unintentionally experience optokinetic nystagmus: the eyes are captured by passing dots, causing smooth pursuit of the dot for a small duration after which the eyes saccade back to the fixation dot. This, too, could result in subtle differences between perceptual states in terms of neural activation within visual cortex.
To determine whether such potential effects are influencing the prediction accuracy of our classifiers in the current experiments, we measured eye movements during scanning and, because eye tracking during scanning was limited to 50 Hz sample rate, we also performed an off-line eye tracking experiment, using a head-mounted eye tracker, sampling at 250 Hz (Eyelink2, SMI). The off-line experiment, which examined the same five subjects that participated in the imaging experiment and an identical stimulus, demonstrated that fixation was highly accurate, with 95% of all gaze positions centered ∼1° of visual angle around the fixation dot, shown for three subjects in Figure 6a. Additionally, the frequency of (micro)saccades and blinks is relatively low, limiting their influence on ongoing neural activity. Analyzing the direction of saccades revealed that some subjects have a tendency to make more saccades in the horizontal direction, as opposed to more vertical saccades, but that this did not depend on perceptual state. Most importantly, we determined whether significant shifts between gaze positions could be observed between perceptual states. Only one subject (subject GB) showed a minimal but significant shift in mean horizontal gaze position between perceptual states (t31 = 2.3653; p < 0.02126). Furthermore, no consistent pattern is observed between the remaining subjects: for some subjects, mean gaze position related to CW perceptual states are displaced to the left of the mean gaze position related to CCW perceptual states; for some subjects, this is reversed.
Figure 6.
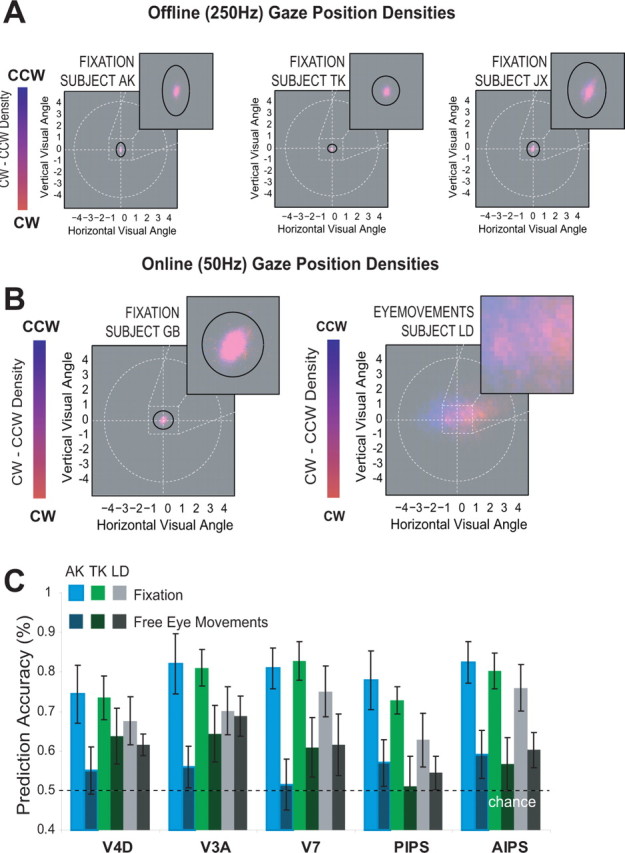
Eye movements. A, Gaze position density plots for three subjects during the off-line eye tracking experiments with strict fixation instructions. In these density plots, the color gradient coding indicates how frequent a particular location was visited during the two perceptual states; the white circle reflects the stimulus circumference. The inset shows the region around fixation. Dark ellipses indicate the region containing 95% off all gaze positions. In all subjects, gaze positions fall within an area ∼1° of visual angle around the fixation spot. Furthermore, differences in mean gaze positions between perceptual states were minute. B, Gaze position densities for two subjects during the imaging experiments with strict fixation (subject GB, left) and with beneficial eye movements allowed and encouraged (subject LD, right). Subject LD used strategic eye movements, as her gaze positions depended on the perceptual state. C, A comparison of prediction accuracy based on the activation taken from visual areas that showed the highest accuracy in the main experiment, during strict fixation (light bars) and during eye movement conditions (dark bars) for the three subjects who participated in both imaging studies. Prediction accuracy is reduced when eye movements are allowed, demonstrating that even beneficial and strategic eye movements are not responsible for the observed accuracy in the main (fixation) imaging experiment.
During scanning, we recorded eye movements in all five subjects. For two subjects, these were recorded during the original experiment, performed under strict fixation. The remaining three subjects participated in a second experiment, identical to the first except that now deliberate and beneficial eye movements were encouraged. Figure 6b compared the gaze position densities during fixation (subject GB) and during eye movement conditions (subject LD). Clearly, subject LD used strategic eye movements, as her gaze positions depended heavily on the perceptual state. For subject GB, no such effects are observed.
Comparing the prediction accuracies between fixation and eye movement conditions reveals that allowing eye movements actually reduces prediction accuracy on the basis of cortical activation (Fig. 6c). These combined results indicate that predictive accuracy of the SVM based on BOLD signal changes is not confounded by eye movements, although it remains possible that small, undetectable changes in gaze position underlie our predictive accuracy.
Discussion
In a first study using fMRI and ambiguous structure-from-motion, we showed that accurate prediction of the content of visual awareness during ambiguous SFM is possible on the basis of the activation taken from area MT+ and dorsal retinotopic visual areas V3A, V4D, and V7, as well as two parietal areas responsive to SFM. The activation of the remaining visual areas was not as reliable in predicting perceptual states, but in most subjects it was still significantly above chance level. This demonstrates that activation of visual areas reflects the content of awareness during perceptual bistability.
An important study, on which our methodology is based, was recently conducted for binocular rivalry. This study reported that the activation of lower-tier retinotopic areas (e.g., V1 and V2) can be used to predict perceptual states (Haynes and Rees, 2005b). Here, we found that for ambiguous SFM, prediction on the basis of these lower-tier areas was only modest, although significant in three of five subjects. This difference likely reflects the difference between perceptual and binocular rivalry. An important distinction between binocular rivalry and perceptual rivalry is the difference in the phenomenological quality of both the perceptual states and the alternations between them. Binocular rivalry is best characterized by changes in visibility of each half-image. When a half-image is suppressed, it can no longer be seen. In contrast, perceptual rivalry (including ambiguous SFM) is less about visibility but more on interpretation of cues and the conflict that exists between these cues (clockwise or counterclockwise rotation). We argue that the differences in the accuracy of visual areas between both classes of rivalry is related to the phenomenological difference between them. Because of technical limitations, Haynes and Rees (2005b) could not assess the accuracy of visual areas beyond V3, making it somewhat difficult to directly compare neural correlates of binocular and perceptual rivalry in higher-tier areas. However, in their study and in the present study, area MT+ was localized. The difference in accuracy between binocular rivalry (Haynes and Rees, 2005b) and perceptual rivalry (our study; ambiguous SFM) is as striking as it is interesting. Activation of MT+ could not be used for accurate prediction of perceptual states during binocular rivalry. In contrast, perceptual rivalry prediction on the basis of MT+ activation reached high accuracies. This discrepancy likely reflects an additional difference in the processing between the two stimuli. For ambiguous SFM, it is the motion that is ambiguous or conflicting, whereas for binocular rivalry, it is the dissimilarity in input between the orientation of gratings in the two eyes. The specific binocular stimulus used by Haynes and Rees (2005b) contained identical pattern rotation direction for the half-images of the two eyes. We speculate that if the pattern rotations were in opposite directions, the activation of MT+ would have been predictive of perceptual states.
In addition to MT+, activation of dorsal retinotopic visual areas V3A, V4D, and V7 provided high accuracy for prediction of perceptual states. This provides converging evidence for the role of these areas in both motion processing and motion perception, as a number of studies have already implicated at least V3A as an additional motion-sensitive area (Tootell et al., 1997; Kamitani and Tong, 2006). V4D has also been termed the kinetic occipital region and is responsive to motion and motion boundaries (van Oostende et al., 1997), making it suitable for the processing of structure-from-motion and representing the perceived direction of rotation. A similar argument can be made for two SFM-sensitive parietal regions (aIPS and pIPS), because there is extensive evidence that, at least in humans, parietal cortex may contain as many as four motion-sensitive areas, each responsive to structure-from-motion to a varying degree (Orban et al., 2003, 2006). That the activation of these areas can be used to predict the content of visual awareness with high accuracy suggests that neural correlates of perception can be distributed among several areas representing a particular (sub)modality, such as motion.
Eye movement recordings for both fixation and free eye movement conditions demonstrated that for all subjects, fixation was highly accurate when fixation was required. Furthermore, only very small shifts in gaze position between perceptual states were found in two of five subjects. When subjects were encouraged to make beneficial and strategic eye movements, this pattern changed: now, gaze positions depended on perceptual states and gaze densities spread out around the fixation dot, covering much of the stimulus. At the same time, prediction accuracy on the basis of cortical activation was reduced. These results imply that the eye movements during ambiguous sphere experiments (under strict fixation) are not confounding the prediction accuracy of our classifiers on the basis of cortical activation. Note that for two related studies, using a very similar ambiguously rotating sphere, we analyzed eye movements and their correlation with perceptual alternations in great detail (Brouwer and van Ee, 2006; Brouwer et al., 2007) and also found that, although small but significant correlations do inevitably exist, eye movements were not the source of the activation underlying perceptual alternations experienced during SFM.
An important question that arises from both of the previous studies (Haynes and Rees, 2005a,b; Kamitani and Tong, 2005, 2006) and the present study is what neural mechanisms allow for accurate classification in the first place? Most likely, there exist small but detectable biases in the distribution of direction-selective neurons in the voxels of visual areas that allow for accurate classification. As a result, these voxels show signal changes (increases or decreases) when the perceived rotation alternates. However, at any location on the sphere, regardless of perceptual state, leftward and rightward motion is always present. Because of this, no change in activation should ever be observed when neurons within a visual area are sensitive only to two-dimensional translational motion. The fact that dorsal visual areas can be used to predict perceptual states during ambiguous SFM could imply that already in these areas more complex motion-selectivity exists (motion-in-depth). In single voxels, these signal changes are weak and not significant. However, when pooled together, it is possible to classify perceptual states based on the difference in preferred direction of each voxel (Kamitani and Tong, 2006). Alternatively, it is possible that the motion of the dots currently belonging to the surface that is perceived to be front elicit a higher response, compared with dots belonging to the back-surface. This, in turn, could be attributable to observers' attention to these front-surface dots, or a competition between dots belonging to the front and back surface for saliency. Finally, it could be that differences in the focus of spatial attention between perceptual states can evoke subtle but measurable changes in activation.
In principle, at least two separate neural correlates of bistable perception can be present: sustained activation related to either perceptual states or transient activation related to the transitions between these states. Comparing these two models revealed that modeling the activation of visual areas as being sustained produces significantly higher accuracies as when models are transient in nature, as found previously (Haynes and Rees, 2005b).
It is important that our multivariate classifiers can generalize over certain aspects of the stimulus that we deem to be unrelated to the phenomenon being predicted (perceptual states), because successful generalization can indicate that our underlying assumptions about these multivariate techniques are correct. We demonstrated that generalization from unambiguous to ambiguous stimuli, as well as generalization between sessions, stimuli and designs was possible. We hypothesized that, in principle, such differences between stimuli and/or design should not reduce accuracy below chance level if successful classification is depended on perceived rotational direction, regardless of the characteristics of the stimulus giving rise to such perceived states. However, accuracy was reduced, suggesting that the pattern used for classification can be very specific for a particular stimulus.
In conclusion, our results indicate that accurate prediction of perceptual states during ambiguous SFM is possible on the basis of the activation taken from area MT+ and dorsal retinotopic visual areas V3A, V4D, and V7, as well as two parietal areas responsive to SFM. This indicates that during perceptual rivalry (SFM), like binocular rivalry (Haynes and Rees, 2005b), retinotopic visual cortex actively represents the content of visual awareness over time. We argue that in contrast to binocular rivalry, accurate prediction of ambiguous SFM (a form of perceptual rivalry) is more successful for the data of higher-tier, dorsal visual areas. These differences could give rise to the phenomenological difference between perceptual and binocular rivalry.
Footnotes
This work was supported by a grant from the Netherlands Organization for Scientific Research (R.v.E.). We thank the referees for their comments.
We present our criteria for area delineation because they are subject to some uncertainty, especially in higher retinotopic visual areas. Some groups define V7 as an area adjacent and anterior to V3A that contains a crude representation of at least the upper visual field, mirror-symmetric to that in V3A (Press et al., 2001; Tsao et al., 2003). Tootell and Hadjikhani (2001) further define V4d-topo as the human topographic homolog (topolog) as an area situated: (1) superior to V4v, (2) anterior to V3a, and (3) posterior to MT+. This area has been previously called LOC/LOPS. We used this nomenclature previously (Brouwer et al., 2005a). However, some uncertainty still exists on the organization of the dorsal retinotopic areas. Although a number of groups accept the existence of at least two additional retinotopic areas beyond V3A, the controversy centers on the naming, function of these areas, and their relationship to known macaque visual areas. Approximately the same location in visual cortex to what we call V4d-topo has been termed the kinetic occipital region because of its sensitivity to motion-defined borders (van Oostende et al., 1997). Also, it has been termed V3b to signify its relationship with neighboring area V3A (Press et al., 2001). For consistency with our previous work, we maintain the label V4d-topo. However, because our areas were mapped using simple flickering wedges, we refrain from making any definitive statements about the functional properties of this area.
References
- Andersen RA, Bradley DC. Perception of three-dimensional structure from motion. Trends Cogn Neurosci. 1998;2:222–228. doi: 10.1016/s1364-6613(98)01181-4. [DOI] [PubMed] [Google Scholar]
- Blake R, Logothetis NK. Visual competition. Nat Rev Neurosci. 2002;3:13–21. doi: 10.1038/nrn701. [DOI] [PubMed] [Google Scholar]
- Bradley DC, Qian N, Andersen RA. Encoding of three-dimensional structure-from-motion by primate area MT neurons. Nature. 1998;392:609–611. doi: 10.1038/33688. [DOI] [PubMed] [Google Scholar]
- Brascamp JW, van Ee R, Pestman WR, van den Berg AV. Distributions of alternation rates in various forms of bistable perception. J Vision. 2005;5:287–298. doi: 10.1167/5.4.1. [DOI] [PubMed] [Google Scholar]
- Brouwer GJ, van Ee R. Endogenous influences on perceptual bistability depend on exogenous stimulus characteristics. Vis Res. 2006;46:3393–3402. doi: 10.1016/j.visres.2006.03.016. [DOI] [PubMed] [Google Scholar]
- Brouwer GJ, van Ee R, Schwarzbach J. Activation in visual cortex correlates with the awareness of stereoscopic depth. J Neurosci. 2005a;25:10403–10413. doi: 10.1523/JNEUROSCI.2408-05.2005. [DOI] [PMC free article] [PubMed] [Google Scholar]
- Brouwer GJ, Tong F, Schwarzbach J, van Ee R. Voluntary control over perceptual changes during bistable structure-from-motion revealed by fMRI. Soc Neurosci Abstr. 2005b;31:390.17. [Google Scholar]
- Brouwer GJ, Tong F, Hagoort P, van Ee R. Neural mechanisms underlying perception of ambiguous structure-from-motion and its voluntary control. 2007 in press. [Google Scholar]
- Burges CJC. A tutorial on support vector machine for pattern recognition, data mining and knowledge discovery. Data Min Knowl Discov. 1998;2:121–167. [Google Scholar]
- Leopold DA, Logothetis NK. Activity changes in early visual cortex reflects monkey's precepts during binocular rivalry. Nature. 1996;379:549–553. doi: 10.1038/379549a0. [DOI] [PubMed] [Google Scholar]
- Cox DD, Savoy RL. Functional magnetic resonance imaging (fMRI) “brain reading”: detecting and classifying distributed patterns of fMRI activity in human visual cortex. NeuroImage. 2003;19:261–270. doi: 10.1016/s1053-8119(03)00049-1. [DOI] [PubMed] [Google Scholar]
- DeYoe EA, Carman GJ, Bandettini P, Glickman S, Wieser J, Cox R, Miller D, Neitz J. Mapping striate and extrastriate visual areas in human cerebral cortex. Proc Natl Acad Sci USA. 1996;933:2382–2386. doi: 10.1073/pnas.93.6.2382. [DOI] [PMC free article] [PubMed] [Google Scholar]
- Dodd JV, Krug K, Cumming BG, Parker AJ. Perceptually bistable three-dimensional figure evoke high choice probabilities in cortical areas MT. J Neurosci. 2001;21:4809–4821. doi: 10.1523/JNEUROSCI.21-13-04809.2001. [DOI] [PMC free article] [PubMed] [Google Scholar]
- Haxby JV, Gobbini MI, Furey ML, Ishai A, Schouten JL, Pietrini P. Distributed and overlapping representations of faces and objects in ventral temporal cortex. Science. 2001;293:2425–2430. doi: 10.1126/science.1063736. [DOI] [PubMed] [Google Scholar]
- Haynes JD, Rees G. Predicting the orientation of invisible stimuli from activity in primary visual cortex. Nat Neurosci. 2005a;6:686–696. doi: 10.1038/nn1445. [DOI] [PubMed] [Google Scholar]
- Haynes JD, Rees G. Predicting the stream of consciousness from activity in human visual cortex. Curr Biol. 2005b;15:1301–1307. doi: 10.1016/j.cub.2005.06.026. [DOI] [PubMed] [Google Scholar]
- Hol K, Koene A, van Ee R. Attention-biased multi-stable surface perception in three-dimensional structure-from-motion. J Vis. 2003;3:486–498. doi: 10.1167/3.7.3. [DOI] [PubMed] [Google Scholar]
- Kamitani Y, Tong F. Decoding the subjective contents of the human brain. Nat Neurosci. 2005;8:679–685. doi: 10.1038/nn1444. [DOI] [PMC free article] [PubMed] [Google Scholar]
- Kamitani Y, Tong F. Decoding seen and attended motion directions from activity in the human visual cortex. Curr Biol. 2006;16:1096–1102. doi: 10.1016/j.cub.2006.04.003. [DOI] [PMC free article] [PubMed] [Google Scholar]
- Kriegeskorte N, Goebel R. An efficient algorithm for topologically correct segmentation of the cortical sheet in anatomical MR volumes. NeuroImage. 2001;14:329–346. doi: 10.1006/nimg.2001.0831. [DOI] [PubMed] [Google Scholar]
- Leopold DA, Logothetis NK. Multistable phenomena: changing views in perception. Trends Cogn Sci. 1999;3:254–264. doi: 10.1016/s1364-6613(99)01332-7. [DOI] [PubMed] [Google Scholar]
- Logothetis NK, Schall JD. Neuronal correlates of subjective visual perception. Science. 1989;245:761–763. doi: 10.1126/science.2772635. [DOI] [PubMed] [Google Scholar]
- Luna B, Thulborn KR, Strojwas MH, McCurtain BJ, Berman RA, Genovese CR, Sweeney JA. Dorsal cortical regions subserving visually guided saccades in humans: an fMRI study. Cereb Cortex. 1998;8:40–47. doi: 10.1093/cercor/8.1.40. [DOI] [PubMed] [Google Scholar]
- Kourtzi Z, Kanwisher N. Cortical regions involved in perceiving object shape. J Neurosci. 2000;20:3310–3318. doi: 10.1523/JNEUROSCI.20-09-03310.2000. [DOI] [PMC free article] [PubMed] [Google Scholar]
- McIntosh AR, Bookstein FL, Haxby JV, Grady CL. Spatial pattern analysis of functional brain images using partial least squares. NeuroImage. 1996;3:143–157. doi: 10.1006/nimg.1996.0016. [DOI] [PubMed] [Google Scholar]
- Miles WR. Movement interpretations of the silhouette of a revolving fan. Am J Psych. 1931;42:392–405. [Google Scholar]
- Orban GA, Fize D, Peuskens H, Denys K, Nelissen K, Sunaert S, Todd J, Vanduffel W. Similarities and differences in motion processing between the human and macaque brain: evidence from fMRI. Neuropsychologia. 2003;41:1757–1768. doi: 10.1016/s0028-3932(03)00177-5. [DOI] [PubMed] [Google Scholar]
- Orban GA, Claeys K, Nelissen K, Smans R, Sunaert S, Todd JT, Wardak C, Durand JB, Vanduffel W. Mapping the parietal cortex of human and non-human primates. Neuropsychologia. 2006;44:2647–2667. doi: 10.1016/j.neuropsychologia.2005.11.001. [DOI] [PubMed] [Google Scholar]
- Polonsky A, Blake R, Braun J, Heeger DJ. Neuronal activity in human primary visual cortex correlates with perception during binocular rivalry. Nat Neurosci. 2000;3:1153–1159. doi: 10.1038/80676. [DOI] [PubMed] [Google Scholar]
- Press WA, Brewer AA, Dougherty RF, Wade AR, Wandell BA. Visual areas and spatial summation in human visual cortex. Vis Res. 2001;41:1321–1332. doi: 10.1016/s0042-6989(01)00074-8. [DOI] [PubMed] [Google Scholar]
- Talairach J, Tournaux P. Co-planar stereotaxic atlas of the human brain. New York: Thieme; 1988. [Google Scholar]
- Tong F, Nakayama K, Vaughan JT, Kanwisher N. Binocular rivalry and visual awareness in human extrastriate cortex. Neuron. 1998;21:753–759. doi: 10.1016/s0896-6273(00)80592-9. [DOI] [PubMed] [Google Scholar]
- Tootell RB, Hadjikhani N. Where is “dorsal V4” in human visual cortex? Retinotopic, topographic and functional evidence. Cereb Cortex. 2001;11:298–311. doi: 10.1093/cercor/11.4.298. [DOI] [PubMed] [Google Scholar]
- Tootell RB, Mendola JD, Hadjikhani NK, Ledden PJ, Liu AK, Reppas JB, Sereno MI, Dale AM. Functional analysis of V3A and related areas in human visual cortex. J Neurosci. 1997;17:7060–7078. doi: 10.1523/JNEUROSCI.17-18-07060.1997. [DOI] [PMC free article] [PubMed] [Google Scholar]
- Tootell RB, Hadjikhani NK, Vanduffel W, Liu AK, Mendola JD, Sereno MI, Dale AM. Functional analysis of primary visual cortex (V1) in humans. Proc Natl Acad Sci USA. 1998;95:811–817. doi: 10.1073/pnas.95.3.811. [DOI] [PMC free article] [PubMed] [Google Scholar]
- Treue S, Husain M, Andersen R. Human perception of structure from motion. Vis Res. 1991;31:59–75. doi: 10.1016/0042-6989(91)90074-f. [DOI] [PubMed] [Google Scholar]
- Tsao DY, Vanduffel W, Sasaki Y, Fize D, Knutsen TA, Mandeville JB, Wald LL, Dale AM, Rosen BR, Van Essen DC, Livingstone MS, Orban GA, Tootell RB. Stereopsis activates V3a and caudal intraparietal areas in macaques and humans. Neuron. 2003;39:555–560. doi: 10.1016/s0896-6273(03)00459-8. [DOI] [PubMed] [Google Scholar]
- van Dam LCJ, van Ee R. The role of (micro)saccades and blinks in perceptual bi-stability from slant rivalry. Vision Res. 2005;45:2417–2435. doi: 10.1016/j.visres.2005.03.013. [DOI] [PubMed] [Google Scholar]
- van Oostende S, Sunaert S, Van Hecke P, Marchal G, Orban GA. The kinetic occipital (KO) region in man: an fMRI study. Cereb Cortex. 1997;7:690–701. doi: 10.1093/cercor/7.7.690. [DOI] [PubMed] [Google Scholar]
- Vapnik VN. Statistical learning theory. New York: Wiley; 1998. [Google Scholar]
- Wallach H, O'Connell DN. The kinetic depth effect. J Exp Psych. 1953;45:205–217. doi: 10.1037/h0056880. [DOI] [PubMed] [Google Scholar]
- Wandell BA. Computational neuroimaging of human visual cortex. Annu Rev Neurosci. 2000;22:145–173. doi: 10.1146/annurev.neuro.22.1.145. [DOI] [PubMed] [Google Scholar]