

Abstract
Long-term potentiation (LTP) mediates learning and memory in the mammalian hippocampus. Whether a presynaptic or postsynaptic neuron principally enhances synaptic transmission during LTP remains controversial. Acute hippocampal slices were made from transgenic mouse strains that express synaptopHluorin in neurons. SynaptopHluorin is an indicator of synaptic vesicle recycling; thus, we monitored functional changes in presynaptic boutons of CA3 pyramidal cells by measuring changes in synaptopHluorin fluorescence. Simultaneously, we recorded field excitatory postsynaptic potentials to monitor changes in the strength of excitatory synapses between CA3 and CA1 pyramidal neurons. We found that LTP consists of two components, a slow presynaptic component and a fast postsynaptic component. The presynaptic mechanisms contribute mostly to the late phase of compound LTP, whereas the postsynaptic mechanisms are crucial during the early phase of LTP. We also found that protein kinase A (PKA) and L-type voltage-gated calcium channels are crucial for the expression of the presynaptic component of compound LTP, and NMDA channels are essential for that of the postsynaptic component of LTP. These data are the first direct evidence that presynaptic and postsynaptic components of LTP are temporally and mechanistically distinct.
Keywords: LTP, hippocampus, presynaptic, synaptic vesicle release, synaptopHluorin, two-photon laser-scanning microscopy, postsynaptic
Introduction
Physiological processes that underlie information storage, learning, and memory involve long-term potentiation (LTP), a persistent, activity-dependent increase in synaptic strength (Milner et al., 1998; Martin et al., 2000; Whitlock et al., 2006). LTP at excitatory synapses between CA3 and CA1 pyramidal neurons (CA3–CA1 synapses) in the hippocampus can be induced by a brief train of electrical stimuli (tetanus) that releases l-glutamate from presynaptic terminals and activates Ca2+ influx into postsynaptic neurons. Ca2+ activates biochemical cascades that give rise to the expression of LTP. Attempts to locate the site of LTP expression led to controversial results. Some studies indicated that presynaptic sites contribute to the increase in synaptic strength (Malinow, 1991; Stevens and Wang, 1994; Bolshakov and Siegelbaum, 1995; Stricker et al., 1999; Choi et al., 2000; Emptage et al., 2003; Voronin et al., 2004), and others indicated that postsynaptic sites serve that function (Malenka and Nicoll, 1999; Malinow and Malenka, 2002; Song and Huganir, 2002; Bredt and Nicoll, 2003; Malenka and Bear, 2004). Together, these results suggest that expression of LTP is not confined within a single neuron, but rather involves an enhancement of both presynaptic and postsynaptic function (Lisman and Raghavachari, 2006).
Previous attempts to isolate the increase in presynaptic function from the overall increase in synaptic strength by using the N-(3-triethylammoniumpropyl)-4-(4-(dibutylamino)styryl) pyridinium dibromide (FM 1–43) assay revealed that two major forms of LTP can be induced at CA3–CA1 synapses, compound LTP and postsynaptic LTP. Compound LTP is expressed both presynaptically and postsynaptically (Zakharenko et al., 2001); it depends on the activity of L-type voltage-gated calcium channels (L-VGCCs) (Grover and Teyler, 1990; Zakharenko et al., 2001), tyrosine kinases (Cavus and Teyler, 1996), and brain-derived neurotrophic factor (BDNF) (Zakharenko et al., 2003), and it can be induced by 200 Hz tetanization or theta-burst stimulation (TBS) of Schaffer collaterals (i.e., axons of CA3 neurons). Postsynaptic LTP is dependent on the activity of NMDA receptors (NMDARs) and serine-threonine kinases, and it can be induced by 50 Hz tetanization or short TBS (Grover and Teyler, 1990; Cavus and Teyler, 1996; Morgan and Teyler, 2001; Zakharenko et al., 2001, 2003).
These data strongly suggest that during LTP the functions of presynaptic and postsynaptic neurons are enhanced in a well coordinated way; however, the precise temporal relationship and nature of this coordination is not clear (Lauri et al., 2007). To directly address this issue, we monitored changes in presynaptic function and synaptic strength before and for as long as 3 h after induction of LTP in acute hippocampal slices.
Materials and Methods
Animals.
All animal experiments described in this manuscript were approved by the Animal Care and Use Committee of St. Jude Children's Research Hospital (Memphis, TN).
Electrophysiology.
Transverse hippocampal slices (400 μm) were prepared from 8- to 12-week-old spH21 (Li et al., 2005) or TV-46 (Araki et al., 2005) transgenic mice. Slices containing the dorsal part of the hippocampus were continuously superfused (2–3 ml/min) with artificial CSF (ACSF) containing (in mm) 125 NaCl, 2.5 KCl, 2 CaCl2, 2 MgSO4, 1.25 NaH2PO4, 26 NaHCO3, and 10 glucose (∼295 Osm), with 95% O2/5% CO2 at 31–32°C.
We recorded field EPSPs (fEPSPs) from the CA1 stratum radiatum by using an extracellular glass pipette (3–5 MΩ) filled with ACSF. Schaffer collateral/commissural fibers in the stratum radiatum were normally stimulated with a bipolar tungsten electrode placed 200–400 μm away from the recording pipette. Stimulation intensities were chosen to produce an fEPSP with a slope that was 30 to 35% of that obtained with maximal stimulation.
LTP was induced electrically by one of the following three protocols: (1) 200 Hz LTP was induced by three periods of tetanization delivered every 5 min. Every period of tetanization consisted of 10 trains of 200 Hz stimulation delivered for 200 ms every 5 s at 30 to 35% maximal stimulus intensity. A similar protocol has been used to induce compound LTP at CA3–CA1 synapses in the hippocampus (Cavus and Teyler, 1996; Zakharenko et al., 2001, 2003). (2) TBS LTP was induced using three sequences in 5 min intervals. Each sequence contained six trains with 10 s intervals between trains. Each train consisted of five bursts separated by 200 ms. Each burst included four 100 Hz pulses delivered at 30 to 35% of maximal stimulus intensity. Other studies have used a similar protocol to induce compound LTP (Morgan and Teyler, 2001; Zakharenko et al., 2003). (3) 50 Hz LTP was induced by three 1 s trains of 50 Hz stimulation applied every 20 s at 30 to 35% of maximal stimulus intensity. This protocol has been used previously to induce NMDAR-dependent LTP (Zakharenko et al., 2001, 2003).
Field EPSPs and changes in synaptopHluorin (spH) fluorescence were evoked using the same stimulating electrode. The fEPSPs were tested by delivering single square-form electrical stimuli (100 μs duration) at 0.033 Hz. Changes in spH fluorescence were tested by delivering 50 square-form electrical stimuli (100 μs duration) at 10 Hz for 5 s (10 Hz probe) at various time points before and after induction of LTP. The 10 Hz probe caused a short-term depression of fEPSPs [half-time (t1/2) = 24.6 ± 2.3 s; n = 32], but it did not induce long-term plasticity, even after multiple consecutive trials. The fEPSP slope and synaptopHluorin peak fluorescence (spHp) were measured off-line and used for additional analysis.
Two-photon laser-scanning microscopy imaging.
Two-photon laser-scanning microscopy (TPLSM) was performed using an Ultima imaging system (Prairie Technologies, Middletown WI), a Ti:sapphire Chameleon Ultra femtosecond-pulsed laser (900–920 nm) (Coherent, Santa Clara, CA), and 63 × 0.9 numerical aperture water-immersion infrared objective (Olympus, Center Valley, PA). The field of view (256 × 256 pixels, 0.154 μm/pixel) was chosen using the following criteria: (1) the field of view should be in the immediate vicinity of the recording electrode; (2) it should yield a change in spH fluorescence intensity evoked by the 10 Hz probe; (3) it should contain some stray fluorescent landmarks that could be used for additional alignment of the field of view during subsequent imaging at different time points.
To record changes in spH fluorescence intensity, we acquired 40 consecutive images (at 1 Hz) from a single field of view. Five images were taken before applying the 10 Hz probe, and 35 images were taken during and after stimulation. Experiments that did not contain the same landmarks throughout all images taken in one field of view were discarded. Previous work demonstrated that background spH fluorescence is caused by stray sensors on the cell surface (Sankaranarayanan et al., 2000), and photobleaching can uncouple background spH fluorescence from the activity-dependent spH increase (Gandhi and Stevens, 2003). Therefore, in some experiments, we used a similar approach and prephotobleached the fields of view. At the end of each experiment, iso-osmotic ACSF containing 50 mm NH4Cl, pH 7.4, was applied to identify presynaptic boutons (see Fig. 1a,b). Experiments in which NH4Cl failed to induce a robust increase in fluorescence intensity were discarded.
Figure 1.

SpH expression and activity in acute hippocampal slices. a, Images of the same field within the stratum radiatum of CA1 before (1), during (2), and after (3) 20 Hz synaptic stimulation for 5 s and (4) during 50 mm NH4Cl application. Scale bar, 3 μm. Region of interests (shown as areas inside white lines) are determined by the robust increase in fluorescence in 4. b, Fluorescent intensity (ΔF/F0 × 100) in a as a function of time was measured in five puncta identified during NH4Cl application. The bold line represents the average fluorescent intensity. Numbers represent time points when images in a were taken. Calibration: vertical, 10%; horizontal, 5 s. c, Dependence of spHp fluorescence on the number of stimulations (31 boutons; 8 slices). Stimulations were delivered for 5 s at the following frequencies: 1, 2, 10, 20, 50, 100, and 200 Hz in the presence of CNQX (10 μm), d-APV (50 μm), and bicuculline (50 μm).
Quantitative measures of fluorescence.
Sampling of fluorescence intensity was performed at 1 Hz (except in Fig. 1b, where sampling was performed at 0.6 Hz). Fluorescent intensity was measured quantitatively at individual boutons. Regions of interest (ROIs) were chosen post hoc based on the immediate and robust increase in fluorescence intensity after NH4Cl application (see Fig. 1a4), and pixel intensities of the ROIs within a field of view were averaged. Changes in fluorescence within chosen ROIs were analyzed at all time points. Changes in fluorescence intensity (ΔF) were expressed as ΔF(t) = F(t) − F0, and changes in normalized fluorescence intensity (ΔF/F0) of individual boutons were expressed as ΔF(t)/F0 = [F(t) − F0]/F0, where F(t) was the fluorescence intensity at a given time point, and F0 was the average fluorescence intensity of the five time points (F1 − F5) before the 10 Hz probe was applied.
Fluorescence data were expressed in arbitrary fluorescence units (a.f.u.) for ΔF and in percentages for ΔF/F0. The peak ΔF (spHp) or peak ΔF/F0 (normalized spHp) was measured either as spHp = (F9 + F10 + F11)/3 − F0 or normalized spHp = [(F9 + F10 + F11)/3 − F0]/F0. In addition, we measured the maximal slope of spH increase (spH slope) in response to the 10 Hz probe. The spH slope was measured using ClampFit (Molecular Devices, Sunnyvale, CA). The spHp, normalized spHp, and spH slope provided similar results in all LTP experiments tested; therefore, we chose to present all imaging data as changes in spHp.
In LTP experiments, the fEPSPs and spHp were measured at −25, −15, −5, 5, 30, 60, 90, 120, 150, and 180 min, where time 0 was the end of tetanization or the beginning of dibutyryl cAMP (dbcAMP) application. In experiments in Figure 4d, these measures were sampled more frequently. In the accompanying control experiments, no tetanization or dbcAMP was applied. At any given time point, the average fEPSP slope and spHp were calculated. The average fEPSP slope was calculated as the mean of five to 10 fEPSPs centered on a given time point.
Figure 4.

Compound LTP consists of slow presynaptic and fast postsynaptic components. a, Changes in the mean fEPSP slope (red symbols) and mean spHp (peak ΔF; green symbols) time courses of 18 slices (128 boutons) in which LTP was induced by 200 Hz tetanization (down arrow; filled symbols) and for six slices (45 boutons) that were not tetanized (open symbols). b, The representative fEPSP (red; average of 4 traces) and activity-dependent changes in spH fluorescence (green; average of 4 boutons) before and after 200 Hz tetanization. The numbers represent time points in a. c, Changes in fEPSPs as a function of changes in peak ΔF measured 5, 30, 60, and 180 min after 200 Hz tetanus. Red lines show the linear fit of experimental data; the lines were generated by using least-squares approximation. Dotted lines represent the theoretical function fEPSP slope = peak ΔF. d, The time courses of changes in the mean fEPSP slope (red symbols) and mean peak ΔF (green symbols) after LTP was induced by 200 Hz tetanization (40 boutons, 5 slices). This experiment was similar to that in a, but measurements of spHp were done during the first 60 min after induction of LTP.
To extract the postsynaptic component of LTP from changes in synaptic strength in Figure 9b, we used the following calculations: ΔPost(i)= ΔSynS(i) − ΔPre(i), where ΔPost indicates changes in the postsynaptic component; ΔSynS indicates changes in synaptic strength; and ΔPre indicates changes in the presynaptic component. Because ΔSynS(i) = ΔfEPSP slope(i), ΔPre(i) = k × ΔspHp(i), where k = 0.89 (derived from data in Fig. 3b). Thus, ΔPost(i)= ΔfEPSP slope(i) − 0.89 × ΔspHp(i).
Figure 9.

The presynaptic, but not the postsynaptic, component of compound LTP depends on PKA activity. a, Mean fEPSP slope (red) and spHp (peak ΔF; green) as a function of time before and after 200 Hz tetanization (down arrow) in the presence (open symbols; 62 boutons, 8 slices) or absence (control, closed symbols; 54 boutons, 7 slices) of PKI. b, Normalized AUCs measured in slices during a 3 h period after 200 Hz tetanization for the fEPSP slope, peak ΔF, and the function (fEPSP slope − peak ΔF) in the presence (white bars) or absence (control, gray bars) of PKI. c, Average fEPSP slope before and after 50 Hz tetanization in the presence (open circles; 7 slices) or absence (control, filled circles; 10 slices) of PKI. d, Mean fEPSP slope and peak ΔF as a function of time before and after 15-min application of 0.5 mm dbcAMP (45 boutons, 6 slices).
Figure 3.

SpH is the indicator of presynaptic activity. a, The spH fluorescence versus time before, during, and after 10 Hz stimulation in the absence (open squares) or presence (closed circles) of DPSPX (10 μm; 38 boutons, 8 slices). Experiments were done in the presence of 50 μm d-APV. Calibration: vertical, 5%; horizontal, 2 s. b, The spHp as a function of the fEPSP slope in response to 10 Hz (5 s) stimulation measured in solution with normal (black), low (red), or high (green) ratio of Ca2+/Mg2+ (47 boutons, 6 slices). The relationship between changes in spHp and those in the fEPSP slope was fitted as a linear regression function (blue line; ΔspHp(i) = 1/k × (ΔfEPSP slope(i)), where k = 0.89. Squares represent the average of each set of experiments. c, Frequency histogram for spHp of individual boutons from slices in b.
Inhibitors and reagents.
Nitrendipine, 1,3-dipropyl-8-(p-sulfophenyl)xanthine (DPSPX), and dbcAMP were purchased from Sigma (St. Louis, MO). CNQX, 2,3-dihydroxy-6-nitro-7-sulfonyl-benzo[f]quinoxaline (NBQX), bicuculline, picrotoxin, and d-APV were purchased from Tocris (Ellisville, MO). Cell-permeable PKI 14–22 amide (PKI) was purchased from EMD Biosciences (San Diego, CA).
Statistical analyses.
Data are presented as mean ± SEM. Areas under the curve (AUCs) were measured using the trapezoidal rule for unequally spaced x values, which is written in SigmaPlot (Systat Software, Point Richmond, CA). The differences in the mean values among the treatment groups were analyzed using one-way ANOVA (unless otherwise stated). Experimental groups were compared with control groups by using the Bonferroni t test. Pearson product moment correlation was measured using SigmaStat (Systat Software, Point Richmond, CA). In LTP experiments, the fEPSP slopes and peak ΔFs were normalized to their respective averages of data points collected before induction of LTP. Measurements of normalized peak ΔF and normalized fEPSP slope were paired and subjected to correlation analysis and linear regression analysis (see Fig. 4c) (Sokal and Rohlf, 1995).
Results
Presynaptic function imaged by the synaptopHluorin assay in acute hippocampal slices
We analyzed acute hippocampal slices from spH21 mice that express spH in a subset of neurons throughout the CNS (Li et al., 2005). The fusion protein spH consists of the synaptic vesicle protein VAMP2 and a pH-sensitive green fluorescent protein that increases fluorescence when the acidic lumen of the vesicle is exposed to the pH-neutral medium of the extracellular space (Miesenbock et al., 1998; Sankaranarayanan and Ryan, 2000). In the CA1 area of the hippocampus, spH fluorescence was weak and diffuse, with occasionally visible puncta that were possibly because of partial expression of spH on the plasma membrane (Fig. 1a). We did not detect any changes in spH fluorescence in the absence of electrical stimulation (data not shown). However, electrical stimulation of Schaffer collaterals dramatically increased spH fluorescence in a punctate manner, presumably reflecting fusion of synaptic vesicles in a subset of presynaptic terminals (Fig. 1a,b). At the conclusion of each experiment, we applied the iso-osmotic ACSF containing 50 mm NH4Cl to neutralize the acidic lumen of synaptic vesicles, thereby identifying intracellular sources of spH. Application of NH4Cl produced a robust increase in spH fluorescence at several locations within fields of view (Fig. 1a4). These locations had a mean diameter of 0.79 ± 0.04 μm (n = 198) and were reminiscent of en passant presynaptic boutons. We referred to these locations as ROIs and retrospectively analyzed changes in spH fluorescence at these locations as a measure of synaptic vesicle release from individual presynaptic boutons.
To quantify changes in spH fluorescence in response to stimulation of Schaffer collaterals, we measured spH fluorescence before, during, and after electrical stimulation and used peak spH fluorescence (spHp) as a measure of spH response to electrical stimulation. We found that spHp depended on the number of stimulations delivered to Schaffer collaterals (Fig. 1c), confirming that, similar to cell culture preparations (Sankaranarayanan and Ryan, 2000), acute brain slices are an appropriate preparation in which spHp can be used as a reliable indicator of presynaptic activity. Indeed, inhibition of postsynaptic receptors did not affect spH response to electrical stimulation. Thus, in the presence of antagonists of ionotropic glutamatergic receptors NBQX (1 μm) and d-APV(50 μm), the spH response to electrical stimulation did not significantly differ from that in control solution (data not shown).
To confirm that spH is selectively expressed in presynaptic boutons, we took advantage of TV-46 mice, a strain that expresses spH selectively in CA1 neurons (Araki et al., 2005), and the fact that there are no axon collaterals of CA1 neurons in the stratum radiatum. We found that in slices from TV-46 mice, spH was excluded from the stratum radiatum and did not respond to electrical stimulation of Schaffer collaterals (Fig. 2). Thus, we compared NH4Cl-dependent changes in spH fluorescence in stratum radiatum (CA3–CA1 synapses) and in stratum oriens (CA1-subiculum synapses) in slices from TV-46 mice and spH21 mice, a strain that expresses spH in CA3 and CA1 neurons (Li et al., 2005). Application of NH4Cl strongly increased spH fluorescence in both the stratum radiatum and stratum oriens of spH21 mice. In contrast, NH4Cl increased spH fluorescence only in the stratum oriens of TV-46 mice (Fig. 2a). Furthermore, electrical stimulation of spH21 Schaffer collaterals (axons of CA3 neurons) increased fluorescence in boutons in the stratum radiatum, and that delivered to the stratum pyramidale (cell bodies of CA1 neurons) increased fluorescence in boutons in the stratum oriens (Fig. 2b,d). In contrast, electrical stimulation of the stratum pyramidale in TV-46 slices changed spH fluorescence in the stratum oriens, whereas stimulation of Schaffer collaterals failed to induce any changes in the stratum radiatum (Fig. 2c,e). These results are consistent with spH expression being confined to presynaptic terminals.
Figure 2.

SpH is expressed in presynaptic boutons of pyramidal neurons in the hippocampus. a, The histogram of fluorescent intensities (ΔF) in single boutons before and after application of 50 mm NH4Cl in stratum radiatum and stratum oriens of acute hippocampal slices from spH21 and TV-46 transgenic mice. *p < 0.05. b, c, Diagrams of hippocampal slice preparations from spH21 (b) and TV-46 (c) transgenic mice. Stimulating electrodes (black coils) were placed either in the stratum radiatum (1) or stratum pyramidale (2). The spH-expressing neurons (green) and non-spH-expressing neurons (black) send their axons to the stratum radiatum and stratum oriens. d, e, Changes in spH fluorescence as a function of time in the stratum radiatum (red) and stratum oriens (green) before, during, and after 10 Hz stimulation of the stratum radiatum and stratum pyramidale in hippocampal slices from spH21 (d) and TV-46 (e) mice. Each trace is the average fluorescence from 21 to 29 boutons (4–5 slices). The fast decline in spH fluorescence in experiments using TV-46 mice is attributed to enhanced photobleaching of spH. TV-46 mice express low levels of spH; therefore, stronger laser excitation must be used in those slices. Calibration: vertical, 2%; horizontal, 2 s.
Although spH can be expressed in presynaptic terminals of both excitatory and inhibitory neurons in spH21 mice, three lines of evidence indicated that the fluorescence in the CA1 area mostly originated from presynaptic boutons of CA3 glutamatergic neurons. First, presynaptic terminals of excitatory CA3 pyramidal neurons account for the vast majority of terminals in this region (Hiscock et al., 2000). Second, >70% of spH-expressing presynaptic boutons in the hippocampus of spH21 mice are glutamatergic (Li et al., 2005). Third, the adenosine receptor antagonist DPSPX (10 μm), which relieves tonic presynaptic inhibition in glutamatergic but not GABAergic synapses (Dunwiddie et al., 1981; Li et al., 2005), dramatically augmented spHp in all (38 of 38) measured boutons in spH21 mice (Fig. 3a). Furthermore, failure of NBQX and APV to inhibit changes in spH fluorescence in response to stimulation further suggests that changes in spH fluorescence originate from excitatory but not inhibitory presynaptic terminals.
If excitatory presynaptic terminals in the CA1 area specifically express spH, can activity-dependent changes in spHp be used to detect changes in the probability of neurotransmitter release in this area? We tested this idea by increasing the ratio of Ca2+/Mg2+ from 1 (2 mm Ca2+; 2 mm Mg2+) to 2.5 (5 mm Ca2+; 2 mm Mg2+) to elevate the probability of neurotransmitter release. In turn, the spHp in those presynaptic boutons increased by 57.7 ± 12.1% (47 boutons, six slices; p < 0.01) (Fig. 3b). Conversely, decreasing the Ca2+/Mg2+ ratio from 1 (2 mm Ca2+; 2 mm Mg2+) to 0.25 (0.5 mm Ca2+; 2 mm Mg2+) reduced the spHp by 71.9 ± 3.8% (p < 0.01) (Fig. 3b). The correlation between changes in spHp and those in the fEPSP slope at different Ca2+/Mg2+ ratios was significant (r = 0.87; p < 0.001). Frequency histograms of spHp responses in individual boutons were constructed from slices in the presence of these three different Ca2+/Mg2+ ratios (Fig. 3c). There was a clear shift in the distribution of spHp toward lower values when the Ca2+/Mg2+ ratio was decreased from 1 to 0.25. Conversely, the distribution of spHp was shifted toward higher values when the Ca2+/Mg2+ ratio was switched from 1 to 2.5. Together, these data suggest that changes in spHp induced by activation of Schaffer collaterals can be used as a direct and reliable indicator of changes in presynaptic activity at CA3–CA1 synapses.
Slow development of the presynaptic component of compound LTP
To monitor presynaptic changes during both early and late phases of LTP, we monitored changes in spHp and fEPSPs from the same region of the CA1 area in slices from spH21 mice before and for 3 h after induction of various forms of LTP. Previous work in isolated neurons maintained in culture showed that spH can detect presynaptic changes in response to a single stimulation (Gandhi and Stevens, 2003). However, our experiments in acute slices showed that spH changes can be more reliably detected if activated by a train of synaptic stimulation. Therefore, we repeatedly tested spHp by using a 10 Hz (5 s) probe in the same presynaptic terminals before and after induction of LTP. We chose this testing protocol for the following reasons: (1) the 10 Hz probe did not induce any long-term changes in the fEPSP slope or spHp, even after multiple applications (Fig. 4a); (2) the 10 Hz probe did not affect potentiation of the fEPSP slope during LTP (data not shown); (3) all 50 fEPSPs evoked by the 10 Hz probe underwent similar potentiation after induction of LTP (data not shown), indicating that like a single stimulation, the 10 Hz probe can be used in LTP experiments to test synaptic strength rather than short-term plasticity; and (4) the increase in spH fluorescence produced by the 10 Hz probe (50 stimuli) was within the rising portion of the dose–response curve (Fig. 1c).
During compound LTP induced by 200 Hz tetanization, both synaptic strength and presynaptic function significantly increased and remained elevated as long as 3 h after induction of LTP (Fig. 4a). These data indicate that the presynaptic component contributes not only at 40 and 60 min after induction of LTP, as was shown previously using the FM 1–43 assay (Zakharenko et al., 2001, 2003), but also during the late phase of LTP. Interestingly, the time courses of changes in the fEPSP slope and spHp were dramatically different. The half-time (t1/2) of the increase in the fEPSP slope was 1.8 ± 0.9 min (18 slices), whereas that of the spHp rise was 35.8 ± 5.9 min (128 boutons, 18 slices; p < 0.001, paired t test) (Fig. 4a,b).
Dissociation between the time course of the fEPSP slope and that of the spHp was profound during the early phase of LTP. For instance, 30 min after induction of LTP, the fEPSP slope reached its maximum, whereas the increase in spHp measured at 30 min was significantly smaller (33.5 ± 6.3%) than that measured at 150 min (54.6 ± 10.4%; p < 0.05) or 180 min (54.1 ± 11.1%; p < 0.05) after induction of LTP. Furthermore, at the early phase of LTP, no correlation was found between changes in the fEPSP slope and those in spHp (Fig. 4c, 5 and 30 min). The gap between changes in fEPSPs and spHp narrowed (Fig. 4a), and a correlation between these changes became apparent starting 1 h after induction of LTP (Fig. 4c, 60 and 180 min). Similar data obtained in the presence of 100 μm picrotoxin suggested that inhibitory transmission does not account for the fast increase in the fEPSP slope and the slow increase in spHp induced by 200 Hz tetanization (data not shown).
We tested the hypothesis that the presynaptic component of compound LTP is expressed transiently during the first 5 min after tetanization by measuring spHp and the fEPSP slope with a higher temporal resolution during the first 60 min after 200 Hz tetanization (Fig. 4d). More frequent stimulation with the 10 Hz probe did not significantly affect the LTP of fEPSPs measured 1 h after 200 Hz tetanization (p > 0.05) (data not shown). As in previous experiments, synaptic strength increased immediately after tetanization, but the increase in presynaptic function was substantially delayed. Thus, the fEPSP slope increased rapidly (t1/2 = 0.9 ± 0.6 min; 5 slices), and spHp increased significantly slower (t1/2 = 33.2 ± 14.9 min; 40 boutons, 5 slices; p < 0.002), indicating that the presynaptic component of LTP is not expressed during the first minutes after tetanization.
The robust increase in spHp and strong correlation between spHp and the fEPSP slope during the late phase of LTP indicate that at a certain time increased synaptic strength is indeed associated with enhanced presynaptic function. However, the increase in spHp alone cannot explain the overall increased synaptic strength, especially during the early phase of LTP, because there was no correlation between changes in spHp and the fEPSP slope during the first 30 min after induction of LTP (Fig. 4c). Therefore, we conclude that compound LTP requires at least two components, the presynaptic component that can be monitored using the spH assay and the “nonpresynaptic” component that can be deduced from measuring the fEPSP slope and spHp. Given the considerable evidence identifying postsynaptic neurons as a potential site of LTP expression, we assumed that the “nonpresynaptic” component represents the postsynaptic component of LTP.
Requirement of NMDARs and L-VGCCs for postsynaptic and presynaptic components of compound LTP
Compound LTP at CA3–CA1 synapses requires Ca2+ influx into the postsynaptic CA1 neuron (Lynch et al., 1983; Grover and Teyler, 1990) through NMDARs or L-VGCCs (Grover and Teyler, 1990; Sabatini and Svoboda, 2000; Yasuda et al., 2003b). Previous FM 1–43 data indicate that L-VGCCs are crucial for the presynaptic component (Zakharenko et al., 2001, 2003). However, the role of NMDARs in presynaptic and postsynaptic components of compound LTP remains unclear.
To determine NMDAR function in presynaptic and postsynaptic components of LTP, we measured fEPSP and spHp before and after compound LTP induction in the presence of the NMDAR inhibitor d-APV (50 μm). NMDAR-independent LTP occurs at CA3–CA1 synapses (Grover and Teyler, 1990; Stricker et al., 1999; Moosmang et al., 2005); however, the cellular locus of its expression is unknown. In the presence of d-APV, the increases in the fEPSP slope and spHp stimulated by 200 Hz tetanization were significantly reduced by 76.5 ± 7.1% (eight slices; p < 0.01) and 36.7 ± 9.9% (52 boutons, eight slices; p < 0.05), respectively (Fig. 5a), compared with that in the absence of d-APV (Fig. 6). These data confirm previous findings that NMDAR-independent LTP is expressed at CA3-CA1 synapses. Furthermore, a small but significant decrease in spHp in the presence of d-APV indicates that expression of the presynaptic component of compound LTP may partially depend on NMDARs.
Figure 5.
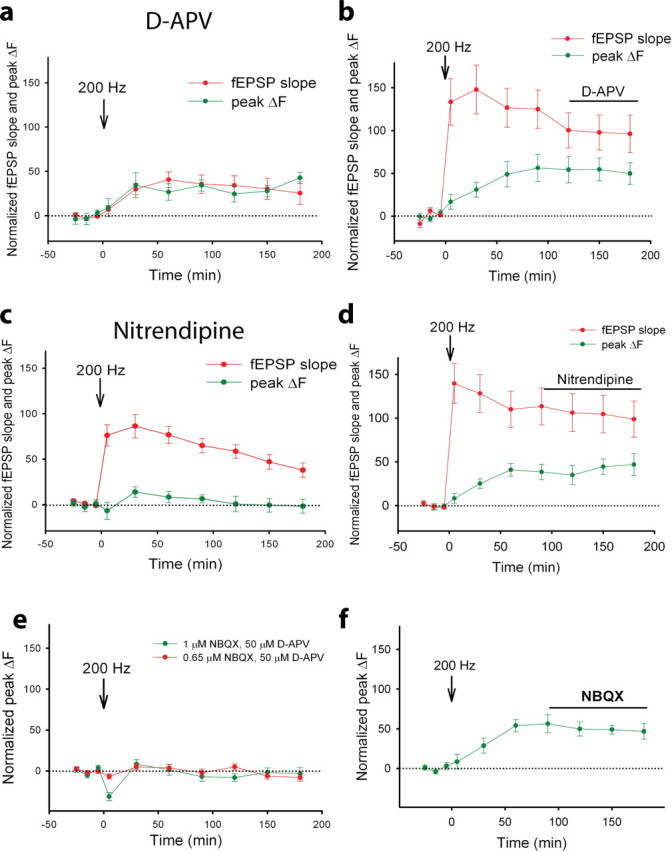
Role of NMDARs, L-VGCCs, and AMPARs in presynaptic and postsynaptic components of compound LTP. a, b, Average fEPSP slope (red) and spHp (peak ΔF; green) in slices that were tetanized by 200 Hz in the presence of d-APV (52 boutons, 8 slices) (a) or when d-APV was applied after tetanization (35 boutons, 5 slices) (b). c, d, Average fEPSP slope (red) and peak ΔF (green) in slices that were tetanized by 200 Hz in the presence of nitrendipine (76 boutons, 11 slices) (c) or when nitrendipine was applied after tetanization (17 boutons, 3 slices) (d). e, f, The peak ΔF versus time before and after 200 Hz tetanization in the presence of 1 μm NBQX and 50 μm d-APV (39 boutons, 6 slices) and in the presence of 0.65 μm NBQX and 50 μm d-APV (46 boutons, 6 slices) (e) and when NBQX alone was applied after 200 Hz tetanization (18 boutons, 4 slices) (f). Horizontal dotted lines represent 0% change, and the horizontal solid lines (b, d, f) represent when drugs were applied after tetanization.
Figure 6.

Normalized AUCs measured during a 3 h period after time 0 for the fEPSP slope and spHp (peak ΔF). Slices were either not tetanized or tetanized by 200 Hz in the absence or presence of 20 μm nitrendipine, 50 μm d-APV, or a combination of 50 μm d-APV and 1 μm NBQX. Data were normalized to the corresponding average determined in slices tetanized by 200 Hz in the control solution. *p < 0.05.
The gap between the time courses of changes in the fEPSP slope and spHp induced by 200 Hz tetanization closed in the presence of d-APV; the t1/2 for the fEPSP slope rise was not significantly different from that of the spHp rise (28.6 ± 9.7 min vs 30.4 ± 7.0 min; 52 boutons, eight slices; p > 0.05, paired t test). d-APV applied before but not after tetanization effectively inhibited the increase in fEPSPs and spHp, indicating that NMDARs are required for induction but not expression mechanisms of compound LTP and its presynaptic component (Fig. 5b). Similar time courses and amplitudes of change in the fEPSP slope and spHp in the presence of d-APV imply that the inhibition of NMDARs blocks the induction of the fast postsynaptic component of compound LTP and that NMDAR-independent LTP is expressed predominantly presynaptically.
Next, we tested a role of L-VGCCs in compound LTP and its presynaptic component by monitoring changes in the fEPSP slope and spHp in the presence of the L-VGCC inhibitor nitrendipine (20 μm). Nitrendipine did not affect basal synaptic transmission or neurotransmitter release (i.e., neither the fEPSP slope nor the spHp significantly changed) (data not shown). However, inhibition of L-VGCCs during induction of LTP attenuated compound LTP and almost completely blocked its presynaptic component. Thus nitrendipine significantly reduced the 200 Hz tetanization-induced changes in the fEPSP slope by 49.8 ± 6.4% (11 slices; p < 0.01) and those in the spHp by 91.6 ± 12.3% (76 boutons, 11 slices; p < 0.01) (Fig. 5c), compared with that induced in the absence of nitrendipine (Fig. 6). Nitrendipine completely blocked the late phase and partially inhibited the early phase of the presynaptic component of compound LTP (Fig. 5c). Thus, in the presence of nitrendipine, spHp transiently increased at 30 min after tetanization (p < 0.05) and then declined to the baseline level. The inhibitory effect of nitrendipine on the presynaptic component of compound LTP was evident when it was applied before but not after induction of LTP (Fig. 5c,d). These data indicate that L-VGCCs are required during induction of LTP and contribute to mechanisms of long-term expression of the presynaptic component of LTP.
Previous data indicated that the induction of compound LTP originates from postsynaptic neurons (Grover and Teyler, 1990). To determine whether the presynaptic component of compound LTP requires depolarization of a postsynaptic neuron, we blocked AMPA receptors (AMPARs) with NBQX, and we blocked NMDARs with d-APV. We recorded only changes in spHp because postsynaptic responses were blocked. We found that NBQX blocked the increase in spHp induced by 200 Hz tetanization if applied before but not after induction of LTP (Fig. 5e,f). In the presence of 1 μm NBQX, but not in the presence of 0.65 μm NBQX (the minimal concentration that completely blocks fEPSPs) (data not shown) the spHp transiently decreased at 5 min after tetanization, suggesting that at higher concentrations, NBQX directly interferes with presynaptic function via AMPAR-independent mechanisms. Overall, these data indicate that depolarization and the subsequent influx of Ca2+ through L-VGCCs into postsynaptic neurons are required for expression of the presynaptic component of LTP. This finding supports previous results demonstrating that chelating postsynaptic Ca2+ blocks induction and expression of all forms of LTP at CA3–CA1 synapses (Grover and Teyler, 1990).
Compound LTP induced by TBS consists of slow presynaptic and fast postsynaptic components
We examined whether the difference in time courses of the presynaptic component and postsynaptic component is a general phenomenon of compound LTP. To this end, we monitored changes in synaptic strength and presynaptic function induced by the TBS protocol, which also induces compound LTP at CA3–CA1 synapses (Morgan and Teyler, 2001; Zakharenko et al., 2003). Like 200 Hz tetanization, TBS induced the fast increase in synaptic strength (fEPSP t1/2 = 1.38 ± 0.8 min; nine slices) and the slow increase in presynaptic function (spHp t1/2 = 32.3 ± 7.5 min; 75 boutons, nine slices; p < 0.005, paired t test) (Fig. 7a). TBS induced LTP that was partially dependent on L-VGCCs (Fig. 7b); nitrendipine hindered the TBS-induced increase in the fEPSP slope by 32.3% (p < 0.05). Furthermore, similar to 200 Hz LTP, TBS induced slow-developing NMDAR-independent LTP that was expressed presynaptically (Fig. 7c). In the presence of d-APV, TBS slowly increased the fEPSP slope and spHp; the time courses of these changes were not significantly different (p > 0.05). Together, these results indicate that compound LTP comprising slow presynaptic and fast postsynaptic components can be induced by either 200 Hz tetanization or TBS.
Figure 7.

TBS induces compound LTP that consists of slow presynaptic and fast postsynaptic components. a, Mean fEPSP slope (red) and spHp (peak ΔF; green) as functions of time in slices that were stimulated by TBS (75 boutons, 9 slices). b, Mean fEPSP slope vs time in slices before and after TBS in the presence (open circles; 9 slices) or absence (closed circles; 11 slices) of nitrendipine. c, Mean fEPSP slope (red) and spHp (peak ΔF; green) as a function of time in slices that were stimulated by TBS in the presence of d-APV (31 boutons, 5 slices). Down arrows represent the onset of TBS.
LTP induced by 50 Hz tetanization consists only of the fast postsynaptic component
To determine whether NMDAR-dependent LTP represents the fast postsynaptic component of compound LTP, we monitored changes in the fEPSP slope and spHp before and after 50 Hz tetanization, which induces NMDAR-dependent LTP only (Grover and Teyler, 1990; Zakharenko et al., 2001). Previous data showed that the rate of FM 1–43 destaining did not change when measured at a single time point (40 min) after induction of 50 Hz LTP. However, the entire time course of presynaptic changes during 50 Hz LTP could not be determined. In this study, 50 Hz tetanization significantly increased the fEPSP slope but not spHp (Fig. 8a). Furthermore, nitrendipine did not alter LTP induced by 50 Hz tetanization (p > 0.05) (Fig. 8b). These data indicate that LTP induced with the 50 Hz protocol is indeed expressed exclusively postsynaptically.
Figure 8.
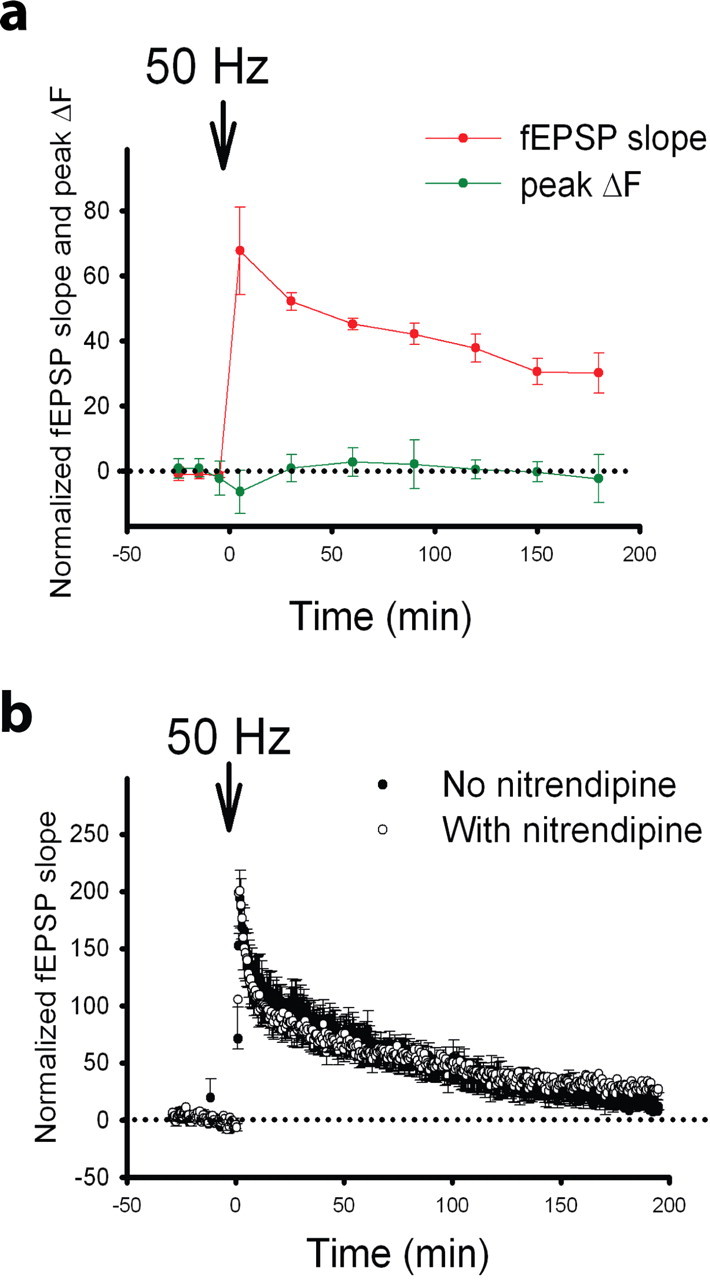
Tetanization with 50 Hz induces postsynaptic LTP. a, Mean fEPSP slope (red) and spHp (peak ΔF; green) as a function of time in slices that were tetanized with 50 Hz (69 boutons, 10 slices). b, Average fEPSP slope as a function of time in slices tetanized with 50 Hz in the presence (open circles; 6 slices) or absence (closed circles; 6 slices) of nitrendipine. Down arrows represent the onset of 50 Hz tetanization. Different scaling in a and b was chosen because the data were represented with unequal sampling frequencies.
The cAMP-PKA signaling is crucial for expression of the presynaptic but not postsynaptic component of compound LTP
Although presynaptic and postsynaptic components of LTP are initiated in postsynaptic neurons, our results suggested that they have different mechanisms of expression. The slow increase in presynaptic function during compound LTP was reminiscent of chemically induced, PKA-dependent LTP that can be induced at CA3–CA1 synapses by increasing the intracellular level of cAMP (Frey et al., 1993; Bolshakov et al., 1997; Yu et al., 2001; Otmakhov et al., 2004). To define the role of PKA in the presynaptic and postsynaptic components of compound LTP, we monitored changes in the fEPSP slope and spHp in the presence and absence of the cell-permeable, PKA-specific inhibitor PKI 14–22 amide (1 μm). PKI significantly attenuated the increase in the fEPSP slope (p < 0.05) and eliminated the increase in spHp induced by 200 Hz tetanization (Fig. 9a,b). Interestingly, there was a transient decrease in spHp in the presence of PKI at 5 min after induction of LTP, suggesting that PKI interferes with presynaptic function immediately after tetanus. Together these results indicate that PKA is crucial for expression of the presynaptic component of compound LTP.
Application of PKI partially inhibited LTP of fEPSPs at 5 min after tetanization, a time when the increase in spHp was not always evident. These data indicate that in addition to its crucial role in the late phase of compound LTP and its presynaptic component, PKA may have some role in the early phase of compound LTP and therefore in its postsynaptic mechanisms. Indeed, previous observations attributing the effect of cAMP-PKA-dependent pathways mostly to the late phase of LTP (Frey et al., 1993; Huang and Kandel, 1994; Winder et al., 1998), although one report showed that PKA can be involved in the early phase of LTP (Otmakhova et al., 2000). To address the role of PKA in postsynaptic LTP, we induced LTP by 50 Hz tetanization in the presence of PKI. The increase in fEPSPs induced by 50 Hz tetanization was not altered by PKI (Fig. 9c), suggesting minimal involvement of the PKA-dependent cascade in postsynaptic mechanisms of LTP.
Finally, after showing that PKA is important for presynaptic mechanisms of compound LTP, we examined whether PKA activation is sufficient to selectively increase presynaptic function. We bath applied the membrane-permeable cAMP analog dbcAMP (0.5 mm) to activate PKA and then monitored subsequent changes in the fEPSP slope and spHp. We found that both measures were significantly enhanced (Fig. 9d). Interestingly, the amplitudes and time courses of the dbcAMP-induced increases in spHp and the fEPSP slope were very similar, i.e., the t1/2 of the increase in the fEPSP slope was 35.3 ± 10.7 min (six slices), and that of the increase in spHp was 26.8 ± 7.4 min (45 boutons, six slices, p > 0.05). Together, these results suggest that the PKA-dependent increase in synaptic strength is attributable to enhanced neurotransmitter release from presynaptic neurons.
Discussion
Here, we provided the first report of continuously monitored changes in presynaptic function and synaptic strength during LTP, providing new insight into the nature of hippocampal LTP. Using this approach, we found that compound LTP, induced either by 200 Hz or TBS, consists of a slow presynaptic component and a fast postsynaptic component. The slow presynaptic component requires activation of L-VGCCs. The fast postsynaptic component strongly depends on activation of NMDARs. Finally, the expression of the presynaptic but not the postsynaptic component of compound LTP strongly depends on PKA.
We conclude that the spH assay in combination with TPLSM imaging can be used as a direct and reliable indicator of presynaptic function at excitatory synapses in acute hippocampal slices. First, expression of spH in slices from mature mice specifically targets presynaptic terminals of pyramidal neurons. Second, changes in spHp strongly correlate with changes in postsynaptic response when the probability of neurotransmitter release is manipulated. Third, bath application of adenosine antagonists, which others have shown to relieve presynaptic inhibition at excitatory but not at inhibitory synapses (Dunwiddie et al., 1981; Li et al., 2005), increases spHp in all measured boutons.
Using the spH assay, we showed for the first time that the presynaptic component of LTP not only develops slowly, but can last for as long as 3 h after induction. This finding indicates that presynaptic function changes little during the early phase of LTP, but has a greater contribution during the late phase of LTP. As a corollary to these results, the contribution of postsynaptic mechanisms is more profound during the early phase of LTP. This notion is supported by the evidence that the time course of the increase in postsynaptic response was strikingly different from that of the presynaptic function. After induction of LTP, synaptic strength grew fast with a t1/2 of ∼1 min, whereas its presynaptic component was more sluggish and grew with a t1/2 of ∼35 min. In agreement with this observation, previous data indicate that induction of LTP induces rapid morphological and functional changes in dendritic spines, supporting the idea of the fast postsynaptic component of LTP (Lang et al., 2004; Matsuzaki et al., 2004; Park et al., 2004; Bagal et al., 2005; Kopec et al., 2006).
Previous attempts to directly test time courses of presynaptic function during LTP proved to be very challenging. Recordings from postsynaptic neurons that are inherently indirect provided contradictory results. For instance, postsynaptic neurons did not respond to ionophoretically applied quisqualate and AMPA immediately after induction of LTP, but became sensitive to the agonists 30 min later (Davies et al., 1989). However, postsynaptic neurons are more sensitive to glutamate uncaging immediately after induction of LTP (Bagal et al., 2005). Furthermore, previous work in the barrel cortex suggested that presynaptic function increases during LTP, as determined by paired-pulse analysis, coefficient of variation analysis, and quantal analysis, in addition to a faster GluR1-dependent postsynaptic component of LTP (Hardingham and Fox, 2006).
Previously, Lisman and Raghavachari (2006) proposed a hypothesis to reconcile existing data on presynaptic and postsynaptic mechanisms of LTP. Based on work from many different laboratories, they postulated that LTP consists of several temporally overlapping processes that include a slow developing presynaptic component and rapidly developing postsynaptic component. This hypothesis inferred a slow presynaptic component of LTP because the NMDAR component of postsynaptic responses develops slower than the AMPAR component (Xiao et al., 1995; Watt et al., 2004). Our present work thus provides the direct experimental evidence for this hypothesis.
Both presynaptic and postsynaptic components of compound LTP require an increase in Ca2+ in the postsynaptic CA1 neuron (Grover and Teyler, 1990). NMDARs and L-VGCCs are responsible for most of the Ca2+ influx from the extracellular space. Here, we have addressed how these two routes of Ca2+ influx contribute to the temporal phases of presynaptic and postsynaptic LTP. We have demonstrated that L-VGCCs are necessary for expression of the late phase of the presynaptic component of LTP; nitrendipine completely blocked the late phase and only partially inhibited the early phase of the presynaptic changes. These findings are consistent with data from a previous study in which we measured the rate of FM 1–43 destaining to visualize the presynaptic component of compound LTP (Zakharenko et al., 2001). In that work, we found that, at 40 min after induction of compound LTP, the presynaptic function was only partially inhibited by nitrendipine. In our present work, we show that in the presence of nitrendipine, the presynaptic component transiently increased at 30 min and then slowly declined. This finding emphasizes the advantage of using the spH assay over the FM 1–43 assay to achieve a greater understanding of compound LTP and its presynaptic component. Because of multiple loading and unloading of the FM 1–43 dye into slices, the FM 1–43 assay can provide only one or two “snapshots” of the presynaptic function, whereas the spH assay reveals a complete time course of the presynaptic component of compound LTP.
We also found that NMDA channels are crucial for the postsynaptic component of LTP. NMDAR blocker completely eliminated the fast component of compound LTP and the time course and magnitude of NMDAR-independent LTP of fEPSPs and spHp were indistinguishable. These data suggest that these two routes of Ca2+ influx operate in parallel. Induction of compound LTP in the presence of an L-VGCC inhibitor results in fast postsynaptic LTP, whereas induction of compound LTP in the presence of an NMDAR inhibitor produces the slow presynaptic component.
Because both L-VGCCs and NMDARs require depolarization of the postsynaptic membrane for their activation (Mayer et al., 1984; Nowak et al., 1984; Lipscombe et al., 2004), depolarization of the postsynaptic membrane rather than the increase in Ca2+ level in a postsynaptic neuron is probably a dissociation point for expression of the presynaptic and postsynaptic components of compound LTP. Indeed, 200 Hz stimulation failed to induce the presynaptic component of LTP when both postsynaptic AMPA and NMDA receptors were blocked. Therefore, we propose that during induction of LTP, glutamate activates postsynaptic AMPA receptors, which in turn, depolarize the postsynaptic membrane, thereby activating both NMDARs and L-VGCCs. Activation of these channels gives rise to two independent Ca2+ routes into a postsynaptic neuron, eventually dissociating the postsynaptic and presynaptic components of compound LTP. It is therefore conceivable that a combination of several factors such as the levels of expression of AMPARs, NMDARs, and L-VGCCs determine whether presynaptic or postsynaptic components of LTP are predominantly expressed at a particular synapse.
The presynaptic component of compound LTP was partially (36%) inhibited in the presence of the NMDAR antagonist d-APV. This result implies that the presynaptic component of LTP not only depends on L-VGCCs, but also requires NMDARs for full expression. An alternative interpretation of this result is that induction of LTP produces a weaker depolarization in the presence of d-APV that may result in incomplete activation of presynaptic mechanisms.
The postsynaptic induction and partial presynaptic expression of compound LTP suggests the existence of a retrograde signal. Slow development of the presynaptic component indicates that the entire process of the retrograde signals' synthesis, delivery to presynaptic terminals, and effect on the neurotransmitter release machinery occurs within the first hour after induction of LTP. However, little is known about the nature of the retrograde signal or about how this signal regulates presynaptic activity.
It is now clear that during LTP the molecular mechanisms that underlie the increase in presynaptic function differ from those that underlie postsynaptic functions. Although great progress has been made toward understanding the mechanisms of the postsynaptic component of LTP, those of the presynaptic component have remained somewhat murky because of technical difficulties associated with isolating presynaptic function from overall changes in synaptic strength. As was discussed previously, attempts to verify involvement of certain molecules in LTP by using conventional electrophysiological methods have provided controversial data. Previous developments in imaging approaches in slice preparations have helped to delineate the roles of several molecules in the presynaptic and postsynaptic components of compound LTP. For instance, developing a method to directly measure presynaptic activity in acute hippocampal slices by using the FM 1–43 dye facilitated the discovery of two loci of LTP expression. Moreover, application of the FM 1–43 assay to hippocampal slices from mice with a restricted deletion of BDNF revealed that the expression of only the presynaptic component of LTP depends on BDNF and that the source of BDNF during LTP is postsynaptic CA1 neurons (Zakharenko et al., 2003). However, despite its advantages, the FM 1–43 method is laborious and is associated with prolonged loading and unloading protocols that make it difficult to follow functional changes in a single presynaptic bouton for the duration of LTP. A new approach that circumvents these two major drawbacks is the spH assay. We used this approach and followed changes in the same subset of presynaptic terminals over a much longer period of time than possible when we used the FM 1–43 assay. By using the spH assay to retest many molecules that were previously implicated in LTP, we can specifically address their roles in presynaptic and/or postsynaptic mechanisms.
Here, we used the spH assay to pinpoint the cellular locus of PKA in compound LTP. We have addressed the role of PKA in LTP for two main reasons. First, the role of PKA in LTP is controversial. Different groups using various induction protocols in animals of various ages have provided mixed results indicating that PKA may be important for only a subset of mechanisms involved in LTP (Blitzer et al., 1995; Abel et al., 1997; Yasuda et al., 2003a; Skeberdis et al., 2006). Second, the slow increase in spH response during compound LTP was reminiscent of cAMP-PKA-dependent, chemically induced LTP (Frey et al., 1993; Otmakhov et al., 2004). We have now shown that the cAMP-PKA cascade is necessary for the presynaptic component of compound LTP. Inhibition of PKA blocked the increase in spHp, but only partially inhibited the increase in fEPSPs induced by 200 Hz tetanization. We also shown that activation of the cAMP-PKA cascade is sufficient to induce the increase in presynaptic function that resembles the slow presynaptic component of compound LTP. In the current study, we did not test whether the slow enhancement of synaptic transmission and presynaptic function induced by cAMP depends on NMDARs or L-VGCCs. However, previous data indicate that bath application of a cAMP agonist with low-frequency synaptic stimulation (using an experimental protocol that is similar to the one used in this work) potentiated synaptic transmission, and this potentiation was inhibited by NMDAR antagonists (Otmakhov et al., 2004).
Interestingly, by inhibiting PKA, we reduced the fEPSPs at 5 min after 200 Hz tetanization, when the presynaptic component of LTP had not yet developed. This data suggests that in addition to being crucial for the presynaptic component of LTP, PKA is also required for the postsynaptic mechanisms. Indeed, previous studies have shown that infusion of PKA inhibitors into a postsynaptic CA1 neuron partially inhibits LTP, further supporting this premise (Blitzer et al., 1995; Otmakhova et al., 2000; Duffy and Nguyen, 2003).
Although reduction of LTP of fEPSPs at 5 min after 200 Hz tetanization was evident when either PKA (Fig. 9a) or L-VGCCs (Fig. 5c) were inhibited, LTP of fEPSPs induced by 50 Hz tetanization was unaffected by either of these pharmacological manipulations. Interestingly, the increase in fEPSPs induced by 50 Hz tetanization was significantly smaller than that induced by 200 Hz tetanization or TBS. These data suggest that the postsynaptic component of compound LTP has a range of expression that depends on the strength and duration of tetanization. Although the 50 Hz protocol reliably induces postsynaptic LTP, it is conceivable that stronger (and possibly mechanistically distinct) postsynaptic LTP can be induced by more intense tetanization. This notion is consistent with our previous work, where we showed that both 50 Hz and 100 Hz induction protocols produced postsynaptic LTP (neither induction protocol changed presynaptic function, as indicated by the unchanged rate of FM 1–43 destaining from presynaptic terminals) (Zakharenko et al., 2001). However, the 100 Hz-LTP had a substantially larger amplitude of potentiation of the fEPSPs than did the 50 Hz LTP. Therefore, stronger tetanization such as that induced by the 200 Hz protocol may also induce a postsynaptic LTP that is quantitatively (or mechanistically) different from that induced by 50 Hz tetanization. Nonetheless, the fact that postsynaptic LTP induced by 50 Hz tetanization did not appear to be affected by either PKA or L-VGCC inhibitors suggests that if PKA or L-VGCCs are involved in postsynaptic mechanisms, their contribution to that component of LTP is substantially less dramatic than their contribution to the presynaptic mechanisms.
Dependence of the presynaptic component of compound LTP on PKA suggests two major possibilities: induction of LTP mobilizes the cAMP-PKA-dependent cascade either in the presynaptic terminals to directly enhance presynaptic function or in the postsynaptic neurons to promote production of a retrograde messenger (Arancio et al., 1995, 1996; Futai et al., 2007; Tao and Poo, 2001). The existence of presynaptic cAMP-PKA-sensitive targets such as Rim1α, rabphilin, and synapsins that are involved in the mechanisms of neurotransmitter release favors the former scenario. Furthermore, phosphorylation of Rim1α by PKA plays a crucial role in presynaptic LTP at cerebellar parallel fiber synapses (Lonart et al., 2003) and hippocampal mossy fiber synapses (Castillo et al., 2002). However, previous evidence that PKA facilitates Ca2+ influx into CA1 neurons (Skeberdis et al., 2006), possibly enhancing production of a retrograde messenger favors the latter scenario.
In conclusion, our results provide strong direct evidence that LTP at CA3-CA1 synapses is not a single-compartment phenomenon, but rather a convolution of both presynaptic and postsynaptic processes that independently strengthen the synapse. This compound LTP consists of a fast postsynaptic component and a slow presynaptic component. These two components of LTP are well coordinated but mechanistically distinct.
Footnotes
This work was supported in part by the Whitehall Foundation, National Alliance for Research on Schizophrenia and Depression, National Cancer Institute Cancer Center Support Grant P30 CA-021765, and by the American Lebanese Syrian Associated Charities (S.S.Z.). S.S.Z. is a Searle Scholar. We thank Venkatesh Murthy for providing spH21 mice and Hiromu Yawo for providing TV-46 mice. We thank Thomas Schikorski, Steve Siegelbaum, Jim Morgan, Jay Blundon, and Margaret Sperow for constructive comments and Angie McArthur for editing this manuscript.
References
- Abel T, Nguyen PV, Barad M, Deuel TA, Kandel ER, Bourtchouladze R. Genetic demonstration of a role for PKA in the late phase of LTP and in hippocampus-based long-term memory 6. Cell. 1997;88:615–626. doi: 10.1016/s0092-8674(00)81904-2. [DOI] [PubMed] [Google Scholar]
- Araki R, Sakagami H, Yanagawa Y, Hikima T, Ishizuka T, Yawo H. Transgenic mouse lines expressing synaptopHluorin in hippocampus and cerebellar cortex. Genesis. 2005;42:53–60. doi: 10.1002/gene.20125. [DOI] [PubMed] [Google Scholar]
- Arancio O, Kandel ER, Hawkins RD. Activity-dependent long-term enhancement of transmitter release by presynaptic 3′,5′-cyclic GMP in cultured hippocampal neurons. Nature. 1995;376:74–80. doi: 10.1038/376074a0. [DOI] [PubMed] [Google Scholar]
- Arancio O, Kiebler M, Lee CJ, Lev-Ram V, Tsien RY, Kandel ER, Hawkins RD. Nitric oxide acts directly in the presynaptic neuron to produce long-term potentiation in cultured hippocampal neurons. Cell. 1996;87:1025–1035. doi: 10.1016/s0092-8674(00)81797-3. [DOI] [PubMed] [Google Scholar]
- Bagal AA, Kao JP, Tang CM, Thompson SM. Long-term potentiation of exogenous glutamate responses at single dendritic spines. Proc Natl Acad Sci USA. 2005;102:14434–14439. doi: 10.1073/pnas.0501956102. [DOI] [PMC free article] [PubMed] [Google Scholar]
- Blitzer RD, Wong T, Nouranifar R, Iyengar R, Landau EM. Postsynaptic cAMP pathway gates early LTP in hippocampal CA1 region. Neuron. 1995;15:1403–1414. doi: 10.1016/0896-6273(95)90018-7. [DOI] [PubMed] [Google Scholar]
- Bolshakov VY, Siegelbaum SA. Regulation of hippocampal transmitter release during development and long-term potentiation. Science. 1995;269:1730–1734. doi: 10.1126/science.7569903. [DOI] [PubMed] [Google Scholar]
- Bolshakov VY, Golan H, Kandel ER, Siegelbaum SA. Recruitment of new sites of synaptic transmission during the cAMP-dependent late phase of LTP at CA3-CA1 synapses in the hippocampus. Neuron. 1997;19:635–651. doi: 10.1016/s0896-6273(00)80377-3. [DOI] [PubMed] [Google Scholar]
- Bredt DS, Nicoll RA. AMPA receptor trafficking at excitatory synapses. Neuron. 2003;40:361–379. doi: 10.1016/s0896-6273(03)00640-8. [DOI] [PubMed] [Google Scholar]
- Castillo PE, Schoch S, Schmitz F, Sudhof TC, Malenka RC. RIM1alpha is required for presynaptic long-term potentiation. Nature. 2002;415:327–330. doi: 10.1038/415327a. [DOI] [PubMed] [Google Scholar]
- Cavus I, Teyler T. Two forms of long-term potentiation in area CA1 activate different signal transduction cascades. J Neurophysiol. 1996;76:3038–3047. doi: 10.1152/jn.1996.76.5.3038. [DOI] [PubMed] [Google Scholar]
- Choi S, Klingauf J, Tsien RW. Postfusional regulation of cleft glutamate concentration during LTP at “silent synapses.”. Nat Neurosci. 2000;3:330–336. doi: 10.1038/73895. [DOI] [PubMed] [Google Scholar]
- Davies SN, Lester RA, Reymann KG, Collingridge GL. Temporally distinct pre- and post-synaptic mechanisms maintain long-term potentiation. Nature. 1989;338:500–503. doi: 10.1038/338500a0. [DOI] [PubMed] [Google Scholar]
- Duffy SN, Nguyen PV. Postsynaptic application of a peptide inhibitor of cAMP-dependent protein kinase blocks expression of long-lasting synaptic potentiation in hippocampal neurons. J Neurosci. 2003;23:1142–1150. doi: 10.1523/JNEUROSCI.23-04-01142.2003. [DOI] [PMC free article] [PubMed] [Google Scholar]
- Dunwiddie TV, Hoffer BJ, Fredholm BB. Alkylxanthines elevate hippocampal excitability. Evidence for a role of endogenous adenosine. Naunyn Schmiedebergs Arch Pharmacol. 1981;316:326–330. doi: 10.1007/BF00501365. [DOI] [PubMed] [Google Scholar]
- Emptage NJ, Reid CA, Fine A, Bliss TV. Optical quantal analysis reveals a presynaptic component of LTP at hippocampal Schaffer-associational synapses. Neuron. 2003;38:797–804. doi: 10.1016/s0896-6273(03)00325-8. [DOI] [PubMed] [Google Scholar]
- Frey U, Huang YY, Kandel ER. Effects of cAMP simulate a late stage of LTP in hippocampal CA1 neurons. Science. 1993;260:1661–1664. doi: 10.1126/science.8389057. [DOI] [PubMed] [Google Scholar]
- Futai K, Kim MJ, Hashikawa T, Scheiffele P, Sheng M, Hayashi Y. Retrograde modulation of presynaptic release probability through signaling mediated by PSD-95-neuroligin. Nat Neurosci. 2007;10:186–195. doi: 10.1038/nn1837. [DOI] [PMC free article] [PubMed] [Google Scholar]
- Gandhi SP, Stevens CF. Three modes of synaptic vesicular recycling revealed by single-vesicle imaging. Nature. 2003;423:607–613. doi: 10.1038/nature01677. [DOI] [PubMed] [Google Scholar]
- Grover LM, Teyler TJ. Two components of long-term potentiation induced by different patterns of afferent activation. Nature. 1990;347:477–479. doi: 10.1038/347477a0. [DOI] [PubMed] [Google Scholar]
- Hardingham N, Fox K. The role of nitric oxide and GluR1 in presynaptic and postsynaptic components of neocortical potentiation. J Neurosci. 2006;26:7395–7404. doi: 10.1523/JNEUROSCI.0652-06.2006. [DOI] [PMC free article] [PubMed] [Google Scholar]
- Hiscock JJ, Murphy S, Willoughby JO. Confocal microscopic estimation of GABAergic nerve terminals in the central nervous system. J Neurosci Methods. 2000;95:1–11. doi: 10.1016/s0165-0270(99)00163-6. [DOI] [PubMed] [Google Scholar]
- Huang YY, Kandel ER. Recruitment of long-lasting and protein kinase A-dependent long-term potentiation in the CA1 region of hippocampus requires repeated tetanization. Learn Mem. 1994;1:74–82. [PubMed] [Google Scholar]
- Kopec CD, Li B, Wei W, Boehm J, Malinow R. Glutamate receptor exocytosis and spine enlargement during chemically induced long-term potentiation. J Neurosci. 2006;26:2000–2009. doi: 10.1523/JNEUROSCI.3918-05.2006. [DOI] [PMC free article] [PubMed] [Google Scholar]
- Lang C, Barco A, Zablow L, Kandel ER, Siegelbaum SA, Zakharenko SS. Transient expansion of synaptically connected dendritic spines upon induction of hippocampal long-term potentiation. Proc Natl Acad Sci USA. 2004;101:16665–16670. doi: 10.1073/pnas.0407581101. [DOI] [PMC free article] [PubMed] [Google Scholar]
- Lauri SE, Palmer M, Segerstrale M, Vesikansa A, Taira T, Collingridge GL. Presynaptic mechanisms involved in the expression of STP and LTP at CA1 synapses in the hippocampus. Neuropharmacology. 2007;52:1–11. doi: 10.1016/j.neuropharm.2006.06.017. [DOI] [PubMed] [Google Scholar]
- Li Z, Burrone J, Tyler WJ, Hartman KN, Albeanu DF, Murthy VN. Synaptic vesicle recycling studied in transgenic mice expressing synaptopHluorin. Proc Natl Acad Sci USA. 2005;102:6131–6136. doi: 10.1073/pnas.0501145102. [DOI] [PMC free article] [PubMed] [Google Scholar]
- Lipscombe D, Helton TD, Xu W. L-type calcium channels: the low down. J Neurophysiol. 2004;92:2633–2641. doi: 10.1152/jn.00486.2004. [DOI] [PubMed] [Google Scholar]
- Lisman J, Raghavachari S. A unified model of the presynaptic and postsynaptic changes during LTP at CA1 synapses. Sci STKE. 2006;2006:re11. doi: 10.1126/stke.3562006re11. [DOI] [PubMed] [Google Scholar]
- Lonart G, Schoch S, Kaeser PS, Larkin CJ, Sudhof TC, Linden DJ. Phosphorylation of RIM1alpha by PKA triggers presynaptic long-term potentiation at cerebellar parallel fiber synapses. Cell. 2003;115:49–60. doi: 10.1016/s0092-8674(03)00727-x. [DOI] [PubMed] [Google Scholar]
- Lynch G, Larson J, Kelso S, Barrionuevo G, Schottler F. Intracellular injections of EGTA block induction of hippocampal long-term potentiation. Nature. 1983;305:719–721. doi: 10.1038/305719a0. [DOI] [PubMed] [Google Scholar]
- Malenka RC, Bear MF. LTP and LTD: an embarrassment of riches. Neuron. 2004;44:5–21. doi: 10.1016/j.neuron.2004.09.012. [DOI] [PubMed] [Google Scholar]
- Malenka RC, Nicoll RA. Long-term potentiation—a decade of progress? Science. 1999;285:1870–1874. doi: 10.1126/science.285.5435.1870. [DOI] [PubMed] [Google Scholar]
- Malinow R. Transmission between pairs of hippocampal slice neurons: quantal levels, oscillations, and LTP. Science. 1991;252:722–724. doi: 10.1126/science.1850871. [DOI] [PubMed] [Google Scholar]
- Malinow R, Malenka RC. AMPA receptor trafficking and synaptic plasticity. Annu Rev Neurosci. 2002;25:103–126. doi: 10.1146/annurev.neuro.25.112701.142758. [DOI] [PubMed] [Google Scholar]
- Martin SJ, Grimwood PD, Morris RG. Synaptic plasticity and memory: an evaluation of the hypothesis. Annu Rev Neurosci. 2000;23:649–711. doi: 10.1146/annurev.neuro.23.1.649. [DOI] [PubMed] [Google Scholar]
- Matsuzaki M, Honkura N, Ellis-Davies GC, Kasai H. Structural basis of long-term potentiation in single dendritic spines. Nature. 2004;429:761–766. doi: 10.1038/nature02617. [DOI] [PMC free article] [PubMed] [Google Scholar]
- Mayer ML, Westbrook GL, Guthrie PB. Voltage-dependent block by Mg2+ of NMDA responses in spinal cord neurons 14. Nature. 1984;309:261–263. doi: 10.1038/309261a0. [DOI] [PubMed] [Google Scholar]
- Miesenbock G, De Angelis DA, Rothman JE. Visualizing secretion and synaptic transmission with pH-sensitive green fluorescent proteins. Nature. 1998;394:192–195. doi: 10.1038/28190. [DOI] [PubMed] [Google Scholar]
- Milner B, Squire LR, Kandel ER. Cognitive neuroscience and the study of memory. Neuron. 1998;20:445–468. doi: 10.1016/s0896-6273(00)80987-3. [DOI] [PubMed] [Google Scholar]
- Moosmang S, Haider N, Klugbauer N, Adelsberger H, Langwieser N, Muller J, Stiess M, Marais E, Schulla V, Lacinova L, Goebbels S, Nave KA, Storm DR, Hofmann F, Kleppisch T. Role of hippocampal Cav1.2 Ca2+ channels in NMDA receptor-independent synaptic plasticity and spatial memory. J Neurosci. 2005;25:9883–9892. doi: 10.1523/JNEUROSCI.1531-05.2005. [DOI] [PMC free article] [PubMed] [Google Scholar]
- Morgan SL, Teyler TJ. Electrical stimuli patterned after the theta-rhythm induce multiple forms of LTP. J Neurophysiol. 2001;86:1289–1296. doi: 10.1152/jn.2001.86.3.1289. [DOI] [PubMed] [Google Scholar]
- Nowak L, Bregestovski P, Ascher P, Herbet A, Prochiantz A. Magnesium gates glutamate-activated channels in mouse central neurones. Nature. 1984;307:462–465. doi: 10.1038/307462a0. [DOI] [PubMed] [Google Scholar]
- Otmakhov N, Khibnik L, Otmakhova N, Carpenter S, Riahi S, Asrican B, Lisman J. Forskolin-induced LTP in the CA1 hippocampal region is NMDA receptor dependent. J Neurophysiol. 2004;91:1955–1962. doi: 10.1152/jn.00941.2003. [DOI] [PubMed] [Google Scholar]
- Otmakhova NA, Otmakhov N, Mortenson LH, Lisman JE. Inhibition of the cAMP pathway decreases early long-term potentiation at CA1 hippocampal synapses. J Neurosci. 2000;20:4446–4451. doi: 10.1523/JNEUROSCI.20-12-04446.2000. [DOI] [PMC free article] [PubMed] [Google Scholar]
- Park M, Penick EC, Edwards JG, Kauer JA, Ehlers MD. Recycling endosomes supply AMPA receptors for LTP. Science. 2004;305:1972–1975. doi: 10.1126/science.1102026. [DOI] [PubMed] [Google Scholar]
- Sabatini BL, Svoboda K. Analysis of calcium channels in single spines using optical fluctuation analysis. Nature. 2000;408:589–593. doi: 10.1038/35046076. [DOI] [PubMed] [Google Scholar]
- Sankaranarayanan S, Ryan TA. Real-time measurements of vesicle-SNARE recycling in synapses of the central nervous system. Nat Cell Biol. 2000;2:197–204. doi: 10.1038/35008615. [DOI] [PubMed] [Google Scholar]
- Sankaranarayanan S, De Angelis D, Rothman JE, Ryan TA. The use of pHluorins for optical measurements of presynaptic activity. Biophys J. 2000;79:2199–2208. doi: 10.1016/S0006-3495(00)76468-X. [DOI] [PMC free article] [PubMed] [Google Scholar]
- Skeberdis VA, Chevaleyre V, Lau CG, Goldberg JH, Pettit DL, Suadicani SO, Lin Y, Bennett MV, Yuste R, Castillo PE, Zukin RS. Protein kinase A regulates calcium permeability of NMDA receptors. Nat Neurosci. 2006;9:501–510. doi: 10.1038/nn1664. [DOI] [PubMed] [Google Scholar]
- Sokal RR, Rohlf FJ. San Francisco: Freeman; 1995. Biometry. [Google Scholar]
- Song I, Huganir RL. Regulation of AMPA receptors during synaptic plasticity. Trends Neurosci. 2002;25:578–588. doi: 10.1016/s0166-2236(02)02270-1. [DOI] [PubMed] [Google Scholar]
- Stevens CF, Wang Y. Changes in reliability of synaptic function as a mechanism for plasticity. Nature. 1994;371:704–707. doi: 10.1038/371704a0. [DOI] [PubMed] [Google Scholar]
- Stricker C, Cowan AI, Field AC, Redman SJ. Analysis of NMDA-independent long-term potentiation induced at CA3-CA1 synapses in rat hippocampus in vitro. J Physiol (Lond) 1999;520:513–525. doi: 10.1111/j.1469-7793.1999.00513.x. [DOI] [PMC free article] [PubMed] [Google Scholar]
- Tao HW, Poo M. Retrograde signaling at central synapses. Proc Natl Acad Sci USA. 2001;98:11009–11015. doi: 10.1073/pnas.191351698. [DOI] [PMC free article] [PubMed] [Google Scholar]
- Voronin LL, Altinbaev RS, Bayazitov IT, Gasparini S, Kasyanov AV, Saviane C, Savtchenko L, Cherubini E. Postsynaptic depolarisation enhances transmitter release and causes the appearance of responses at “silent” synapses in rat hippocampus. Neuroscience. 2004;126:45–59. doi: 10.1016/j.neuroscience.2004.03.026. [DOI] [PubMed] [Google Scholar]
- Watt AJ, Sjostrom PJ, Hausser M, Nelson SB, Turrigiano GG. A proportional but slower NMDA potentiation follows AMPA potentiation in LTP. Nat Neurosci. 2004;7:518–524. doi: 10.1038/nn1220. [DOI] [PubMed] [Google Scholar]
- Whitlock JR, Heynen AJ, Shuler MG, Bear MF. Learning induces long-term potentiation in the hippocampus. Science. 2006;313:1093–1097. doi: 10.1126/science.1128134. [DOI] [PubMed] [Google Scholar]
- Winder DG, Mansuy IM, Osman M, Moallem TM, Kandel ER. Genetic and pharmacological evidence for a novel, intermediate phase of long-term potentiation suppressed by calcineurin. Cell. 1998;92:25–37. doi: 10.1016/s0092-8674(00)80896-x. [DOI] [PubMed] [Google Scholar]
- Xiao MY, Karpefors M, Niu YP, Wigstrom H. The complementary nature of long-term depression and potentiation revealed by dual component excitatory postsynaptic potentials in hippocampal slices from young rats. Neuroscience. 1995;68:625–635. doi: 10.1016/0306-4522(95)00173-g. [DOI] [PubMed] [Google Scholar]
- Yasuda H, Barth AL, Stellwagen D, Malenka RC. A developmental switch in the signaling cascades for LTP induction. Nat Neurosci. 2003a;6:15–16. doi: 10.1038/nn985. [DOI] [PubMed] [Google Scholar]
- Yasuda R, Sabatini BL, Svoboda K. Plasticity of calcium channels in dendritic spines. Nat Neurosci. 2003b;6:948–955. doi: 10.1038/nn1112. [DOI] [PubMed] [Google Scholar]
- Yu TP, McKinney S, Lester HA, Davidson N. Gamma-aminobutyric acid type A receptors modulate cAMP-mediated long-term potentiation and long-term depression at monosynaptic CA3-CA1 synapses. Proc Natl Acad Sci USA. 2001;98:5264–5269. doi: 10.1073/pnas.091093998. [DOI] [PMC free article] [PubMed] [Google Scholar]
- Zakharenko SS, Zablow L, Siegelbaum SA. Visualization of changes in presynaptic function during long-term synaptic plasticity. Nat Neurosci. 2001;4:711–717. doi: 10.1038/89498. [DOI] [PubMed] [Google Scholar]
- Zakharenko SS, Patterson SL, Dragatsis I, Zeitlin SO, Siegelbaum SA, Kandel ER, Morozov A. Presynaptic BDNF required for a presynaptic but not postsynaptic component of LTP at hippocampal CA1-CA3 synapses. Neuron. 2003;39:975–990. doi: 10.1016/s0896-6273(03)00543-9. [DOI] [PubMed] [Google Scholar]