

Abstract
Steroid sex hormones induce dramatic seasonal changes in reproductive related behaviors and their underlying neural substrates in seasonally breeding vertebrates. For example, in adult white-crowned sparrows, increased Spring photoperiod raises circulating testosterone, causing morphological and electrophysiological changes in song-control nuclei, which modify song behavior for the breeding season. We investigated how photoperiod and steroid hormones induce these changes in morphology, electrophysiology, and behavior. Neurons in a song premotor nucleus, the robust nucleus of the arcopallium (RA), show increased intrinsic spontaneous firing rate and soma size when birds are in breeding condition. Using combinations of systemic and unilateral local intracerebral hormonal manipulations, we show that long-day photoperiod accelerates the effects of systemic testosterone on RA neurons via the estradiol-synthesizing enzyme aromatase (CYP19A1); these changes require inputs from the afferent song control nucleus HVC (used as a proper name) and steroid receptor activation within HVC; local coactivation of androgen and estrogen receptors (ARs and ERs, respectively) within HVC, but not RA, is sufficient to cause neuronal changes in RA; activation of ARs in RA is also permissive. Using bilateral local intracerebral hormone-receptor blockade, we found that ARs and ERs in the song-control nucleus HVC mediate systemic testosterone-induced changes in song stereotypy but not rate. This novel transsynaptic effect of gonadal steroids on activity and morphology of RA neurons is part of a concerted change in key premotor nuclei, enabling stereotyped song.
Keywords: androgen, estrogen, testosterone, electrophysiology, birdsong, seasonal plasticity
Introduction
Steroid sex hormones modulate both the electrophysiological and morphological properties of adult neurons, but how these changes directly modify behavior is unclear. Seasonally breeding species are useful model systems for studying hormone effects in behaviorally relevant circuits in adult animals (Tramontin and Brenowitz, 2000). In such species, the brain nuclei that control behaviors related to reproduction change dramatically in both structure and electrophysiology with each breeding season. These changes are mediated primarily by steroid sex hormones; longer-day lengths trigger an increase in plasma testosterone (T) level (Brenowitz, 2004). Although seasonal plasticity is found in all vertebrate classes, songbirds provide a particularly useful model system for studying seasonal hormone-driven changes in a behaviorally relevant circuit.
Songbirds provide several advantages. Song is a learned behavior with known function (Marler and Slabbekoorn, 2004) that is mediated through discrete neural circuits (see Fig. 1A). Song learning, adult song behavior, and the underlying neural circuit are sensitive to sex steroids, and steroid receptors or their mRNA are present in all of the major song nuclei (see Fig. 1A) (Arnold et al., 1976; Gahr et al., 1993; Nastiuk and Clayton, 1995; Smith et al., 1996; Bernard et al., 1999; Metzdorf et al., 1999; Soma et al., 1999b; Fusani et al., 2000; Kim et al., 2004). In seasonally breeding songbirds, there are pronounced hormone-driven seasonal changes in volume and neural morphology of song nuclei, which are accompanied by changes in stereotypy, duration, and production rate of song (Nottebohm, 1981; Tramontin and Brenowitz, 2000; Ball et al., 2004; Brenowitz, 2004). Only recently have seasonal changes in avian neuronal activity begun to be studied, with research generally focusing on how auditory stimuli are differentially processed (Del Negro and Edeline, 2002; Lucas et al., 2002, 2007; Del Negro et al., 2005) or on how changes in the electrophysiological properties of song nuclei might underlie changes in song behavior (Park et al., 2005; Meitzen et al., 2007).
Figure 1.

A, Simplified schematic of the avian song control system showing the distribution of steroid receptors. HVC and RA are in the main descending motor circuit. RA projects to the brainstem motoneurons that control the muscles involved with respiration and the sound production organ, the syrinx. HVC, X, DLM, and LMAN comprise the anterior forebrain pathway (AFP), which is necessary for song learning. DLM, Medial portion of the dorsolateral nucleus of the anterior thalamus; LMAN, lateral magnocellular nucleus of anterior nidopallium; RA, robust nucleus of the arcopallium; X, Area X, a subdivision of the medial striatum. B, Top, Representative extracellular recordings. An isolated unit from an LD photoperiod and systemic T-treated bird is shown on the left. An isolated unit from an SD photoperiod-treated bird is shown on the right. Bottom, Representative Nissl-stained RA cells from an LD photoperiod and systemic T-treated animal (on left) and a SD photoperiod-treated animal (on right). Scale bar, 5 μm. C, Representative HVC lesion. Arrows indicate the border of remaining HVC. The plane is parasagittal, and anterior is to the right. Scale bar, 500 μm. D, Representative cannula track near HVC. Arrows denote the border of HVC. The plane is coronal, and lateral is to the right. Scale bar, 500 μm.
We focus on how steroid hormones act on the telencephalic song nucleus HVC (used as a proper name) (Reiner et al., 2004) to induce changes in song behavior and the intrinsic spontaneous activity of neurons in the robust nucleus of the arcopallium (RA), a premotor nucleus efferent to HVC. RA occupies an important place in the motor circuit for song production (see Fig. 1A), its cellular physiology has been well described (Mooney 1992; Spiro et al., 1999), and it exhibits dramatic seasonal plasticity in intrinsic activity, nucleus volume, neuron soma size, dendritic arbors, neuronal spacing, NMDA receptor subunit composition, and metabolic activity (Hill and DeVoogd, 1991; Singh et al., 2003; Brenowitz, 2004; Park et al., 2005; Meitzen et al., 2007).
We show that coactivation of androgen and estrogen receptors (ARs and ERs, respectively) in HVC induces changes in RA intrinsic spontaneous activity and morphology and that direct activation of androgen receptors in RA is permissive for these changes to occur. A long-day photoperiod typical of the breeding season decreases the time required for T to induce changes in RA by increasing the metabolism of T to 17β-estradiol (E2). Finally, activation of androgen and estrogen receptors in HVC is necessary for T-induced changes in song stereotypy but not song rate.
Materials and Methods
Animals
The Institutional Animal Care and Use Committee at the University of Washington approved all procedures used in this study. We collected 79 adult male Gambel's white-crowned sparrows (Zonotrichia leucophrys gambelii) in Eastern Washington during each autumnal migration from 2003–2006. These birds were housed in outdoor aviaries for up to 30 weeks before being placed in indoor aviaries. They were maintained indoors on a short-day photoperiod (SD) (8 h light, 16 h dark) for at least 10 weeks before use to ensure that they were photosensitive and therefore responsive to steroids and long-day photoperiod (LD) (20 h light, 4 h dark) typical of their Alaskan breeding grounds. Birds kept on SD maintain regressed testes, song nuclei, RA intrinsic activity, and basal levels of T typical of the nonbreeding season. Food and water were available ad libitum throughout the experiment. Birds were individually housed in indoor cages and could see and hear the other birds housed in the same room.
Systemic hormone and photoperiod manipulations
Some birds were implanted subcutaneously with single capsules of steroid hormones and either shifted to LD or kept on SD photoperiod. Steroid implants were made from SILASTIC tubing “inner diameter (i.d.), 1.0 mm; outer diameter (o.d.), 2.0 mm; length, 12 mm; VWR, West Chester, PA)” filled with crystalline 17-β estradiol, or testosterone, as in the study by Tramontin et al. (2003). Some birds received two subcutaneous SILASTIC implants (i.d., 1.0 mm; o.d., 2.0 mm; length, 9 mm) of the aromatase inhibitor 1–4-6-androstatrien-3,17-dione (ATD; Sigma, St. Louis, MO) as in the study by Moore et al. (2004). The implants were rinsed with ethanol and soaked overnight in 0.1 m PBS before implantation. Birds housed on LD were implanted with T, because exposure of wild-caught birds to LD alone in the laboratory does not elevate circulating T levels into the physiological breeding range of 4–25 ng/ml observed in wild Gambel's white-crowned sparrows (Wingfield and Farner, 1978; Wingfield and Moore, 1987; Smith et al., 1995). All other groups were maintained on SD to mimic conditions in their winter range. Birds maintained on SD were not castrated before implantation, because they have regressed testes that have been shown not to secrete significant levels of T (Smith et al., 1995; Tramontin et al., 2000). We note that circulating steroid hormone levels are not necessarily identical to those in the brain parenchyma because of local neurosteroid synthesis (Schlinger and London, 2006).
Time course experiment methods
To explore the effects of photoperiod, we investigated the time course of the change from low to high firing rates induced by systemic T under conditions of LD and SD. We treated 28 birds systemically with T and exposed 14 of them to LD and 9 to SD. Five birds were killed immediately (0 d time point). Five birds exposed to SD and systemic T were killed on day 21 and four on day 42. The SD and systemic T day 21 data in this study (Fig. 2A1,2,3) are from the study by Park et al. (2005, their Tables 2 and 3) (n = 35 units obtained from five birds; average spontaneous firing rate, 1.7 ± 0.2 Hz; average soma area, 91.6 ± 6.4 μm2). We killed three birds exposed to LD photoperiod and systemic T on day 4, three on day 11, three on day 14, and five on day 21.
Figure 2.

Photoperiod modulates the time course of a T-induced increase in firing rate and neuronal growth in RA. A1–A3, Response to systemic T under LD photoperiod. B1–B3, Response to systemic T under SD photoperiod. Different letters indicate significant differences between treatment groups. A1, B1, Spontaneous firing rate (mean ± SEM). A2, B2, Cumulative frequency distributions of firing rates (see Results for statistical significance). A3, B3, Soma area (mean ± SEM).
Table 2.
Song structure and variability measures
| Vehicle |
AR and ER antagonists |
|||
|---|---|---|---|---|
| Day 13 (n = 6) | Day 20 (n = 7) | Day 13 (n = 7) | Day 20 (n = 7) | |
| Whole song duration (s) | ||||
| Mean | 1.84 ± 0.13 | 1.95 ± 0.09 | 1.75 ± 0.13 | 1.83 ± 0.10 |
| CV | 17.27 ± 4.70a | 7.95 ± 0.32b,1 | 16.79 ± 5.17a | 20.16 ± 6.44a,2 |
| Whistle duration (s) | ||||
| Mean | 0.43 ± 0.05 | 0.51 ± 0.05 | 0.47 ± 0.03 | 0.49 ± 0.02 |
| CV | 24.53 ± 7.81a | 15.44 ± 4.66a,1 | 17.98 ± 3.57a | 16.33 ± 7.77a,1 |
| Warble duration (s) | ||||
| Mean | 0.33 ± 0.06 | 0.39 ± 0.04 | 0.39 ± 0.02 | 0.39 ± 0.03 |
| CV | 17.78 ± 3.27a | 10.73 ± 2.31b,1 | 9.57 ± 3.52a | 10.00 ± 2.74a,1 |
| First buzz duration (s) | ||||
| Mean | 0.21 ± 0.02 | 0.22 ± 0.03 | 0.26 ± 0.02 | 0.29 ± 0.01 |
| CV | 20.26 ± 5.29a | 11.20 ± 1.39b,1 | 14.84 ± 3.46a | 10.35 ± 2.65a,1 |
| Second buzz duration (s) | ||||
| Mean | 0.28 ± 0.01 | 0.32 ± 0.03 | 0.36 ± 0.05 | 0.35 ± 0.03 |
| CV | 14.15 ± 3.05a | 7.53 ± 1.09b,1 | 8.76 ± 0.99a | 13.25 ± 4.19a,1 |
| Third buzz duration (s) | ||||
| Mean | 0.39 ± 0.03 | 0.37 ± 0.01 | 0.37 ± 0.03 | 0.39 ± 0.02 |
| CV | 20.19 ± 4.63a | 14.22 ± 3.18a,1 | 16.62 ± 5.19a | 15.69 ± 1.52a,1 |
| Whistle minimum frequency (kHz) | ||||
| Mean | 3.24 ± 0.18 | 3.26 ± 0.17 | 3.76 ± 0.24 | 3.79 ± 0.24 |
| CV | 4.32 ± 1.61a | 2.14 ± 0.29a,1 | 3.27 ± 0.44a | 4.82 ± 1.93a,1 |
| Whistle maximum frequency (kHz) | ||||
| Mean | 3.75 ± 0.15 | 3.73 ± 0.17 | 4.22 ± 0.24 | 4.25 ± 0.26 |
| CV | 2.21 ± 0.50a | 1.75 ± 0.32a,1 | 5.17 ± 1.86a | 2.61 ± 0.47a,1 |
| Warble minimum frequency (kHz) | ||||
| Mean | 2.81 ± 0.11 | 2.84 ± 0.14 | 3.08 ± 0.17 | 3.12 ± 0.20 |
| CV | 10.30 ± 2.95a | 3.27 ± 0.84b,1 | 4.90 ± 0.69a | 5.02 ± 1.57a,2 |
| Warble maximum frequency (kHz) | ||||
| Mean | 4.68 ± 0.25 | 5.14 ± 0.29 | 5.11 ± 0.32 | 5.62 ± 0.43 |
| CV | 5.49 ± 1.56a | 2.25 ± 0.59b,1 | 4.09 ± 0.84a | 4.35 ± 1.14a,1 |
| First buzz minimum frequency (kHz) | ||||
| Mean | 4.08 ± 0.12 | 4.19 ± 0.07 | 4.08 ± 0.03 | 4.25 ± 0.10 |
| CV | 5.95 ± 1.20a | 3.98 ± 0.80b,1 | 6.44 ± 0.65a | 4.47 ± 0.79a,2 |
| First buzz maximum frequency (kHz) | ||||
| Mean | 6.10 ± 0.17 | 6.17 ± 0.14 | 5.97 ± 0.11 | 5.96 ± 0.18 |
| CV | 4.83 ± 0.85a | 2.45 ± 0.28a,1 | 5.02 ± 0.63a | 5.04 ± 1.11a,1 |
| Second buzz minimum frequency (kHz) | ||||
| Mean | 3.91 ± 0.14 | 3.83 ± 0.27 | 3.35 ± 0.36 | 3.52 ± 0.36 |
| CV | 5.27 ± 0.70a | 3.98 ± 0.80a,1 | 5.44 ± 1.12a | 4.35 ± 1.14a,1 |
| Second buzz maximum frequency (kHz) | ||||
| Mean | 5.20 ± 0.09 | 5.17 ± 0.09 | 5.45 ± 0.23 | 5.41 ± 0.09 |
| CV | 3.64 ± 0.70a | 2.39 ± 0.46b,1 | 5.70 ± 1.31a | 7.29 ± 3.07a,1 |
| Third buzz minimum frequency (kHz) | ||||
| Mean | 2.00 ± 0.12 | 2.00 ± 0.14 | 2.37 ± 0.11 | 2.29 ± 0.13 |
| CV | 6.90 ± 2.24a | 4.07 ± 0.73a,1 | 5.39 ± 2.03a | 5.52 ± 0.98a,1 |
| Third buzz maximum frequency (kHz) | ||||
| Mean | 4.86 ± 0.57 | 5.22 ± 0.75 | 4.87 ± 0.55 | 5.67 ± 0.82 |
| CV | 7.74 ± 2.23a | 4.33 ± 0.71a,1 | 6.02 ± 0.78a | 9.80 ± 3.61a,1 |
All values are mean ± SEM. CV = “SD/mean” × 100. Different superscript letters denote significant differences between days 13 and 20 within a treatment group, whereas different superscript numbers indicate significant differences between treatment groups at day 20. Mean values did not significantly differ.
HVC lesion surgery
Methods for lesioning HVC were as described by Brenowitz and Lent (2001). Briefly, the bird was anesthetized using isoflurane (1-chloro-2, 2, 2-trifluoroethyl difluoromethyl ether) (Hospira, Lake Forest, IL). HVC was lesioned unilaterally with 1% racemic N-methylaspartate (NMA) in PBS, pH 7.4 (Sigma-Aldrich, St. Louis, MO). We made lesions in both the rostral main corpus and caudomedial extension of HVC at the following stereotaxic coordinates (relative to the intersection of the midsagittal and transverse sinuses and the brain surface, with the intersection of the sinuses aligned with the center of the ear bars of the stereotaxic device): anteroposterior, 0.0 mm (rostral) and 0.3 mm (caudal); mediolateral, 1.8 mm (caudal) and 2.8 mm (rostral); and depth, 0.5 and 0.7 mm (rostral) and 0.65 mm (caudal). We injected 800 nl of racemic NMA at each depth for the rostral site and at the single caudal site using a customized pressure delivery system. We alternated lesions between the left and right HVC in successive birds. Beginning immediately after the lesion surgery, we exposed each bird to LD photoperiod and systemic T for 21 d, at which time we killed the bird and prepared brain slices for recording.
At the end of the recording session, we fixed, resectioned, and stained with cresyl violet each slice containing HVC or lesion damage as described below (see Brain histology and morphometry). We verified the extent of the lesion using previously published techniques (Brenowitz and Lent, 2001). To summarize, we projected a magnified image of each section containing HVC and traced onto paper the Nissl-defined borders of contralateral and ipsilateral (if any) HVC. The borders of song nuclei as defined by Nissl-stain coincide with the borders as defined by other labels (for review, see Tramontin and Brenowitz, 2000). We digitized these tracings using a scanner and estimated the volumes of unlesioned HVC and remaining lesioned HVC as in the study by Brenowitz and Lent (2001). We divided the volume of the remaining lesioned HVC (if any) by that of the contralateral unlesioned HVC, and this yielded the percentage of HVC lesioned. Previous studies have reported no differences between left and right HVC volumes in intact white-crowned sparrows (for review, see Brenowitz and Lent, 2001). The lesion eliminated 88–100% of HVC compared with the intact side, with the average portion of HVC lesioned being 95 ± 5% (see Fig. 1C).
Osmotic pump and intracerebral infusions surgery
Some birds were implanted under anesthesia with an osmotic pump (Alzet, Cupertino, CA) (length, 17 mm; diameter, 6 mm; filled weight, 0.5 g; model 1002, 14 d delivery, or 1007D, 7 d delivery) filled with 100 μl of dihidrotestostrone (DHT) and E2 “0.01 mg/ml each of DHT and E2, dissolved in dimethyl sulfoxide (DMSO; Fisher Scientific, Pittsburgh, PA) and 1,2-propanediol (Sigma)” or the AR antagonist flutamide (Sigma) (0.05 mg/100 μl dissolved in carbowax-polyethylene glycol-PEG 300; Electron Microscopy Services, Fort Washington, PA), or a combination of flutamide (concentration same as above) and the ER antagonist faslodex (also known as ICI 182,780; Tocris Bioscience, Ellisville, MO) (0.03 mg/100 μl; dissolved in DMSO and PEG300). We used DHT and E2 instead of T to directly and selectively activate ARs and ERs, and because the efficiency of T metabolism to DHT and/or E2 may vary with photoperiod (Soma et al., 1999a, 2003; Riters et al., 2001; Forlano et al., 2006). We used plastic tubing (Scientific Commodities, Lake Havasu City, AZ) (85 durometer vinyl; 0.068 mm i.d.; 0.1143 mm o.d.) to connect the pump to a cannula inserted either adjacent to the rostrolateral border of HVC (anteroposterior, 0.0 mm; mediolateral, 3 mm; depth, 0.7 mm) or near the dorsocaudal border of RA (anteroposterior, 2.25 mm; mediolateral, 3.35; depth, 2.35 mm). We alternated cannula placement between the left and right hemispheres in successive birds in each group that received unilateral infusions. Later histological inspection showed that the distance between the terminus of all cannula tracks and the nearest edge of the target nucleus was within 1.05 mm (mean ± SEM distance to HVC: 0.68 ± 0.04 mm, range, 0.30–1.00 mm; to RA: 0.66 ± 0.11 mm, range, 0.15–1.05 mm) and did not differ between groups (p > 0.05; ANOVA). The positive results of the manipulations that we report below demonstrate that locally infused steroid hormones reached the intended target nucleus at effective concentrations. Also, steroid hormones are lipophilic and thus readily diffuse through brain tissue. We further enhanced steroid hormone diffusion by dissolving them in DMSO, a polar solvent.
We placed each cannula near but not into HVC and RA to avoid damaging the nuclei. Locally infused hormones or their antagonists likely did not produce the results we report by acting on ERs or ARs outside of HVC or RA. In white-crowned sparrows, ARs are expressed in HVC and RA but not in the surrounding nidopallium and arcopallium (Smith et al., 1996; Soma et al., 1999b). Similarly, ERα are expressed in HVC (including the caudomedial portion) but are not found in the surrounding nidopallium in every songbird species studied to date, including white-crowned sparrows (Gahr et al., 1993; Bernard et al., 1999; Metzdorf et al., 1999; Fusani et al., 2000); ERβ mRNA has been found in caudomedial nidopallium of starlings but is not present in the song nuclei (Bernard et al., 1999). Unlike some songbird species, ERs are expressed only sparsely in the arcopallium dorsal to RA in white-crowned sparrows (Gahr et al., 1993).
Because we infused HVC and/or RA for 21 d, on day 14, we replaced the model 1002 pump with a model 1007D pump, which released the same volume of solution over 7 d. To replace the pump, we cut the tube attached to the cannula, inserted a tubing coupler made from the shaft of a 22 gauge needle, and glued it to the tube of the new pump using cyanoacrylate adhesive (Loctite 454; Alzet). We compensated for the difference in release rate between pump models 1002 and 1007D to ensure that the final concentration of hormone delivered by the cannula was identical.
Some pumps were implanted subcutaneously as in previous studies (Soma et al., 2004; Thompson and Brenowitz, 2005). Other pumps were placed in a custom built backpack strapped to the bird's back using a harness made from surgical dressing. To mount the osmotic pump in the backpack, we used a 0.65 ml plastic microcentrifuge tube (ISC BioExpress, Kaysville, UT) and ground its top to a smooth surface. Using an 18 gauge needle, we made a hole in its cap. We filled the tube with 250 μl of sterile avian saline. We threaded the output tube of the pump through the hole in the cap and inserted the pump snugly into the microcentrifuge tube until the lid snapped into place. We sealed the lid and tube extrusion hole using cyanoacrylate adhesive and Parafilm (Fisher Scientific). We placed the holder under a harness made from tubular elastic surgical dressing retainer size 2 (Surgilast; Western Medical, Princeton, NJ) that had been trimmed to the appropriate size, dipped in a water-diluted solution of Elmer's glue to reduce fraying, allowed to dry overnight, and stretched. We cut holes through which the wings fit. The microcentrifuge tube was secured to the harness using two sutures, at the top and bottom of the tube. Pilot experiments showed that this arrangement kept the pump at its proper operating temperature (37°C), and that the pump retained saline throughout the entire release period. Most importantly, the positive results reported in this study demonstrate that the harness arrangement worked. This arrangement is less invasive compared with the subcutaneous implantation technique.
Electrophysiology
Preparation of brain slices.
Methods for preparing slices have been described previously (Park et al., 2005). Briefly, each animal was anesthetized with isoflurane and killed by decapitation, and the brain was dissected rapidly into ice-cold, oxygenated artificial CSF (ACSF) containing the following (in mm): 119 NaCl, 2.5 KCl, 1.3 MgSO4, 2.5 CaCl2, 1 NaH2PO4, 16.2 NaHCO3, 11 d-glucose, and 10 HEPES, osmolarity adjusted to 310–320 mOsm with sucrose. Parasagittal or coronal brain slices (300 μm thick) were prepared using a Vibratome (Vibratome, St. Louis, MO), and slices were stored at room temperature submerged in bubbled ACSF in which HEPES was replaced with equiosmolar NaHCO3. All chemicals were obtained from Sigma-Aldrich (St. Louis, MO).
Electrophysiological recording.
Recording methods have been described previously (Park et al., 2005; Solis and Perkel, 2006; Meitzen et al., 2007). We allowed the slices to rest for 1 h after collection before recording. Recordings were conducted blind as to hemisphere. For recording, a slice was submerged in a small chamber perfused with ACSF maintained at 30°C and containing 150 μm picrotoxin (Sigma) to block inhibitory GABAA receptors. Glutamate receptor antagonists do not affect spontaneous firing rate in RA (Park et al., 2005; Solis and Perkel, 2006). Single-unit extracellular recordings were obtained from neurons within a region that could be reliably identified as RA using transillumination. Only well-isolated spikes with high signal-to-noise ratios were studied (see Fig. 1B). Recording electrodes were made from pulled borosilicate glass pipettes (World Precision Instruments, Sarasota, FL) with tips broken to a resistance of 4–10 MΩ and filled with 0.9% NaCl. Extracellular potentials were amplified 10 times using an Axoclamp 2B amplifier (Molecular Devices, Foster City, CA) and amplified an additional 100 times using a Brownlee model 410 amplifier (Brownlee Precision, Santa Clara, CA). The filtered signals (low-pass filtered at 3 kHz) were then digitized at 20 kHz with either a National Instruments (Austin, TX) digitizing board and stored on a personal computer using a custom data acquisition program written in LabView (National Instruments) by Michael A. Farries and David J. Perkel or digitized with a Digidata 1322A (Molecular Devices) and stored on a personal computer using pClamp 9 (Molecular Devices).
Data analysis.
Data analysis methods have been described previously (Park et al., 2005; Solis and Perkel, 2006; Meitzen et al., 2007). Briefly, spontaneous spike trains were analyzed off-line using a custom written program in IGOR (Wavemetrics, Lake Oswego, OR) by Michele M. Solis and David J. Perkel, and with pClamp9 (Molecular Devices). To ensure that spike events were single units, we analyzed the spike amplitude, waveform, and time derivative. We measured spontaneous activity for at least 5 min and calculated the firing rate by dividing the number of spikes observed by the duration of the recording.
Brain histology and morphometry
At the end of the recording session, we fixed each slice overnight in 4% paraformaldehyde solution in 0.1 m PB at 4°C. The slices were then briefly washed with 0.1 m PB, cryoprotected in 30% sucrose in 0.1 m PB, and resectioned to a thickness of 50 μm using a freezing microtome. We mounted sections on slides and stained them with cresyl violet (see Fig. 1B). We measured the area of 100 neuronal somata in RA, using the random systematic sampling method described by Tramontin et al. (1998). Measurements were made blind to treatment group. Neurons were distinguished from glia by having one round nucleolus, a well-defined nuclear envelope, nongranular cytoplasm, and/or an obvious axon hillock (Goldman and Nottebohm, 1983; Smith et al., 1995, 1997; Tramontin et al., 1998). For additional discussion, see the study by Park et al. (2005).
Song behavior
To analyze song behavior, we individually housed birds in sound isolation chambers (Industrial Acoustics, Bronx, NY) immediately after surgery (day 0) and continually recorded their vocalizations using Syrinx software (John Burt, www.syrinxpc.com). We measured the rate of song production by counting the total number of songs per day. We assessed song variability (the inverse of song stereotypy) on days 13 and 20 after the start of hormone infusion using the protocol described by Tramontin et al. (2000). Briefly, we digitized songs from each bird using Syrinx and measured 16 different temporal and spectral attributes of song (see Fig. 7, Table 2) (Tramontin et al., 2000). To determine whether groups differed in the stereotypy of the song attributes, we compared coefficients of variation (CV = “SD/mean” × 100) between treatment groups. We converted CV to units of percentage to facilitate comparisons. For each song attribute, we calculated the mean value for each bird. We calculated mean values for all song attributes by averaging across birds to create a group mean for each song attribute and by averaging each bird's 16 attributes together to acquire an overall mean for that bird.
Figure 7.

Androgen and estrogen receptors in HVC are necessary for LD photoperiod plus systemic T-induced changes in song stereotypy. A, Representative examples of stereotyped white-crowned sparrow song. All three songs were sequentially recorded on the same day. The average CV (higher CV indicates lower stereotypy; CV = “SD/mean” × 100) of the three songs is 3.77. B, Representative examples of less stereotyped song. All three songs were sequentially recorded on the same day, and their average CV is 7.22. C, Comparison of mean day 20 CVs between AR plus ER antagonist-treated birds and vehicle-treated birds. Each point represents the mean CV of one of the 16 song characteristics measured across seven birds. The dotted line is the unity line; all points above the line show less stereotypy in birds treated with antagonists compared with vehicle. Song was significantly more stereotyped on day 20 in birds exposed to vehicle compared with birds exposed to AR plus ER antagonists (p = 0.02). D, Comparison of mean CVs between days 13 and 20 in both vehicle and AR plus ER antagonist-treated birds. Song stereotypy significantly increased between days 13 and 20 in birds treated with vehicle (p < 0.0003), whereas stereotypy between days 13 and 20 in AR plus ER antagonist-treated birds did not significantly differ (p > 0.05). E, Song stereotypy on day 20 instead analyzed by calculating a mean CV for each bird. The horizontal line indicates the mean. F, Comparison of mean CVs for each bird between days 13 and 20. Song stereotypy significantly increased between days 13 and 20 in birds treated with vehicle (p < 0.0007); stereotypy in AR plus ER antagonist-treated birds did not differ (p > 0.05).
Hormone assay
On the day of each electrophysiological recording, we collected blood from each subject into a heparinized microhematocrit tube and stored it on ice until centrifugation (within 1 h). Plasma was harvested and stored at −20°C for subsequent steroid radioimmunoassay (RIA). To measure circulating T, we followed the RIA protocol of Tramontin et al. (2001), using a Coat-a-Count RIA kit (Diagnostic Products, Los Angeles, CA). Because of a T assay failure, three samples were lost: one each from the Day 14, LD+T; HVC Lesion, LD+T; and FLUT near RA, LD+T groups (Table 1). For some steroid infusion groups described in Table 1, we measured DHT, E2, and T from the same blood samples, following the procedures of Wingfield et al. (1991). DHT, E2, and T fractions were isolated by column chromatography, and plasma hormone concentrations were corrected for individual extraction efficiency. Detection limits for the assay depended on the plasma volume used and the individual extraction efficiency (DHT, ∼0.15 ng/ml; T, ∼0.04 ng/ml; E2, ∼0.07 ng/ml). The samples were run in single assays with the following intra-assay variations: DHT, 3.0%; T, 15.0%; E2, 13.0%.
Table 1.
Plasma hormone levels
| Treatment group | Number | Hormone measured (ng/ml) |
||
|---|---|---|---|---|
| T | DHT | E2 | ||
| Day 0, SD + T | 5 | 0.09 ± 0.01 | NM | NM |
| Day 21, SD + T | 5 | 9.62 ± 1.75 | NM | NM |
| Day 42, SD + T | 4 | 9.15 ± 0.77 | NM | NM |
| Day 0, LD + T | 5 | 0.09 ± 0.01 | NM | NM |
| Day 4, LD + T | 3 | 7.21 ± 0.81 | NM | NM |
| Day 11, LD + T | 3 | 4.78 ± 0.56 | NM | NM |
| Day 14, LD + T | 2 | 14.27 ± 0.76 | NM | NM |
| Day 21, LD + T | 5 | 11.45 ± 1.28 | NM | NM |
| SD | 5 | 0.09 ± 0.01 | NM | NM |
| LD + T | 5 | 11.45 ± 1.28 | NM | NM |
| SD + T+E2 | 4 | 3.41 ± 0.47 | 1.00 ± 0.27 | 3.53 ± 2.55 |
| LD + T + ATD | 4 | 6.34 ± 2.21 | 1.73 ± 0.57 | 0.44 ± 0.06 |
| HVC lesion, LD + T | 3 | 11.63 ± 2.52 | NM | NM |
| FAS + FLUT near HVC, LD + T | 4 | 8.46 ± 1.38 | NM | NM |
| DHT + E2 near HVC, SD | 4 | 0.18 ± 0.08 | 0.20 ± 0.06 | 0.58 ± 0.17 |
| DHT + E2 near RA, SD | 4 | 0.09 ± 0.05 | 0.13 ± 0.02 | 0.31 ± 0.10 |
| FLUT near RA, LD + T | 4 | 4.44 ± 0.71 | NM | NM |
| Bilat FAS + FLUT near HVC, LD + T | 7 | 13.74 ± 1.74 | NM | NM |
| Bilat vehicle near HVC, LD + T | 7 | 14.97 ± 0.85 | NM | NM |
Values are mean ± SEM. The number column reports the number of animals. NM, Value not measured.
Statistics
We used one-way ANOVA for group comparisons. When ANOVAs yielded significant results, we made pairwise comparisons using Tukey's or Dunnett's post hoc test. The nonparametric Kolmogorov–Smirnov two-sample test (K-S test) was used for comparison of cumulative frequency distributions between selected groups. An α level of 0.05 was used. For analyzing hemispheric differences in firing rate and soma area, we used one-tailed paired t tests. We used one-tailed tests, because we tested the directional hypotheses that steroid hormones infused near HVC or RA would increase ipsilateral firing rate and soma area, conversely, or, that a lesion or steroid receptor antagonist would decrease ipsilateral firing rate and soma area (Brenowitz and Lent 2001, 2002). A two-way repeated measures ANOVA with Bonferroni post hoc tests was used to analyze song rate. CV values for song attributes averaged across birds were not normally distributed, so we tested for statistical significance using a Mann–Whitney U test or Wilcoxon signed rank test as appropriate. CV values were also analyzed by calculating a mean CV for each bird; the resulting distributions pass a normality test, and we therefore used t tests.
Results
We recorded 708 single units from 65 male white-crowned sparrows. RA units were spontaneously active in vitro (Fig. 1B), as previously described in zebra finches (Mooney, 1992; Spiro et al., 1999; Solis and Perkel, 2006), song sparrows (Meitzen et al., 2007), towhees (Meitzen et al., 2007), and white-crowned sparrows (Park et al., 2005). To ensure that spontaneous activity was an intrinsic property of recorded neurons, the bath contained the GABAA receptor antagonist picrotoxin (150 μm), and previous studies show that application of glutamate receptor antagonists does not significantly affect in vitro spontaneous firing rate (Park et al., 2005; Solis and Perkel, 2006). Additionally, the in vitro brain slice preparation removed most excitatory afferents to RA, and neurons in LMAN (Bottjer et al., 1998) and RA-projecting neurons in the nucleus HVC are not spontaneous active in the in vitro brain slice preparation (Dutar et al., 1998).
Plasma hormone levels
SILASTIC steroid pellets implanted systemically significantly increased plasma levels of steroid hormones (Table 1) (p < 0.001). Testosterone implants significantly increased plasma steroid levels into the physiological breeding range (Table 1) (Wingfield and Farner, 1978). T levels were basal in the groups that did not receive systemic T implants. For example, the HVC lesion group had elevated T, because they received systemic T implants, whereas the HVC DHT (dihidrotestostrone) + E2 (estradiol) group had basal T, because they did not receive systemic T implants (Table 1). In birds implanted systemically with E2, plasma E2 levels were high and likely above physiological breeding range for males (Table 1) (for additional discussion, see Tramontin et al., 2003). Birds systemically implanted with the estrogen-synthesis inhibitor ATD had very low levels of E2 (Smith et al., 1997b; Tramontin et al., 2003). Circulating levels of DHT and E2 were very low in birds that received only intracerebral hormone infusions, which shows that the infused hormones did not enter the peripheral circulation in significant levels (Table 1).
Time course of firing rate increase is faster in LD than SD photoperiod
LD photoperiod accelerated the time course of the systemic T-induced increase in firing rate compared with SD photoperiod. LD photoperiod and systemic T significantly increased spontaneous firing rate above day 0 at day 21 (Fig. 2A1) (p < 0.001) but not at days 4, 11, or 14 (Fig. 2A1) (p > 0.05). Changes may have begun earlier, however, as the mean firing rate at day 14 was not significantly different from that at day 21 (Fig. 2A1) (p > 0.05), unlike day 0 (p < 0.001), day 4 (p < 0.01), and day 11 (p < 0.05). Similarly, by day 11, the cumulative distribution was already significantly different from that of day 0 (Fig. 2A2) (p < 0.01). In contrast, it was not until day 42 that the mean firing rate of birds exposed to SD photoperiod and systemic T significantly increased above the day 0 (Fig. 2B1) (p < 0.05) and day 21 time points (Fig. 2B1) (p < 0.01). The SD and systemic T cumulative distributions did not differ significantly from day 0 until day 42 (Fig. 2B2) (p < 0.01). The day 42 SD and systemic T firing rates and the day 21 LD and systemic T rates were not significantly different (t test; p > 0.05). These results indicate that LD photoperiod accelerated the T-induced increase in spontaneous firing rates in RA.
The time course of growth of RA neuron size generally paralleled that of the increase in firing rate. Like the firing rate, the mean soma area of birds exposed to LD photoperiod and systemic T was not significantly increased from day 0 at days 4, 11, or 14 (Fig. 2A3) (p > 0.05) but was significantly increased by day 21 (p < 0.05). In birds exposed to SD photoperiod and systemic T, the change in mean soma area was also similar to that of firing rate, with mean soma area not being significantly increased from day 0 or 21 until day 42 (Fig. 2B3) (p < 0.01). Together, these data show that LD photoperiod accelerated the T-induced increase in both RA soma area and spontaneous firing rate.
Faster increase in firing rate with LD than SD requires estrogen synthesis
The more rapid increase in firing rate seen in LD photoperiod may reflect increased metabolism of T to its estrogenic metabolite E2 in the forebrain (Soma et al., 1999a; Riters et al., 2001; Soma et al., 2003; Forlano et al., 2006). To test this hypothesis, we manipulated photoperiod and systemically exposed birds to different combinations of T, E2, and the estrogen synthesis inhibitor ATD for 3 weeks. Note that in the following studies, we compare the results to groups labeled SD, SD+T, and LD+T. The SD group is made up of nonbreeding condition birds identical to the Day 0 group above; the SD+T group is identical to SD+T, Day 21; and the LD+T group is identical to the LD+T, Day 21 group.
E2 accelerates the time course of the SD photoperiod and systemic T-induced firing rate increase
We first exposed birds to SD photoperiod and systemic implants of T and E2 for 3 weeks. If SD photoperiod reduces E2 availability, then we would expect the combination of systemic T and E2 to increase firing rate and soma area over 21 d in SD birds, especially because neither systemic T nor E2 alone increases firing rate (Park et al., 2005). Systemic T and E2, when combined with SD photoperiod, significantly increased spontaneous firing rate over 21 d compared with SD with no hormone exposure (Fig. 3A) (p < 0.001) and SD plus systemic T (p < 0.001). The firing rates of birds exposed to SD photoperiod and systemic T and E2 for 21 d were not significantly different from those exposed to LD and systemic T (p > 0.05). The cumulative distributions replicated this result, with SD photoperiod and systemic T and E2 exposure significantly increasing firing rates compared with all other manipulations (Fig. 3B) (p < 0.0001 for all). Similarly, SD photoperiod combined with systemic T and E2 significantly increased soma area compared with SD alone (Fig. 3C) (p < 0.05).
Figure 3.
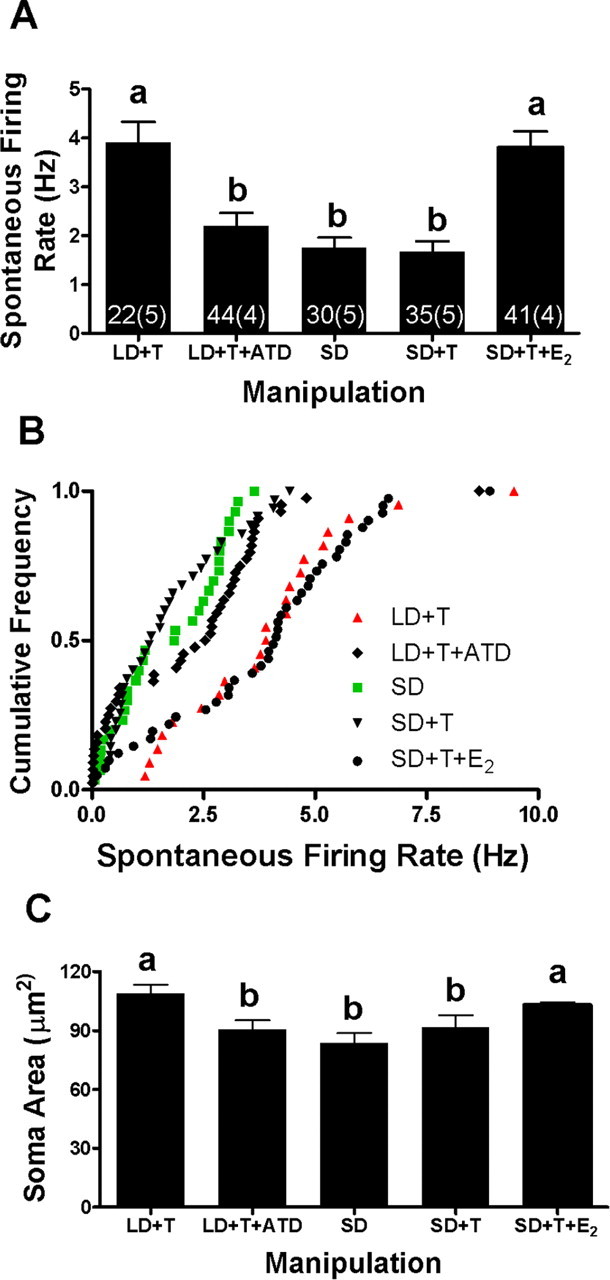
Faster increase in spontaneous firing rate and growth of RA neurons in LD than SD photoperiod is attributable to increased availability of E2. Different treatment groups were exposed to either an SD or LD photoperiod and received systemic implants of T, E2, an inhibitor of estrogen synthesis (ATD), a combination of implants, or no steroid implant. The letters above the bars indicate significant differences between treatment groups. Numbers at base indicate units and animals. A, Average spontaneous firing rates of each treatment group (mean ± SEM). B, Cumulative frequency distributions (see Results for statistical significance). C, Soma area (mean ± SEM). The SE of the SD+T+E2 group is obscured by the mean.
Inhibition of estrogen synthesis slows the time course of the LD photoperiod and systemic T-induced firing rate increase
Conversely, systemic inhibition of estrogen synthesis blocks the LD photoperiod and systemic T-induced increase in spontaneous firing rates and soma size (Fig. 3A). In birds exposed to LD photoperiod, systemic T, and the estrogen synthesis inhibitor ATD, RA firing rates were significantly less than those in birds exposed to LD photoperiod and systemic T alone (Fig. 3A) (p < 0.01) and SD photoperiod plus systemic T and E2 (p < 0.001). Firing rates in birds exposed to LD photoperiod and systemic T and ATD were not significantly different from those measured in birds exposed to SD photoperiod alone or to SD photoperiod plus systemic T (p > 0.05). A cumulative distribution analysis yielded the same conclusion, with ATD exposure blocking the LD photoperiod and systemic T increase in firing rates compared with those measured from LD photoperiod and systemic T alone, and SD photoperiod plus systemic T and E2 (Fig. 3B) (p < 0.0001). Firing rates from birds exposed to ATD, LD photoperiod, and systemic T were not significantly different from those measured from SD photoperiod alone or SD photoperiod plus systemic T (p > 0.05). Morphological measurements paralleled the firing rate changes, because the soma areas in LD photoperiod plus systemic T and ATD-treated animals were smaller compared with those exposed to LD photoperiod plus systemic T alone (Fig. 3C) (p < 0.05). Soma areas in LD photoperiod plus systemic T and ATD-treated animals were not different from those exposed to SD photoperiod alone (p > 0.05).
ERs and ARs in HVC, and ARs in RA mediate the increase in firing rate
Our results with systemic hormone implants implicate both androgens and estrogens in the regulation of RA firing rate but provide no information on where the hormones act. We therefore determined which steroid receptors in which song system nuclei are necessary and sufficient for the T-induced increase in firing rate of RA neurons. We focused our experiments on the afferent nucleus HVC, because it is the only telencephalic song nucleus known to contain ERs (Fig. 1A).
Lesions of HVC block the LD photoperiod plus systemic T-induced increase in firing rate
HVC is necessary for the increase in firing rate and soma area in RA (Fig. 4A). We made unilateral excitotoxic lesions of HVC (Fig. 1C) (average portion of HVC lesioned, 95 ± 5%) and exposed the birds to LD plus systemic T for 21 d. These lesions completely blocked the LD plus systemic T-induced increase in the ipsilateral RA spontaneous firing rate and soma area (Fig. 4). Mean spontaneous firing rates in RA were significantly higher on the intact side than the lesioned side (Fig. 4A1) (p < 0.0001). A cumulative distribution analysis also indicated that spontaneous firing rates were higher in the intact hemisphere (Fig. 4A2) (p < 0.001). Similarly, mean soma area was significantly higher in the intact hemisphere (Fig. 4A3) (p < 0.008).
Figure 4.

AR and ER activation in HVC is necessary and sufficient for increases in RA firing rate and soma area. A1–A3, Unilateral lesion of HVC with systemic exposure to LD and T for 3 weeks. B1–B3, The ER antagonist faslodex and the AR antagonist flutamide unilaterally infused near HVC for 3 weeks, with systemic exposure to LD and T. C1–C3, DHT+E2 unilaterally infused near HVC for 3 weeks with SD photoperiod. A1, B1, C1, Firing rate (horizontal line indicates mean) in the lesioned or infused hemisphere compared with the noninfused hemisphere. A2, B2, C2, Comparison of firing rate cumulative frequency distributions between the two hemispheres (see Results for statistical significance). A3, B3, C3, Comparison of soma areas between the two hemispheres.
ER and AR antagonists near HVC decrease firing rate and soma area
To better determine whether ERs and ARs within HVC cells are necessary for increased firing rate and soma size in RA, we infused the ER antagonist faslodex and the AR antagonist flutamide unilaterally near HVC (Fig. 1D) while exposing the birds to LD plus systemic T for 21 d. We found that activation of both ERs and ARs in HVC is necessary for the increase in firing rate and soma area in the efferent nucleus RA (Fig. 4B). ER and AR antagonists infused near HVC decreased ipsilateral RA spontaneous firing rate compared with the noninfused hemisphere (Fig. 4B1) (p = 0.0003). A cumulative distribution analysis also indicates that firing rates were lower in the infused hemisphere (Fig. 4B2) (p < 0.001). Similarly, RA soma area was smaller compared with the noninfused hemisphere (Fig. 4B3) (p < 0.003).
DHT and E2 near HVC increase firing rate and soma area
Coactivation of ARs and ERs in HVC is sufficient to increase firing rate and soma area in RA (Fig. 4C). We infused DHT and E2 unilaterally near HVC for 21 d while maintaining birds on SD. This treatment increased spontaneous firing rate “(Figs. 4C1 (p < 0.001), C2 (p < 0.001)” and soma area (Fig. 4C3) (p < 0.01) in the ipsilateral RA. The same treatment for 14 d, however, did not significantly increase firing rate (ipsilateral, 1.6 ± 0.3 Hz; contralateral, 2.0 ± 0.3 Hz; n = 27 and 29 units, respectively; n = 4 birds; p > 0.05) but did increase RA soma area (ipsilateral, 107.5 ± 8.9 μm2; contralateral, 70.6 ± 1.9 μm2; n = 4 birds; p < 0.02). A 14 d simultaneous unilateral infusion of DHT and E2 near both HVC and RA also did not significantly increase firing rate (ipsilateral, 1.5 ± 0.3 Hz; contralateral, 2.1 ± 0.5 Hz; n = 25 and 24 units, respectively; n = 4 birds; p > 0.05) but did increase soma area (ipsilateral, 93.0 ± 3.8 μm2; contralateral, 72.1 ± 2.6 μm2; n = 4 birds; p < 0.01).
Infusing DHT and E2 near RA does not increase firing rate or soma area
Activating ARs in RA is not sufficient to increase spontaneous firing rate and soma area. We infused DHT and E2 unilaterally near RA while maintaining birds on SD for 21 d. Spontaneous firing rate and soma area were not different in the infused RA compared with the noninfused hemisphere (Fig. 5A1–A3) (p > 0.05 for all).
Figure 5.

AR activation in RA is permissive but not sufficient for increases in RA firing rate and soma area. A1–A3, DHT+E2 unilaterally infused near RA for 3 weeks under SD. B1–B3, Flutamide, an AR antagonist, infused near RA for 3 weeks with LD photoperiod and systemic T. A1, B1, Firing rate (horizontal line indicates mean) in the infused hemisphere compared with the noninfused hemisphere. A2, B2, The cumulative frequency distribution in the two hemispheres (see Results for statistical significance). A3, B3, Comparison of soma areas between the two hemispheres.
Infusing AR antagonist near RA prevents the increase in firing rate and soma area
Although activation of ARs in RA was not sufficient to induce increased activity or soma size, it was necessary for these changes induced by LD plus systemic T. We exposed birds to LD plus systemic T while unilaterally infusing the selective AR antagonist flutamide near RA for 21 d. Flutamide treatment prevented the increase in RA firing rate compared with the noninfused hemisphere (Fig. 5B1) (p < 0.0001). The cumulative distributions of firing rates from each hemisphere were also significantly different (Fig. 5B2) (p < 0.01). Soma area was significantly smaller in the infused hemisphere compared with the noninfused hemisphere (Fig. 5B3) (p < 0.03). A unilateral vehicle control infusion showed no difference between hemispheres in either firing rate or soma area (data not shown) (p > 0.05).
ARs and ERs in HVC mediate increases in song stereotypy but not song rate
We assessed the functional significance of ERs and ARs in HVC on song behavior by exposing 14 birds to LD photoperiod plus systemic T for 21 d while bilaterally infusing either vehicle (n = 7) or a combination of the AR antagonist flutamide and the ER antagonist faslodex (n = 7) near HVC. LD photoperiod plus systemic T over time significantly increased song production in both groups (Fig. 6) (p < 0.0001), and song rate did not differ between the vehicle and antagonist groups (Fig. 6) (p > 0.05).
Figure 6.

Androgen and estrogen receptors in HVC are not necessary for LD photoperiod plus systemic T-induced increases in song rate. Song rate does not differ between LD photoperiod plus systemic T-treated birds that received bilateral infusions near HVC of vehicle or a combination of AR and ER antagonists (p > 0.05).
Song stereotypy, however, did differ between the vehicle and the AR plus ER antagonist exposed groups (Fig. 7A,B). On day 20, we analyzed song stereotypy by measuring six temporal and 10 spectral attributes of song in both groups. The absolute mean values were not different between the groups (Table 2) (p > 0.05). The coefficients of variation (CV = “SD/mean” × 100; higher CV indicates lower stereotypy) did vary. Song was more stereotyped on day 20 in birds infused with vehicle compared with birds infused with AR plus ER antagonists, because the CVs of the 16 measured song characteristics were significantly lower in birds infused with vehicle compared with those infused with antagonists (Fig. 7C) (Table 2; p = 0.02). Three individual measurements in AR plus ER antagonist-treated birds had significantly higher CVs compared with vehicle-treated birds (Table 2; p < 0.05 for all three).
To study the time course of change in song stereotypy, we measured song attributes at days 13 and 20 in both groups. Song stereotypy significantly increased between days 13 and 20 in birds infused with vehicle (Fig. 7D) (p < 0.0003) and did not differ between days 13 and 20 in birds infused with AR plus ER antagonists (Fig. 7D) (p > 0.05). Absolute mean values did not differ (p > 0.05 for both groups). For the vehicle-treated birds, 8 of the 16 individual measurements had significantly lower CVs on day 20 compared with day 13 (Table 2) (p < 0.05 for all eight), whereas in the AR and ER antagonist-treated birds, no measures were significantly different (Table 2) (p > 0.05 for all).
If we compare song stereotypy instead by calculating the mean CV for each bird, the songs of vehicle-treated birds continue to be significantly more stereotyped at day 20 than those of AR plus ER antagonist-treated birds at day 20 (Fig. 7E) (p < 0.006). The time course of changes in song stereotypy also replicates the previous analysis; song stereotypy significantly increased between days 13 and 20 in birds exposed to vehicle (Fig. 7F) (p < 0.0007) and was not significantly different in birds exposed to AR and ER antagonists (Fig. 7F) (p > 0.05).
Discussion
Key findings of our study include the following: LD photoperiod accelerates systemic T-induced increases in RA spontaneous firing rate and soma size; the faster increase caused by LD photoperiod is attributable to increased availability of E2 via conversion from T by aromatase; increased firing rates and soma size in RA are mediated by coactivation of ARs and ERs in the afferent nucleus HVC and activation of ARs in RA; ARs and ERs in HVC mediate increases in song stereotypy but not song rate. We propose that T and its metabolites induce HVC to generate a transsynaptic signal that acts on RA neurons, and that AR activation in RA is permissive for this signal to exert its effect. These changes in RA are part of a concerted morphological and electrophysiological remodeling leading to increased song stereotypy important for breeding success.
Role of aromatase
Our experiments with systemic E2 and ATD implicate activity of the estrogen-synthesizing enzyme aromatase (CYP19A1) as part of the mechanism by which LD photoperiod accelerates the T-induced increase in RA firing rate and soma size. In white-crowned sparrows, aromatase activity has been measured in the telencephalon of birds captured in the winter but not spring (Schlinger et al., 1992). In song sparrows, the nidopallium surrounding HVC expresses aromatase mRNA, but HVC itself does not (Soma et al., 2003), similar to other songbird species (Forlano et al., 2006). In zebra finches, aromatase is observed in presynaptic terminals within HVC (Peterson et al., 2005). Regional aromatase activity changes seasonally in song sparrows (Soma et al., 2003) and starlings (Riters et al., 2001). An important future direction of this work is studying aromatase activity in white-crowned sparrows.
A model of how T and its metabolites induce changes in activity and morphology
This study shows that ARs and ERs within HVC are necessary for an increase in firing rates and soma area in RA, extending previous, purely morphometric studies of RA afferent input (Herrmann and Arnold, 1991; Akutagawa and Konishi, 1994; Burek et al., 1995; Brenowitz and Lent, 2001, 2002). By infusing DHT and E2 near HVC in SD birds, we demonstrated that coactivation of ARs and ERs in HVC is sufficient for an increase in firing rate and soma area in RA. The same treatment near RA did not increase firing rate or soma area.
Exposing RA neurons to the AR antagonist flutamide prevents the increase in firing rate and soma size induced by LD photoperiod plus systemic T. This suggests that activation of ARs in RA is permissive for RA to respond to the trophic signal arriving from HVC. One challenge to this hypothesis is explaining how combined DHT and E2 infusion near HVC alone accelerates RA firing rates in SD birds. In this case, ARs in RA could be sufficiently activated either by the low plasma T in SD birds (Schlinger et al., 1992) or through de novo synthesis of androgens (Schlinger and London, 2006). Other possibilities include changes in AR sensitivity or number “e.g., Spring elevates AR immunoreactivity in HVC in wild white-crowned sparrows (Soma et al., 1999b)”. More detailed studies of the hypothesized permissive role of ARs in RA are required.
The specific nature of the trophic support provided by HVC to RA is unclear, although it could involve neurotrophin release and/or changes in synaptic activity (Brenowitz, 2004). One possibility is that one or more neurotrophins are expressed and released by HVC neurons and taken up by postsynaptic RA neurons, because neurotrophins can undergo anterograde transport (Kohara et al., 2001; von Bartheld et al., 2001). In support of this suggestion, brain derived neurotrophic factor (BDNF) mRNA is expressed by HVC neurons (but not RA neurons) in response to systemic T treatment in canaries and white-crowned sparrows (Rasika et al., 1999) (A. M. Wissman and E. A. Brenowitz, unpublished data). Infusion of recombinant BDNF near RA induces seasonal-like neuronal growth (Wissman and Brenowitz, unpublished data). In other systems, BDNF induces alterations in dendritic trees (McAllister et al., 1995), synapses (Poo, 2001), and electrical properties, including spontaneous activity (Aguado et al., 2003).
We propose the following model for how ARs and ERs affect firing rate and soma area in RA (Fig. 8). Early in the breeding season, increasing day length stimulates growth of the testes, elevating circulating T levels. Photoperiod and possibly increased T levels stimulate greater aromatase activity or expression, resulting in increased local synthesis or delivery of E2 to HVC. In HVC, AR and ER activation enhances incorporation of new RA-projecting neurons into HVC and increase synthesis of a transsynaptic trophic signal that drives changes in intrinsic activity and morphology in RA. Given that increases in RA firing rate, soma size, and nucleus volume occur after HVC grows (Fig. 2) (Tramontin et al., 2000), the trophic signal produced by HVC may either take time to be produced and transported, and/or new RA-projecting neurons may need to be recruited to HVC and establish synapses on the increased dendritic arbors of RA neurons (Hill and DeVoogd, 1991). Finally, in RA, activation of ARs plays a permissive role, enabling and/or amplifying the response to the transsynaptic trophic signal released by HVC axons. Environmental, social, or other supplementary cues could modulate aspects of the model, and properties of HVC neurons could also change. This scenario presents a testable model of how steroids act transsynaptically to modulate electrophysiological properties and morphology of an adult telencephalic region.
Figure 8.

Working model demonstrating that direct and indirect coactivation of ARs and ERs regulates neuronal activity in RA. Growth in RA requires both androgens and estrogens. Plasma T concentration and the enzyme aromatase that converts T to its estrogenic metabolite E2 are regulated by photoperiod. Estradiol acts on HVC. T and/or its androgenic metabolite DHT act on both HVC and RA. Steroid receptor binding in HVC is necessary and sufficient to create a trophic signal that is transported by HVC afferents to RA. Steroid receptor binding in RA is permissive for morphological and electrophysiological change to occur in response to the trophic signal released by HVC.
Relationship to vocal behavior
Bilaterally infusing AR and ER antagonists near HVC blocks LD photoperiod plus systemic T-induced increases in song stereotypy but not song rate. This suggests that steroid hormones act on HVC to organize the song control system to produce more stereotyped song, but that hormone action on HVC does not influence the motivation to sing. Additional evidence that HVC is not the site of song motivation comes from Brenowitz and Lent (2002), who found that unilaterally implanting T next to HVC in SD photoperiod-exposed white-crowned sparrows did not stimulate song production, although it did induce growth of the ipsilateral HVC, RA, and area X. Given that song production is influenced by steroid hormones (Harding, 2004), singing could be activated by hormones acting in other brain areas. Lesions of at least one nucleus outside the song system, the medial preoptic nucleus, can decrease song production (Riters and Ball, 1999; Alger and Riters, 2006).
Infusing AR plus ER antagonists bilaterally near HVC in birds exposed to LD plus systemic T did not decrease song rate relative to vehicle controls, although similar infusions decrease RA soma size and spontaneous activity. This is consistent with a model in which seasonal growth of the song system is primarily regulated by hormones acting directly on HVC, rather than indirectly by stimulating song production (Brenowitz, 2004, 2007) (for an alternate view, see Ball et al., 2004; Sartor and Ball, 2005). The evidence provided here does not rule out possible species differences in the relative influence of direct hormone action on HVC versus indirect effects of increased song production, nor does it rule out song production playing a modulatory role.
HVC and RA are necessary for song production (Nottebohm et al., 1976; Simpson and Vicario, 1990) and contain projection neurons that exhibit activity temporally coordinated with song production (McCasland, 1987; Yu and Margoliash, 1996; Chi and Margoliash, 2001; Leonardo and Fee, 2005; Kozhevnikov and Fee, 2007). Changes in the electrophysiological properties of HVC and RA neurons could underlie changes in song stereotypy. In addition to the data presented here, other correlational evidence supports this proposal. In zebra finches, spontaneous firing rate (Adret and Margoliash, 2002), soma area (Konishi and Akutagawa, 1985, 1990; Bottjer et al., 1986; Adret and Margoliash, 2002), and song stereotypy (Adret and Margoliash, 2002) all increase with age. A similar pattern is observed in adult white-crowned sparrows in breeding condition; increased spontaneous firing rate coincides with increased song stereotypy and increased neuronal size (Smith et al., 1995; Tramontin et al., 2000; Park et al., 2005). Similar changes in RA firing rate, soma size, and song stereotypy occur naturally in wild seasonally breeding song sparrows (Smith et al., 1997a; Tramontin et al., 2001; Meitzen et al., 2007) and towhees (Smith, 1996; Meitzen et al., 2007). In this study, we generally observe parallel changes in cell size and firing rate. Modeling studies predict that changes in cellular morphology alone “and in particular dendritic morphology; LD photoperiod lengthens RA neuron dendritic arbors (Hill and DeVoogd, 1991” directly impact neuronal firing properties (Mainen and Sejnowski, 1996), but many ionic mechanisms can change neuronal firing patterns.
Spontaneous activity is a useful diagnostic tool for assessing the excitability of a neuron and has been studied along with other electrophysiological characteristics of RA interneuron and projection neurons (Mooney, 1992; Spiro et al., 1999) but not in the context of seasonality. In other systems, spontaneous firing rate directly relates to the intrinsic excitability of a neuron (Zakon, 1998; Gittis and du Lac, 2006). One example is vestibular nucleus neurons, which increase both spontaneous firing rate and the number of action potentials evoked to injected current pulses after membrane hyperpolarization (Gittis and du Lac, 2006). Another example is GH3 cells, which upregulate a low-voltage activated calcium channel in response to E2, thus increasing membrane excitability and spontaneous firing rate (Zakon, 1998). Here, we used spontaneous firing rate as an indication of whether the intrinsic electrical state of RA neurons was typical of a breeding or nonbreeding state. The use of extracellular recording in an in vitro preparation has allowed us to study in considerable detail the mechanisms underlying steroid hormone modulation of the electrical activity in RA by dramatically increasing the yield of neuronal recordings in tissue obtained from wild-caught birds. Nevertheless, spontaneous firing rate is only one of many electrophysiological properties of a neuron. It is important to extend this work to understand the detailed ionic mechanisms underlying the changes we observed, as well as how synaptic inputs are altered with the onset of breeding condition, resulting in changed vocal behavior.
Footnotes
This work was supported by National Institutes of Health Grants MH068530 (D.J.P.), MH53032 (E.A.B.), and P30 DC-04661 (E. W Rubel); National Science Foundation Grant IOB-0545735 (I.T.M.); and a Graduate Research Fellowship (J.M.). E.A.B. and D.J.P. are affiliates of the Virginia Merrill Bloedel Hearing Research Center. We thank the members of the Perkel and Brenowitz laboratories for their support and Kristen Richards for animal care and histological assistance.
References
- Adret P, Margoliash D. Metabolic and neural activity in the song system nucleus robustus archistriatalis: effect of age and gender. J Comp Neurol. 2002;454:409–423. doi: 10.1002/cne.10459. [DOI] [PubMed] [Google Scholar]
- Aguado F, Carmona MA, Pozas E, Aguiló A, Martínez-Guijarro FJ, Alcantara S, Borrell V, Yuste R, Ibañez CF, Soriano E. BDNF regulates spontaneous correlated activity at early developmental stages by increasing synaptogenesis and expression of the K+/Cl- co-transporter KCC2. Development. 2003;130:1267–1280. doi: 10.1242/dev.00351. [DOI] [PubMed] [Google Scholar]
- Akutagawa E, Konishi M. Two separate areas of the brain differentially guide the development of a song control nucleus in the zebra finch. Proc Natl Acad Sci USA. 1994;91:12413–12417. doi: 10.1073/pnas.91.26.12413. [DOI] [PMC free article] [PubMed] [Google Scholar]
- Alger SJ, Riters LV. Lesions to the medial preoptic nucleus differentially affect singing and nest box-directed behaviors within and outside of the breeding season in European starlings (Sturnus vulgaris) Behav Neurosci. 2006;120:1326–1336. doi: 10.1037/0735-7044.120.6.1326. [DOI] [PMC free article] [PubMed] [Google Scholar]
- Arnold AP, Nottebohm F, Pfaff DW. Hormone concentrating cells in vocal control and other areas of the brain of the zebra finch (Poephila guttata) J Comp Neurol. 1976;165:487–511. doi: 10.1002/cne.901650406. [DOI] [PubMed] [Google Scholar]
- Ball GF, Auger CJ, Bernard DJ, Charlier TD, Sartor JJ, Riters LV, Balthazart J. Seasonal plasticity in the song control system: multiple brain sites of steroid hormone action and the importance of variation in song behavior. Ann NY Acad Sci. 2004;1016:586–610. doi: 10.1196/annals.1298.043. [DOI] [PubMed] [Google Scholar]
- Bernard DJ, Bentley GE, Balthazart J, Turek FW, Ball GF. Androgen receptor, estrogen receptor alpha, and estrogen receptor beta show distinct patterns of expression in forebrain song control nuclei of European starlings. Endocrinology. 1999;140:4633–4643. doi: 10.1210/endo.140.10.7024. [DOI] [PubMed] [Google Scholar]
- Bottjer SW, Miesner EA, Arnold AP. Changes in neuronal number, density and size account for increases in volume of song-control nuclei during song development in zebra finches. Neurosci Lett. 1986;67:263–268. doi: 10.1016/0304-3940(86)90319-8. [DOI] [PubMed] [Google Scholar]
- Bottjer SW, Brady JD, Walsh JP. Intrinsic and synaptic properties of neurons in the vocal-control nucleus IMAN from in vitro slice preparations of juvenile and adult zebra finches. J Neurobiol. 1998;37:642–658. [PubMed] [Google Scholar]
- Brenowitz EA. Plasticity of the adult avian song control system. Ann NY Acad Sci. 2004;1016:560–585. doi: 10.1196/annals.1298.006. [DOI] [PubMed] [Google Scholar]
- Brenowitz EA, Lent K. Afferent input is necessary for seasonal growth and maintenance of adult avian song control circuits. J Neurosci. 2001;21:2320–2329. doi: 10.1523/JNEUROSCI.21-07-02320.2001. [DOI] [PMC free article] [PubMed] [Google Scholar]
- Brenowitz EA, Lent K. Act locally and think globally: intracerebral testosterone implants induce seasonal-like growth of adult avian song control circuits. Proc Natl Acad Sci USA. 2002;99:12421–12426. doi: 10.1073/pnas.192308799. [DOI] [PMC free article] [PubMed] [Google Scholar]
- Brenowitz EA, Lent K, Rubel EW. Auditory feedback and song production do not regulate seasonal growth of song control circuits in adult white-crowned sparrows. J Neurosci. 2007;27:6810–6814. doi: 10.1523/JNEUROSCI.1248-07.2007. [DOI] [PMC free article] [PubMed] [Google Scholar]
- Burek MJ, Nordeen KW, Nordeen EJ. Initial sex differences in neuron growth and survival within an avian song nucleus develop in the absence of afferent input. J Neurobiol. 1995;27:85–96. doi: 10.1002/neu.480270109. [DOI] [PubMed] [Google Scholar]
- Chi Z, Margoliash D. Temporal precision and temporal drift in brain and behavior of zebra finch song. Neuron. 2001;32:899–910. doi: 10.1016/s0896-6273(01)00524-4. [DOI] [PubMed] [Google Scholar]
- Del Negro C, Edeline JM. Sex and season influence the proportion of thin spike cells in the canary HVc. NeuroReport. 2002;13:2005–2009. doi: 10.1097/00001756-200211150-00003. [DOI] [PubMed] [Google Scholar]
- Del Negro C, Lehongre K, Edeline JM. Selectivity of canary HVC neurons for the bird's own song: modulation by photoperiodic conditions. J Neurosci. 2005;25:4952–4963. doi: 10.1523/JNEUROSCI.4847-04.2005. [DOI] [PMC free article] [PubMed] [Google Scholar]
- Dutar P, Vu HM, Perkel DJ. Multiple cell types distinguished by physiological, pharmacological, and anatomic properties in nucleus HVc of the adult zebra finch. J Neurophysiol. 1998;80:1828–1838. doi: 10.1152/jn.1998.80.4.1828. [DOI] [PubMed] [Google Scholar]
- Forlano PM, Schlinger BA, Bass AH. Brain aromatase: new lessons from non-mammalian model systems. Front Neuroendocrinol. 2006;27:247–274. doi: 10.1016/j.yfrne.2006.05.002. [DOI] [PubMed] [Google Scholar]
- Fusani L, Van't Hof T, Hutchison JB, Gahr M. Seasonal expression of androgen receptors, estrogen receptors, and aromatase in the canary brain in relation to circulating androgens and estrogens. J Neurobiol. 2000;43:254–268. [PubMed] [Google Scholar]
- Gahr M, Güttinger HR, Kroodsma DE. Estrogen receptors in the avian brain: survey reveals general distribution and forebrain areas unique to songbirds. J Comp Neurol. 1993;327:112–122. doi: 10.1002/cne.903270109. [DOI] [PubMed] [Google Scholar]
- Gittis AH, du Lac S. Intrinsic and synaptic plasticity in the vestibular system. Curr Opin Neurobiol. 2006;16:385–390. doi: 10.1016/j.conb.2006.06.012. [DOI] [PubMed] [Google Scholar]
- Goldman SA, Nottebohm F. Neuronal production, migration, and differentiation in a vocal control nucleus of the adult female canary brain. Proc Natl Acad Sci USA. 1983;80:2390–2394. doi: 10.1073/pnas.80.8.2390. [DOI] [PMC free article] [PubMed] [Google Scholar]
- Harding CF. Hormonal modulation of singing: hormonal modulation of the songbird brain and singing behavior. Ann NY Acad Sci. 2004;1016:524–539. doi: 10.1196/annals.1298.030. [DOI] [PubMed] [Google Scholar]
- Herrmann K, Arnold AP. Lesions of HVc block the developmental masculinizing effects of estradiol in the female zebra finch song system. J Neurobiol. 1991;22:29–39. doi: 10.1002/neu.480220104. [DOI] [PubMed] [Google Scholar]
- Hill KM, DeVoogd TJ. Altered daylength affects dendritic structure in a song-related brain region in red-winged blackbirds. Behav Neural Biol. 1991;56:240–250. doi: 10.1016/0163-1047(91)90379-5. [DOI] [PubMed] [Google Scholar]
- Kim YH, Perlman WR, Arnold AP. Expression of androgen receptor mRNA in zebrafinch song system: developmental regulation by estrogen. J Comp Neurol. 2004;469:535–547. doi: 10.1002/cne.11033. [DOI] [PubMed] [Google Scholar]
- Kohara K, Kitamura A, Morishima M, Tsumoto T. Activity-dependent transfer of brain-derived neurotrophic factor to postsynaptic neurons. Science. 2001;291:2419–2423. doi: 10.1126/science.1057415. [DOI] [PubMed] [Google Scholar]
- Konishi M, Akutagawa E. Neuronal growth, atrophy and death in a sexually dimorphic song nucleus in the zebra finch brain. Nature. 1985;315:145–147. doi: 10.1038/315145a0. [DOI] [PubMed] [Google Scholar]
- Konishi M, Akutagawa E. Growth and atrophy of neurons labeled at their birth in a song nucleus of the zebra finch. Proc Natl Acad Sci USA. 1990;87:3538–3541. doi: 10.1073/pnas.87.9.3538. [DOI] [PMC free article] [PubMed] [Google Scholar]
- Kozhevnikov AA, Fee MS. Singing-related activity of identified HVC neurons in the zebra finch. J Neurophysiol. 2007;97:4271–4283. doi: 10.1152/jn.00952.2006. [DOI] [PubMed] [Google Scholar]
- Leonardo A, Fee MS. Ensemble coding of vocal control in birdsong. J Neurosci. 2005;25:652–661. doi: 10.1523/JNEUROSCI.3036-04.2005. [DOI] [PMC free article] [PubMed] [Google Scholar]
- Lucas JR, Freeberg TM, Krishnan A, Long GR. A comparative study of avian auditory brainstem responses: correlations with phylogeny and vocal complexity, and seasonal effects. J Comp Physiol A Neuroethol Sens Neural Behav Physiol. 2002;188:981–992. doi: 10.1007/s00359-002-0359-x. [DOI] [PubMed] [Google Scholar]
- Lucas JR, Freeberg TM, Long GR, Krishnan A. Seasonal variation in avian auditory evoked responses to tones: a comparative analysis of Carolina chickadees, tufted titmice, and white-breasted nuthatches. J Comp Physiol A Neuroethol Sens Neural Behav Physiol. 2007;193:201–215. doi: 10.1007/s00359-006-0180-z. [DOI] [PubMed] [Google Scholar]
- Mainen ZF, Sejnowski TJ. influence of dendritic structure on firing pattern in model neocortical neurons. Nature. 1996;382:363–366. doi: 10.1038/382363a0. [DOI] [PubMed] [Google Scholar]
- Marler P, Slabbekoorn H. Nature's music, the science of birdsong. San Diego: Elsevier; 2004. [Google Scholar]
- McAllister AK, Lo DC, Katz LC. Neurotrophins regulate dendritic growth in developing visual cortex. Neuron. 1995;15:791–803. doi: 10.1016/0896-6273(95)90171-x. [DOI] [PubMed] [Google Scholar]
- McCasland JS. Neuronal control of bird song production. J Neurosci. 1987;7:23–39. doi: 10.1523/JNEUROSCI.07-01-00023.1987. [DOI] [PMC free article] [PubMed] [Google Scholar]
- Meitzen J, Perkel DJ, Brenowitz EA. Seasonal changes in intrinsic electrophysiologicalactivity of song control neurons in wild song sparrows. J Comp Physiol A Neuroethol Sens Neural Behav Physiol. 2007;193:677–683. doi: 10.1007/s00359-007-0222-1. [DOI] [PubMed] [Google Scholar]
- Metzdorf R, Gahr M, Fusani L. Distribution of aromatase, estrogen receptor, andandrogen receptor mRNA in the forebrain of songbirds and nonsongbirds. J Comp Neurol. 1999;407:115–129. [PubMed] [Google Scholar]
- Mooney R. Synaptic basis for developmental plasticity in a birdsong nucleus. J Neurosci. 1992;12:2464–2477. doi: 10.1523/JNEUROSCI.12-07-02464.1992. [DOI] [PMC free article] [PubMed] [Google Scholar]
- Moore IT, Walker BG, Wingfield JC. The effects of combined aromatase inhibitor and anti-androgen on male territorial aggression in a tropical population of rufous-collared sparrows, Zonotrichia capensis. Gen Comp Endocrinol. 2004;135:223–229. doi: 10.1016/j.ygcen.2003.09.012. [DOI] [PubMed] [Google Scholar]
- Nastiuk KL, Clayton DF. The canary androgen receptor mRNA is localized in the song control nuclei of the brain and is rapidly regulated by testosterone. J Neurobiol. 1995;26:213–224. doi: 10.1002/neu.480260206. [DOI] [PubMed] [Google Scholar]
- Nottebohm F. A brain for all seasons: cyclical anatomical changes in song control nuclei of the canary brain. Science. 1981;214:1368–1370. doi: 10.1126/science.7313697. [DOI] [PubMed] [Google Scholar]
- Nottebohm F, Stokes TM, Leonard CM. Central control of song in the canary, Serinus canarius. J Comp Neurol. 1976;165:457–486. doi: 10.1002/cne.901650405. [DOI] [PubMed] [Google Scholar]
- Park KH, Meitzen J, Moore IT, Brenowitz EA, Perkel DJ. Seasonal-like plasticity of spontaneous firing rate in a songbird pre-motor nucleus. J Neurobiol. 2005;64:181–191. doi: 10.1002/neu.20145. [DOI] [PubMed] [Google Scholar]
- Peterson RS, Yarram L, Schlinger BA, Saldanha CJ. Aromatase is pre-synaptic and sexually dimorphic in the adult zebra finch brain. Proc Biol Sci. 2005;272:2089–2096. doi: 10.1098/rspb.2005.3181. [DOI] [PMC free article] [PubMed] [Google Scholar]
- Poo MM. Neurotrophins as synaptic modulators. Nat Rev Neurosci. 2001;2:24–32. doi: 10.1038/35049004. [DOI] [PubMed] [Google Scholar]
- Rasika S, Alvarez-Buylla A, Nottebohm F. BDNF mediates the effects of testosterone on the survival of new neurons in an adult brain. Neuron. 1999;22:53–62. doi: 10.1016/s0896-6273(00)80678-9. [DOI] [PubMed] [Google Scholar]
- Reiner A, Perkel DJ, Bruce LL, Butler AB, Csillag A, Kuenzel W, Medina L, Paxinos G, Shimizu T, Striedter G, Wild M, Ball GF, Durand S, Guturkun O, Lee DW, Mello CV, Powers A, White SA, Hough G, Kubikova L. Revised nomenclature for avian telencephalon and some related brainstem nuclei. J Comp Neurol. 2004;473:377–414. doi: 10.1002/cne.20118. [DOI] [PMC free article] [PubMed] [Google Scholar]
- Riters LV, Ball GF. Lesions to the medial preoptic area affect singing in the male Eur starling (Sturnus vulgaris) Horm Behav. 1999;36:276–286. doi: 10.1006/hbeh.1999.1549. [DOI] [PubMed] [Google Scholar]
- Riters LV, Baillien M, Eens M, Pinxten R, Foidart A, Ball GF, Balthazart J. Seasonal variation in androgen-metabolizing enzymes in the diencephalons and telencephalon of the male European starling (Sturnus vulgaris) J Neuroendocrinol. 2001;13:985–997. doi: 10.1046/j.1365-2826.2001.00723.x. [DOI] [PubMed] [Google Scholar]
- Sartor JJ, Ball GF. Social suppression of song is associated with a reduction in volume of a song-control nucleus in Eur starlings (Sturnus vulgaris) Behav Neurosci. 2005;119:233–244. doi: 10.1037/0735-7044.119.1.233. [DOI] [PubMed] [Google Scholar]
- Schlinger BA, London SE. Neurosteroids and the songbird model system. J Exp Zoolog A Comp Exp Biol. 2006;305:743–748. doi: 10.1002/jez.a.303. [DOI] [PubMed] [Google Scholar]
- Schlinger BA, Slotow RH, Arnold AP. Plasma estrogens and brain aromatase in winter White-crowned sparrows. Ornis Scand. 1992;23:292–297. [Google Scholar]
- Simpson HB, Vicario DS. Brain pathways for learned and unlearned vocalizations differ in zebra finches. J Neurosci. 1990;10:1541–1556. doi: 10.1523/JNEUROSCI.10-05-01541.1990. [DOI] [PMC free article] [PubMed] [Google Scholar]
- Singh TD, Heinrich JE, Wissman AM, Brenowitz EA, Nordeen EJ, Nordeen KW. Seasonal regulation of NMDA receptor NR2B mRNA in the adult canary song system. J Neurobiol. 2003;54:593–603. doi: 10.1002/neu.10178. [DOI] [PubMed] [Google Scholar]
- Smith GT. Seasonal plasticity in the song nuclei of wild rufous sided towhees. Brain Res. 1996;734:79–85. [PubMed] [Google Scholar]
- Smith GT, Brenowitz EA, Wingfield JC, Baptista LF. Seasonal changes in song nuclei and song behavior in Gambel's white-crowned sparrows. J Neurobiol. 1995;28:114–125. doi: 10.1002/neu.480280110. [DOI] [PubMed] [Google Scholar]
- Smith GT, Brenowitz EA, Prins GS. Use of PG-21 immunocytochemistry to detect androgen receptors in the songbird brain. J Histochem Cytochem. 1996;44:1075–1080. doi: 10.1177/44.9.8773574. [DOI] [PubMed] [Google Scholar]
- Smith GT, Brenowitz EA, Beecher MD, Wingfield JC. Seasonal changes in testosterone, neural attributes of song control nuclei, and song structure in wild songbirds. J Neurosci. 1997a;17:6001–6010. doi: 10.1523/JNEUROSCI.17-15-06001.1997. [DOI] [PMC free article] [PubMed] [Google Scholar]
- Smith GT, Brenowitz EA, Wingfield JC. Roles of photoperiod and testosterone in seasonal plasticity of the avian song control system. J Neurobiol. 1997b;32:426–442. doi: 10.1002/(sici)1097-4695(199704)32:4<426::aid-neu6>3.0.co;2-8. [DOI] [PubMed] [Google Scholar]
- Solis MM, Perkel DJ. Noradrenergic modulation of activity in a vocal control nucleus in vitro. J Neurophysiol. 2006;95:2265–2276. doi: 10.1152/jn.00836.2005. [DOI] [PMC free article] [PubMed] [Google Scholar]
- Soma KK, Bindra RK, Gee J, Wingfield JC, Schlinger BA. Androgen-metabolizing enzymes show region-specific changes across the breeding season in the brain of a wild songbird. J Neurobiol. 1999a;41:176–188. [PubMed] [Google Scholar]
- Soma KK, Hartman VN, Wingfield JC, Brenowitz EA. Seasonal changes in androgen receptor immunoreactivity in the song nucleus HVc of a wild bird. J Comp Neurol. 1999b;409:224–236. [PubMed] [Google Scholar]
- Soma KK, Schlinger BA, Wingfield JC, Saldanha CJ. Brain aromatase, 5 alpha-reductase, and 5 beta-reductase change seasonally in wild male song sparrows: relationship to aggressive and sexual behavior. J Neurobiol. 2003;56:209–221. doi: 10.1002/neu.10225. [DOI] [PubMed] [Google Scholar]
- Soma KK, Tramontin AD, Featherstone J, Brenowitz EA. Estrogen contributes to seasonal plasticity of the adult avian song control system. J Neurobiol. 2004;58:413–422. doi: 10.1002/neu.10288. [DOI] [PubMed] [Google Scholar]
- Spiro JE, Dalva MB, Mooney R. Long-range inhibition within the zebra finch song nucleus RA can coordinate the firing of multiple projection neurons. J Neurophysiol. 1999;81:3007–3020. doi: 10.1152/jn.1999.81.6.3007. [DOI] [PubMed] [Google Scholar]
- Thompson CK, Brenowitz EA. Seasonal change in neuron size and spacing but not neuronal recruitment in a basal ganglia nucleus in the avian song control system. J Comp Neurol. 2005;481:276–283. doi: 10.1002/cne.20381. [DOI] [PubMed] [Google Scholar]
- Tramontin AD, Brenowitz EA. Seasonal plasticity in the adult brain. Trends Neurosci. 2000;23:251–258. doi: 10.1016/s0166-2236(00)01558-7. [DOI] [PubMed] [Google Scholar]
- Tramontin AD, Smith GT, Breuner CW, Brenowitz EA. Seasonal plasticity and sexual dimorphism in the avian song control system: stereological measurement of neurondensity and number. J Comp Neurol. 1998;396:186–192. doi: 10.1002/(sici)1096-9861(19980629)396:2<186::aid-cne4>3.0.co;2-x. [DOI] [PubMed] [Google Scholar]
- Tramontin AD, Hartman VN, Brenowitz EA. Breeding conditions induce rapid and sequential growth in adult avian song circuits: a model of seasonal plasticity in the brain. J Neurosci. 2000;20:854–861. doi: 10.1523/JNEUROSCI.20-02-00854.2000. [DOI] [PMC free article] [PubMed] [Google Scholar]
- Tramontin AD, Perfito N, Wingfield JC, Brenowitz EA. Seasonal growth of song control nuclei precedes seasonal reproductive development in wild adult song sparrows. Gen Comp Endocrinol. 2001;122:1–9. doi: 10.1006/gcen.2000.7597. [DOI] [PubMed] [Google Scholar]
- Tramontin AD, Wingfield JC, Brenowitz EA. Androgens and estrogens induce seasonal-like growth of song nuclei in the adult songbird brain. J Neurobiol. 2003;57:130–140. doi: 10.1002/neu.10263. [DOI] [PubMed] [Google Scholar]
- von Bartheld CS, Wang X, Butowt R. Anterograde axonal transport, transcytosis, andrecycling of neurotrophic factors: the concept of trophic currencies in neural networks. Mol Neurobiol. 2001;24:1–28. doi: 10.1385/MN:24:1-3:001. [DOI] [PubMed] [Google Scholar]
- Wingfield JC, Farner D. The annual cycle of plasma irLH and steroid hormones in feralpopulations of the white-crowned sparrow, Zonotrichia leucophrys gambelii. Biol Reprod. 1978;19:1046–1056. doi: 10.1095/biolreprod19.5.1046. [DOI] [PubMed] [Google Scholar]
- Wingfield JC, Moore MC. Hormonal, social, and environmental factors in the reproductive biology of free-living male birds. In: Crews D, editor. Psychobiology of reproductive behavior: an evolutionary perspective. Englewood Cliffs, NJ: Prentice-Hall; 1987. [Google Scholar]
- Wingfield JC, Hegner RE, Lewis D. Circulating levels of luteinizing hormone and steroid hormones in relation to social status in the cooperatively breeding whitebrowed sparrow weaver, Plocepasser mahali. J Zool Soc Lond. 1991;225:43–48. [Google Scholar]
- Yu AC, Margoliash D. Temporal hierarchical control of singing in birds. Science. 1996;273:1871–1875. doi: 10.1126/science.273.5283.1871. [DOI] [PubMed] [Google Scholar]
- Zakon HH. The effects of steroid hormones on electrical activity of excitable cells. Trends Neurosci. 1998;21:202–207. doi: 10.1016/s0166-2236(97)01209-5. [DOI] [PubMed] [Google Scholar]