

Abstract
Recruitment of release-ready vesicles at synapses is one of the important factors, which determine dynamic properties of signaling between neurons in the brain. It has been shown that the rate of vesicle recruitment is accelerated by strong synaptic activity. An elevated concentration of calcium ions in the presynaptic terminal ([Ca2+]i) has been proposed to be responsible for this effect. However, the precise relationship between [Ca2+]i and recruitment has not been established yet, and the functional consequences of accelerated recruitment during synaptic activity have not been quantified experimentally. To probe the intracellular Ca2+ dependence of vesicle recruitment and to examine its functional role during trains of action potential (AP)-like stimuli, we monitored [Ca2+]i and synaptic responses simultaneously with paired recordings at the calyx of Held synapse. We found that a distinct, rapidly releasing vesicle pool is replenished with a rate that increases linearly with [Ca2+]i, without any apparent cooperativity. The slope factor for this increase is ∼1 pool/(μm·s). Blocking Ca2+-dependent recruitment specifically with a calmodulin binding peptide revealed that the steady-state EPSCs during 100 Hz AP-like trains were maintained through this Ca2+-dependent recruitment mechanism. Using a simple model of vesicle dynamics, we estimated that the recruitment rate accelerated 10-fold during the steady-state compared with the rate at resting [Ca2+]i. We could also demonstrate an approximate sixfold increase in release probability (facilitation) during the initial 5–15 AP-like stimuli of such trains in our experimental condition, regardless of EPSC depression.
Keywords: vesicle recruitment, calcium, neurotransmitter release, vesicle pool, short-term plasticity, calyx of Held
Introduction
Synaptic strength is determined by the product of quantal size, the number of release-ready vesicles, and the probability that a given vesicle is being released during a presynaptic action potential (AP) (Katz, 1969). These parameters can be modulated dynamically in a short time window (tens of milliseconds to several minutes), and such modulation causes short-term synaptic plasticity (von Gersdorff and Borst, 2002; Zucker and Regehr, 2002).
Vesicle depletion is thought to be the dominating mechanism for short-term synaptic depression during high-frequency stimulation at excitatory synapses, such as hippocampal neurons (Rosenmund and Stevens, 1996), the calyx of Held (von Gersdorff et al., 1997; Weis et al., 1999; Wu and Borst, 1999), and other synapses (Model et al., 1975). However, it has been recognized that depressed steady-state release during high-frequency stimulation is much higher than expected on the basis of the relatively slow recovery from depression after spike trains (Kusano and Landau, 1975; Glavinovic and Narahashi, 1988; Neher, 1998; Zucker and Regehr, 2002). To account for the discrepancy between the observed and the expected steady-state release, an acceleration of the recruitment was postulated as either a consequence of the preceding release (Worden et al., 1997) or, more specifically, a consequence of elevated intraterminal Ca2+ concentration ([Ca2+]i) (Gingrich and Byrne, 1985; Dittman and Regehr, 1998; Stevens and Wesseling, 1998; Wang and Kaczmarek, 1998). Such mechanisms are able to describe many features of short-term plasticity (Dittman and Regehr, 1998; Saviane and Silver, 2006). However, underlying models make untested assumptions about some of the parameters such as the [Ca2+]i time courses, pool sizes, and release probabilities, because these parameters were experimentally inaccessible or difficult to measure directly at presynaptic terminals of small size.
To test such assumptions in the models, we chose a preparation with a large presynaptic terminal, the calyx of Held synapse. This enabled us to voltage clamp presynaptic and postsynaptic neurons simultaneously (Forsythe, 1994; Borst et al., 1995) and to control and measure presynaptic [Ca2+]i directly (Borst et al., 1995; Helmchen et al., 1997). Quantitative analysis so far has demonstrated that the vesicle pool at the calyx of Held is very large and heterogeneous (fast-releasing and slow-releasing pool) (Sakaba and Neher, 2001c; Wölfel and Schneggenburger, 2003) and that the majority of synchronous release (the release tightly coupled to APs) is contributed by the fast-releasing vesicle pool (Sakaba, 2006). Previous work has provided strong evidence for Ca2+-dependent acceleration of recovery from depression in the fast-releasing pool or in the AP-evoked EPSCs (Wang and Kaczmarek, 1998; Sakaba and Neher, 2001c). However, [Ca2+]i was not measured in these previous studies, and the precise relationship between the rate of vesicle recruitment and [Ca2+]i was not established. In addition, it has not been determined whether [Ca2+]i would rise high enough and for sufficient time to explain the enhanced vesicle availability during and after AP train stimulation. In the present study, we examined the relationship between vesicle recruitment and [Ca2+]i quantitatively by monitoring synaptic responses and [Ca2+]i simultaneously. We found that vesicle recruitment is enhanced linearly with the globally averaged presynaptic [Ca2+]i.
Materials and Methods
Electrophysiology and Ca2+ measurement.
Transverse brainstem slices (180–200 μm in thickness) containing the medial nucleus of the trapezoid body (MNTB) were prepared from 8- to 10-d-old Wistar rats, as described previously (Borst et al., 1995; Neher and Sakaba, 2001). All experiments were performed in accordance with local guidelines. The standard extracellular solution contained the following (in mm): 125 NaCl, 2.5 KCl, 2 CaCl2, 1 MgCl2, 25 glucose, 25 NaHCO3, 1.25 NaH2PO4, 0.4 ascorbic acid, 3 myoinositol, and 2 Na-pyruvate (pH 7.4 when bubbled with 95% O2 and 5% CO2). During recordings, 1 μm TTX, 10 mm tetraethylammonium (TEA)-Cl and 50 μm d-AP-5 were added to the extracellular solution to isolate presynaptic Ca2+ currents and postsynaptic AMPA-receptor-mediated EPSCs. In addition, 100 μm cyclothiazide and 2 mm γ-d-glutamylglycine (γDGG) were included in the bath solution to prevent desensitization and saturation of postsynaptic AMPA receptors, respectively (Neher and Sakaba, 2001). A presynaptic terminal (a calyx of Held) and the postsynaptic MNTB principal neuron were simultaneously whole-cell clamped at −80 mV with an EPC10/2 amplifier (HEKA Elektronik, Lambrecht/Pfalz, Germany) at room temperature (22–24°C). Presynaptic terminals were stimulated by either long-lasting depolarization (10 or 50 ms) or trains of short pulses simulating APs. Liquid junction potential was not corrected in this study. The presynaptic patch pipette (4–6 MΩ) solution contained the following (in mm): 135–140 Cs-gluconate, 20 TEA-Cl, 10 HEPES, 5 Na2-phosphocreatine, 4 MgATP, 0.3 NaGTP, 0.1 fura-4F (Ca2+ indicator dye), and 0.5 EGTA, pH 7.2; 0.5 mm EGTA was used to block facilitation and to allow separation of fast- and slow-releasing components (Sakaba and Neher, 2001a). In some experiments, the concentration of fura-4F and EGTA was changed. The presynaptic series resistance was compensated by 50–90%. To activate presynaptic Ca2+ currents maximally, all depleting pulses and second test pulses were preceded by a short (2 ms) depolarization to +70 mV (see Figs. 1 –5). The postsynaptic pipette (2–4 MΩ) contained the same solution as the presynaptic pipette except that EGTA was increased to 5 mm and fura-4F was omitted. The postsynaptic series resistance (3–9 MΩ) was compensated electrically (uncompensated resistance <3 MΩ), and the remaining resistance was further corrected off-line. We obtained fura-4F from Invitrogen (Carlsbad, CA), d-AP-5, cyclothiazide, and γDGG from Tocris Bioscience (Ellisville, MO), and calmodulin binding domain (CBD) peptide (CAM kinase II 290–309) from Calbiochem (La Jolla, CA).
Figure 1.

Short depolarizing pulses cause small Ca2+ transients and the slow recovery of the fast-releasing pool. A, A 10 ms short depolarizing pulse to 0 mV (preceded by a 2 ms pulse to +70 mV) was applied to a presynaptic calyx terminal to deplete the fast-releasing pool (release time constant, 2–3 ms). At 500 ms later, a test pulse (50 ms pulse to 0 mV preceded by 2 ms pulse to +70 mV) was applied (solid line). The evoked EPSC was recorded from the postsynaptic cell (a principal cell of the MNTB) at a holding potential of −80 mV and presynaptic [Ca]i was simultaneously measured (line with circles). Presynaptic calcium currents (I Ca) and EPSCs are also shown. A response to single unpaired test pulse was used as a reference (dotted trace). B, Traces of EPSC, release rate, and cumulative release (top to bottom) are shown for the same cell pair as in A. Dotted traces were calculated from a reference EPSC obtained by a single unpaired test pulse. Solid traces were obtained by a test pulse paired with a 10 ms short pulse at an ISI of 500 ms. C, Mean recovered fraction of the fast-releasing component (left axis) was plotted against ISIs. Individual data points are averages from at least three cell pairs and fitted with a single-exponential function (time constant, 6.08 s), slightly faster than its Ca2+-independent value (see Results). Error bars indicate SEM in this and subsequent figures. The averaged trace of presynaptic Ca2+ transients (such as that in the middle panel of A) is plotted on the same timescale (right y-axis, gray open circles). The decay of the averaged Ca2+ transient was fitted with a double exponential [solid line, time constants of 39 ms (88%) and 2.3 s]. The inset shows a magnified view for short ISIs.
Figure 2.

Longer pulses cause large Ca2+ transient and accelerate the rapid recovery of the fast-releasing pool. The experimental protocol was the same as in Figure 1, except that the first pulse in each pair pulse was prolonged to 50 ms and used as a reference (dotted trace). In C, the data points, which represent the recovery time course, were fitted with a double-exponential function. Fast time constant is 263 ms (56%), and slow one is 3.15 s. The [Ca2+]i decay was fitted with a double-exponential decay [black line; fast time constant, 154 ms (88%); slow time constant, 2.1 s].
Figure 3.

Probing Ca2+ dependence of fast-releasing vesicle recruitment. A, The top trace shows the pulse protocol, which consists of a 10 ms short pulse to 0 mV (preceded by a 2 ms pulse to +70 mV), followed by additional mild depolarization of different amplitudes (−80 to −28 mV) for 250 ms. After repolarization to −80 mV for 500 ms, a test pulse was applied (fixed ISI of 750 ms) to probe the filling state of the vesicle pools. As a reference, a response to an unpaired single test pulse was recorded (dotted line). B, Traces of EPSC, release rate, and cumulative release from the same cell pair in A. The individual traces correspond to those in A with the same color code. C, The index of recovery (see Materials and Methods) was plotted against the integral of presynaptic [Ca2+]i (top), that of presynaptic [Ca2+]i 2 (middle), and that of presynaptic [Ca2+]i 3 (bottom) (red open circles). The values from the 50 ms double-pulse protocol of Figure 2 (black open triangles) and those from an experiment using 12 mm EGTA/6 mm Ca2+ (blue open squares) are also included in this plot (values for ISIs less than or equal to 750 ms). The data points were fitted by linear regression, and the estimated values for the slope k are specified with the same color code.
Figure 4.
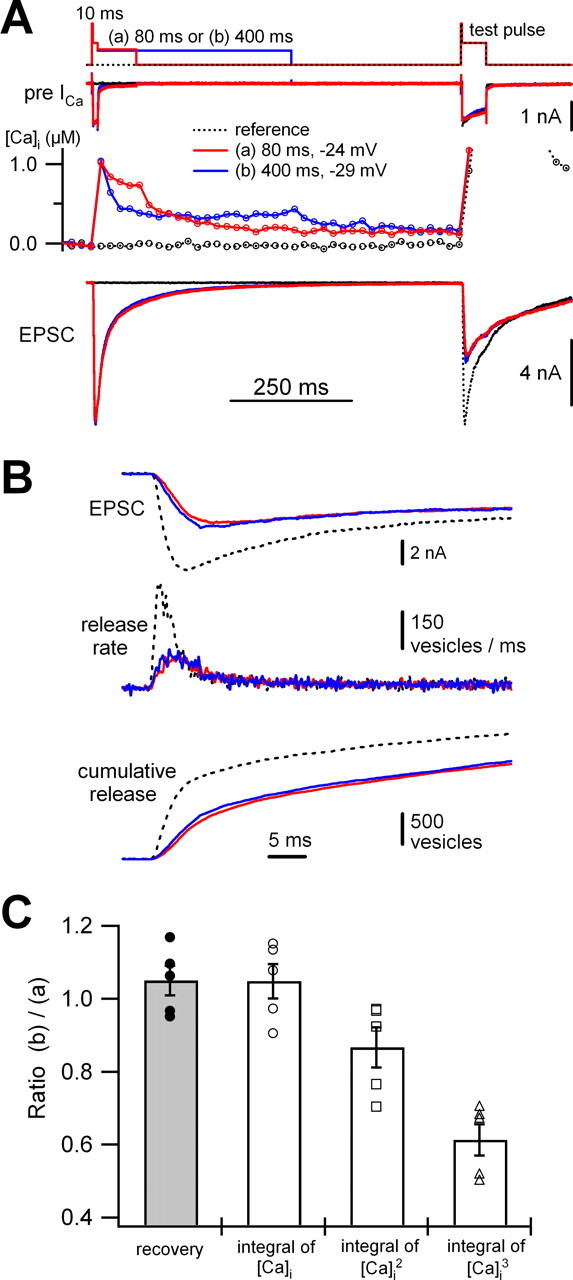
Ca2+ crossover experiments confirm the linear relationship between recovery of the fast-releasing component and the integral of [Ca2+]i. A, The 10 ms short pulse protocol of Figure 3 was modified to obtain two different shapes of Ca2+ transients with similar integrals (areas). In protocol a, a 10 ms pulse to 0 mV (preceded by 2 ms pulse to +70 mV) was followed by a short and mild depolarizing pulse (−36 to −24 mV, for 80 ms) (red line). In protocol b, a weaker and longer pulse (−40 to −29 mV, for 400 ms) was applied. The amplitudes were adjusted such that the two Ca2+ traces would cross over with similar [Ca2+]i integrals during the whole ISI (blue line). In both protocols, a test pulse was applied 750 ms (ISI) after the cessation of the 10 ms pulse. As a reference, a response to an unpaired 50 ms test pulse was recorded (dotted line). B, Traces of EPSC, release rate, and cumulative release in response to the test pulses from the cell pair of A using the same color code. C, Mean values for the ratios of recovery, the integral of [Ca2+]i, that of [Ca2+]i 2, and that of [Ca2+]i 3. For each quantity, the value obtained in protocol b was divided by that in protocol a. The mean recovered fraction itself was quite similar between the protocols (0.36 ± 0.02 in a, 0.38 ± 0.03 in b; n = 5), and these values are much higher than expected for Ca2+-independent recovery (0.75 s/10 s = 0.075). Individual data points are shown from five cell pairs. Values are given as mean ± SEM.
Figure 5.

Model simulation of recovery time courses for two different protocols with the same parameters. The recovery time courses obtained in two different sets of experiment (Figs. 1, 2) were simulated with Equation 7 (see Materials and Methods). Parameters k and k 1,b were set to 1 and 0.1 pools/(μm·s), respectively. A and B are the 50 ms double-pulse experiment (Fig. 2) and the 10 ms pulse experiment (Fig. 1), respectively. Double-exponentials fitted to the average measured Ca2+ decays in each experiment were used for simulation (top row). Simulated traces are superimposed on the experimental results (bottom row). In insets, a magnified view of the initial sections of each panel is shown, and thin line indicates contribution of Ca2+-independent recovery (τb = 10 s).
Quantal release rates were estimated by our previously developed deconvolution method, which corrects for a current component caused by delayed clearance of glutamate from the synaptic cleft (Neher and Sakaba, 2001). Release rates determined by deconvolution were integrated to obtain cumulative release. To estimate the fast component of release, cumulative release during 50 ms long-lasting depolarizations was fitted with double exponentials after correction for immediate release of the newly recruited vesicles at the end of the long depolarization (Sakaba and Neher, 2001a; Wadel et al., 2007). In responses to test pulses, there were some cases in which it was difficult to estimate the fast component reliably in such a fit, because its contribution was small. In that case, fitting was performed by fixing the time constant of the fast component to the same value as obtained in the reference response. Pooled data are expressed as mean ± SEM. Statistical significance was determined by unpaired t test.
For ratiometric Ca2+ measurement, a monochromator (Polychrome IV; TILL Photonics, Martinsried, Germany) was used to excite the Ca2+ indicator dye fura-4F, and the fluorescence signal was measured with a CCD camera (8 × 5 pixel binning, excitation at 350 and 380 nm, exposure time of 2–4 ms, cycle time of 20 ms; TILL Vision; TILL Photonics). [Ca2+]i was calculated from background-corrected fluorescence ratios (F 350/F 380), using calibration procedures that combine in vitro measurements of R max (limiting ratio at high [Ca2+]i) in small glass cuvettes and in-cell measurements of R min and R int (limiting ratios at low [Ca2+]i and at an intermediate [Ca2+]i respectively), as described previously (Grynkiewicz et al., 1985; Felmy et al., 2003). The estimated K D value of fura-4F by in vitro measurements was 1.2 μm.
Dynamic model of the fast-releasing vesicle pool.
Previous studies have presented models of Ca2+-dependent vesicle recruitment (von Ruden and Neher, 1993; Dittman and Regehr, 1998; Smith et al., 1998; Weis et al., 1999). Most of the studies assumed that [Ca2+]i regulates vesicle recruitment in a Michaelis–Menten-type manner (von Ruden and Neher, 1993; Dittman and Regehr, 1998; Smith et al., 1998). To analyze the [Ca2+]i dependence of the fast-releasing vesicle recruitment in a limited range of [Ca2+]i, we consider a vesicle pool model similar to the “binding site model” of Weis et al. (1999), in which a vesicle can bind reversibly to a binding site A and thereby convert it to state B:
 |
State B can release the vesicle in an irreversible reaction with probability ξ(t) (per unit time, depending on [Ca2+]i). It is assumed (but not shown in the schema above) that a binding site in state A is regenerated immediately on release.
Then the total number of binding sites nT is the sum of the number of sites nA and nB, which are in state A and state B, respectively:
We assume that k −1 (the backward rate from state B to state A) is constant and that the recovery rate k 1 has the following dependency on [Ca2+]i:
where k 1,b is the basal recovery rate at 0 [Ca2+]i, k is a constant, and the exponent n characterizes the cooperativity of the Ca2+ effect. The purpose of this model is to arrive at an analysis procedure that would allow us to derive the constants k and n from the data of this study.
In the absence of exocytosis [ξ(t) = 0], Scheme 1, together with Equations 2 and 3, lead to the differential equation for nB:
 |
which has the steady-state solution n B,0:
Together with
where τb is the time constant of recovery at 0 [Ca2+]i, Equation 4 can be written as
 |
This equation has a simple solution, when n B,0 is constant:
 |
where [Ca2+]i is a time-dependent quantity and n B,1 n B,0 is the number of binding sites in state B at some fixed time t1.
n B,0 at the calyx of Held is always close to nT, as shown by the lack of success in attempts to change n B,0 by changing basal [Ca2+]i (Felmy et al., 2003; Awatramani et al., 2005). Also, more detailed numerical analysis shows that only a small error is made by setting n B,0 to a fixed value nT · 0.8 < n B,0 < nT compared with letting n B,0 vary as a function of [Ca2+] and k 1. We therefore use Equation 8, assuming that k −1 is 0 (no spontaneous loss of releasable vesicles in state B to state A) for simplicity (Dittman and Regehr, 1998). This assumption means that, in the absence of release, the occupancy of the release sites at steady-state [k 1/(k 1 + k −1)] is 1 (Eq. 5). There are some indications that actually not all the release sites are release ready or occupied by release-ready vesicles (Sakaba et al., 2002; Zucker and Regehr, 2002). In fact, the size of the fast-releasing pool at the calyx of Held can be increased by an elevation of cAMP by 30% (Sakaba and Neher, 2001b; Kaneko and Takahashi, 2004). This means that, at normal cAMP levels, the relative occupancy of the release sites may not be higher than ∼0.75. However, previous attempts to modulate the releasable pool size at the calyx of Held synapse by changing basal [Ca2+]i failed (Felmy et al., 2003; Awatramani et al., 2005). This finding is in contrast to the case of chromaffin cells, in which the pool size is not constant but rather is augmented by Ca2+-dependent overfilling (von Ruden and Neher, 1993; Smith et al., 1998). However, if the occupancy in the calyx synapse is originally high at rest (>0.75), any expected increase by raising [Ca2+]i is small and might not be detectable. Considering these findings together, we can conclude that the resting occupancy of release sites at the calyx of Held synapse is constant and high enough (at least >0.75) that our assumption regarding the occupancy in the model calculation is a reasonable approximation. Calculations with a more complicated model, which explicitly allows for partial occupancy of release sites at rest (model not shown), indicate that conclusions regarding the steepness of the Ca2+ dependence of recruitment are not changed as long as occupancy is in the range of 0.8 and higher.
For studying recovery of the fast-releasing pool after a strong pool-depleting stimulus, we introduce the quantities
as the fractional relative pool sizes at time t and t 1, respectively (t 1 is the time shortly after the end of the pool-depleting pulse). With Equation 8, we obtain, after taking logarithms,
 |
After rearranging, we reach the equation
 |
for plotting data of Figure 3. For most experiments, F
1 = 0 (that means complete depletion of fast-releasing vesicle pool at t
1). In the experiment of 12 mm EGTA/6 mm Ca2+ condition, it was usually difficult to deplete the pool completely (Sakaba and Neher, 2001c). In that case, we estimated F
1 (remaining fraction of the fast pool after a first stimulus) approximately by extrapolating the exponential fit of the recovery time course to time 0 or by simulating the recovery time course with Equation 7 and the recorded [Ca2+]i signal in each cell pair. F
1 typically ranged between 0 and 0.2. We also calculated for each pulse pair the F value at the time of a second pulse (the test pulse), which is the fractional pool size (the amplitude of the fast-releasing component of the second stimulus relative to that of a control pulse). In Equation 11, the first term on the right side corresponds to the contribution of Ca2+-independent recovery, and we can subtract it from ln{(1 − F
1)/(1 − F(t))}. For convenience, we term this subtracted value [i.e., ln{(1 − F
1)/(1 − F(t))} − (t − t
1)/τb] “index of recovery” and plot this quantity against  , where the integration extends from t
1 to the beginning of the second pulse. According to the Equation 11, we should then obtain a straight line with slope k. This, of course, is only valid if we have selected the correct n value. We, therefore, performed these plots with n = 1, 2, and 3 and examined which of the exponents resulted in the plot most consistent with the expectation of a straight line. In all these analyses and simulations, we use τb = 10 s, a value found experimentally for pool recovery in the presence of 10 mm EGTA (see Results).
, where the integration extends from t
1 to the beginning of the second pulse. According to the Equation 11, we should then obtain a straight line with slope k. This, of course, is only valid if we have selected the correct n value. We, therefore, performed these plots with n = 1, 2, and 3 and examined which of the exponents resulted in the plot most consistent with the expectation of a straight line. In all these analyses and simulations, we use τb = 10 s, a value found experimentally for pool recovery in the presence of 10 mm EGTA (see Results).
Results
Short depolarizing pulses cause small Ca2+ transients and slow recovery
The calyx of Held synapse has two kinetically distinct components of release. Fast-releasing vesicles (∼1500 vesicles), which are released within ∼3 ms when the presynaptic cell is depolarized to the potential of maximum calcium inward current, and slow-releasing vesicles, which have ∼10-fold slower release kinetics (Sakaba and Neher, 2001c). The fast-releasing pool recovers after depletion in a Ca2+-dependent manner (Wang and Kaczmarek, 1998; Sakaba and Neher, 2001c). This recovery process of the fast-releasing pool has been shown to reflect recruitment of synaptic vesicles to sites in close proximity to presynaptic Ca2+ channels (Wadel et al., 2007) (but see Wölfel et al., 2007), and these fast-releasing vesicles have been shown to contribute most of the synchronous release during presynaptic APs (Sakaba, 2006). Therefore, we mainly focused on the fast-releasing vesicle recruitment when trying to uncover mechanisms of Ca2+- or activity-dependent modulation of vesicle availability in this study.
To assess the time course of recovery of the fast-releasing vesicles, we used a paired-pulse stimulation protocol while monitoring EPSCs and presynaptic [Ca2+]i. It should be noted that, in this study, spatially averaged or global [Ca2+]i was measured, not the local [Ca2+]i in microdomains that is responsible for triggering secretion. Most of the experiments were performed in the presence of 0.5 mm EGTA in the presynaptic patch pipette to separate fast-releasing and slow-releasing component reliably (Sakaba and Neher, 2001c), unless otherwise noted. First, we applied a short pulse (10 ms depolarization to 0 mV) that elicited an almost constant and maximal Ca2+ current (Fig. 1 A). This pulse length (10 ms) has been chosen long enough (approximately three times the time constant of the fast component of release) to deplete the fast-releasing pool without releasing the majority of slow-releasing vesicles (Sakaba and Neher, 2001c). After a certain interstimulus interval (ISI) (500 ms in the case of Fig. 1 A), we applied a test pulse (50 ms depolarization to 0 mV) to estimate the size of the fast-releasing pool at this ISI. The 50 ms pulse depletes all the releasable vesicles (both fast-releasing and slow-releasing vesicles) (Sakaba and Neher, 2001c, 2003a). The cumulative release was fitted by a double exponential (for details, see Materials and Methods). The amplitudes of the two components estimate pool sizes reliably, independent of release probability, which is reflected by release time constants (Sakaba and Neher, 2001b; Lin and Faber, 2002). Single 50 ms depolarizing test pulses were given between paired pulses to obtain reference responses (Fig. 1 A,B, dotted line). The cumulative release function of reference responses had fast and slow components with average time constants of 2.4 ± 0.1 ms (52.9 ± 1.4%) and 25.2 ± 1.2 ms (n = 38), respectively. Enough time (30–60 s) was always allowed between stimuli to guarantee complete recovery.
In the example of Figure 1, A and B, the presynaptic Ca2+ transient peaked at ∼1 μm during the first pulse and then decayed mostly within 30–40 ms during the ISI (Fig. 1 A). The EPSC elicited by the second stimulus had a much slower rise time and was reduced by 58% in amplitude (Fig. 1 B). Deconvolution analysis (Fig. 1 B, middle and bottom traces) revealed that the cumulative release by the second stimulus had a severely reduced fast component, which was only 3% of that of the reference response in this cell pair. Average recovered fraction of the fast-releasing vesicles is plotted against varied ISIs (Fig. 1 C). The recovery time course could be fitted by a single exponential (τ = 6.08 s), which is comparable with the recovery time course (τ = 4–5 s) obtained after low-frequency fiber stimulation in intact terminals (von Gersdorff et al., 1997; Wang and Kaczmarek, 1998; Iwasaki and Takahashi, 2001). The simultaneously measured average Ca2+ transient (Fig. 1 C) had a peak of ∼1 μm, and the decay time course could be fitted with a double exponential [fast time constant 39 ms (88%) and slow time constant 2.3 s]. The correlation between the presynaptic Ca2+ transient kinetics and the recovery time course of the fast-releasing pool is not so obvious. However, it should be noted that the recovery time course is faster than the one in the presence of a high concentration of Ca2+ buffer (10 mm EGTA; see below), which clamps volume-averaged presynaptic [Ca2+]i to almost 0. Below, we will show that this can be explained as a consequence of the small, slowly decaying component of the Ca2+ transient. Also, close inspection of the exponential fit to the recovery time course in Figure 1 C (inset) shows that the fit intercepts the y-axis at the value of 0.11, which may represent fast recovery during the rapid component of the Ca2+ transient.
Longer, fully depleting pulses cause rapid recovery
Next, we modified the previous paired-pulse protocol and prolonged the first 10 ms depleting pulse to 50 ms to elicit more Ca2+ influx to the presynaptic terminal and to induce robust Ca2+-dependent acceleration of fast-releasing vesicle recruitment (Sakaba and Neher, 2001c) (Fig. 2 A). We varied ISIs of the two 50 ms pulses to assess the recovery time course (Fig. 2).
Figure 2, presented in the same format as Figure 1, shows an example of the response to a stimulus pair at the same ISI of 500 ms as used in Figure 1. The rise time of the test EPSC in response to the second depolarization is faster than the corresponding EPSC of Figure 1 B. The test EPSC has larger amplitude despite the fact that obviously the first stimulus (50 ms) depleted the vesicle pools deeper than the first pulse in Figure 1 (10 ms). The deconvolution analysis showed that the fast component recovered to 53.4% (relative to that of the first pulse), and a plot of this quantity against ISI in Figure 2 C revealed that the fast-releasing vesicles recovered quickly during a few hundred milliseconds after the first depleting depolarization. The slow component recovered very rapidly (data not shown), in agreement with the previous studies (Sakaba and Neher, 2001c; Wadel et al., 2007). The first 50 ms pulse elicited a presynaptic Ca2+ transient (Fig. 2 A) much larger than that of the 10 ms pulse (Fig. 1 A), and the rapid component of the recovery time course mirrored the averaged Ca2+ trace with its rising phase matching quite closely that of the Ca2+ decay (Fig. 2 C, inset). The recovery is rapid while [Ca2+]i is high, and proceeds at a slower rate after [Ca2+]i has returned to values near the resting [Ca2+]i, in agreement with the model described below (see Fig. 5 A). The examples of Figures 1 and 2 also illustrate that, given the rapid sequestration of Ca2+, very strong stimuli are required to leave a prominent mark on the recovery time course after the stimulus.
Relationship between presynaptic [Ca2+]i and recovery
The results of Figures 1 and 2 demonstrate that recovery of the fast vesicle pool is Ca2+ dependent. However, mere comparison of data in Figures 1 and 2 does not allow one to distinguish a recovery mechanism that involves only [Ca2+]i as opposed to several alternatives. For instance, the data of Figure 2 do not exclude that more complete pool depletion itself, particularly depletion of the slow component, is the cause for more rapid recruitment (Wu and Borst, 1999). We therefore made additional efforts to define the relationship between recruitment of rapidly releasing vesicles and [Ca2+]i more precisely. Specifically, we examined whether the relationship is of higher order (similar to the one between synchronous release and [Ca2+]i) or linear.
We performed experiments like those in Figure 1, in which we clamped global [Ca2+]i to almost 0 by using 10 mm EGTA or to intermediate values (180 nm) by using a 12 mm EGTA/6 mm Ca2+ mixture in the presynaptic solution. The recovery time courses in these experiments could readily be fitted by single exponentials with time constants of 10 s at 0 [Ca2+]i and 3.4 s at 180 nm [Ca2+]i. The time constant of 10 s corresponds to the one of Ca2+-independent recovery (τb) (see Materials and Methods). Combining these values with that from Figure 1 C (τ = 6.08 s at an average [Ca2+]i of 88.8 nm), one can see a clear trend in the relationship between the inverse of the time constant of recovery and [Ca2+]i with a slope of 1.08 pools/(μm·s) (supplemental Fig. 1, available at www.jneurosci.org as supplemental material). However, the relationship cannot be readily extended to higher [Ca2+]i values by this type of experiments, because substantial release occurs when calyx terminals are dialyzed with high [Ca2+]i solutions during long-lasting whole-cell experiments, exhausting their secretory capacity. We, therefore, explored a wider range of [Ca2+]i and the possibility of cooperativity of Ca2+ action by manipulating the presynaptic [Ca2+]i during short episodes while recovery took place. The data were interpreted in terms of a simple vesicle pool model. In Materials and Methods, we show that the simplest such model predicts a straight line with a slope k when we plot a suitably defined index of recovery [ln{1/(1 − F(t))} − (ISI/10 s)] against the time integral of [Ca2+(t)]i n. Here, F(t) is the fraction recovered at time t after a pool-depleting pulse, as measured in Figures 1 and 2, and the integral extends over the whole ISI.
To estimate the model parameters (a slope factor k and the exponent n for cooperativity of Ca2+ action; see Equation 3 in Materials and Methods) involved in Ca2+-dependent vesicle recruitment, first, the analysis mentioned above was applied to a paired-pulse protocol similar to the one of Figure 1 for an ISI of 750 ms. According to Figure 1 C, the recovered fraction at this ISI is 0.185, which is small and almost indistinguishable from those at smaller ISIs. To manipulate the presynaptic [Ca2+]i during the ISI, we then modified the protocol by adding various depolarizing episodes of 250 ms lengths immediately after the first 10 ms pulses (Fig. 3 A), and we adjusted the potential of these episodes to elicit small amounts of Ca2+ influx without eliciting new release. This caused [Ca2+]i to decay slower or to remain at a plateau level for the entire 250 ms episode (Fig. 3 A, middle traces). Correspondingly, recovery of the rapidly releasing component was enhanced (Fig. 3 B). In Figure 3 C, we show the plot as described above for different levels of depolarization (red circles). Whenever we could observe release during the mild depolarization, the data were excluded from the analysis.
The three panels of Figure 3 C (red circles) plot the data obtained for three values of the exponent n (1, 2, and 3). In each case, the index of recovery, as defined above, is plotted against the time integral over the corresponding power of [Ca2+]i. It is apparent that the plot with n = 1 (topmost panel) shows the least scatter around the straight line fit [slope k = 1.2 pools/(μm·s)]. We also superimposed values (Fig. 3 C, black triangles) from the 50 ms double-pulse protocols of Figure 2, analyzed in exactly the same way (from the data of ISI less than or equal to 500 ms), onto those of Figure 3 C. The plot with n = 1 again has the highest correlation coefficient (r = 0.83) among these three plots. To establish the Ca2+ dependence of recovery further, we also superimposed in Figure 3 C (blue squares) the indices of recovery using the data of the experiment in which [Ca2+]i was clamped to ∼180 nm (12 mm EGTA/6 mm Ca2+, ISI less than or equal to 750 ms). The values from the three different sets of experiments matched only for n = 1, whereas there was strong divergence between the experiments for n = 2 and even more so for n = 3 (Fig. 3 C). This shows that only a linear relationship between the rate of recovery and [Ca2+]i can simultaneously describe the data of the three types of experiment. The finding that EGTA effectively slows down recovery of the fast pool further indicates that this process is well described by global [Ca2+]i, and not by domain [Ca2+]i close to Ca2+ channels (Adler et al., 1991), because EGTA would not be able to strongly affect the latter because of its slow on-rate of Ca2+ binding (Smith et al., 1984; Naraghi, 1997; Neher, 1998). Also, the data from the experiment of clamping global [Ca2+]i by EGTA/Ca2+ mixtures is in line with the data from the other protocols in which presynaptic [Ca2+]i was not clamped. Although there were small variations between the experiments, the slope factor k derived from these plots was between 0.96 and 1.3 pools/(μm·s) (Fig. 3 C, top).
Ca2+ crossover experiments support a linear relationship between recovery and the integral of [Ca2+]i
For a linear Ca2+ dependence, the recovery from depletion should be independent of the exact presynaptic Ca2+ transient waveform, as long as the integral of [Ca2+]i is similar. To confirm this expectation, we designed two protocols that would yield different Ca2+ transient waveforms in a given cell pair but keep the integrals of [Ca2+]i constant. Both protocols were a modification of the 10 ms short pulse protocol of Figure 1. In one of the traces of Figure 4 A, we applied a 10 ms depleting pulse followed by a short and mild depolarization (−36 to −24 mV, for 80 ms) (red trace, protocol a), whereas in the second one the 10 ms depleting pulse was followed by a longer and weaker depolarization (−40 to −29 mV, for 400 ms) (blue trace, protocol b). Values for the depolarizations were chosen to achieve near identity of the integrals of [Ca2+]i in the two cases, but the [Ca2+]i signals crossing over in the middle of the “mild depolarization” episode (Fig. 4 A, red trace a and blue trace b). We examined recovery of the fast-releasing pool at a fixed interval (ISI of 750 ms), such that the contribution of Ca2+-independent recovery should be the same in both protocols.
We analyzed five experiments, similar to the one displayed in Figure 4, A and B, in which the ratio of the integrated Ca2+ transients between the two protocols was 1.05 ± 0.05 (Fig. 4 C). The ratio of recovered fractions was also 1.05 ± 0.04, despite the fact that the shapes of the Ca2+ transients were quite different in the two cases (Fig. 4 C, gray bar). However, when [Ca2+]i was squared or cubed before being integrated, the integrals of the two protocols were quite different. Figure 4 C plots the ratios (integral of [Ca2+]i 2, 0.87 ± 0.06; integral of [Ca2+]i 3, 0.61 ± 0.04; n = 5). We conclude that the ratio of recovery perfectly matched that of the integral of [Ca2+]i but neither that of [Ca2+]i 2 nor that of [Ca2+]i 3. Thus, the integral of presynaptic [Ca2+]i, and not that of [Ca2+]i 2 or [Ca2+]i 3, can explain recovery of the fast-releasing component, regardless of the exact Ca2+ transient waveform.
It should be noted that, although the experiments above have confirmed that the rate of Ca2+-dependent recovery has a linear relationship to global presynaptic [Ca2+]i, calmodulin, which putatively mediates the Ca2+-dependent recovery at the calyx of Held synapse (Sakaba and Neher, 2001c), has four Ca2+-binding sites with a geometric mean dissociation constant of ∼15 μm (Xia and Storm, 2005). However, the affinity and cooperativity of calmodulin for Ca2+ can be modulated by various calmodulin-binding proteins, so that it can be activated by a wide range of physiological [Ca2+]i (0.1–10.0 μm) with varying degrees of cooperativity (Xia and Storm, 2005). We cannot address the exact molecular mechanism of Ca2+ action in the present study because our approach measures only the overall relationship between [Ca2+]i and the final output of the whole reaction, which may involve various mechanisms and types of molecules. Possible target molecules of calmodulin include Munc13 proteins, which have been shown to be involved in synaptic vesicle priming (Augustin et al., 1999; Varoqueaux et al., 2002), to interact with many other synaptic proteins (Betz et al., 2001; Martin, 2002), and to have a calmodulin binding site (Junge et al., 2004).
The finding of a linear relationship between the rate of recovery and [Ca2+]i is valid between 50 nm and ∼1 μm, which is the range of [Ca2+]i values in our experimental protocols (Figs. 3, 4). Linearity may not hold for larger [Ca2+]i values. Indeed, previous measurements of release during long-lasting depolarization or using flash photolysis indicated that steady-state release rates at [Ca2+]i >10 μm are rarely larger than 10 vesicles per millisecond (Sakaba and Neher, 2001a; Lou et al., 2005). Assuming that this release is limited by vesicle recruitment and that less than half of the release is contributed by fast-releasing vesicles, we can conclude that recruitment of these vesicles at high [Ca2+]i should not be faster than ∼5000 vesicles per second or 3.3 pools/s (taking a pool of 1500 vesicles). Considering a Ca2+-independent recruitment rate (0.1 pools/s; see Results), a Michaelis–Menten model with this limiting rate (maximum rate) and an initial slope of 1 (μm·s)−1 would have a putative K D value of 3.2 μm.
Simulation of the recovery time course
Because we measured the presynaptic [Ca2+]i time courses during the ISI (Figs. 1, 2) and know the values of k 1,b and k, the recovery time course can be simulated by solving the differential Equation 7 (see Materials and Methods) numerically. We compared such simulations with the results of Figures 1 and 2 to test the validity of our model. The values of k and k 1,b were set to 1 pool/(μm·s) (Fig. 3 C, top) and 0.1 pool/s, respectively. The step size for the simulation was 10 ms, and [Ca2+]i time courses were approximated by double-exponential decays fitted to the average measured Ca2+ decays of Figures 1 C and 2 C, as shown in Figure 5 A, top, and B, top. The simulations could fit the experimental data for both protocols without adjustment of any free parameters (Fig. 5 A, bottom, B, bottom, dotted lines). This confirms that our model accurately predicts recovery time courses under various experimental conditions with the same parameters. The thin continuous lines in Figure 5 indicate the initial slope of recovery for a Ca2+-independent process with τ = 10 s. It is clear that the Ca2+-dependent component of recovery has a dominating role after the 50 ms pulse (Fig. 5 A, bottom, inset), whereas it is less prominent after the 10 ms pulse (Fig. 5 B, bottom, inset). In particular, the Ca2+-dependent recovery is <0.05 during the initial fast phase of the Ca2+ decay in the 10 ms pulse.
Functional role of Ca2+-dependent recovery during AP-like stimulus trains
In the next series of experiment, we examined the functional role of Ca2+/calmodulin-dependent recovery of the fast-releasing pool during a more physiological AP-like stimulation. To mimic a physiological Ca2+ buffering capacity in presynaptic terminals (Helmchen et al., 1997), the presynaptic patch pipette contained only a low concentration of fura-4F (50 μm) and no EGTA in these experiments. We applied a train of 40 AP-like stimuli (depolarization to +40 mV for 0.4 ms, followed by a 0.8 ms ramp to −80 mV) at a frequency of 100 Hz. At 20 ms later, a depleting pulse (50 ms depolarization to 0 mV preceded by 2 ms pulse to +70 mV) was given to measure the remaining pool size (Fig. 6 A). Substantial depletion of the releasable pool and a rise in presynaptic [Ca2+]i is expected to occur during the late part of the stimulus train. Indeed, presynaptic [Ca2+]i remained high (>1 μm) between the 30th and the 40th EPSCs (Fig. 6 A) (supplemental Fig. 2A, available at www.jneurosci.org as supplemental material). Because 80% of fast-releasing vesicles will be depleted after 20 stimuli at 100 Hz (Sakaba, 2006), the Ca2+-dependent enhancement of recovery of the fast-releasing pool should be of major importance for maintaining fast synaptic transmission. Consistent with this hypothesis, the steady-state amplitude of EPSCs was reduced when we blocked Ca2+-dependent recovery of the fast-releasing component by introducing 20 μm CBD peptide via the presynaptic patch pipette (Fig. 6 A, compare insets in right and left panels). To quantify the effect of CBD (20 μm) on the steady-state EPSC amplitudes, the cumulative peak EPSC amplitude was plotted, and its slope between the 30th and 40th EPSCs was measured by a linear fit (Fig. 6 B). The slope in a given cell pair was normalized to the respective putative pool size (measured as the back-extrapolated value at time 0; see Discussion) (Schneggenburger et al., 1999) to cancel out variations of EPSC amplitude between cells. CBD reduced the normalized slope from 1.96 ± 0.20 s−1 (n = 6) to 1.26 ± 0.18 s−1 (n = 5; p < 0.05). The finding that CBD did not block the steady-state EPSCs completely can be explained by a partial contribution of slow-releasing vesicles to the release during the train (Sakaba, 2006). CBD also strongly affected the rising phase of the response evoked by a depleting pulse after the train stimulation (Fig. 6 A, compare right and left panels). This result indicates that CBD reduces the contribution of the remaining fast-releasing vesicles in the late train. The peak release rate during the depleting pulse in a given cell pair, as calculated by deconvolution, was divided by its total pool size (measured by a single 50 ms pulse), and averages of such normalized rates were calculated. CBD decreased the normalized peak release rate significantly (control, 0.044 ± 0.002 ms−1; CBD, 0.026 ± 0.003 ms−1; p < 0.01).
Figure 6.

Ca2+/calmodulin-dependent recovery maintains steady-state EPSCs in AP-like stimulus trains. A, Forty AP-like stimuli (depolarizations from −80 to +40 mV for 0.4 ms and ramp to −80 mV for 0.8 ms, at 100 Hz) were applied to a presynaptic terminal using patch pipettes filled with only 50 μm fura-4F and no other Ca2+ buffer. The train was followed by a depleting pulse (0 mV for 50 ms after 2 ms prepulse to +70 mV) to measure the remaining releasable pool. An example of control data are shown in the left. In the right, a calmodulin blocker (CBD, 20 μm) was included in the presynaptic patch pipette to block recovery of the fast-releasing pool. The insets show EPSCs corresponding to the 30th to 40th stimuli (indicated by black horizontal lines) at expanded scales. B, Plot of cumulative peak EPSC amplitude in control (open circles) and in the presence of CBD (filled circles) from the same cell pairs as in A. Peak amplitude of a given EPSC was determined by taking the difference between its peak value and the baseline value before each AP-like stimulus. Data points from 30th to 40th EPSCs were fitted with straight lines (Control, thin line; CBD, thick line) to obtain slopes and y-intercepts (putative pool size).
Meanwhile, CBD had little effect on presynaptic Ca2+ currents (integral of I Ca evoked by single AP-like stimulus and single 50 ms pulse: 1.17 ± 0.14 and 66.57 ± 4.52 pC in the control, n = 6; 1.03 ± 0.10 and 64.62 ± 3.00 pC in the presence of CBD, n = 5, respectively) or on the total pool size of releasable vesicles measured by a single 50 ms pulse [supplemental Fig. 2B (available at www.jneurosci.org as supplemental material), control, 3742 ± 465 vesicles; CBD, 3510 ± 502 vesicles], as reported previously (Sakaba and Neher, 2001c). There was no major difference between the averaged presynaptic [Ca2+]i time courses comparing control and CBD experiments (supplemental Fig. 2A, available at www.jneurosci.org as supplemental material). These results indicate that the Ca2+-dependent recovery of the fast-releasing component is responsible for a large fraction of steady-state EPSCs during 100 Hz AP-like train stimulation.
Model calculations on the contribution of Ca2+-dependent recovery to synchronous release during train stimulation
To evaluate the contribution of Ca2+-dependent recovery during the train stimulation (Fig. 6) in a quantitative manner, we used simulations on the basis of our simple vesicle pool model. For this purpose, the differential Equation 7 (see Materials and Methods), which holds only for ISIs without release, was extended by a term ξ(t), which represents a time-dependent rate of release from the fast-releasing pool:
 |
Here, nB(t) is the vesicle content of the fast-releasing pool, n B,0 is its steady-state value at rest (fast-releasing pool size), τb was fixed to 10 s, and n was set to 1 for a linear Ca2+ dependence. Values for n B,0 as well as for k were selected for each given cell to satisfy certain requirements, as described below. ξ(t), the release rate from the fast-releasing pool, is very similar to the synchronous release component as defined by Sakaba (2006) (supplemental data, available at www.jneurosci.org as supplemental material). However, some fraction of synchronous release is also contributed by slow-releasing vesicles (Sakaba, 2006). We, therefore, corrected synchronous release for this slow-releasing component to obtain ξ(t) for the simulation, as described in supplemental Figure 3 (available at www.jneurosci.org as supplemental material) (see also Fig. 8). The presynaptic [Ca2+]i time course was approximated by linear interpolation of the measured [Ca2+]i time course in each cell pair.
Figure 8.

Contribution of Ca2+/calmodulin-dependent recovery in synchronous release from the fast pool during train stimulation. Cumulative release of uncorrected synchronous release (release from the fast and the slow pool, gray trace) and corrected one (release from the fast pool, black trace) during 100 Hz AP-like stimulus train (for a description of the correction procedure, see supplemental data, available at www.jneurosci.org as supplemental material). To compare the result of simulations (Fig. 7) with these cumulative release traces, we plotted the difference between the fast pool size (n B,0) and the number of occupied sites, nB(t), which is equal to the number of free sites (that means the number of released vesicles without recruitment). Red lines mark the sections during which this is constant, i.e., release is balanced by recruitment (criterion of setting k value; see Fig. 7 A). An example of control results is shown in the top. These data are from the same pair as in Figure 7 A. In the bottom, the result in the presence of CBD was plotted in the same way as the top.
With this simulation, we pursued three goals. Because the model allows us to calculate the filling state of the pool at any time during the stimulus train, we can ask which recruitment rate (and indirectly which k value) leads to a constant pool size late in the train. During this period, EPSC amplitudes are constant, which means that release is exactly balanced by recruitment. Second, we were interested in the dynamics of pool occupancy throughout the train. Third, we can calculate release probability of fast-releasing vesicles for each stimulus during the train. Another interesting question is whether k values derived this way agree with those of the previous experiments (Figs. 3, 5), in which the two vesicle populations were separated kinetically by inclusion of EGTA in the presynaptic medium.
The results of the simulation are shown in Figure 7. A shows an example for the control case without CBD. The two traces in the top show the experimental data (input data to the simulation), which are an interpolated [Ca2+]i trace and a release rate, ξ(t). The bottom shows the results of the simulation, which comprise the filling state of the fast-releasing pool (nB) and the release probability (P) per remaining vesicles (lines with symbols) (Fig. 7 A). The latter values were calculated as discrete quantities for each AP-like stimulus by dividing the decrements in nB, which are the integrals of ξ(t) over the synchronous release episodes, by the remaining pool sizes. The values of P after the 20th response are averages of three each, to reduce their fluctuations, when release becomes small later in the train.
Figure 7.
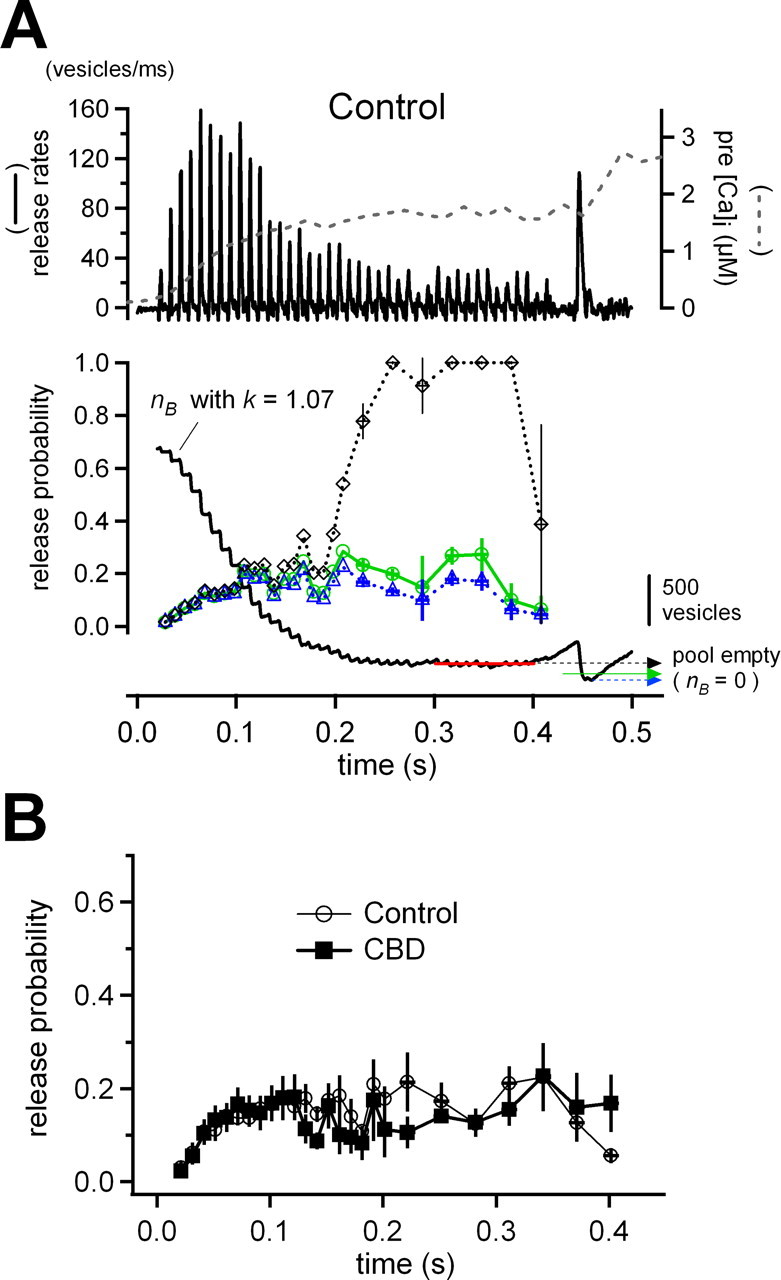
Model calculations on the synchronous release from the fast pool during train stimulation. A, Model simulation of synchronous release out of the fast-releasing pool (see Results). A typical example of control is shown. Top shows the measured synchronous release rate from the fast-releasing pool after subtraction of the contribution by slow-releasing vesicles and presynaptic [Ca2+]i (broken line). These traces are used as inputs to the model. Bottom shows the result of the simulation. The k value was adjusted so that recruitment balanced release during the late 10 stimuli (red line). The black continuous trace represents the simulated time course of nB (release-ready fast pool), and three arrows indicate the assumed 0 levels for nB. These depend on the pool definitions (see Results; black broken arrow is a lower limit and blue broken arrow is an upper limit). Lines with symbols give the release probabilities (P) based on the respective pool definitions, using the same color code. After the 20th response, the P values were averaged over every three data points. Our best estimation of the pool size was performed (green arrow) so that P would stay approximately constant during the late half of the train (green line with circles). B, Averaged P between the cell pairs estimated by our best estimation method for the control case and for experiments in the presence of CBD peptide.
At steady state, each AP-like stimulus “consumes” ∼20 vesicles, which have to be replenished in the interval between stimuli. We adjusted the k value for each given cell pair, such that recruitment exactly balanced consumption during the last 10 stimuli (Fig. 7 A, bottom, red line). Besides the k value, our model has one more free parameter, which is n B,0, the number of the fast-releasing vesicles available at the start of the train. Depending on the choice of n B,0, different nB values are reached at the end of the train. Correspondingly, estimates for P are different because they are derived as ratios of released vesicles divided by remaining pool sizes. We considered two criteria for selecting n B,0. First, we selected n B,0 such that the pool is completely emptied by the depleting pulse after the 100 Hz train stimulation (Fig. 7 A, bottom, blue broken arrow). This choice is definitely an overestimation for n B,0, because the decrement in pool size during the depleting pulse includes a contribution from the slow pool. Consequently, this assumption led to a slight decrease in release probability toward the end of the train. We then explored another limiting assumption, which is that the pool is completely emptied by each stimulus when reaching the steady state (Fig. 7 A, bottom, black broken arrow). This, by definition, leads to P values close to 1 late in the train. In practice, the calculated P values were not stable and fluctuated strongly because we had to form ratios between small fluctuating numbers. We therefore set the values to 1 when the P values became >1 or negative. The results of the P calculations using the two assumptions are shown as black and blue broken lines with different symbols (Fig. 7 A, bottom). The two estimates agree quite closely for the first 10 stimuli of trains, as long as the remaining pool is large, and the small difference between the two assumptions does not matter. Also, k values compatible with the two assumptions agree closely. P values for later stimuli, however, diverge between the two assumptions (Fig. 7 A, bottom). We, therefore, chose as our “best” estimate for n B,0 the one that produced as constant P as possible in the late part of the train (Fig. 7 A, bottom, green arrow). This seems to be a reasonable assumption given that both presynaptic [Ca2+]i and Ca2+ current are constant during this period (supplemental Fig. 2A, available at www.jneurosci.org as supplemental material) (Fig. 6 A) (ratio of 40th I Ca peak to 20th I Ca, 0.942 ± 0.008 in control, 0.928 ± 0.004 in CBD). This best fit is shown as green line with circles (Fig. 7 A, bottom).
Figure 7 B shows the averaged P obtained by our best estimate method. We also performed a similar simulation for experiments under CBD. In this case, the procedure for extracting ξ(t) from experimental data are simpler (supplemental data, available at www.jneurosci.org as supplemental material). In our simulations, the average nB (the number of remaining vesicles) during the last 10 stimuli is estimated to be 176 ± 46 vesicles in control and 73 ± 9 vesicles in the presence of CBD. This difference is ascribed to reduced vesicle recruitment, caused by CBD. In contrast, time courses of P are quite similar between control and CBD, especially before the 10th stimulus, although P in the later part of the train is relatively variable because of the small size of EPSCs under this condition (Fig. 7 B). P of a given vesicle shows marked facilitation during the first few stimuli of a train and stays high at least up to the 15th stimulus, although the evoked responses are depressing from the 10th stimulus onward (Figs. 6 A, 7 A). The increase in P parallels the increase in global [Ca2+]i (Fig. 7 A), thus demonstrating the influence of “residual calcium” on facilitation (Katz and Miledi, 1968; Zucker and Regehr, 2002) in quantitative terms. It should be mentioned that values of P up to the 15th stimulus are only minimally influenced by the assumption regarding the initial pool size (n B,0). The initial P value of the experiments shown in Figure 7 is much lower (∼0.03) compared with other studies (Wu and Borst, 1999; Iwasaki and Takahashi, 2001; Meyer et al., 2001; Taschenberger et al., 2005). Part of this difference may be attributable to the definition of the pool size (Sakaba et al., 2002; Schneggenburger and Forsythe, 2006). Also, AP-like stimuli in our protocols are relatively weak, leading to EPSCs of only −1 to −5 nA amplitude [note that 2 mm γDGG blocks EPSC amplitudes to one-third (Wadel et al., 2007)].
To learn about the contribution of Ca2+-dependent recovery, we also plotted n B,0 − nB(t), which corresponds to the number of empty release sites (Fig. 8, blue traces). In the absence of any recruitment, this number would be equal to the number of released vesicles. Therefore, the difference between this trace and cumulative release of the corrected synchronous release (Fig. 8, black traces) indicates the contribution of recruitment. In control, this component became substantial between the 10th and the 15th response, increasing later in the stimulus train (Fig. 8, top). At the 35th stimulus, the averaged contribution of recruitment to the fast-releasing pool was 0.31 ± 0.02 pools (n = 6). In the presence of the CBD peptide, the two curves were almost the same, indicating that the contribution of recruitment was much less (Fig. 8, bottom).
On average (n = 6), the estimated k value was 1.08 ± 0.13 pools/(μm·s), ranging from 0.73 to 1.5 pools/(μm·s) in control and 0.23 ± 0.07 pools/(μm·s) in the presence of CBD peptide. The latter value reflects the blocking action of CBD peptide. The value in control is quite comparable with the value obtained in the previous experiments (Figs. 3, 5) (supplemental Fig. 1, available at www.jneurosci.org as supplemental material). The estimated values for the fast pool size in control (2675 ± 491 vesicles) ranged from 1530 to 4591 and in the presence of CBD (1760 ± 203 vesicles) from 1020 to 2190. These values are within the ranges obtained in previous studies (Sakaba and Neher, 2001a,c; Sakaba, 2006), although the average was slightly larger in control than in CBD (supplemental data, available at www.jneurosci.org as supplemental material). From Equation 3 (see Materials and Methods) with a k value of 1 and a global [Ca2+]i of 1.5 μm during the 100 Hz train stimuli (supplemental Fig. 2, available at www.jneurosci.org as supplemental material), we estimated that the recruitment rate (k 1) during the train increases up to 1.6 pools/s, which is 10 times higher than the one (0.14 pools/s) estimated at a resting [Ca2+]i of 0.04 μm (Helmchen et al., 1997).
It should be mentioned that the contribution of Ca2+-dependent recovery is not constant but dynamic because presynaptic [Ca2+]i develops progressively during a stimulus train (Figs. 6, 8). Therefore, when the readily releasable pool is estimated from the time 0 intercept of a line fit to cumulative EPSC plot (Schneggenburger et al., 1999; Iwasaki and Takahashi, 2001), absolute numbers of such estimates should be taken with caution because, in that estimation, the recovery rate is assumed to be constant during the period of back-extrapolation (Schneggenburger et al., 1999; Iwasaki and Takahashi, 2001).
Discussion
The steady-state neurotransmitter release during high-frequency train stimulation reflects a balance between consumption of vesicles and the recruitment of new ones (Dittman and Regehr, 1998; Saviane and Silver, 2006). We performed several types of experiments to investigate quantitatively the Ca2+ dependence of recruitment. Based on a simple model of vesicle dynamics (see Materials and Methods), we found that the recovery rate increases linearly with global volume-averaged [Ca2+]i without any apparent cooperativity with respect to [Ca2+]i (Figs. 3, 4). The steepness of the Ca2+ dependence was also consistent with the value estimated by the analysis of synchronous release from the fast pool during a more physiological AP-like stimulus train (Figs. 7, 8). Furthermore, our model can accurately explain the recovery time courses of fast neurotransmitter release after stimulation using various experimental protocols without any adjustment of model parameters (Figs. 1, 2, 5). Using a selective blocker of Ca2+-dependent recovery (a calmodulin blocker, CBD), we demonstrated experimentally that the Ca2+ dependence of the recovery mechanism is essential for maintaining steady-state EPSCs during 100 Hz trains (Fig. 6). The model indicates that the recruitment rate of vesicles from Equation 3 in the steady state is accelerated ∼10 times above that at rest. Furthermore, the pool of release-ready vesicles is depleted during such trains (Fig. 7), whereas release probability of remaining vesicles increases.
Linear relationship between global presynaptic [Ca2+]i and vesicle recruitment
Transmitter release, facilitation, and posttetanic potentiation (PTP), as well as the Ca2+-dependent recovery of the vesicle pool (examined in this study), are all strongly dependent on presynaptic [Ca2+]i (Zucker and Regehr, 2002). Among these mechanisms, transmitter release has the highest degree of cooperativity and nonlinearity in its dependency on Ca2+ (∼4–5) with a low affinity (Meinrenken et al., 2003; Schneggenburger and Neher, 2005). This feature enables exocytosis to be triggered extremely rapidly within microdomains of elevated [Ca2+]i and to have very high temporal resolution. Conversely, it has been reported that facilitation and PTP have an almost linear relationship with the volume-averaged global [Ca2+]i (Felmy et al., 2003; Awatramani et al., 2005; Habets and Borst, 2005; Korogod et al., 2005), similar to the Ca2+ dependence of fast-pool recovery investigated in this study. Whereas triggering of exocytosis occurs in the time range of milliseconds or faster, the other three phenomena discussed here happen at a timescale of tens of milliseconds to seconds (or even to several minutes for PTP). It is certainly advantageous for these mechanisms to use the slowly changing global [Ca2+]i instead of the rapid local [Ca2+]i signals for the purpose of tracing the history of previous electrical activity. Furthermore, the fact that release is steeply Ca2+ dependent with an onset >2 μm [Ca2+]i (Bollmann et al., 2000; Schneggenburger and Neher, 2000), whereas Ca2+-dependent vesicle recruitment is efficiently augmented by global [Ca2+]i at 0.5–2 μm (Figs. 3, 6), ensures recovery to proceed effectively without loss of vesicles caused by simultaneously occurring release. Nevertheless, it should be appreciated that our experiments test recruitment only in a limited [Ca2+]i range and that the linearity, assumed in our model, may not extend to higher [Ca2+]i (as discussed in Results).
Comparison with other types of synapses
Ca2+-dependent recovery from depression has been reported not only at the calyx of Held synapse (Wang and Kaczmarek, 1998; Sakaba and Neher, 2001c) but also at a variety of other synapses including the climbing fiber to Purkinje cell synapse in the cerebellum (Dittman and Regehr, 1998), excitatory hippocampal synapses (Stevens and Wesseling, 1998), and the ribbon synapse in the retina (Gomis et al., 1999). Recovery kinetics from depression vary between different synapses with half-times ranging from less than hundreds of milliseconds (Dittman and Regehr, 1998; Wang and Kaczmarek, 1998; Moser and Beutner, 2000; Saviane and Silver, 2006) to several seconds (Stevens and Wesseling, 1998; Gomis et al., 1999). This variability may reflect distinct presynaptic [Ca2+]i time courses in different synapses or an intrinsically different speed of recovery.
Vesicle pool dynamics
The “releasable pool” of vesicles studied here (fast-releasing pool) comprises ∼1500–2000 vesicles, or three to four vesicles per active zone, assuming that the calyx has 500 active zones (Sätzler et al., 2002). In addition, there is a slow-releasing pool of approximately equal size that recovers very rapidly (Sakaba and Neher, 2001c). The combined size of these pools is much smaller than the “recycling pool,” as measured by styryl dyes (∼20,000 vesicles) (de Lange et al., 2003). Moreover, the time course of endocytosis is much slower (on the order of seconds) (Wu et al., 2005; Yamashita et al., 2005) than that of Ca2+-dependent recovery (on the order of hundreds of milliseconds) (Fig. 2). Therefore, recycling and reuse of recently exocytosed vesicles may not be of relevance for the stimulus protocols used here. Rather, we believe that recruitment of vesicles occurs from a much larger pool of vesicles in the terminal (the total number of vesicles is at least 70,000 vesicles) (Sätzler et al., 2002).
Recently, Wadel et al. (2007) showed that recovery of the fast-releasing pool reflects the recruitment of synaptic vesicles to sites in which Ca2+ channels are clustered and in which microdomain [Ca2+]i near open channels reaches values of 10–25 μm (Meinrenken et al., 2003; Schneggenburger and Neher, 2005). It is not clear, presently, whether the rate-limiting step in this recruitment is a conversion of slow-releasing vesicles to fast-releasing ones (i.e., bringing them closer to the channels) or the regeneration of docking sites near the channels after a fusion event. In both cases, one would expect the relevant processes to happen in regions of high Ca2+ influx. Therefore, one would, indeed, expect local domain [Ca2+]i to be the appropriate parameter for describing recruitment and not global [Ca2+]i. However, [Ca2+]i gradients dissipate rapidly (less than a few milliseconds), whereas in most of our experiments, vesicle recruitment happens slowly at times between stimulations (>100 ms), when there are no prominent [Ca2+]i gradients. This might be different, however, during very-high-frequency (>100 Hz) trains in the absence of Ca2+ indicator dyes (it should be noted that the Ca2+ indicator dye in our 100 Hz stimulation experiments promotes [Ca2+]i diffusion and accelerates the collapse of [Ca2+]i gradients).
Given the properties of Ca2+ dependence of recovery studied here, we can estimate that the short transient elevation of [Ca2+]i after a single AP [Δ[Ca2+]i, ∼400 nm; [Ca2+]i decay time constant, ∼100 ms; resting [Ca2+]i, 40 nm (Helmchen et al., 1997)] will refill ∼4% of the sites vacated by that AP, whereas the remainder is recovered with an estimated time constant of ∼7 s. Assuming that the single AP consumes ∼200 vesicles under the physiological condition used by Helmchen et al. (1997) (Borst and Sakmann, 1996; Schneggenburger et al., 1999; Taschenberger et al., 2005), the rapidly refilled component corresponds to approximately eight vesicles. Steady-state release during low-frequency trains of APs is therefore expected to drop with increased frequency, because this slow recovery rate cannot keep up with vesicle consumption (von Gersdorff et al., 1997). Above 10 Hz, however, presynaptic [Ca2+]i transients will overlap and the mean [Ca2+]i level during the train was shown to increase almost linearly with stimulation frequency (Helmchen et al., 1996). A strictly linear relationship between recovery rate (k 1) and [Ca2+]i together with this [Ca2+]i buildup will therefore result in an approximately frequency-independent amplitude of steady-state EPSCs in the frequency range at which EPSC size is dominated by vesicle recruitment. This expectation may well be part of the explanation for a relatively broad plateau observed in the relationship between steady-state quantal content of the EPSC and stimulation frequency (30–100 Hz) (Taschenberger et al., 2005). However, steady-state quantal output decreases at higher frequencies (>100 Hz). In that case, one of the two linearities assumed here (linear increase of mean [Ca2+]i level during the train against stimulus frequency, or linear relationship between recovery rate and [Ca2+]i) is probably not maintained. A saturation of the vesicle recruitment rate in the upper range of a Michaelis–Menten relationship, as mentioned in Results, might therefore be an important factor determining the sustained release at higher frequencies. In climbing fibers of Purkinje cell synapses (Dittman and Regehr, 1998), this limitation sets in already at 10 Hz.
In the calyx, the recruitment rate derived from the model calculation (Equation 3) is ∼10 times higher during a 100 Hz train than the recruitment rate at rest. The Ca2+-dependent enhancement of vesicle recruitment, therefore, definitely is the dominant mechanism for securing sustained release rates. Surprisingly, the effect of this powerful mechanism of maintaining release during short-duration trains can hardly be recognized in the recovery after such trains, because presynaptic [Ca2+]i after short trains drops rapidly. It is therefore readily overlooked and may well be present at other synapses. Vesicle recruitment during sustained activity is not only modulated by Ca2+ but also by cAMP (Sakaba and Neher, 2003b). We therefore believe that vesicle availability is an important regulatory element in synaptic transmission.
Footnotes
This work was supported by Grant LSHM-CT-2005-019055 from the European Commission to the EUSynapse project. Part of this work was also supported by Grant Ro 1296/5-3 from the Deutsche Forschungsgemeinschaft. We thank Holger Taschenberger for useful Igor macros and comments on this manuscript and Samuel Young and Lu-Yang Wang for critically reading this manuscript.
References
- Adler EM, Augustine GJ, Duffy SN, Charlton MP. Alien intracellular calcium chelators attenuate neurotransmitter release at the squid giant synapse. J Neurosci. 1991;11:1496–1507. doi: 10.1523/JNEUROSCI.11-06-01496.1991. [DOI] [PMC free article] [PubMed] [Google Scholar]
- Augustin I, Rosenmund C, Sudhof TC, Brose N. Munc13–1 is essential for fusion competence of glutamatergic synaptic vesicles. Nature. 1999;400:457–461. doi: 10.1038/22768. [DOI] [PubMed] [Google Scholar]
- Awatramani GB, Price GD, Trussell LO. Modulation of transmitter release by presynaptic resting potential and background calcium levels. Neuron. 2005;48:109–121. doi: 10.1016/j.neuron.2005.08.038. [DOI] [PubMed] [Google Scholar]
- Betz A, Thakur P, Junge HJ, Ashery U, Rhee JS, Scheuss V, Rosenmund C, Rettig J, Brose N. Functional interaction of the active zone proteins Munc13–1 and RIM1 in synaptic vesicle priming. Neuron. 2001;30:183–196. doi: 10.1016/s0896-6273(01)00272-0. [DOI] [PubMed] [Google Scholar]
- Bollmann JH, Sakmann B, Borst JG. Calcium sensitivity of glutamate release in a calyx-type terminal. Science. 2000;289:953–957. doi: 10.1126/science.289.5481.953. [DOI] [PubMed] [Google Scholar]
- Borst JG, Sakmann B. Calcium influx and transmitter release in a fast CNS synapse. Nature. 1996;383:431–434. doi: 10.1038/383431a0. [DOI] [PubMed] [Google Scholar]
- Borst JG, Helmchen F, Sakmann B. Pre- and postsynaptic whole-cell recordings in the medial nucleus of the trapezoid body of the rat. J Physiol (Lond) 1995;489:825–840. doi: 10.1113/jphysiol.1995.sp021095. [DOI] [PMC free article] [PubMed] [Google Scholar]
- de Lange RP, de Roos AD, Borst JG. Two modes of vesicle recycling in the rat calyx of Held. J Neurosci. 2003;23:10164–10173. doi: 10.1523/JNEUROSCI.23-31-10164.2003. [DOI] [PMC free article] [PubMed] [Google Scholar]
- Dittman JS, Regehr WG. Calcium dependence and recovery kinetics of presynaptic depression at the climbing fiber to Purkinje cell synapse. J Neurosci. 1998;18:6147–6162. doi: 10.1523/JNEUROSCI.18-16-06147.1998. [DOI] [PMC free article] [PubMed] [Google Scholar]
- Felmy F, Neher E, Schneggenburger R. Probing the intracellular calcium sensitivity of transmitter release during synaptic facilitation. Neuron. 2003;37:801–811. doi: 10.1016/s0896-6273(03)00085-0. [DOI] [PubMed] [Google Scholar]
- Forsythe ID. Direct patch recording from identified presynaptic terminals mediating glutamatergic EPSCs in the rat CNS, in vitro. J Physiol (Lond) 1994;479:381–387. doi: 10.1113/jphysiol.1994.sp020303. [DOI] [PMC free article] [PubMed] [Google Scholar]
- Gingrich KJ, Byrne JH. Simulation of synaptic depression, posttetanic potentiation, and presynaptic facilitation of synaptic potentials from sensory neurons mediating gill-withdrawal reflex in Aplysia . J Neurophysiol. 1985;53:652–669. doi: 10.1152/jn.1985.53.3.652. [DOI] [PubMed] [Google Scholar]
- Glavinovic MI, Narahashi T. Depression, recovery and facilitation of neuromuscular transmission during prolonged tetanic stimulation. Neuroscience. 1988;25:271–281. doi: 10.1016/0306-4522(88)90025-5. [DOI] [PubMed] [Google Scholar]
- Gomis A, Burrone J, Lagnado L. Two actions of calcium regulate the supply of releasable vesicles at the ribbon synapse of retinal bipolar cells. J Neurosci. 1999;19:6309–6317. doi: 10.1523/JNEUROSCI.19-15-06309.1999. [DOI] [PMC free article] [PubMed] [Google Scholar]
- Grynkiewicz G, Poenie M, Tsien RY. A new generation of Ca2+ indicators with greatly improved fluorescence properties. J Biol Chem. 1985;260:3440–3450. [PubMed] [Google Scholar]
- Habets RL, Borst JG. Post-tetanic potentiation in the rat calyx of Held synapse. J Physiol (Lond) 2005;564:173–187. doi: 10.1113/jphysiol.2004.079160. [DOI] [PMC free article] [PubMed] [Google Scholar]
- Helmchen F, Imoto K, Sakmann B. Ca2+ buffering and action potential-evoked Ca2+ signaling in dendrites of pyramidal neurons. Biophys J. 1996;70:1069–1081. doi: 10.1016/S0006-3495(96)79653-4. [DOI] [PMC free article] [PubMed] [Google Scholar]
- Helmchen F, Borst JG, Sakmann B. Calcium dynamics associated with a single action potential in a CNS presynaptic terminal. Biophys J. 1997;72:1458–1471. doi: 10.1016/S0006-3495(97)78792-7. [DOI] [PMC free article] [PubMed] [Google Scholar]
- Iwasaki S, Takahashi T. Developmental regulation of transmitter release at the calyx of Held in rat auditory brainstem. J Physiol (Lond) 2001;534:861–871. doi: 10.1111/j.1469-7793.2001.00861.x. [DOI] [PMC free article] [PubMed] [Google Scholar]
- Junge HJ, Rhee JS, Jahn O, Varoqueaux F, Spiess J, Waxham MN, Rosenmund C, Brose N. Calmodulin and Munc13 form a Ca2+ sensor/effector complex that controls short-term synaptic plasticity. Cell. 2004;118:389–401. doi: 10.1016/j.cell.2004.06.029. [DOI] [PubMed] [Google Scholar]
- Kaneko M, Takahashi T. Presynaptic mechanism underlying cAMP-dependent synaptic potentiation. J Neurosci. 2004;24:5202–5208. doi: 10.1523/JNEUROSCI.0999-04.2004. [DOI] [PMC free article] [PubMed] [Google Scholar]
- Katz B. The release of neural transmitter substances. Liverpool, UK: Liverpool UP; 1969. [Google Scholar]
- Katz B, Miledi R. The role of calcium in neuromuscular facilitation. J Physiol (Lond) 1968;195:481–492. doi: 10.1113/jphysiol.1968.sp008469. [DOI] [PMC free article] [PubMed] [Google Scholar]
- Korogod N, Lou X, Schneggenburger R. Presynaptic Ca2+ requirements and developmental regulation of posttetanic potentiation at the calyx of Held. J Neurosci. 2005;25:5127–5137. doi: 10.1523/JNEUROSCI.1295-05.2005. [DOI] [PMC free article] [PubMed] [Google Scholar]
- Kusano K, Landau EM. Depression and recovery of transmission at the squid giant synapse. J Physiol (Lond) 1975;245:13–32. doi: 10.1113/jphysiol.1975.sp010832. [DOI] [PMC free article] [PubMed] [Google Scholar]
- Lin JW, Faber DS. Modulation of synaptic delay during synaptic plasticity. Trends Neurosci. 2002;25:449–455. doi: 10.1016/s0166-2236(02)02212-9. [DOI] [PubMed] [Google Scholar]
- Lou X, Scheuss V, Schneggenburger R. Allosteric modulation of the presynaptic Ca2+ sensor for vesicle fusion. Nature. 2005;435:497–501. doi: 10.1038/nature03568. [DOI] [PubMed] [Google Scholar]
- Martin TF. Prime movers of synaptic vesicle exocytosis. Neuron. 2002;34:9–12. doi: 10.1016/s0896-6273(02)00651-7. [DOI] [PubMed] [Google Scholar]
- Meinrenken CJ, Borst JG, Sakmann B. Local routes revisited: the space and time dependence of the Ca2+ signal for phasic transmitter release at the rat calyx of Held. J Physiol (Lond) 2003;547:665–689. doi: 10.1113/jphysiol.2002.032714. [DOI] [PMC free article] [PubMed] [Google Scholar]
- Meyer AC, Neher E, Schneggenburger R. Estimation of quantal size and number of functional active zones at the calyx of held synapse by nonstationary EPSC variance analysis. J Neurosci. 2001;21:7889–7900. doi: 10.1523/JNEUROSCI.21-20-07889.2001. [DOI] [PMC free article] [PubMed] [Google Scholar]
- Model PG, Highstein SM, Bennett MV. Depletion of vesicles and fatigue of transmission at a vertebrate central synapse. Brain Res. 1975;98:209–228. doi: 10.1016/0006-8993(75)90002-5. [DOI] [PubMed] [Google Scholar]
- Moser T, Beutner D. Kinetics of exocytosis and endocytosis at the cochlear inner hair cell afferent synapse of the mouse. Proc Natl Acad Sci USA. 2000;97:883–888. doi: 10.1073/pnas.97.2.883. [DOI] [PMC free article] [PubMed] [Google Scholar]
- Naraghi M. T-jump study of calcium binding kinetics of calcium chelators. Cell Calcium. 1997;22:255–268. doi: 10.1016/s0143-4160(97)90064-6. [DOI] [PubMed] [Google Scholar]
- Neher E. Vesicle pools and Ca2+ microdomains: new tools for understanding their roles in neurotransmitter release. Neuron. 1998;20:389–399. doi: 10.1016/s0896-6273(00)80983-6. [DOI] [PubMed] [Google Scholar]
- Neher E, Sakaba T. Combining deconvolution and noise analysis for the estimation of transmitter release rates at the calyx of held. J Neurosci. 2001;21:444–461. doi: 10.1523/JNEUROSCI.21-02-00444.2001. [DOI] [PMC free article] [PubMed] [Google Scholar]
- Rosenmund C, Stevens CF. Definition of the readily releasable pool of vesicles at hippocampal synapses. Neuron. 1996;16:1197–1207. doi: 10.1016/s0896-6273(00)80146-4. [DOI] [PubMed] [Google Scholar]
- Sakaba T. Roles of the fast-releasing and the slowly releasing vesicles in synaptic transmission at the calyx of held. J Neurosci. 2006;26:5863–5871. doi: 10.1523/JNEUROSCI.0182-06.2006. [DOI] [PMC free article] [PubMed] [Google Scholar]
- Sakaba T, Neher E. Quantitative relationship between transmitter release and calcium current at the calyx of held synapse. J Neurosci. 2001a;21:462–476. doi: 10.1523/JNEUROSCI.21-02-00462.2001. [DOI] [PMC free article] [PubMed] [Google Scholar]
- Sakaba T, Neher E. Preferential potentiation of fast-releasing synaptic vesicles by cAMP at the calyx of Held. Proc Natl Acad Sci USA. 2001b;98:331–336. doi: 10.1073/pnas.021541098. [DOI] [PMC free article] [PubMed] [Google Scholar]
- Sakaba T, Neher E. Calmodulin mediates rapid recruitment of fast-releasing synaptic vesicles at a calyx-type synapse. Neuron. 2001c;32:1119–1131. doi: 10.1016/s0896-6273(01)00543-8. [DOI] [PubMed] [Google Scholar]
- Sakaba T, Neher E. Involvement of actin polymerization in vesicle recruitment at the calyx of Held synapse. J Neurosci. 2003a;23:837–846. doi: 10.1523/JNEUROSCI.23-03-00837.2003. [DOI] [PMC free article] [PubMed] [Google Scholar]
- Sakaba T, Neher E. Direct modulation of synaptic vesicle priming by GABA(B) receptor activation at a glutamatergic synapse. Nature. 2003b;424:775–778. doi: 10.1038/nature01859. [DOI] [PubMed] [Google Scholar]
- Sakaba T, Schneggenburger R, Neher E. Estimation of quantal parameters at the calyx of Held synapse. Neurosci Res. 2002;44:343–356. doi: 10.1016/s0168-0102(02)00174-8. [DOI] [PubMed] [Google Scholar]
- Sätzler K, Sohl LF, Bollmann JH, Borst JG, Frotscher M, Sakmann B, Lubke JH. Three-dimensional reconstruction of a calyx of Held and its postsynaptic principal neuron in the medial nucleus of the trapezoid body. J Neurosci. 2002;22:10567–10579. doi: 10.1523/JNEUROSCI.22-24-10567.2002. [DOI] [PMC free article] [PubMed] [Google Scholar]
- Saviane C, Silver RA. Fast vesicle reloading and a large pool sustain high bandwidth transmission at a central synapse. Nature. 2006;439:983–987. doi: 10.1038/nature04509. [DOI] [PubMed] [Google Scholar]
- Schneggenburger R, Forsythe ID. The calyx of Held. Cell Tissue Res. 2006;326:311–337. doi: 10.1007/s00441-006-0272-7. [DOI] [PubMed] [Google Scholar]
- Schneggenburger R, Neher E. Intracellular calcium dependence of transmitter release rates at a fast central synapse. Nature. 2000;406:889–893. doi: 10.1038/35022702. [DOI] [PubMed] [Google Scholar]
- Schneggenburger R, Neher E. Presynaptic calcium and control of vesicle fusion. Curr Opin Neurobiol. 2005;15:266–274. doi: 10.1016/j.conb.2005.05.006. [DOI] [PubMed] [Google Scholar]
- Schneggenburger R, Meyer AC, Neher E. Released fraction and total size of a pool of immediately available transmitter quanta at a calyx synapse. Neuron. 1999;23:399–409. doi: 10.1016/s0896-6273(00)80789-8. [DOI] [PubMed] [Google Scholar]
- Smith C, Moser T, Xu T, Neher E. Cytosolic Ca2+ acts by two separate pathways to modulate the supply of release-competent vesicles in chromaffin cells. Neuron. 1998;20:1243–1253. doi: 10.1016/s0896-6273(00)80504-8. [DOI] [PubMed] [Google Scholar]
- Smith PD, Liesegang GW, Berger RL, Czerlinski G, Podolsky RJ. A stopped-flow investigation of calcium ion binding by ethylene glycol bis(beta-aminoethyl ether)-N,N′-tetraacetic acid. Anal Biochem. 1984;143:188–195. doi: 10.1016/0003-2697(84)90575-x. [DOI] [PubMed] [Google Scholar]
- Stevens CF, Wesseling JF. Activity-dependent modulation of the rate at which synaptic vesicles become available to undergo exocytosis. Neuron. 1998;21:415–424. doi: 10.1016/s0896-6273(00)80550-4. [DOI] [PubMed] [Google Scholar]
- Taschenberger H, Scheuss V, Neher E. Release kinetics, quantal parameters and their modulation during short-term depression at a developing synapse in the rat CNS. J Physiol (Lond) 2005;568:513–537. doi: 10.1113/jphysiol.2005.093468. [DOI] [PMC free article] [PubMed] [Google Scholar]
- Varoqueaux F, Sigler A, Rhee JS, Brose N, Enk C, Reim K, Rosenmund C. Total arrest of spontaneous and evoked synaptic transmission but normal synaptogenesis in the absence of Munc13-mediated vesicle priming. Proc Natl Acad Sci USA. 2002;99:9037–9042. doi: 10.1073/pnas.122623799. [DOI] [PMC free article] [PubMed] [Google Scholar]
- von Gersdorff H, Borst JG. Short-term plasticity at the calyx of held. Nat Rev Neurosci. 2002;3:53–64. doi: 10.1038/nrn705. [DOI] [PubMed] [Google Scholar]
- von Gersdorff H, Schneggenburger R, Weis S, Neher E. Presynaptic depression at a calyx synapse: the small contribution of metabotropic glutamate receptors. J Neurosci. 1997;17:8137–8146. doi: 10.1523/JNEUROSCI.17-21-08137.1997. [DOI] [PMC free article] [PubMed] [Google Scholar]
- von Ruden L, Neher E. A Ca-dependent early step in the release of catecholamines from adrenal chromaffin cells. Science. 1993;262:1061–1065. doi: 10.1126/science.8235626. [DOI] [PubMed] [Google Scholar]
- Wadel K, Neher E, Sakaba T. The coupling between synaptic vesicles and Ca2+ channels determines fast neurotransmitter release. Neuron. 2007;53:563–575. doi: 10.1016/j.neuron.2007.01.021. [DOI] [PubMed] [Google Scholar]
- Wang LY, Kaczmarek LK. High-frequency firing helps replenish the readily releasable pool of synaptic vesicles. Nature. 1998;394:384–388. doi: 10.1038/28645. [DOI] [PubMed] [Google Scholar]
- Weis S, Schneggenburger R, Neher E. Properties of a model of Ca2+-dependent vesicle pool dynamics and short term synaptic depression. Biophys J. 1999;77:2418–2429. doi: 10.1016/S0006-3495(99)77079-7. [DOI] [PMC free article] [PubMed] [Google Scholar]
- Wölfel M, Schneggenburger R. Presynaptic capacitance measurements and Ca2+ uncaging reveal submillisecond exocytosis kinetics and characterize the Ca2+ sensitivity of vesicle pool depletion at a fast CNS synapse. J Neurosci. 2003;23:7059–7068. doi: 10.1523/JNEUROSCI.23-18-07059.2003. [DOI] [PMC free article] [PubMed] [Google Scholar]
- Wölfel M, Lou X, Schneggenburger R. A mechanism intrinsic to the vesicle fusion machinery determines fast and slow transmitter release at a large CNS synapse. J Neurosci. 2007;27:3198–3210. doi: 10.1523/JNEUROSCI.4471-06.2007. [DOI] [PMC free article] [PubMed] [Google Scholar]
- Worden MK, Bykhovskaia M, Hackett JT. Facilitation at the lobster neuromuscular junction: a stimulus-dependent mobilization model. J Neurophysiol. 1997;78:417–428. doi: 10.1152/jn.1997.78.1.417. [DOI] [PubMed] [Google Scholar]
- Wu LG, Borst JG. The reduced release probability of releasable vesicles during recovery from short-term synaptic depression. Neuron. 1999;23:821–832. doi: 10.1016/s0896-6273(01)80039-8. [DOI] [PubMed] [Google Scholar]
- Wu W, Xu J, Wu XS, Wu LG. Activity-dependent acceleration of endocytosis at a central synapse. J Neurosci. 2005;25:11676–11683. doi: 10.1523/JNEUROSCI.2972-05.2005. [DOI] [PMC free article] [PubMed] [Google Scholar]
- Xia Z, Storm DR. The role of calmodulin as a signal integrator for synaptic plasticity. Nat Rev Neurosci. 2005;6:267–276. doi: 10.1038/nrn1647. [DOI] [PubMed] [Google Scholar]
- Yamashita T, Hige T, Takahashi T. Vesicle endocytosis requires dynamin-dependent GTP hydrolysis at a fast CNS synapse. Science. 2005;307:124–127. doi: 10.1126/science.1103631. [DOI] [PubMed] [Google Scholar]
- Zucker RS, Regehr WG. Short-term synaptic plasticity. Annu Rev Physiol. 2002;64:355–405. doi: 10.1146/annurev.physiol.64.092501.114547. [DOI] [PubMed] [Google Scholar]