

Abstract
The amplitude fluctuations of ongoing oscillations in the electroencephalographic (EEG) signal of the human brain show autocorrelations that decay slowly and remain significant at time scales up to tens of seconds. We call these long-range temporal correlations (LRTC). Abnormal LRTC have been observed in several brain pathologies, but it has remained unknown whether genetic factors influence the temporal correlation structure of ongoing oscillations. We recorded the ongoing EEG during eyes-closed rest in 390 monozygotic and dizygotic twins and investigated the temporal structure of ongoing oscillations in the alpha- and beta-frequency bands using detrended fluctuation analysis (DFA). The strength of LRTC was more highly correlated in monozygotic than in dizygotic twins. Statistical analysis attributed up to ∼60% of the variance in DFA to genetic factors, indicating a high heritability for the temporal structure of amplitude fluctuations in EEG oscillations. Importantly, the DFA and EEG power were uncorrelated. LRTC in ongoing oscillations are robust, heritable, and independent of power, suggesting that LRTC and oscillation power are governed by distinct biophysical mechanisms and serve different functions in the brain. We propose that the DFA method is an important complement to classical spectral analysis in fundamental and clinical research on ongoing oscillations.
Keywords: ongoing oscillations, long-range temporal correlations, twins, heritability, detrended fluctuation analysis, EEG
Introduction
Oscillations are ubiquitous in neuronal systems and are believed to play an important role for working memory and neuronal representations (Engel et al., 2001; Varela et al., 2001; Buzsaki, 2006). The phase of network oscillations is known to bias the spike timing of individual neurons, which may mediate coordinated activity in spatially distributed networks with millisecond temporal resolution (Laurent, 1996; Fries, 2005). Without an oscillation, however, there is obviously no phase, suggesting that the amplitude modulation of oscillations may be equally important for coordinated neuronal activity (Canolty et al., 2006). Indeed, parametric increases in the amplitude and the duration of oscillatory activity in the theta-, alpha-, and beta-frequency bands have been observed in frontal, temporal, and parietal regions during mnemonic and attentional tasks lasting up to 10 s (Raghavachari et al., 2001; Jensen and Tesche, 2002; Jensen and Lisman, 2005).
These findings suggest that the stability of oscillations or their slow amplitude modulation may be critical for cognitive processes that require “binding” of temporally distributed activity on time scales of several seconds (Linkenkaer-Hansen et al., 2005). Stably oscillating networks, however, may not possess the flexibility that is required for swiftly adapting to new tasks or behaviors (Chialvo, 2007). Several groups have suggested that the optimal compromise between uncorrelated neuronal activity with no memory and strongly correlated activity patterns with little flexibility may be found in a so-called critical state (Chialvo and Bak, 1999; Linkenkaer-Hansen et al., 2001; Beggs and Plenz, 2003; Freeman, 2004; Drew and Abbott, 2006; Kinouchi and Copelli, 2006; Plenz and Thiagarajan, 2007). The critical state is characterized statistically in terms of power-law decaying correlations in space and time (Bak et al., 1987).
Several groups have observed that amplitude fluctuations in ongoing neuronal oscillations are characterized by slowly decaying autocorrelations of a power-law form on time scales from seconds to minutes in humans (Linkenkaer-Hansen et al., 2001, 2004; Nikulin and Brismar, 2004, 2005) and monkeys (Leopold et al., 2003). Clinical studies have observed changes in long-range temporal correlations (LRTC) in distinct brain regions and frequency bands in epilepsy (Parish et al., 2004; Monto et al., 2007) and major depressive disorder (Linkenkaer-Hansen et al., 2005).
In view of the accumulating evidence that amplitude fluctuations in ongoing oscillations carry valuable information about the state of the underlying neuronal networks, it is important to gain a better understanding of the factors that may cause subjects to differ in this temporal structure. Here we quantify the LRTC in EEG alpha and beta oscillations on time scales from 1 to 20 s using detrended fluctuation analysis (DFA) and determine the genetic contribution to LRTC using the twin design (Boomsma et al., 2002). The results indicate that the amplitude dynamics are highly heritable and that the biological mechanisms underlying LRTC are distinct from those that determine the oscillation power. The findings demonstrate unambiguously that the amplitude modulation in ongoing oscillations cannot be explained by uncontrolled experimental variables, but rather reflect genetically determined physiological parameters that influence the intrinsic dynamics of neuronal networks.
Materials and Methods
Subjects and data acquisition.
Dutch twins (n = 390, 16.5–19.5 years, 194 females) were drawn from the Netherlands Twin Register, a community-based register of twins and family members participating in a large epidemiological studies of health-related behaviors. EEG was assessed at the Psychophysiology Laboratory at the Vrije Universiteit Amsterdam, The Netherlands. Zygosity was determined by genotyping for 114 same-sex twins and by a questionnaire completed by the mother of the twins. Agreement between zygosity diagnoses based on questionnaire and genotyping was 95%. Previous papers have investigated EEG and ERP in these subjects to estimate the genetic influence on EEG coherence and the P300 component (van Beijsterveldt et al., 1998; van Beijsterveldt et al., 2001).
The spontaneous EEG was recorded during eyes-closed rest for 3 min (n = 332) or 4–6 min (n = 58). Brain electric activity was recorded using Electro-cap electrodes placed according to the international 10–20 system (n = 14 electrodes). As the reference during recordings, we used linked earlobes according to the method described by Pivik et al. (1993). The EEG data were re-referenced off-line to common-average electrode. Electrode impedances were kept <5 kΩ, the sampling rate was 250 Hz and the data were bandpass filtered at 1–35 Hz. Eye movements were recorded with the horizontal and vertical electro-oculograms.
Artifact rejection.
Independent component analysis as implemented in the EEGLAB toolbox was performed to identify maximally independent processes in the EEG data (Delorme and Makeig, 2004). Independent components corresponding to eye movements, blinks, heart beat, or breathing were manually identified based on their characteristic scalp maps and spectral signatures, and projected out of the data (Jung et al., 2000). Finally, the data were inspected in segments of 5 s using the EEGLAB data scroll viewer, which allows the user to manually mark segments with transient artifacts (e.g., muscle movements) that are to be cut away from the time series in subsequent analysis. Generally, only a small amount of data (<10 s) was lost from the removal of segments that contained nonperiodic artifacts.
Four subjects were excluded from further analysis because of severe muscle artifacts, and seven subjects were identified as outliers because of having DFA exponents >1.05 in the alpha band. Whenever a subject was removed from the database, so was the twin brother/sister. The final data comprised 80 monozygotic and 104 dizygotic twin pairs (n = 368 subjects in total).
Analysis of oscillation power and long-range temporal correlations.
We analyzed the amplitude fluctuations of alpha (8–13 Hz) and beta (15–25 Hz) oscillations. The extraction of the instantaneous amplitude of the oscillations was performed by bandpass filtering and subsequent computation of the analytic signal based on the Hilbert transform (Freeman and Rogers, 2002; Nikulin and Brismar, 2005). We used finite impulse response filters with a Hamming window and filter order of 58. The oscillation power was determined as the squared mean amplitude after bandpass filtering and Hilbert transform.
The temporal correlations of the amplitude fluctuations in the time range from 1 to 20 s were quantified using DFA (Peng et al., 1995; Chen et al., 2002). The DFA measures the scaling of the root-mean-square fluctuation of the integrated and linearly detrended signals, F(t), as a function of time window size, t. For signals that are uncorrelated or have persistent power-law correlations, the average fluctuation 〈F(t)〉 is of the form 〈F(t)〉 = tα, where α is the DFA scaling exponent. If 0.5 < α ≤ 1.0, this indicates power-law scaling behavior and the presence of temporal correlations, whereas α = 0.5 indicates the ideal case of an uncorrelated signal. Details on the temporal correlation analysis of the amplitude modulation of ongoing oscillations have been published previously (Linkenkaer-Hansen et al., 2001, 2004). The main steps from broad-band EEG data to the DFA exponent of amplitude fluctuations are shown in Figure 1.
Figure 1.
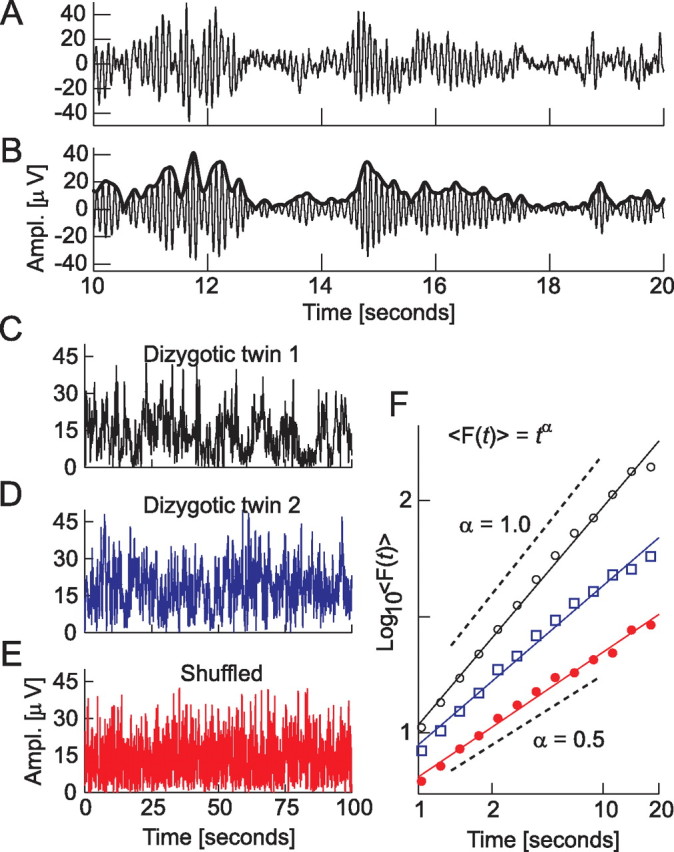
From broadband EEG to the DFA of narrow-band ongoing oscillations. A 10 s segment of EEG from occipital electrode O2 showing alpha oscillation bursts before (A) and after (B) bandpass filtering in the alpha-frequency range (8–13 Hz). We analyze the temporal structure of the amplitude (Ampl.) envelope of the oscillation, which is indicated with a thick line in B. Ongoing oscillations in the human EEG generally exhibit long-range temporal (auto-)correlations (LRTC), which are identified qualitatively as large variations in the duration and magnitude of the amplitude envelope over time as seen in the dizygotic twin siblings 1 and 2 (C, D). The temporal structure and correlations of the signal in C may be removed by randomly shuffling the signal in windows of 100 ms (E). The DFA exponent, α, provides a quantitative measure of LRTC, and the stronger correlations in dizygotic twin 1 (F, circles) compared with dizygotic twin 2 (F, squares) is reflected in a value of α closer to 1 (0.94 vs 0.68). The lack of temporal structure and correlations in E is reflected in the DFA exponent having the value of ∼0.5, which is characteristic of an uncorrelated random process (F, dots).
We also performed autocorrelation function and power spectral density analyses to confirm that these classical techniques agreed with the slow power-law decay of correlations as indicated by the DFA (Fig. 2). The power spectral density of the amplitude envelope of the oscillations was determined by means of the Welch technique with the Hamming window; it reveals the contribution of different frequencies to the total power of the signal. Uncorrelated so-called “white-noise” signals contain equal power at all frequencies, whereas long-range correlated signals have log-log linear power spectra with a nonzero power-law exponent β (a so-called 1/fβ-type signal). Periodic signals have peaks in the spectrum at frequencies that are inverses of these periods. Thus, in our analysis of the amplitude envelope, a peak would point to oscillations having a characteristic scale of modulation (Linkenkaer-Hansen et al., 2004). The autocorrelation function gives a measure of how a signal is correlated with itself at different time lags. A normalized autocorrelation function attains its maximum value of one at zero time lag, decays toward zero with increasing time lag for finite correlated signals, and fluctuates close to zero at time lags free of correlations. Signals that are modulated at a characteristic scale produce autocorrelation functions that are also modulated with the period of the characteristic scale. DFA provides a more robust estimate of the decay of correlations with increasing time scales than the autocorrelation function or power spectral density analyses and is less sensitive to the often apparent nonstationarity of electrophysiological time series (Rangarajan and Ding, 2000; Kantelhardt et al., 2001). Therefore, we used the power-law exponent from DFA to quantify the LRTC in individual subjects and channels.
Figure 2.
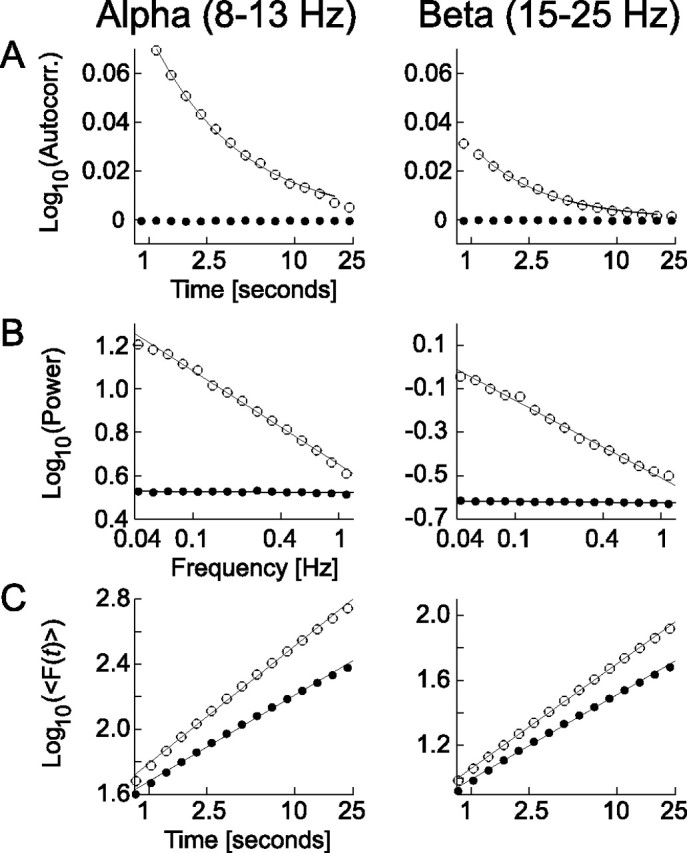
Power-law decaying correlations in the amplitude fluctuations of alpha- and beta-frequency band oscillations. Three complementary autocorrelation analyses were performed: the autocorrelation function (Autocorr., A), the power spectral density (Power, B), and the DFA (C). Each analysis was performed on the amplitude envelope of alpha and beta oscillations and averaged across the 368 subjects and 14 electrodes (open circles; see Materials and Methods). The data have been fitted with a power-law function on time scales from 1 to 20 s (black lines). The autocorrelation function is plotted semilogarithmically, because the autocorrelation function can attain negative values; power spectral density and DFA are plotted in log-log coordinates. Each analysis points to a slow decay of correlation or LRTC. The dots indicate the analysis of computer-generated white noise that is filtered identically to the EEG data. The autocorrelation function is zero at all time lags, the power spectrum is flat, and the DFA exponent is close to 0.5 for both frequency bands, showing that the bandpass filters did not introduce autocorrelations in the amplitude time series on the long time scales investigated here.
Maximum likelihood estimations of phenotypic correlations were computed between DFA exponents and power for each EEG lead (n = 14) and frequency band (n = 2). Because of the many tests performed, the significance level was set to 0.01.
Influence of signal-to-noise ratio on DFA exponents.
It has been shown previously that the amplitude envelope of narrow-bandpass filtered electromagnetic laboratory noise is temporally uncorrelated on time scales from 1 to 20 s (Linkenkaer-Hansen et al., 2001). It is therefore expected that the strength of long-range temporal correlations is underestimated in ongoing oscillations that have a low signal-to-noise ratio (SNR). To estimate the SNR at which the bias of the DFA exponent becomes an important consideration, we generated signals corresponding to 3 min of EEG at 250 Hz (45,000 samples) with different levels of correlations based on the method described by Lennon (2000) and determined the DFA exponent of these signals before and after adding uncorrelated noise (to decrease the signal-to-noise ratio). The SNR was defined as the ratio of the root-mean-square amplitude of correlated and uncorrelated signals. Thus, the root-mean-square amplitude of the correlated signal is two times larger than that of the superimposed uncorrelated signal for a SNR = 2. For each of 20 SNR levels in the range from 0.1 to 3, we generated 50 signals with and 50 signals without superimposed uncorrelated noise. It was found that largely independently of the strength of LRTC, the DFA exponent became attenuated with more than one SD at SNR <1 (Fig. 3), whereas DFA exponents were only marginally affected at SNR >2 (e.g., the average inaccuracy for a typical DFA exponent of 0.68 is <1%). From the large variation in oscillation power among the individual subjects (Fig. 4A), it is evident that not all subjects have ongoing oscillations with a high SNR in all frequency bands and electrode locations. As a conservative estimate of the level of background noise in a given frequency band in our EEG laboratory, we chose the power from the subject with the smallest signal at F3 (generally the electrode with the smallest signal). All analyses related to DFA exponents have been tested for their robustness against excluding channels that did not meet the criterion of a SNR >2.
Figure 3.
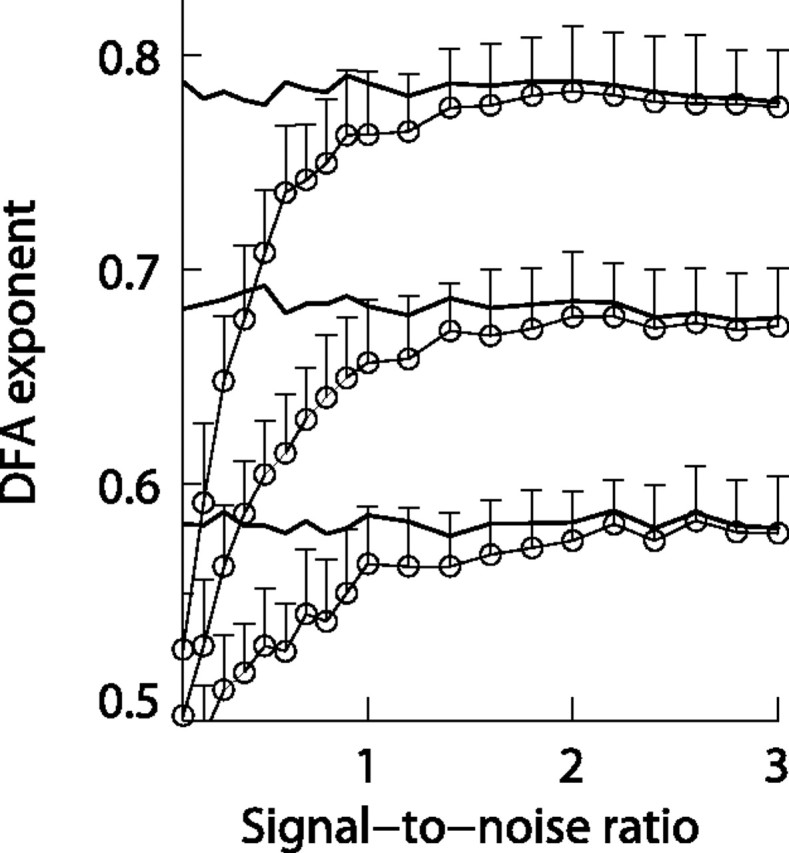
Adding uncorrelated noise to signals with LRTC marginally influence the DFA exponents at signal-to-noise ratios larger than 2. Open circles connected with thin lines indicate the mean DFA exponent of 50 computer generated signals with LRTC for 20 levels of superimposed uncorrelated noise (signal-to-noise ratio). The error bars indicate the SD (only shown upward for clarity). The thick lines indicate the mean DFA exponents of signals before adding noise. For all three levels of LRTC, the superposition of noise leads to a bias of the estimated exponent of more than one SD at SNR <1, but only has a marginal influence at SNR >2.
Figure 4.

Genetic factors shape the power and the temporal correlation structure of ongoing oscillations. The scatter plots show the logarithmically transformed power (A) and the DFA exponents (B) of monozygotic (circles, n = 80 pairs) and dizygotic (pluses, n = 104 pairs) twin pairs for alpha and beta at occipital electrode O2. That both power and DFA of alpha and beta oscillations are heritable traits is indicated by the more than two times higher correlation between monozygotic twins than between dizygotic twins. Twin correlations, r, are indicated in the plots.
Statistical genetic analysis.
The twin design is used to partition the variance of the EEG measures into additive genetic (A), nonadditive genetic (D), common environmental (C), and unique environmental components (E) (Falconer and MacKay, 1996; Boomsma et al., 2002; Posthuma et al., 2003). Additive genetic effects reflect the additive effects of the two alleles of a gene, summed over all genes that contribute to the trait. Nonadditive genetic effects (genetic dominance) reflect the nonadditive effects of alleles, summed over all genes that contribute to the trait. All nongenetic variance is referred to as environmental variance. Differences in the environment can exist both within and between families. Environmental effects that differ between families are, by definition, shared by family members (e.g., socioeconomic status) and will increase their resemblance. Environmental effects that differ within families will cause family members to be different. This last component also includes measurement error.
The contribution of each of these components to the total variance in a trait can be inferred from the covariance structure among the measures in monozygotic (MZ) and dizygotic (DZ) twin pairs. If the DZ covariance equals the MZ covariance, this suggests a contribution of common environment to trait variance. If the DZ covariance is smaller than the MZ covariance, this suggests that additive genetic effects play a role, as the genetic resemblance of MZ twins is larger than of DZ twins. Finally, if the MZ covariance is much larger than the DZ covariance, this suggests nonadditive genetic effects. Any variance that is not explained by A, D, or C is attributed to E, which can be obtained by subtraction of the MZ covariance from the total variance. Resemblance between twins is usually summarized by correlations (standardized covariances), and these correlations serve as a first indicator of whether an ACE model or an ADE model should be fitted to the observed data. The classical twin design supplies three independent statistics to infer the size of variance components, i.e., the total trait variance and the MZ and DZ covariance. Hence an ADE or an ACE model is identified based on such data. Variance components A, D or C, and E can be estimated maximum-likelihood in widely available software packages for structural equation modeling such as Mx (Neale et al., 2003). Significance of the variance components can be tested by likelihood ratio tests by comparing the likelihood of a full model (e.g., ADE) to the likelihood of a more constrained model (e.g., AE). In all models, sex was included as a fixed effect on the means. Heritability (h2) is obtained as the genetic variance (A + D) divided by the total variance (A + D + E). When the genetic model is additive (i.e., AE), one may obtain a reasonably good first estimate of heritability simply by computing twice the difference between MZ and DZ correlations as it is done in classical twin studies (Boomsma et al., 2002).
Results
Power-law decay of autocorrelations in the alpha- and beta-frequency bands
The amplitude envelope of alpha and beta oscillations was extracted using bandpass filtering and the Hilbert transform (Fig. 1A,B) (see Materials and Methods). The temporal structure of fluctuations was observed to exhibit complex fluctuations over time and varied across subjects (Fig. 1C,D), suggesting that the decay of autocorrelations is to some extent individually determined. At the group level and averaged across EEG leads, the autocorrelation function, power-spectral density, and DFA all indicated that temporal correlations of the amplitude fluctuations of ongoing oscillations exhibit a slow and smooth decay governed by a power law (Fig. 2). This finding is in agreement with previous studies (Linkenkaer-Hansen et al., 2001; Nikulin and Brismar, 2004; Parish et al., 2004; Monto et al., 2007), albeit that the duration of the EEG recordings in the present study only allowed an investigation of LRTC on time scales up to 20 s (∼1/10 of the data length). The autocorrelation function or power spectral density analyses of individual-subject data sets provide a noisy estimate of the decay of correlations with increasing time scales compared with DFA (Kantelhardt et al., 2001). The power-law exponent from DFA, in contrast, provides a robust index of the strength of long-range temporal (auto-) correlations and, therefore, was used to quantify the LRTC in individual subjects and channels in the remaining analysis. The average DFA exponents were in the range of 0.70–0.74 and 0.61–0.66 for alpha and beta, respectively. SDs were in the range of 0.08–0.11 and 0.07–0.09 (Table 1).
Table 1.
Results related to oscillation power and DFA exponents in the alpha and beta bands at all electrode locations
| All subjects (n = 368) |
Selected subjects |
||||||||||
|---|---|---|---|---|---|---|---|---|---|---|---|
| Power |
DFA |
Power vs DFA r | n | DFA h2 | Power vs DFA r | ||||||
| r(MZ) | r(DZ) | h2 | Exponent | r(MZ) | r(DZ) | h2 | |||||
| Alpha | |||||||||||
| fp1 | 0.82 | 0.44 | 82%** | 0.72 ± 0.10 | 0.60 | 0.11 | 60%** | 0.10 | 257 | 57%** | −0.07 |
| fp2 | 0.81 | 0.39 | 81%** | 0.72 ± 0.09 | 0.58 | 0.14 | 58%** | 0.11 | 256 | 56%** | −0.09 |
| F3 | 0.83 | 0.42 | 83%** | 0.70 ± 0.09 | 0.56 | 0.16 | 56%** | 0.13 | 270 | 49%** | −0.06 |
| F4 | 0.86 | 0.35 | 86%** | 0.70 ± 0.09 | 0.51 | 0.15 | 51%** | 0.17* | 283 | 49%** | 0.00 |
| F7 | 0.80 | 0.41 | 80%** | 0.71 ± 0.10 | 0.43 | 0.16 | 43%** | 0.11 | 235 | 44%* | −0.11 |
| F8 | 0.81 | 0.33 | 81%** | 0.70 ± 0.09 | 0.52 | 0.15 | 52%** | 0.13 | 247 | 52%** | −0.07 |
| C3 | 0.83 | 0.47 | 83%** | 0.70 ± 0.08 | 0.41 | 0.16 | 41%** | 0.18** | 274 | 34% | 0.03 |
| C4 | 0.85 | 0.45 | 85%** | 0.70 ± 0.08 | 0.44 | 0.19 | 44%** | 0.13 | 283 | 31% | −0.04 |
| P3 | 0.86 | 0.40 | 86%** | 0.73 ± 0.09 | 0.54 | 0.14 | 54%** | 0.12 | 308 | 48%** | −0.09 |
| P4 | 0.85 | 0.44 | 85%** | 0.73 ± 0.10 | 0.52 | 0.17 | 52%** | 0.06 | 322 | 48%** | −0.13 |
| O1 | 0.86 | 0.33 | 86%** | 0.74 ± 0.10 | 0.53 | 0.11 | 53%** | 0.02 | 349 | 51%** | −0.04 |
| O2 | 0.81 | 0.34 | 81%** | 0.73 ± 0.11 | 0.51 | 0.14 | 51%** | 0.03 | 354 | 49%** | −0.02 |
| T5 | 0.80 | 0.37 | 80%** | 0.71 ± 0.09 | 0.46 | 0.13 | 46%** | 0.02 | 303 | 34%* | −0.12 |
| T6 | 0.85 | 0.51 | 85%** | 0.71 ± 0.09 | 0.38 | 0.14 | 38%** | −0.07 | 334 | 33%* | −0.18* |
| Beta | |||||||||||
| fp1 | 0.62 | 0.37 | 62%** | 0.61 ± 0.07 | 0.44 | 0.13 | 44%** | 0.04 | 181 | 39% | −0.03 |
| fp2 | 0.60 | 0.41 | 62%** | 0.61 ± 0.07 | 0.40 | 0.25 | 43%** | 0.02 | 192 | 19% | −0.04 |
| F3 | 0.74 | 0.38 | 74%** | 0.63 ± 0.07 | 0.50 | 0.15 | 51%** | 0.23** | 269 | 43%* | 0.14 |
| F4 | 0.75 | 0.26 | 75%** | 0.63 ± 0.08 | 0.45 | 0.20 | 45%** | 0.32** | 297 | 44%** | 0.22** |
| F7 | 0.39 | 0.32 | 42%** | 0.61 ± 0.07 | 0.32 | 0.14 | 33%* | 0.03 | 170 | 63%* | 0.03 |
| F8 | 0.54 | 0.26 | 54%** | 0.61 ± 0.07 | 0.37 | 0.18 | 37%** | 0.11 | 222 | 54%** | 0.07 |
| C3 | 0.80 | 0.33 | 80%** | 0.66 ± 0.09 | 0.50 | 0.07 | 50%** | 0.24** | 251 | 43% | 0.07 |
| C4 | 0.83 | 0.35 | 83%** | 0.66 ± 0.09 | 0.48 | 0.19 | 48%** | 0.23** | 283 | 45%** | 0.13 |
| P3 | 0.86 | 0.33 | 86%** | 0.65 ± 0.08 | 0.54 | 0.11 | 54%** | 0.12 | 294 | 45%** | 0.00 |
| P4 | 0.83 | 0.40 | 84%** | 0.65 ± 0.08 | 0.45 | 0.17 | 47%** | 0.11 | 309 | 43%** | −0.01 |
| O1 | 0.83 | 0.34 | 83%** | 0.66 ± 0.09 | 0.48 | 0.00 | 47%** | 0.02 | 347 | 46%** | −0.03 |
| O2 | 0.83 | 0.38 | 83%** | 0.66 ± 0.09 | 0.45 | 0.08 | 44%** | 0.03 | 353 | 44%** | −0.02 |
| T5 | 0.72 | 0.30 | 72%** | 0.64 ± 0.08 | 0.49 | 0.11 | 49%** | −0.04 | 293 | 41%* | −0.13 |
| T6 | 0.83 | 0.47 | 83%** | 0.64 ± 0.08 | 0.39 | 0.14 | 39%** | −0.05 | 320 | 36%* | −0.13 |
MZ and DZ twin correlations are denoted r(MZ) and r(DZ), respectively. Exponent lists the average DFA exponent ± SD. The r indicates the phenotypic correlation between power and DFA exponents as given by maximum likelihood estimations. The rightmost three columns indicate number of subjects (n) that pass the signal-to-noise ratio criterion at a given electrode and the resulting heritability and phenotypic correlation from this subset of subjects. Significance levels as derived from likelihood ratio tests are as follows: *p < 0.01; **p < 0.001.
Genetic factors shape the complex time structure of ongoing oscillations
Comparing the resemblance between monozygotic twins for a trait with the resemblance between dizygotic twins offers a powerful means of estimating the extent to which genetic variation determines phenotypic variance of that trait (Boomsma et al., 2002). In agreement with previous reports, we observed that the power of alpha and beta oscillations was highly correlated between genetically identical twins and approximately twice as strongly correlated as between fraternal twins (Fig. 4A, Table 1), suggesting strong additive genetic influences on these traits (van Beijsterveldt and van Baal, 2002). The heritability across leads ranged from 80 to 86% and from 42 to 86% for alpha and beta power, respectively. Monozygotic correlations of DFA exponents of alpha and beta oscillations (Fig. 4B, Table 1) were also significantly larger than zero, indicating that LRTC are heritable, albeit slightly less than power in the same frequency bands. The heritability for DFA in the alpha and beta bands ranged from 41 to 60% and from 33 to 54%, respectively. Importantly, the twin correlations were largely the same when the analysis was performed only on the subjects and channels with a high SNR and heritability estimates remained relatively high (31–57% and 19–63% for alpha and beta, respectively, Table 1).
Dizygotic twin correlations of DFA were less than one-half the monozygotic correlations, suggesting that nonadditive genetic factors might contribute to individual variation in LRTC (see Materials and Methods). This effect, however, did not reach statistical significance. The variance that is not explained by genetic factors can be attributed to unique environmental factors, measurement noise and uncertainty of DFA estimates caused by the finite amount of data.
Conspicuous genetic influences on the temporal structure of oscillations
Small yet significant differences in DFA exponents are known to be difficult to recognize upon visual inspection (Havlin et al., 1999; Linkenkaer-Hansen et al., 2005; Monto et al., 2007). In our data, however, subjects spanned a broad range of DFA values, and clear differences in the temporal structure of amplitude fluctuations could be identified when comparing subjects with small versus high DFA exponents (Fig. 5). Moreover, regardless of whether the ongoing oscillations were characterized by low or high power, or small or large DFA exponents, monozygotic twin pairs clearly had qualitatively similar temporal fluctuation patterns (Fig. 5). This finding provides additional support for the large genetic influence on the stability and variability of ongoing oscillations.
Figure 5.

Monozygotic twins have similar temporal structure of amplitude fluctuations in ongoing oscillations. The amplitude (Ampl.) envelopes of alpha oscillations at O2 are plotted for two representative twin pairs with small (A, B) and two twin pairs with large (C, D) DFA exponents. The large DFA exponents in C and D can be recognized qualitatively as longer contiguous periods of elevated activity and less erratic fluctuations on short time scales compared with the subjects in A and B.
DFA and power are uncorrelated
To determine whether the DFA exponents and the power of oscillations reflect overlapping aspects of brain function, we correlated the two measures across subjects for each channel. Channels with a high SNR in the alpha- and beta-frequency band, e.g., the occipital and parietal leads, had correlations between DFA exponents and power that were close to zero and nonsignificant (Fig. 6A). In central and frontal scalp regions, a weak and positive correlation was observed between DFA exponents and power (Fig. 6B, Table 1). Except for beta oscillations at lead F4, these correlations were, however, not robust against exclusion of those channels in each subject that did not meet the SNR criterion (Fig. 6B, Table 1) (cf. Materials and Methods). These results suggest that the variances in LRTC and power of alpha and beta oscillations are in general truly independent.
Figure 6.
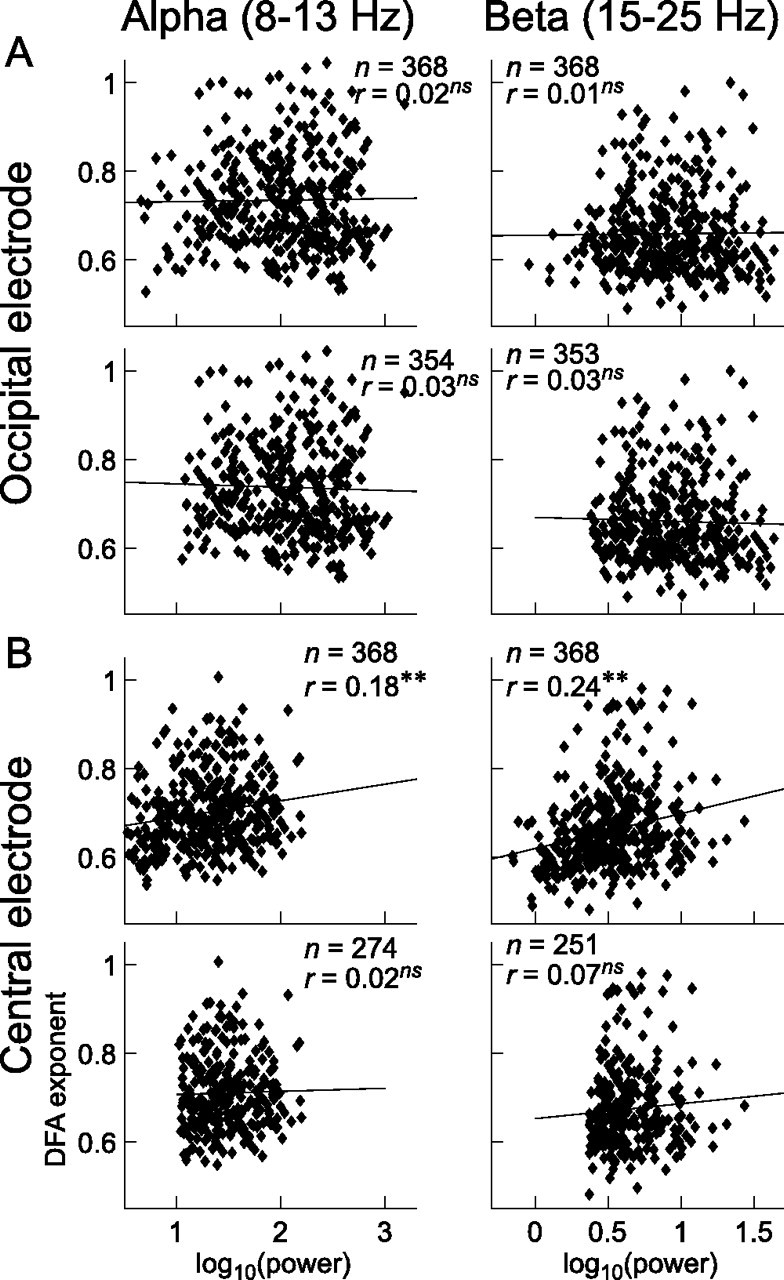
Genetic variances of DFA and power in ongoing oscillations are independent. There are no correlations between DFA exponents and power of ongoing alpha and beta oscillations at occipital electrode O2 (A), either before (upper plots) or after (lower plots) removing the subjects with a low SNR. B, At the central electrode C3, one may get the impression that DFA and oscillation power are correlated (upper plots). However, after removing 94 and 117 subjects with a low SNR in the alpha and beta band, respectively, we recover the nonsignificant zero correlation, which was observed also in occipital and parietal leads with a high SNR. The number of subjects included in each scatter plot is indicated with “n.” Significance levels of Pearson's coefficients of correlation: ns, p >0.05; **p < 0.001.
Discussion
We investigated genetic contributions to long-range temporal correlations in the amplitude fluctuations of ongoing EEG oscillations in the alpha- and beta-frequency bands during eyes-closed rest in monozygotic and dizygotic twins. The LRTC as characterized by DFA were heritable at all scalp locations in the range of 33–60%, whereas oscillation power had heritabilities of 42–86%. Importantly, the variances in DFA exponents and power were uncorrelated. The results establish that the temporal structure of fluctuations in ongoing alpha and beta oscillations is to a large extent influenced by genes. Furthermore, individual differences in LRTC and oscillation power are uncorrelated and, thus, may be governed by distinct biophysical mechanisms and serve different functions in the brain.
Genetic influences on oscillation power and LRTC
In some subjects and at some scalp locations, noninvasively recorded ongoing oscillations approach the level of the background noise in the laboratory. In those cases, the DFA exponent will be biased toward the uncorrelated temporal structure of bandpass filtered electromagnetic noise (Linkenkaer-Hansen et al., 2001). We therefore tested the robustness of all analyses against the exclusion of channels in individual frequency bands and subjects that did not have a high SNR (see Materials and Methods). In the case of genetically determined LRTC that is independent of power, one would expect the estimated heritability to be influenced only marginally by subject selection based on amplitude. Moreover, phenotypic correlations between power and DFA are expected to disappear when the SNR-bias of DFA is removed through the subject selection. This was indeed observed (Table 1), indicating that the DFA exponent may capture complementary effects to those revealed by spectral analysis of ongoing oscillations.
It has been shown previously that LRTC, as defined by a slow power-law decay of temporal autocorrelations, may also be identified with the classical autocorrelation function or power spectral density applied to the amplitude envelope of the oscillations (Linkenkaer-Hansen et al., 2001, 2004). We confirmed this at the group level (Fig. 2); however, the 3 min recordings were insufficient for a stable estimation of the power-law exponent of the autocorrelation function and power spectral density in individual subjects and channels. Thus, the heritability analysis was restricted to the index of LRTC obtained with the DFA, which is well known to provide a robust estimate of correlations in finite data (Rangarajan and Ding, 2000; Gao et al., 2006). In fact, whereas previous reports on LRTC have relied on 15 min recordings or more (Linkenkaer-Hansen et al., 2001, 2004, 2005; Leopold et al., 2003; Nikulin and Brismar, 2004, 2005; Parish et al., 2004; Monto et al., 2007), the present study has clearly documented that an informative analysis of temporal correlations up to 20 s can be performed on the basis of 3 min EEG recordings, which are often used in clinical studies.
Heritability estimates of oscillation power in our study were in close agreement with previous reports (van Beijsterveldt and van Baal, 2002; Smit et al., 2005, 2006) and very high (42–86%). The heritability of the DFA exponents (33–60%) was comparable with that of biomarkers of human brain function such as the P300 component (van Beijsterveldt and van Baal, 2002) or complexity measures derived from nonlinear dynamic systems theory (Anokhin et al., 2006). Interestingly, heritability of epilepsy is also high (∼80%) (Kjeldsen et al., 2003). In fact, epileptiform EEG features have been reported for a high proportion of healthy relatives of individuals with epilepsy (Baier and Doose, 1987; Doose, 1997), which is in line with the present results indicating a major influence of genes on the temporal structure of EEG signals.
DFA as a tool for understanding the mechanisms and functions of neuronal oscillations
From a theoretical perspective, oscillation power may vary independently of LRTC across subjects (Leopold et al., 2003). From a physiological perspective, however, overall power and the temporal modulation of neuronal oscillations could be coupled if shared genes were underlying the mechanisms that govern the formation of synchronous cell assemblies. Our results indicate that LRTC and power are independent, suggesting that LRTC and power may carry complementary functions. This is supported by recent applications of DFA analysis to ongoing oscillations in disease. In epilepsy, intracranially recorded oscillations in the interictal period are characterized by pathologically strong LRTC around the seizure locus (Parish et al., 2004; Stead et al., 2005; Monto et al., 2007), whereas mean oscillation amplitudes were not useful as indicators of the epileptic focus (Monto et al., 2007). Interestingly, Monto et al. (2007) also observed that lorazepam, a widely used antiepileptic drug, suppresses LRTC of beta oscillations close to the seizure initiation zone, whereas in healthy cortical tissue, lorazepam strengthens LRTC. In major depressive disorder, the LRTC of noninvasively recorded theta oscillations have been reported to break down almost entirely despite the lack of an effect on the oscillation amplitude (Linkenkaer-Hansen et al., 2005). These results are in line with growing evidence indicating that physiologic systems in a healthy state generate activity fluctuations on many time scales, whereas disease states are associated with too strongly correlated or too disordered dynamics (Goldberger et al., 2002; Chialvo, 2007).
At the level of cognition, sustained increase in the amplitude of oscillations in different frequency bands and brain regions have been identified during mnemonic and attentional tasks lasting up to 10 s (Raghavachari et al., 2001; Jensen and Tesche, 2002; Jensen and Lisman, 2005). We have proposed previously that temporal correlations in oscillatory activity on time scales up to tens of seconds may be important for successful performance on tasks that require coordination of neuronal activity across many time scales (Linkenkaer-Hansen et al., 2005). In line with this idea, parietal oscillations in Alzheimer's patients exhibit weaker LRTC than those in age-matched controls subjects (T. Montez, S.-S. Poil, B. Jones, I. Manshanden, J. P. A. Verbunt, B. W. van Dijk, C. J. Stam, P. Scheltens, and K. Linkenkaer-Hansen, unpublished observations).
The observation that genetic factors have a major influence on the temporal structure of ongoing oscillations increases the likelihood of finding key mechanisms that regulate the stability of the oscillations, which will also provide a better understanding of what may go wrong in disorders associated with abnormal LRTC (Parish et al., 2004; Linkenkaer-Hansen et al., 2005; Stead et al., 2005; Monto et al., 2007). Moreover, we believe that the DFA could provide a valuable complement to frequency and power analysis in characterizing the dynamics of network oscillations in computational models (Kopell et al., 2000; Jensen et al., 2005).
Outlook
For decades, fundamental and clinical research has characterized ongoing oscillations in terms of their frequency and power. Until recently, there was no reliable measure for quantifying the complicated temporal structure of spontaneously waxing and waning oscillations. The present findings of a firm genetic basis of long-range temporal correlations and the independence of DFA exponents and oscillation power provide a mechanistic rationale as to how it is possible that disease states are increasingly being linked to abnormal dynamics of ongoing oscillations. Knowing the neuronal mechanisms that shape the temporal structure of ongoing oscillations could prove an invaluable step toward the development of treatment strategies aimed at normalizing LRTC in neuronal oscillations and their associated neuronal or cognitive functions.
References
- Anokhin AP, Muller V, Lindenberger U, Heath AC, Myers E. Genetic influences on dynamic complexity of brain oscillations. Neurosci Lett. 2006;397:93–98. doi: 10.1016/j.neulet.2005.12.025. [DOI] [PMC free article] [PubMed] [Google Scholar]
- Baier WK, Doose H. Interdependence of different genetic EEG patterns in siblings of epileptic patients. Electroencephalogr Clin Neurophysiol. 1987;66:483–488. doi: 10.1016/0013-4694(87)90094-0. [DOI] [PubMed] [Google Scholar]
- Bak P, Tang C, Wiesenfeld K. Self-organized criticality: an explanation of the 1/f noise. Phys Rev Lett. 1987;59:381. doi: 10.1103/PhysRevLett.59.381. [DOI] [PubMed] [Google Scholar]
- Beggs JM, Plenz D. Neuronal avalanches in neocortical circuits. J Neurosci. 2003;23:11167–11177. doi: 10.1523/JNEUROSCI.23-35-11167.2003. [DOI] [PMC free article] [PubMed] [Google Scholar]
- Boomsma D, Busjahn A, Peltonen L. Classical twin studies and beyond. Nat Rev Genet. 2002;3:872–882. doi: 10.1038/nrg932. [DOI] [PubMed] [Google Scholar]
- Buzsaki G. Oxford: Oxford UP; 2006. Rhythms of the brain. [Google Scholar]
- Canolty RT, Edwards E, Dalal SS, Soltani M, Nagarajan SS, Kirsch HE, Berger MS, Barbaro NM, Knight RT. High gamma power is phase-locked to theta oscillations in human neocortex. Science. 2006;313:1626–1628. doi: 10.1126/science.1128115. [DOI] [PMC free article] [PubMed] [Google Scholar]
- Chen Z, Ivanov PC, Hu K, Stanley HE. Effect of nonstationarities on detrended fluctuation analysis. Phys Rev E. 2002;65:41107. doi: 10.1103/PhysRevE.65.041107. [DOI] [PubMed] [Google Scholar]
- Chialvo DR. The brain near the edge. In: Garrido PL, Marro J, Torres JJ, editors. Cooperative behavior in neural systems: ninth Granada lectures. College Park, MD: American Institute of Physics; 2007. pp. 1–12. [Google Scholar]
- Chialvo DR, Bak P. Learning from mistakes. Neuroscience. 1999;90:1137–1148. doi: 10.1016/s0306-4522(98)00472-2. [DOI] [PubMed] [Google Scholar]
- Delorme A, Makeig S. EEGLAB: an open source toolbox for analysis of single-trial EEG dynamics including independent component analysis. J Neurosci Methods. 2004;134:9–21. doi: 10.1016/j.jneumeth.2003.10.009. [DOI] [PubMed] [Google Scholar]
- Doose H. Genetic EEG traits in the pathogenesis of the epilepsies. J Epilepsy. 1997;10:97–110. [Google Scholar]
- Drew PJ, Abbott LF. Models and properties of power-law adaptation in neural systems. J Neurophysiol. 2006;96:826–833. doi: 10.1152/jn.00134.2006. [DOI] [PubMed] [Google Scholar]
- Engel AK, Fries P, Singer W. Dynamic predictions: oscillations and synchrony in top-down processing. Nat Rev Neurosci. 2001;2:704–716. doi: 10.1038/35094565. [DOI] [PubMed] [Google Scholar]
- Falconer DS, MacKay TF. Harlow, UK: Prentice Hall; 1996. Quantitative genetics. [Google Scholar]
- Freeman WJ. Origin, structure, and role of background EEG activity. Part 2. Analytic phase. Clin Neurophysiol. 2004;115:2089–2107. doi: 10.1016/j.clinph.2004.02.028. [DOI] [PubMed] [Google Scholar]
- Freeman WJ, Rogers LJ. Fine temporal resolution of analytic phase reveals episodic synchronization by state transitions in gamma EEGs. J Neurophysiol. 2002;87:937–945. doi: 10.1152/jn.00254.2001. [DOI] [PubMed] [Google Scholar]
- Fries P. A mechanism for cognitive dynamics: neuronal communication through neuronal coherence. Trends Cogn Sci. 2005;9:474–480. doi: 10.1016/j.tics.2005.08.011. [DOI] [PubMed] [Google Scholar]
- Gao J, Hu J, Tung W-W, Cao Y, Sarshar N, Roychowdhury VP. Assessment of long-range correlation in time series: how to avoid pitfalls. Phys Rev E Stat Nonlin Soft Matter Phys. 2006;73:016117. doi: 10.1103/PhysRevE.73.016117. [DOI] [PubMed] [Google Scholar]
- Goldberger AL, Amaral LAN, Hausdorff JM, Ivanov PC, Peng CK, Stanley HE. Fractal dynamics in physiology: alterations with disease and aging. Proc Natl Acad Sci USA. 2002;99:2466–2472. doi: 10.1073/pnas.012579499. [DOI] [PMC free article] [PubMed] [Google Scholar]
- Havlin S, Amaral LAN, Ashkenazy Y, Goldberger AL, Ivanov PC, Peng CK, Stanley HE. Application of statistical physics to heartbeat diagnosis. Physica A. 1999;274:99–110. doi: 10.1016/s0378-4371(99)00333-7. [DOI] [PubMed] [Google Scholar]
- Jensen O, Lisman JE. Hippocampal sequence-encoding driven by a cortical multi-item working memory buffer. Trends Neurosci. 2005;28:67–72. doi: 10.1016/j.tins.2004.12.001. [DOI] [PubMed] [Google Scholar]
- Jensen O, Tesche CD. Frontal theta activity in humans increases with memory load in a working memory task. Eur J Neurosci. 2002;15:1395–1399. doi: 10.1046/j.1460-9568.2002.01975.x. [DOI] [PubMed] [Google Scholar]
- Jensen O, Goel P, Kopell N, Pohja M, Hari R, Ermentrout B. On the human sensorimotor-cortex beta rhythm: sources and modeling. NeuroImage. 2005;26:347–355. doi: 10.1016/j.neuroimage.2005.02.008. [DOI] [PubMed] [Google Scholar]
- Jung T-P, Makeig S, Humphries C, Lee T-W, McKeown MJ, Iragui V, Sejnowski TJ. Removing electroencephalographic artifacts by blind source separation. Psychophysiology. 2000;37:163–178. [PubMed] [Google Scholar]
- Kantelhardt JW, Koscielny-Bunde E, Rego HHA, Havlin S, Bunde A. Detecting long-range correlations with detrended fluctuation analysis. Physica A. 2001;295:441–454. [Google Scholar]
- Kinouchi O, Copelli M. Optimal dynamical range of excitable networks at criticality. Nat Phys. 2006;2:348–351. [Google Scholar]
- Kjeldsen MJ, Corey LA, Christensen K, Friis ML. Epileptic seizures and syndromes in twins: the importance of genetic factors. Epilepsy Res. 2003;55:137–146. doi: 10.1016/s0920-1211(03)00117-7. [DOI] [PubMed] [Google Scholar]
- Kopell N, Ermentrout GB, Whittington MA, Traub RD. Gamma rhythms and beta rhythms have different synchronization properties. Proc Natl Acad Sci USA. 2000;97:1867–1872. doi: 10.1073/pnas.97.4.1867. [DOI] [PMC free article] [PubMed] [Google Scholar]
- Laurent G. Dynamical representation of odors by oscillating and evolving neural assemblies. Trends Neurosci. 1996;19:489–496. doi: 10.1016/S0166-2236(96)10054-0. [DOI] [PubMed] [Google Scholar]
- Lennon JJ. Red-shifts and red herrings in geographical ecology. Ecography. 2000;23:101–113. [Google Scholar]
- Leopold DA, Murayama Y, Logothetis NK. Very slow activity fluctuations in monkey visual cortex: implications for functional brain imaging. Cereb Cortex. 2003;13:422–433. doi: 10.1093/cercor/13.4.422. [DOI] [PubMed] [Google Scholar]
- Linkenkaer-Hansen K, Nikouline VV, Palva JM, Ilmoniemi RJ. Long-range temporal correlations and scaling behavior in human brain oscillations. J Neurosci. 2001;21:1370–1377. doi: 10.1523/JNEUROSCI.21-04-01370.2001. [DOI] [PMC free article] [PubMed] [Google Scholar]
- Linkenkaer-Hansen K, Nikulin VV, Palva JM, Kaila K, Ilmoniemi RJ. Stimulus-induced change in long-range temporal correlations and scaling behaviour of sensorimotor oscillations. Eur J Neurosci. 2004;19:203–218. doi: 10.1111/j.1460-9568.2004.03116.x. [DOI] [PubMed] [Google Scholar]
- Linkenkaer-Hansen K, Monto S, Rytsälä H, Suominen K, Isometsä E, Kähkönen S. Breakdown of long-range temporal correlations in theta oscillations in patients with major depressive disorder. J Neurosci. 2005;25:10131–10137. doi: 10.1523/JNEUROSCI.3244-05.2005. [DOI] [PMC free article] [PubMed] [Google Scholar]
- Monto S, Vanhatalo S, Holmes MD, Palva JM. Epileptogenic neocortical networks are revealed by abnormal temporal dynamics in seizure-free subdural EEG. Cereb Cortex. 2007;17:1386–1393. doi: 10.1093/cercor/bhl049. [DOI] [PubMed] [Google Scholar]
- Neale MC, Boker SM, Xie G, Maes HH. Ed 6. Richmond, VA: Department of Psychiatry, Virginia Commonwealth University; 2003. Mx: statistical modeling. Retrieved Dec. 3, 2007 from http://ibgwww.colorado.edu/twins2001/cdrom/Mx/doc/mxmang11.pdf. [Google Scholar]
- Nikulin VV, Brismar T. Long-range temporal correlations in alpha and beta oscillations: effect of arousal level and test-retest reliability. Clin Neurophysiol. 2004;115:1896–1908. doi: 10.1016/j.clinph.2004.03.019. [DOI] [PubMed] [Google Scholar]
- Nikulin VV, Brismar T. Long-range temporal correlations in electroencephalographic oscillations: relation to topography, frequency band, age and gender. Neuroscience. 2005;130:549–558. doi: 10.1016/j.neuroscience.2004.10.007. [DOI] [PubMed] [Google Scholar]
- Parish LM, Worrell GA, Cranstoun SD, Stead SM, Pennell P, Litt B. Long-range temporal correlations in epileptogenic and non-epileptogenic human hippocampus. Neuroscience. 2004;125:1069–1076. doi: 10.1016/j.neuroscience.2004.03.002. [DOI] [PubMed] [Google Scholar]
- Peng CK, Havlin S, Stanley HE, Goldberger AL. Quantification of scaling exponents and crossover phenomena in nonstationary heartbeat time series. Chaos. 1995;5:82–87. doi: 10.1063/1.166141. [DOI] [PubMed] [Google Scholar]
- Pivik RT, Broughton RJ, Coppola R, Davidson RJ, Fox N, Nuwer MR. Guidelines for the recording and quantitative analysis of electroencephalographic activity in research contexts. Psychophysiology. 1993;30:547–558. doi: 10.1111/j.1469-8986.1993.tb02081.x. [DOI] [PubMed] [Google Scholar]
- Plenz D, Thiagarajan TC. The organizing principles of neuronal avalanches: cell assemblies in the cortex? Trends Neurosci. 2007;30:101–110. doi: 10.1016/j.tins.2007.01.005. [DOI] [PubMed] [Google Scholar]
- Posthuma D, Beem AL, de Geus EJC, van Baal GCM, von Hjelmborg JB, Iachine I, Boomsma DI. Theory and practice in quantitative genetics. Twin Res. 2003;6:361–376. doi: 10.1375/136905203770326367. [DOI] [PubMed] [Google Scholar]
- Raghavachari S, Kahana MJ, Rizzuto DS, Caplan JB, Kirschen MP, Bourgeois B, Madsen JR, Lisman JE. Gating of human theta oscillations by a working memory task. J Neurosci. 2001;21:3175–3183. doi: 10.1523/JNEUROSCI.21-09-03175.2001. [DOI] [PMC free article] [PubMed] [Google Scholar]
- Rangarajan G, Ding M. Integrated approach to the assessment of long range correlation in time series data. Phys Rev E Stat Nonlin Soft Matter Phys. 2000;61:4991. doi: 10.1103/physreve.61.4991. [DOI] [PubMed] [Google Scholar]
- Smit CM, Wright MJ, Hansell NK, Geffen GM, Martin NG. Genetic variation of individual alpha frequency (IAF) and alpha power in a large adolescent twin sample. Int J Psychophysiol. 2006;61:235–243. doi: 10.1016/j.ijpsycho.2005.10.004. [DOI] [PubMed] [Google Scholar]
- Smit DJA, Posthuma D, Boomsma DI, Geus EJC. Heritability of background EEG across the power spectrum. Psychophysiology. 2005;42:691–697. doi: 10.1111/j.1469-8986.2005.00352.x. [DOI] [PubMed] [Google Scholar]
- Stead M, Worrell GA, Litt B. Frequency and dependence of long range temporal correlations in human hippocampal energy fluctuations. Complexity. 2005;10:35–44. [Google Scholar]
- van Beijsterveldt CEM, van Baal GCM. Twin and family studies of the human electroencephalogram: a review and a meta-analysis. Biol Psychol. 2002;61:111–138. doi: 10.1016/s0301-0511(02)00055-8. [DOI] [PubMed] [Google Scholar]
- van Beijsterveldt CEM, Molenaar PCM, de Geus EJC, Boomsma DI. Genetic and environmental influences on EEG coherence. Behav Genet. 1998;28:443–453. doi: 10.1023/a:1021637328512. [DOI] [PubMed] [Google Scholar]
- van Beijsterveldt CEM, van Baal GCM, Molenaar PCM, Boomsma DI, de Geus EJC. Stability of genetic and environmental influences on P300 amplitude: a longitudinal study in adolescent twins. Behav Genet. 2001;31:533–543. doi: 10.1023/a:1013389226795. [DOI] [PubMed] [Google Scholar]
- Varela F, Lachaux J-P, Rodriguez E, Martinerie J. The brainweb: phase synchronization and large-scale integration. Nat Rev Neurosci. 2001;2:229–239. doi: 10.1038/35067550. [DOI] [PubMed] [Google Scholar]