

Abstract
A central challenge in human genomics is to understand the cellular, evolutionary, and clinical significance of genetic variants. Here, we introduce a unified population-genetic and machine-learning model, called Linear Allele-Specific Selection InferencE (LASSIE), for estimating the fitness effects of all observed and potential single-nucleotide variants, based on polymorphism data and predictive genomic features. We applied LASSIE to 51 high-coverage genome sequences annotated with 33 genomic features and constructed a map of allele-specific selection coefficients across all protein-coding sequences in the human genome. This map is generally consistent with previous inferences of the bulk distribution of fitness effects but reveals pervasive weak negative selection against synonymous mutations. In addition, the estimated selection coefficients are highly predictive of inherited pathogenic variants and cancer driver mutations, outperforming state-of-the-art variant prioritization methods. By contrasting our estimated model with ultrahigh coverage ExAC exome-sequencing data, we identified 1118 genes under unusually strong negative selection, which tend to be exclusively expressed in the central nervous system or associated with autism spectrum disorder, as well as 773 genes under unusually weak selection, which tend to be associated with metabolism. This combination of classical population genetic theory with modern machine-learning and large-scale genomic data is a powerful paradigm for the study of both human evolution and disease.
Innovations in DNA sequencing and genotyping have enabled the discovery of millions of genetic variants in human populations, with new variants continuing to be discovered at a rapid pace (The 1000 Genomes Project Consortium 2015; The UK10K Consortium 2015; Lek et al. 2016; Mallick et al. 2016). The great majority of these variants, however, are likely to have no impact on cellular function or human phenotypes, including disease, and many others are probably of only minor importance. The task of identifying which genetic variants are functionally important remains a major rate-limiting step in human genetics, with implications for both basic research and clinical practice.
Numerous computational strategies have been developed for the identification of functional variants, both to prioritize variants for experimental follow-up and to address broader issues such as the genetic architecture of disease or the fraction of human nucleotides that are functionally important (Cooper et al. 2005; Siepel et al. 2005; Pollard et al. 2010; Finucane et al. 2015; Gulko et al. 2015; Eilbeck et al. 2017). These computational predictors generally leverage genomic features correlated with function, such as sequence conservation (Ng and Henikoff 2003; Siepel et al. 2005; Cooper et al. 2010; Pollard et al. 2010; Lindblad-Toh et al. 2011), protein structure (Dehouck et al. 2009; Kellogg et al. 2011; Worth et al. 2011), chromatin accessibility (Lee et al. 2015; Kelley et al. 2016), and protein–DNA interactions (Alipanahi et al. 2015; Zhou and Troyanskaya 2015). Recently, it has been shown that predictive power can be boosted by considering multiple features together, typically using supervised machine-learning models such as logistic regression, random forests, or support vector machines (Adzhubei et al. 2010; Shihab et al. 2013; Ritchie et al. 2014; Schwarz et al. 2014; Jagadeesh et al. 2016). These models detect complex patterns associated with known pathogenic variants and use them to predict the effects of unannotated variants, often with good accuracy.
Nevertheless, the existing supervised machine-learning predictors suffer from some important limitations. For example, their predictions are typically hard to interpret, because they reflect some measure of similarity to a training set of known pathogenic variants based on a complex statistical model rather than a model formulated in terms of biological principles. In addition, the “known” disease variants used for training are generally unrepresentative of all pathogenic variants—e.g., by being enriched for coding regions, splice sites, and well-studied genes (Ritchie et al. 2014; Grimm et al. 2015)—which results in training biases and poor generalization. A related problem is that the reported prediction power for these methods is typically overoptimistic, because it is based on held-out training data that have the same biases (Grimm et al. 2015). In general, these methods effectively serve as predictors of variants like those in the training set, rather than of all functional variants of interest.
An alternative strategy is to identify genetic variants that are subject to purifying (negative) selection. This approach depends on the assumption that functional and disease-associated variants are likely to reduce evolutionary fitness, which clearly does not hold in all cases. Nevertheless, this approach has the important advantages of mitigating the bias from training data and allowing for more interpretable, evolution-based models. This evolution-based strategy has now been used explicitly or implicitly by many state-of-the-art variant prioritization methods, including LINSIGHT, fitCons, CADD, and FunSeq2 (Sadri et al. 2011; Fu et al. 2014; Kircher et al. 2014; Gulko et al. 2015; Huang et al. 2017; di Iulio et al. 2018; Gulko and Siepel 2019). Among these methods, LINSIGHT and fitCons are based on explicit evolutionary models and can be used to obtain maximum-likelihood estimates of interpretable quantities, such as the per-nucleotide probability that new mutations will have fitness consequences. These methods perform well in the prioritization of disease and regulatory variants and also provide evolutionary insights (Gulko et al. 2015; Huang et al. 2017), but they have some important limitations. For example, LINSIGHT and fitCons assume that all alternative alleles at each nucleotide have equal effects on fitness (Gronau et al. 2013; Gulko et al. 2015; Huang et al. 2017; Gulko and Siepel 2019) and do not provide estimates of true selection coefficients, which arguably provide the most precisely interpretable description of fitness effects.
A separate thread in the population genetics literature has addressed the problem of estimating the bulk distribution of fitness effects (DFE) from a designated collection of genomic regions, such as all coding sequences. Methods for addressing this problem typically calculate the probability of a summary of polymorphism data, such as the site frequency spectrum (SFS), given an explicit parameterization of selection coefficients using diffusion approximations of the Wright-Fisher model (Williamson et al. 2005; Eyre-Walker et al. 2006; Keightley and Eyre-Walker 2007; Boyko et al. 2008; Kousathanas and Keightley 2013; Racimo and Schraiber 2014; Kim et al. 2017). These methods generally also make use of an explicit model of demographic history, because of the confounding effect of demography on the SFS (Nielsen, 2005; Keightley and Eyre-Walker 2007; Boyko et al. 2008). These DFE inference methods allow for the inference of true selection coefficients, but they are unable to pinpoint the fitness effects of individual variants owing to the intrinsic sparsity of polymorphisms.
In this article, we present a unified model that combines elements of machine-learning methods for variant prediction and diffusion-approximation methods for DFE inference to enable estimation of allele-specific selection coefficients at every nucleotide in a genomic region of interest. We have implemented our model in a computer program, called Linear Allele-Specific Selection InferencE (LASSIE), and applied it to all protein-coding sequences in the human genome, using publicly available human polymorphism data and more than two dozen predictive genomic features. Importantly, LASSIE provides estimated selection coefficients not only for segregating polymorphisms but for all potential mutations at the sites of interest. We show that these estimated values are informative in various ways about human evolution and disease.
Results
LASSIE uses a unified machine-learning and population genetic model to estimate allele-specific selection coefficients
The key idea behind the LASSIE model is that, while polymorphisms are too sparse to allow direct estimation of allele-specific selection coefficients, there is a strong correlative relationship between genomic features and fitness effects that can be exploited to enable such estimation. The general idea is similar to that behind fitCons (Gulko et al. 2015; Gulko and Siepel 2019) and LINSIGHT (Huang et al. 2017), but in this case a richer machine-learning model accommodates allele-specific effects and a diffusion-based likelihood function allows for the estimation of true selection coefficients.
The LASSIE model consists of two components (Fig. 1). First, for the population genetic component of the model, we use a generative probabilistic model for the site frequency spectrum, adopting the Poisson Random Field (PRF) framework for direct likelihood calculations (Sawyer and Hartl 1992; Williamson et al. 2005; Evans et al. 2007). Second, we account for predictive genomic features using a neural network. The output of this network is not a class assignment, as in typical supervised-learning applications, but instead is a set of parameters that feed into the PRF model for likelihood calculations. Thus, the overall model is a generative model for the data, fitted in an unsupervised manner by maximization of the likelihood, but it conditions on a potentially large, complex, and informative set of genomic features using a neural network. This conditioning allows for pooling of data across genomic sites and improved shrinkage estimators for allele-specific selection coefficients.
Figure 1.

Overview of LASSIE. (A) For each potential protein-coding mutation, we collected 33 genomic features likely to be informative about natural selection, including variant categories, protein and nucleotide conservation scores, and RNA-seq signals (Supplemental Table S1). (B) A three-epoch demographic model was fitted to the site-frequency spectrum (SFS) for putatively neutral exon-flanking sequences for 51 high-coverage Yoruba genomes sequences (Ni: effective population size in epoch i + 1; ti: generations in epoch i + 1). A mixture model for neutral evolution (s = 0), weak negative (s = −1.30 × 10⁻⁴), and strong negative (s = −5.86 × 10⁻⁴) selection was then fitted to the SFS for coding sequences (CDS) (see Methods). (C) A mixture density network model defines the probabilities of the three components of the mixture model (ℙneutral, ℙweak, ℙstrong) for each possible mutation at each nucleotide site, conditional on the local genomic features. These probabilities allow the likelihood of the polymorphism data to be computed under the Poisson Random Field (PRF) model, using diffusion approximation methods. The parameters of the network are estimated by maximum likelihood, by treating the (negative) log likelihood as a loss function for the neural network. After training, the weights for the three mixture components define a coarse-grained distribution of fitness effects for all potential mutations at each site. This distribution is summarized by a single expected value of |s| for each mutation.
Population genomic data is described using a PRF-based mixture model
For reasons of efficiency, selection is accommodated using a three-component mixture model rather than a continuous distribution of selection coefficients. The mixture components capture the average effects of strong negative selection, weak negative selection, and neutral drift, respectively. The use of a mixture model allows the full PRF model to be fitted to the data in a preprocessing step, so that only the site-specific probabilities of the mixture components (the mixture coefficients) need to be estimated in the context of the neural network (see below).
To account for the confounding influence of demography on the SFS, we first fitted a simple demographic model to a collection of putatively neutrally evolving nucleotide sites flanking protein-coding exons. We focused on the 51 high-coverage Yoruba samples from the 1000 Genomes Project, because this population appears to be well described by a pure “expansion” model, without population bottlenecks or introgression events (Williamson et al. 2005; Boyko et al. 2008; Racimo and Schraiber 2014). We assumed a three-epoch model with a constant effective population size in each epoch, and we estimated the timings and magnitudes of population expansions by maximum likelihood (Methods). The estimated model posits that the Yoruba population experienced a moderate expansion about 6000 generations ago, followed by a more dramatic expansion about 600 generations ago (Fig. 1B). Despite its simplicity, this demographic model provides an excellent fit to the observed SFS (Supplemental Fig. S1A).
We then fitted a mixture model to genome-wide protein-coding sequence data, estimating the three mixture coefficients as well as the selection coefficients for the weak and strong negative selection components but keeping the neutral model fixed. This analysis indicates that ∼10% of potential coding mutations in the human exome are under weak negative selection with a representative selection coefficient of s = −1.30 × 10⁻⁴, and about 51% of coding mutations are under strong negative selection with a representative selection coefficient of s = −5.86 × 10⁻⁴ (Fig. 1B). We found that this mixture model fit the exome-wide SFS well (Supplemental Fig. S1B). A version of the model with an additional negative selection mixture component did not improve the fit to the data, and a version with positive selection predicted only 1.8% of mutations with s > 0, so we chose to stay with the simpler three-component model.
Genomic features are incorporated using a mixture density network model
We modeled the relationship between genomic features and allele-specific probabilities of selection components using a mixture density network model (Bishop 1994). This model transforms the genomic features associated with each allele to site- and allele-specific mixture coefficients (Fig. 1C). These mixture coefficients, in turn, are used to compute the probability of the exome-wide data under the PRF mixture model. Thus, the edge weights in the neural network function as the free parameters of a generative model for population genomic data conditional on genomic features.
Hypothesizing that genomic features typically used in variant prioritization would also be informative in this context, we collected 33 diverse features for every potential derived mutation in the human exome, including protein conservation scores, nucleotide conservation scores, protein structural features, RNA-seq signals, and categories indicating changes in the encoded protein (nonsynonymous, nonsense, stop-gained) (Fig. 1A; see Supplemental Table S1 for a complete list of features). Following a common practice in the molecular evolution literature, we defined a nonsynonymous mutation as a point mutation causing the change of one amino acid residue for another one in a protein-coding gene. According to this definition, we use the terms “nonsynonymous” and “missense” interchangeably throughout this work. We then fitted the mixture density model to the exome-wide data by maximum likelihood, keeping the selection coefficients fixed at their previously estimated values (see Methods). The features most strongly predictive of selection included stop-gain and missense mutations, several measures of phylogenetic conservation, and several features describing structural properties of amino acid substitutions such as whether the affected residue is buried or exposed, or whether the substitution is predicted to stabilize or destabilize folding (Supplemental Fig. S2). For ease of interpretation, we summarized the probabilities of neutrality, weak negative, and strong negative selection for each candidate mutation by the absolute value of the expected selection coefficient, |s|.
Notice that our general framework allows for a variety of network architectures, ranging from many-layered networks to the simple case of no hidden layers. The use of hidden layers provides the potential to capture nonlinear relationships between genomic features and selection coefficients but at the cost of larger numbers of free parameters and increased risk of overfitting. In our tests, we found that a linear model actually fit the data better than a nonlinear one (Supplemental Table S2), so we have adopted this simple “linear” architecture for LASSIE.
The estimated selection coefficients are consistent with known evolutionary patterns but suggest pervasive weak selection against synonymous mutations
The selection coefficients estimated by LASSIE are highly variable across potential mutations (see Fig. 2A,B). As expected, LASSIE assigns larger values of |s| to nonsynonymous and nonsense mutations than to synonymous mutations. Because synonymous mutations tend to occur at third codon positions, the spatial distribution of allele-specific selection coefficients exhibits a general three-nucleotide periodic pattern in coding regions. Inspection of individual genes reveals that LASSIE frequently distinguishes known pathogenic variants (shown in red, with relatively large estimates of |s|, in Fig. 2A,B) from benign variants (shown in blue, with smaller estimates of |s|, although in some cases, the differences are not obvious on this scale).
Figure 2.
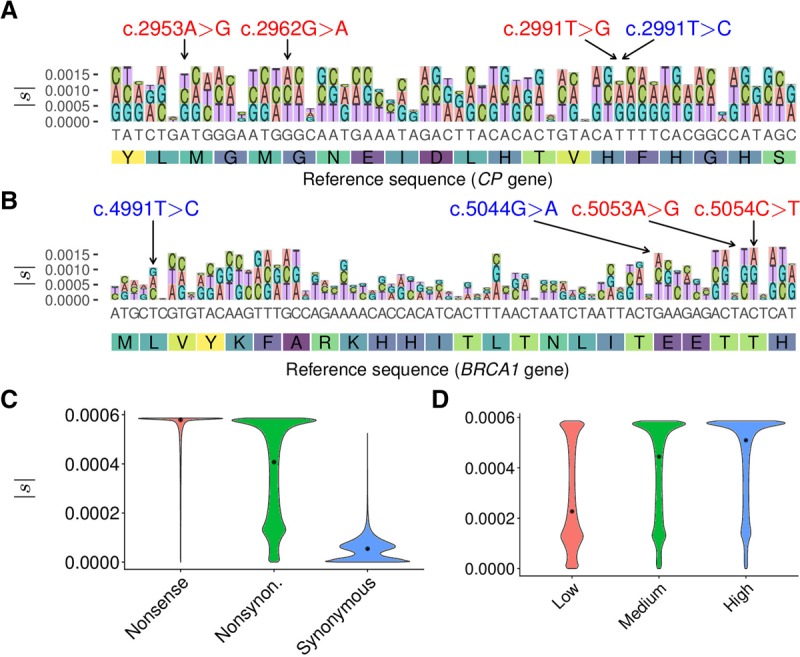
Distributions of selection coefficients estimated by LASSIE. (A) Variant-specific selection coefficients |s| estimated for all potential mutations in a 60-bp region in the CP gene. Nonreference alleles are distinguished by color and drawn with height proportional to |s|. The y-axis indicates cumulative |s|. The three nonsynonymous variants indicated at the top in red (c.2953A > G, c.2962G > A, and c.2991T > G) are associated with Mendelian diseases, and the synonymous variant indicated in blue (c.2991T > C) is benign. (B) Estimates of |s| for all potential mutations in a 72-bp region in the BRCA1 gene. The two nonsynonymous variants indicated at the top in red (c.5053A > G and c.5054C > T) are pathogenic, and the two nonsynonymous variants indicated in blue (c.4991T > C and c.5044G > A) are benign. (C) Distributions of estimated selection coefficients |s| for nonsense, nonsynonymous, and synonymous mutations. (D) Distributions of |s| for nonsynonymous mutations in genes expressed at low, medium, and high levels, based on tertiles of RNA-seq read counts from Roadmap Epigenomics data (Roadmap Epigenomics Consortium et al. 2015), showing a positive correlation between expression level and |s| (Spearman's rank correlation coefficient ρ = 0.338; P < 10−15, two-tailed t-test).
Overall, the distribution of |s| recapitulates well-known patterns of constraint on coding sequences. For example, LASSIE predicts that most nonsense mutations are under strong negative selection (Fig. 2C). In contrast, nonsynonymous mutations show a bimodal distribution of selection coefficients, with modes corresponding to strong and weak negative selection (Fig. 2C). While coarse-grained and truncated at our estimate for strong negative selection (see Discussion), this distribution is reasonably consistent with the bulk distribution inferred in a non-site- and allele-specific manner in previous studies; for example, we estimate that an expected 45% of nonsynonymous mutations are under neutral or weak negative selection (|s|≤ 1.3 × 10⁻⁴ in our formulation) in comparison to estimates of ∼30% with |s| ≤ 1.0 × 10⁻⁴ in Boyko et al. (2008). In agreement with previous analyses based on codon substitution models (Zhang and Yang 2015), we also find that nonsynonymous mutations in highly expressed genes are under significantly stronger negative selection than nonsynonymous mutations in genes expressed at lower levels (Fig. 2D).
The distribution of |s| for synonymous mutations suggests that only an expected 70.5% of such mutations are effectively neutral, whereas 25.9% are under weak negative selection and 3.6% are under strong negative selection (Fig. 2C). Weak negative selection on synonymous mutations is significantly elevated in highly expressed genes, multi-exon genes, and SRSF1 and SRSF7 binding sites (Supplemental Fig. S3), suggesting that roles in mRNA splicing contribute to it, perhaps among other features. While some overestimation in |s| may occur due to selection from linked sites, several lines of evidence suggest that this effect is modest (see Discussion). This finding of a substantial influence from weak negative selection on synonymous substitutions is consistent with studies showing reduced substitution rates or reduced nucleotide diversity at synonymous sites relative to pseudogenes or introns (Bustamante et al. 2002; Chamary et al. 2006; Comeron 2006; Kondrashov et al. 2006; Eory et al. 2010; Rasmussen et al. 2014) and suggests that the widespread practice of using such mutations as a proxy for neutral evolution (Chamary et al. 2006; Yang 2006) might result in biases in some downstream analyses (see Discussion).
The estimated selection coefficients are predictive of mutations associated with Mendelian diseases and cancer
While LASSIE was designed as an evolutionary measure, it may also be useful in the prediction of mutations associated with disease, assuming such mutations tend to be under selection (Ng and Henikoff 2003; Cooper et al. 2010; Fu et al. 2014; Kircher et al. 2014; Huang et al. 2017). To evaluate the method in this setting, we measured its power in the prediction of known Mendelian disease variants, comparing it with the popular variant prioritization methods PolyPhen-2 (Adzhubei et al. 2010), SIFT (Ng and Henikoff 2003), Eigen (Ionita-Laza et al. 2016), CADD (Kircher et al. 2014), and phyloP (Pollard et al. 2010). In this experiment, we used pathogenic and benign variants from the ClinVar database (Landrum et al. 2014) as positive and negative examples, respectively. Despite no use of disease data for training (see Discussion), LASSIE performed well on this benchmark (Fig. 3A; see also Supplemental Fig. S4), displaying slightly greater values of the area under the receiver operating characteristic curve (AUC) statistic (AUC = 0.879) than even the best previously published methods, such as Eigen (AUC = 0.867) and PolyPhen-2 (AUC = 0.845).
Figure 3.

Performance in predicting disease-associated nonsynonymous variants. Performance is quantified using the area under the receiver operating characteristic curve (AUC) statistic. Results for LASSIE are compared with those for Eigen (Ionita-Laza et al. 2016), PolyPhen-2 (Adzhubei et al. 2010), CADD (Kircher et al. 2014), SIFT (Ng and Henikoff 2003), and phyloP (Pollard et al. 2010). (A) Performance for pathogenic variants from ClinVar (Landrum et al. 2014). (B) Performance for cancer-driver mutations from Chang et al. (2016). (C) Distributions of estimated |s| for variants in BRCA1 predicted to be “functional” (FUNC; i.e., nondisruptive), “intermediate” (INT), or “nonfunctional” (NONFUNC; i.e., disruptive) by saturation genome editing (Findlay et al. 2018). Colored dots indicate those variants also having expert-reviewed status in ClinVar (CLINREVSTAT = reviewed by expert panel). (D) Performance for rare (MAF < 1%) GWAS hits. (E) Performance for common (MAF > 5%) GWAS hits, showing that all methods have limited power.
As a second, largely orthogonal, test of predictive power for clinically relevant variants, we evaluated LASSIE's performance in the prioritization of nonsynonymous cancer-driver mutations. Cancer-driver mutations in germline cells may significantly increase the risk of early-onset malignant tumors and, therefore, are likely to be under strong purifying selection in human populations. To test this hypothesis, we obtained a set of nonsynonymous mutations overlapping with mutational hotspots recurrently observed across patients in 243 cancer genes (Chang et al. 2016), which should be enriched for cancer drivers. We randomly sampled a matched number of singleton nonsynonymous somatic mutations in the same genes to represent putative passenger mutations. LASSIE showed reasonable accuracy in this task (AUC = 0.743), again performing better than all other methods tested, although the overall power was modest for all predictors (Fig. 3B). Nevertheless, the selection coefficients estimated by LASSIE are significantly predictive of cancer-driver mutations and could potentially be combined with other features to improve predictive power.
To examine disease relevance at higher resolution, we compared our estimates of |s| with a recent saturation genome editing (SGE) study of 13 exons of the BRCA1 gene (Findlay et al. 2018). This study assigned nearly every possible single nucleotide variant (SNV) in these exons a “function score” indicating its effect on cell growth in an optimized HAP1 cell line, and then classified each SNV as “nonfunctional” (i.e., disruptive to growth), “functional” (nondisruptive), or “intermediate.” We found that “nonfunctional” variants had mostly high estimates of |s|, “functional” variants were enriched for medium and low estimates of |s|, and “intermediate” variants had intermediate estimates of |s| (Fig. 3C). Moreover, the 20 “pathogenic” variants from ClinVar that have been reviewed by experts almost all were both classified by SGE as “nonfunctional” and had close to the maximum possible estimate of |s|, whereas the 12 expert-reviewed “benign” variants from ClinVar were almost all “functional” and tended to have low to moderate estimates of |s| (Fig. 3C). Indeed, a threshold of |s| = 0.0005 (dotted line) would almost perfectly distinguish between the pathogenic and benign variants in ClinVar, with only three misclassifications (see Supplemental Fig. S5 for ROC curves). Nevertheless, many “functional” variants appear to be under fairly strong selection and some “nonfunctional” variants under fairly weak selection, indicating that there are fundamental limits to the use of natural selection as an indicator for disease (see Discussion).
LASSIE and other methods have reasonable accuracy for rare but not common GWAS variants
Because rare genetic variants are most likely to be under negative selection, we hypothesized that evolution-based methods would be more predictive of rare than common variants associated with complex traits. To evaluate this hypothesis, we tested several methods separately on rare (MAF < 1%) and common (MAF > 5%) nonsynonymous variants from the genome-wide association study (GWAS) catalog (MacArthur et al. 2017), using matched variants from the 1000 Genomes Project as negative controls (Methods). In agreement with our hypothesis, most predictors were significantly more powerful in the prediction of rare GWAS variants than of common variants (Fig. 3D,E). Furthermore, LASSIE was among the most accurate methods in the prioritization of both rare and common GWAS variants.
Brain-specific and autism spectrum disorder-related genes are under unusually strong selection
LASSIE's assumption of a single shared relationship, across all genes, between predictive genomic features and |s|, may fail for certain subsets of genes. We searched for groups of genes that systematically deviate from the average relationship, using rare variants from 60,706 exomes in the ExAC data set to obtain high-resolution information about strong negative selection (Lek et al. 2016; Samocha et al. 2017). To characterize the “null” distribution for the observed number of nonsynonymous variants per gene, we used a previously estimated context-dependent mutation rate map (Francioli et al. 2015) to describe site-specific mutation rates. This model predicted numbers of rare synonymous variants that were generally well correlated with the observed data (Supplemental Fig. S6). We then combined these site-specific mutation rates with the probabilities of strong negative selection under LASSIE to obtain an expected rate of rare nonsynonymous variants per each gene. Finally, we computed P-values for the observed numbers of rare (MAF < 0.001) nonsynomous variants per gene with respect to these expected rates under a Poisson-Binomial model (see Methods). We refer to the genes having significantly fewer variants than expected as being under enhanced selection and the genes with significantly more variants than expected as being under relaxed selection.
Among 11,602 autosomal genes examined, we identified 1118 genes and 773 genes as being under significantly enhanced or relaxed selection, respectively (FDR rate < 0.001) (Fig. 4A; Supplemental Data Set S1). We found that the genes under enhanced (strong negative) selection were more likely to be exclusively expressed in the central nervous system (CNS) or associated with autism spectrum disorder (Fig. 4B; Abrahams et al. 2013; Uhlen et al. 2015). These genes were also enriched in Gene Ontology terms and pathways associated with the CNS (Supplemental Tables S3, S4; Mi et al. 2017). The genes under relaxed selection, in contrast, tended to be exclusively expressed in liver or skeletal muscle (Fig. 4B) and to be involved in fundamental metabolic pathways (Supplemental Tables S5, S6). These trends held after accounting for differences in gene length across gene categories (Supplemental Fig. S7; Supplemental Tables S7–S10).
Figure 4.

Genes under “enhanced” or “relaxed” selection relative to the exome-wide LASSIE model. (A) Number of potential missense mutations per gene (x-axis) versus fold-change of the observed number of rare missense mutations relative to the number expected under a Poisson-Binomial null model based on LASSIE (y-axis) (see Methods). Each dot represents a single protein-coding gene. Dots for genes showing significantly more rare variants than expected (“relaxed”; n = 773) are colored red, whereas those for genes showing significantly fewer rare variants than expected are colored blue (“enhanced”; n = 1118). (B) Groups of genes enriched for enhanced or relaxed selection. Dots represent odds ratios of enrichment, with bars indicating 95% confidence intervals. Genes under enhanced selection tend to be exclusively expressed in the central nervous system or associated with autism spectrum disorder. In contrast, genes under relaxed selection tend to be exclusively expressed in liver and skeletal muscle.
Discussion
In this article, we have introduced LASSIE, the first computational method for estimating allele-specific selection coefficients at individual nucleotides across the human genome. LASSIE unifies ideas from the literature on variant prioritization and the literature on the bulk distribution of fitness effects. Like most methods for DFE inference, LASSIE is based on a generative model for allele frequencies, which can be fitted to the data by maximum likelihood without the need for labeled training data. At the same time, the LASSIE model is explicitly conditioned on a rich set of genomic features similar to those considered by variant prioritization methods. Using a flexible neural-network design, LASSIE pools polymorphism data across sites having similar genomic features to obtain improved estimates of selection coefficients. We have used LASSIE to generate a map of |s| for all possible single nucleotide variants in human protein-coding genes (available as a UCSC Genome Browser track: http://compgen.cshl.edu/LASSIE/), based on 51 high-coverage Yoruba genomes and 33 predictive genomic features.
For reasons of efficiency, we chose to approximate the full DFE using a mixture model, with components corresponding to neutral drift, weak negative, and strong negative selection. This strategy allows the model to be rapidly fitted to genome-wide data but results in a rather coarse-grained estimate of the DFE. In our formulation, this approach ignores positive selection, which we have previously shown is difficult to detect in this setting (Gulko et al. 2015). This strategy is also limited in its ability to make distinctions among large values of |s|, because estimates are effectively truncated at the value for the “strong” mixture component, |s| = 5.9 × 10⁻⁴. As a result, LASSIE appears to substantially underestimate |s| for nonsense mutations, for which the true value may be as much as two orders of magnitude larger (Cassa et al. 2017). A related problem is that our analysis is based on only 51 genome sequences, whereas more precise estimates will depend on much larger data sets (Cassa et al. 2017 considered >60,000 exomes). In principle, our framework could be extended to infer full continuous distributions of s from larger data sets, but such an extension would require a number of technical improvements, including relaxation of the infinite-sites assumption underlying our model for the site frequency spectrum, accurately accounting for the effects of very recent explosive population growth (Keinan and Clark 2012; Lek et al. 2016), and further improvements to computational efficiency.
We estimate that about 30% of synonymous mutations are under negative selection. Selection on synonymous mutations appears to be almost exclusively weak, rather than strong, suggesting a limited impact on disease. Nevertheless, weak selection will tend to prohibit the fixation of synonymous alleles and will reduce synonymous substitution rates. Indeed, at a selection coefficient of s = −1.3 × 10⁻⁴ (our estimate for the corresponding mixture component), nearly all selected synonymous mutations would eventually be lost, rather than fixed, causing the observed synonymous substitution rate to be reduced by almost 30% relative to the neutral rate. This projection is consistent with a number of previous analyses of human and other mammalian data (Bustamante et al. 2002; Chamary et al. 2006; Comeron 2006; Kondrashov et al. 2006; Eory et al. 2010; Rasmussen et al. 2014), which have observed reductions of ∼20%–40% in substitution rates or nucleotide diversity at synonymous sites. While it is possible that some overestimation in |s| occurs due to selection from linked sites (background selection or hitchhiking), this effect appears to be modest based on several lines of evidence. In particular, the putatively neutrally evolving sequences that serve as controls are predominantly quite close (<5 kb) to exon boundaries (Supplemental Fig. S8), suggesting that they are fairly well matched in terms of selection from linked sites. Accordingly, the SFS for the subset of fourfold degenerate (4D) synonymous sites closest (<2 kb) to “neutral” sites does not differ from that for all 4D sites (Supplemental Fig. S9), indicating that the use of a more stringent definition of the neutral background would have little effect on the analysis. In addition, we observe only a weak dependency between recombination rate (Hinch et al. 2011) and estimated |s| at synonymous sites (Spearman's ρ = −0.056), in contrast with the expectation under a strong bias from selection at linked sites. Finally, the SFS at segregating 4D sites reveals a pronounced skew toward low-frequency minor alleles, consistent with a direct influence from negative selection (Supplemental Fig. S10). Overall, it appears that negative selection on synonymous mutations is considerably more common than once believed, even in humans, with important implications for the widespread practice of using synonymous sites to estimate the neutral substitution rate. Therefore, we suggest further investigation to see if and how the prevalence of weak negative selection on synonymous mutations could affect downstream evolutionary analyses.
The value of evolutionary methods for disease prediction ultimately depends on the degree to which natural selection correlates with disease risk. While many disease-associated variants show signatures of selection, it stands to reason that some will not, for example, because they are associated with late-onset diseases or diseases whose prevalence is strongly associated with features of modern life. Conversely, many potential variants that show signatures of selection will not relate to disease; for example, because they are strongly deleterious at embryonic or even prefertilization (e.g., in sperm competition) stages and never appear in patients; because they are deleterious only in the presence of a no-longer-existing genetic background; or because they reduce fitness without disrupting normal health (as through sexual selection). Nevertheless, the relationship between natural selection and Mendelian disease is sufficiently strong that evolutionary methods are fairly effective at identifying pathological variants in databases such as ClinVar, with LASSIE performing as well or better, in our experiments, than any other available computational method—including well-established methods such as PolyPhen-2 and SIFT. LASSIE also significantly outperformed other methods in the prioritization of nonsynonymous cancer-driver mutations, despite not being designed for the unique features of somatic evolution.
We found that recently published measures of the functional impact of point mutations in BRCA1 based on saturation genome editing (Findlay et al. 2018) correlated fairly well with LASSIE's measure of natural selection, both across all mutations and for the subset in ClinVar (Fig. 3C). Nevertheless, an expected 44% of variants considered “functional” (i.e., nondisrupting) by SGE were estimated by LASSIE to be under strong negative selection, and 9% of “nonfunctional” mutations were estimated to be under only weak selection. These discordances could, in part, reflect the influence of natural selection in other cell types or conditions or limitations of the assay as a measure of disease importance. In any case, they suggest—based on this one gene, cell type, and functional assay—that, while there is a strong positive correlation between signatures of natural selection and disease impact, there are nevertheless many exceptions to this general correspondence.
While evolutionary methods clearly have value in predicting Mendelian disease variants, it is less clear that they will be useful for identifying causal variants for complex diseases or other complex traits, many of which segregate at high frequencies, making them unlikely to be under detectable negative selection. Indeed, we found that none of the variant prioritization methods we tested performed well in common variant prediction (Fig. 3E). However, LASSIE and other evolution-based methods performed much better for rare variants associated with complex traits (Fig. 3D), presumably because rare variants tend to have larger effect sizes and experience stronger negative selection. Indeed, recent studies have shown that the effect sizes of GWAS variants are negatively correlated with allele frequencies and allele ages (Gazal et al. 2017; Zeng et al. 2018). Together, these observations suggest that evolution-based methods may have an underappreciated potential for the identification of rare variants associated with complex traits.
We were able to obtain reasonable estimates of allele-specific selection coefficients by pooling data across many genes, thereby “shrinking” estimates toward their average values given the genomic features. As in all such shrinkage strategies, however, the decreased variance in the estimates comes at the cost of increased bias, which will be most evident for genes that are atypical in some way. We attempted to turn this limitation into a strength by using it to reveal classes of genes that showed unusually small or large numbers of variants relative to the LASSIE predictions, corresponding to “enhanced” or “relaxed” strong negative selection. We found that genes under “enhanced” selection are enriched for brain-specific expression and an association with autism spectrum disorder (ASD). This observation is consistent with a reported enrichment for likely gene-disrupting de novo mutations in ASD-affected probands relative to unaffected siblings, suggesting the existence of ∼400 ASD-associated genes under particularly strong selection (Iossifov et al. 2012, 2014; O'Roak et al. 2012; Sanders et al. 2012). Separately, conventional variant-effect predictors have been reported to perform poorly for neurodevelopmental diseases, while gene-level estimates of natural selection—such as pLI and RVIS—perform considerably better (Petrovski et al. 2013; Samocha et al. 2014, 2017), perhaps because the relevant genes are not extraordinarily conserved across species but are under very strong selection in humans. Our findings help to put these observations in an evolutionary context and suggest that extensions of our methods that unify variant- and gene-level measures of selection could be particularly useful for neurodevelopmental diseases.
Methods
Genomic features
For predictive genomic features, we used predefined variant categories indicating the impact of each mutation on the encoded protein, sequence conservation scores, protein structural features, splicing scores, and RNA-seq signals (Supplemental Table S1). The variant categories were defined by three indicator variables for whether or not a variant was nonsynonymous, nonsense (stop-gained), or stop-lost in dbNSFP (Liu et al. 2013). The conservation scores included scores derived from both protein and multispecies genomic alignments. The protein sequence conservation scores included SIFT (Ng and Henikoff 2003), LRT (Chun and Fay 2009), Mutation Assessor (Reva et al. 2011), PROVEAN (Choi et al. 2012), SLR (Massingham and Goldman 2005), Grantham (Grantham 1974), PSIC scores from PolyPhen-2 (Adzhubei et al. 2010), and HMMEntropy scores from SNVBox (Wong et al. 2011). The nucleotide sequence conservation scores included phyloP scores (Pollard et al. 2010) derived from vertebrate, mammalian, and primate whole-genome alignments from the UCSC Genome Browser (Casper et al. 2018). The protein structural features were obtained from SNVBox and included predicted secondary structures and contributions to protein stability, B-factors, and relative solvent accessibilities (Wong et al. 2011). We also obtained splicing scores and RNA-seq signals from the noncommercial version of SPIDEX and the Roadmap Epigenomics Project, respectively (Roadmap Epigenomics Consortium et al. 2015; Xiong et al. 2015). All features were based on the hg19 (GRCH37) assembly of the human genome. It is worth noting that 99.92% of the coding exons analyzed in this work can be perfectly and uniquely mapped to the hg38 (GRCh38) assembly with liftOver (Hinrichs et al. 2006). Therefore, we expected that utilizing the hg38 instead of the hg19 assembly would not significantly change the results and conclusions.
Prior to their addition to the mixture density network (below), continuous features were standardized by subtracting the mean and dividing by the standard deviation. Binary features were not standardized.
Polymorphism data
We obtained 51 high-coverage Yoruba genome sequences from the 1000 Genomes Project (The 1000 Genomes Project Consortium 2015). To reduce technical errors due to alignment and genotype calling, we applied several filters similar to those used in Gronau et al. (2013) and Arbiza et al. (2013). These filters eliminated multi-allelic nucleotide sites, simple repeats, transposons, and recent segmental duplicates. Following the same references, we masked all CpG dinucleotides present in either the reference genome or alternative alleles. We also obtained the distributions of ancestral alleles in the human-chimp most recent common ancestor from these same previous studies. In this case, we integrated over these distributions when inferring the global demographic model and mixture model for selection but then conditioned on the most likely ancestral allele in the mixture density network for simplicity and efficiency.
Demographic model and exome-wide distribution of selection coefficients
To obtain sites largely free from selection, we began with the putatively neutral regions defined for INSIGHT (Arbiza et al. 2013; Gronau et al. 2013). Briefly these regions are defined by excluding all coding exons, conserved noncoding elements, and their close flanking regions. We intersected these regions with the 2-kb flanking regions of all coding exons in the Consensus CDS database (Pruitt et al. 2009) to obtain a subset of putatively neutral sites proximal to coding exons and therefore approximately matched to them in terms of influence from selection from linked sites. We fitted a three-epoch demographic model to the site-frequency spectrum in these exon-proximal “neutral” regions, using Poisson Random Field theory for inference (see Supplemental Methods for details).
We then estimated the bulk distribution of selection coefficients in coding regions under a three-component mixture model, with components for neutral evolution (s0 = 0), weak negative selection (s1 < 0), and strong negative selection (s2 < s1). This model is defined by the selection coefficients {s0, s1, s2} and three corresponding mixture coefficients, {w0, w1, w2}, where wi represents the probability that each mutation belongs to component i of the model. The free parameters {s1, s2, w0, w1, w2} were estimated by maximum likelihood, subject to the constraints that w0 + w1 + w2 = 1, {w0, w1, w2} ≥ 0, with s0 = 0 held fixed (Supplemental Methods).
Training the mixture density model
We trained the mixture density network for inference of allele-specific selection coefficients using minibatch gradient descent. Data for Chromosome 1 was used for testing, data for Chromosome 2 was used for validation, and data from the remaining chromosomes was used for training (the numbers of sites in these three sets were approximately in the ratio 1.3:1:10), excluding the sex chromosomes (X and Y) due to their atypical patterns of mutation and selection, as in previous work. The batch-size was set to 100 nucleotides, and the training data were shuffled prior to processing. After each epoch of training, we evaluated the model on the validation set (Chromosome 2) and stopped training if the loss (negative log likelihood) did not decrease after five successive epochs (early stopping). Finally, we selected the set of parameters estimated in the epoch with the lowest validation loss. To validate that our parameter estimates were robust, we re-estimated all parameters separately from even- and odd-numbered chromosomes, and we found these independent estimates to be highly similar (Pearson's r = 0.967) (Supplemental Fig. S11).
After training, we assigned each potential coding mutation its expected selection coefficient s under the site- and allele-specific distribution defined by the mixture density network, that is, with
| (1) |
(see Fig. 1C). By construction, s ≤ 0, so we generally summarize these estimates using |s|, which can be interpreted as a measure of the strength of negative selection. Despite that Chromosome X was excluded from the training set, we did generate predictions for this chromosome because it contains many disease variants.
Note that we used a single demographic model for all sites, despite that selection from linked sites (background selection or hitchhiking) might result in local reductions in nucleotide diversity, and therefore, in the apparent effective population size. Similarly, our model assumes a constant mutation rate, despite evidence for variability across the genome. The deficiency of these modeling assumptions, however, is mitigated by the fact that the method effectively averages across many sites dispersed across the genome when estimating selection coefficients. We expect that this averaging property will allow point estimates of |s| to remain fairly accurate despite the failure to explicitly model genomic variability in “nuisance” parameters that affect nucleotide diversity.
Comparison with other variant prioritization methods
For comparison with LASSIE, we downloaded precomputed CADD (v1.3) (Kircher et al. 2014), PolyPhen-2 (v2.2.2) (Adzhubei et al. 2010), SIFT (released in August 2011) (Ng and Henikoff 2003), Eigen (v1.0) (Ionita-Laza et al. 2016), and mammalian phyloP (phyloP46way) (Pollard et al. 2010) scores from their source websites. For all comparisons, we only included variants that were scored by all methods. We visualized the receiver operating characteristic (ROC) curves and calculated the areas under the receiver operating characteristic curve using the ROCR package in R (Sing et al. 2005; R Core Team 2018).
For the evaluation of Mendelian disease variants, we obtained pathogenic and benign variants from the ClinVar website (Landrum et al. 2014) in March 2017. Variants annotated as “pathogenic” or “likely pathogenic” were considered “true” disease variants, whereas those annotated as “benign” or “likely benign” were employed as negative controls (ClinVar release in March 2017) (Landrum et al. 2014). Several of the evaluated methods utilized common SNPs or known pathogenic variants in training, which could result in overestimation of their performance. Therefore, we removed all ClinVar variants also in the 1000 Genomes Project (phase 3) (The 1000 Genomes Project Consortium 2015) or the training set of PolyPhen-2. The numbers of positive and negative control variants were balanced by random sampling without replacement. Because true pathological variants are sparse, this matching scheme will tend to result in an overestimate of the true absolute AUC, but our focus in this article is on the relative performance of the different predictors.
For the evaluation of cancer-driver mutations, we obtained pancancer somatic mutations and hotspots of nonsynonymous mutations from Chang et al. (2016). We defined cancer genes to be protein-coding genes containing at least one mutational hotspot, cancer-driver mutations to be somatic mutations overlapping mutational hotspots, and passenger mutations to be singleton mutations within cancer genes but not overlapping mutational hotspots. As above, we filtered out all somatic mutations overlapping 1000 Genomes Project variants or the training set of PolyPhen-2 and matched the numbers of cancer-driver mutations and passenger mutations by random sampling without replacement.
For the evaluation of nonsynonymous variants associated with complex traits or diseases, we obtained GWAS variants from the GWAS Catalog (downloaded in November 2017) (MacArthur et al. 2017) and identified subsets of rare variants (MAF < 0.01) and common variants (MAF > 0.05). We used nonsynonymous variants from the 1000 Genomes Project as negative controls. After observing that the GWAS variants tended to have higher MAFs than these controls, we matched the distributions of MAFs for the two sets and then randomly sampled negative examples matched in both number and MAF to the GWAS variants, repeating the sampling 100 times to quantify uncertainty.
Identification of genes under enhanced or relaxed selection
Our model for the expected rates of ultrarare (MAF < 0.001) variants in the ExAC data (Lek et al. 2016) depended critically on an accurate mutation model. Our mutation model was based on precomputed context-dependent mutation rates from the web site of the Genome of the Netherlands (The Genome of the Netherlands Consortium 2014; Francioli et al. 2015). Because of differences in sample size, we expected that the local mutation rates in the ExAC data would be proportional, but not equal, to the rates estimated from the Genome of the Netherlands data. Therefore, to recalibrate the local mutation rates, we fitted a simple logistic regression model for the entire genome based on the numbers of ultrarare synonymous variants in the ExAC data set, assuming that the impact of natural selection on these variants should be minimal. (Note that our finding that few synonymous mutations are under strong negative selection [Fig. 2B] supports this assumption.) Specifically, the logistic regression assumes
| (2) |
where pi denotes the probability of observing a rare synonymous mutation i, di is the sequencing coverage at the corresponding position (which varies considerably in the ExAC data), and µi is the corresponding mutation rate estimated by the Genome of the Netherlands. We validated the mutational model by comparing the observed number of synonymous mutations with the expected number predicted by the mutational model for each gene. We removed short genes (with <200 potential synonymous mutations) and genes for which the mutational model seemed to be misspecified (FDR rate ≤ 0.2) from further consideration.
Based on this recalibrated mutation model, we defined a null model for the number of nonsynonymous mutations per gene given the site- and allele-specific selection coefficients estimated by LASSIE. First, we calculated qi, the expected probability of observing a nonsynonymous mutation i, as
| (3) |
where pi is the probability of mutation i under the neutral mutational model, w2,i is the probability that mutation i is under strong selection as estimated by LASSIE, and h(·) is a mapping from the probabilities of strong selection to relative rates of the nonsynonymous mutation in the ExAC data. To estimate h(·), we grouped all potential nonsynonymous mutations into 1000 equal-width bins based on w2,i and then estimated h(·) for each selection bin by calculating the ratio of the observed to the expected numbers of nonsynonymous mutations. We then calculated qi for each nonsynonymous mutation i and used qi to parameterize a Poisson-Binomial distribution describing the null distribution of the number of nonsynonymous mutations for each gene. The probability mass function of the Poisson-Binomial model for a single gene is given by
| (4) |
where k is the observed number of nonsynonymous mutations in the gene, and Fk is the set of all possible arrangements of k nonsynonymous mutations. Genes under enhanced or relaxed selections were identified by two separate one-tail tests based on this Poisson-Binomial distribution.
Gene enrichment analysis
The enrichment analysis of tissue-specific expression was based on annotated tissue-specific genes from the Human Protein Atlas (Uhlen et al. 2015). Only tissues having more than 50 tissue-specific genes were included. The analysis of autism spectrum disorder was based on ASD-related genes from the SFARI Gene database (Abrahams et al. 2013). In both cases, significant enrichments were determined using Fisher's exact test. For the analysis of functional categories, we used PANTHER to investigate the enrichment of both Gene Ontology Slim categories and Reactome pathways (Mi et al. 2017; Fabregat et al. 2018). To avoid gene length as a confounding factor, we also repeated the enrichment analyses after matching the number of potential mutations between the foreground and background gene sets with the MatchIt package (Ho et al. 2011).
Software availability
The source code for LASSIE is available in Supplemental Code S1 and on GitHub under the simplified BSD license (http://github.com/CshlSiepelLab/LASSIE/). The LASSIE scores are available as a UCSC Genome Browser track at http://compgen.cshl.edu/LASSIE/.
Supplementary Material
Acknowledgments
We thank Fernando Racimo and Joshua Schraiber for sharing their source code for inference of selection coefficients, Stephen Wright for providing access to a GPU server at the University of Toronto, Noah Dukler for help with figure preparation, and members of the Siepel laboratory for helpful discussions. This research was supported by U.S. National Institutes of Health grant R35-GM127070. The content is solely the responsibility of the authors and does not necessarily represent the official views of the U.S. National Institutes of Health.
Footnotes
[Supplemental material is available for this article.]
Article published online before print. Article, supplemental material, and publication date are at http://www.genome.org/cgi/doi/10.1101/gr.245522.118.
References
- The 1000 Genomes Project Consortium. 2015. A global reference for human genetic variation. Nature 526: 68–74. 10.1038/nature15393 [DOI] [PMC free article] [PubMed] [Google Scholar]
- Abrahams BS, Arking DE, Campbell DB, Mefford HC, Morrow EM, Weiss LA, Menashe I, Wadkins T, Banerjee-Basu S, Packer A. 2013. SFARI Gene 2.0: a community-driven knowledgebase for the autism spectrum disorders (ASDs). Mol Autism 4: 36 10.1186/2040-2392-4-36 [DOI] [PMC free article] [PubMed] [Google Scholar]
- Adzhubei IA, Schmidt S, Peshkin L, Ramensky VE, Gerasimova A, Bork P, Kondrashov AS, Sunyaev SR. 2010. A method and server for predicting damaging missense mutations. Nat Methods 7: 248–249. 10.1038/nmeth0410-248 [DOI] [PMC free article] [PubMed] [Google Scholar]
- Alipanahi B, Delong A, Weirauch MT, Frey BJ. 2015. Predicting the sequence specificities of DNA- and RNA-binding proteins by deep learning. Nat Biotechnol 33: 831–838. 10.1038/nbt.3300 [DOI] [PubMed] [Google Scholar]
- Arbiza L, Gronau I, Aksoy BA, Hubisz MJ, Gulko B, Keinan A, Siepel A. 2013. Genome-wide inference of natural selection on human transcription factor binding sites. Nat Genet 45: 723–729. 10.1038/ng.2658 [DOI] [PMC free article] [PubMed] [Google Scholar]
- Bishop CM. 1994. Mixture density networks. Technical report Aston University, Birmingham, UK. [Google Scholar]
- Boyko AR, Williamson SH, Indap AR, Degenhardt JD, Hernandez RD, Lohmueller KE, Adams MD, Schmidt S, Sninsky JJ, Sunyaev SR, et al. 2008. Assessing the evolutionary impact of amino acid mutations in the human genome. PLoS Genet 4: e1000083 10.1371/journal.pgen.1000083 [DOI] [PMC free article] [PubMed] [Google Scholar]
- Bustamante CD, Nielsen R, Hartl DL. 2002. A maximum likelihood method for analyzing pseudogene evolution: implications for silent site evolution in humans and rodents. Mol Biol Evol 19: 110–117. 10.1093/oxfordjournals.molbev.a003975 [DOI] [PubMed] [Google Scholar]
- Casper J, Zweig AS, Villarreal C, Tyner C, Speir ML, Rosenbloom KR, Raney BJ, Lee CM, Lee BT, Karolchik D, et al. 2018. The UCSC Genome Browser database: 2018 update. Nucleic Acids Res 46: D762–D769. 10.1093/nar/gkx1020 [DOI] [PMC free article] [PubMed] [Google Scholar]
- Cassa CA, Weghorn D, Balick DJ, Jordan DM, Nusinow D, Samocha KE, O'Donnell-Luria A, MacArthur DG, Daly MJ, Beier DR, et al. 2017. Estimating the selective effects of heterozygous protein-truncating variants from human exome data. Nat Genet 49: 806–810. 10.1038/ng.3831 [DOI] [PMC free article] [PubMed] [Google Scholar]
- Chamary JV, Parmley JL, Hurst LD. 2006. Hearing silence: non-neutral evolution at synonymous sites in mammals. Nat Rev Genet 7: 98–108. 10.1038/nrg1770 [DOI] [PubMed] [Google Scholar]
- Chang MT, Asthana S, Gao SP, Lee BH, Chapman JS, Kandoth C, Gao J, Socci ND, Solit DB, Olshen AB, et al. 2016. Identifying recurrent mutations in cancer reveals widespread lineage diversity and mutational specificity. Nat Biotech 34: 155–163. 10.1038/nbt.3391 [DOI] [PMC free article] [PubMed] [Google Scholar]
- Choi Y, Sims GE, Murphy S, Miller JR, Chan AP. 2012. Predicting the functional effect of amino acid substitutions and indels. PLoS One 7: e46688 10.1371/journal.pone.0046688 [DOI] [PMC free article] [PubMed] [Google Scholar]
- Chun S, Fay JC. 2009. Identification of deleterious mutations within three human genomes. Genome Res 19: 1553–1561. 10.1101/gr.092619.109 [DOI] [PMC free article] [PubMed] [Google Scholar]
- Comeron JM. 2006. Weak selection and recent mutational changes influence polymorphic synonymous mutations in humans. Proc Natl Acad Sci 103: 6940–6945. 10.1073/pnas.0510638103 [DOI] [PMC free article] [PubMed] [Google Scholar]
- Cooper GM, Stone EA, Asimenos G, Green ED, Batzoglou S, Sidow A. 2005. Distribution and intensity of constraint in mammalian genomic sequence. Genome Res 15: 901–913. 10.1101/gr.3577405 [DOI] [PMC free article] [PubMed] [Google Scholar]
- Cooper GM, Goode DL, Ng SB, Sidow A, Bamshad MJ, Shendure J, Nickerson DA. 2010. Single-nucleotide evolutionary constraint scores highlight disease-causing mutations. Nat Methods 7: 250–251. 10.1038/nmeth0410-250 [DOI] [PMC free article] [PubMed] [Google Scholar]
- Dehouck Y, Grosfils A, Folch B, Gilis D, Bogaerts P, Rooman M. 2009. Fast and accurate predictions of protein stability changes upon mutations using statistical potentials and neural networks: PoPMuSiC-2.0. Bioinformatics 25: 2537–2543. 10.1093/bioinformatics/btp445 [DOI] [PubMed] [Google Scholar]
- di Iulio J, Bartha I, Wong EHM, Yu H-C, Lavrenko V, Yang D, Jung I, Hicks MA, Shah N, Kirkness EF, et al. 2018. The human noncoding genome defined by genetic diversity. Nat Genet 50: 333–337. 10.1038/s41588-018-0062-7 [DOI] [PubMed] [Google Scholar]
- Eilbeck K, Quinlan A, Yandell M. 2017. Settling the score: variant prioritization and Mendelian disease. Nat Rev Genet 18: 599–612. 10.1038/nrg.2017.52 [DOI] [PMC free article] [PubMed] [Google Scholar]
- Eory L, Halligan DL, Keightley PD. 2010. Distributions of selectively constrained sites and deleterious mutation rates in the hominid and murid genomes. Mol Biol Evol 27: 177–192. 10.1093/molbev/msp219 [DOI] [PubMed] [Google Scholar]
- Evans SN, Shvets Y, Slatkin M. 2007. Non-equilibrium theory of the allele frequency spectrum. Theor Popul Biol 71: 109–119. 10.1016/j.tpb.2006.06.005 [DOI] [PubMed] [Google Scholar]
- Eyre-Walker A, Woolfit M, Phelps T. 2006. The distribution of fitness effects of new deleterious amino acid mutations in humans. Genetics 173: 891–900. 10.1534/genetics.106.057570 [DOI] [PMC free article] [PubMed] [Google Scholar]
- Fabregat A, Jupe S, Matthews L, Sidiropoulos K, Gillespie M, Garapati P, Haw R, Jassal B, Korninger F, May B, et al. 2018. The Reactome Pathway Knowledgebase. Nucleic Acids Res 46: D649–D655. 10.1093/nar/gkx1132 [DOI] [PMC free article] [PubMed] [Google Scholar]
- Findlay GM, Daza RM, Martin B, Zhang MD, Leith AP, Gasperini M, Janizek JD, Huang X, Starita LM, Shendure J. 2018. Accurate classification of BRCA1 variants with saturation genome editing. Nature 562: 217–222. 10.1038/s41586-018-0461-z [DOI] [PMC free article] [PubMed] [Google Scholar]
- Finucane HK, Bulik-Sullivan B, Gusev A, Trynka G, Reshef Y, Loh P-R, Anttila V, Xu H, Zang C, Farh K, et al. 2015. Partitioning heritability by functional annotation using genome-wide association summary statistics. Nat Genet 47: 1228–1235. 10.1038/ng.3404 [DOI] [PMC free article] [PubMed] [Google Scholar]
- Francioli LC, Polak PP, Koren A, Menelaou A, Chun S, Renkens I, Genome of the Netherlands Consortium, van Duijn CM, Swertz M, Wijmenga C, et al. 2015. Genome-wide patterns and properties of de novo mutations in humans. Nat Genet 47: 822–826. 10.1038/ng.3292 [DOI] [PMC free article] [PubMed] [Google Scholar]
- Fu Y, Liu Z, Lou S, Bedford J, Mu X, Yip K, Khurana E, Gerstein M. 2014. FunSeq2: a framework for prioritizing noncoding regulatory variants in cancer. Genome Biol 15: 480 10.1186/s13059-014-0480-5 [DOI] [PMC free article] [PubMed] [Google Scholar]
- Gazal S, Finucane HK, Furlotte NA, Loh P-R, Palamara PF, Liu X, Schoech A, Bulik-Sullivan B, Neale BM, Gusev A, et al. 2017. Linkage disequilibrium–dependent architecture of human complex traits shows action of negative selection. Nat Genet 49: 1421–1427. 10.1038/ng.3954 [DOI] [PMC free article] [PubMed] [Google Scholar]
- The Genome of the Netherlands Consortium. 2014. Whole-genome sequence variation, population structure and demographic history of the Dutch population. Nat Genet 46: 818–825. 10.1038/ng.3021 [DOI] [PubMed] [Google Scholar]
- Grantham R. 1974. Amino acid difference formula to help explain protein evolution. Science 185: 862–864. 10.1126/science.185.4154.862 [DOI] [PubMed] [Google Scholar]
- Grimm DG, Azencott C-A, Aicheler F, Gieraths U, MacArthur DG, Samocha KE, Cooper DN, Stenson PD, Daly MJ, Smoller JW, et al. 2015. The evaluation of tools used to predict the impact of missense variants is hindered by two types of circularity. Hum Mutat 36: 513–523. 10.1002/humu.22768 [DOI] [PMC free article] [PubMed] [Google Scholar]
- Gronau I, Arbiza L, Mohammed J, Siepel A. 2013. Inference of natural selection from interspersed genomic elements based on polymorphism and divergence. Mol Biol Evol 30: 1159–1171. 10.1093/molbev/mst019 [DOI] [PMC free article] [PubMed] [Google Scholar]
- Gulko B, Siepel A. 2019. An evolutionary framework for measuring epigenomic information and estimating cell-type-specific fitness consequences. Nat Genet 51: 335–342. 10.1038/s41588-018-0300-z [DOI] [PMC free article] [PubMed] [Google Scholar]
- Gulko B, Hubisz MJ, Gronau I, Siepel A. 2015. A method for calculating probabilities of fitness consequences for point mutations across the human genome. Nat Genet 47: 276–283. 10.1038/ng.3196 [DOI] [PMC free article] [PubMed] [Google Scholar]
- Hinch AG, Tandon A, Patterson N, Song Y, Rohland N, Palmer CD, Chen GK, Wang K, Buxbaum SG, Akylbekova EL, et al. 2011. The landscape of recombination in African Americans. Nature 476: 170–175. 10.1038/nature10336 [DOI] [PMC free article] [PubMed] [Google Scholar]
- Hinrichs AS, Karolchik D, Baertsch R, Barber GP, Bejerano G, Clawson H, Diekhans M, Furey TS, Harte RA, Hsu F, et al. 2006. The UCSC Genome Browser Database: update 2006. Nucleic Acids Res 34: D590–D598. 10.1093/nar/gkj144 [DOI] [PMC free article] [PubMed] [Google Scholar]
- Ho D, Imai K, King G, Stuart EA. 2011. MatchIt: nonparametric preprocessing for parametric causal inference. J Stat Softw 42: 28 10.18637/jss.v042.i08 [DOI] [Google Scholar]
- Huang Y-F, Gulko B, Siepel A. 2017. Fast, scalable prediction of deleterious noncoding variants from functional and population genomic data. Nat Genet 49: 618–624. 10.1038/ng.3810 [DOI] [PMC free article] [PubMed] [Google Scholar]
- Ionita-Laza I, McCallum K, Xu B, Buxbaum JD. 2016. A spectral approach integrating functional genomic annotations for coding and noncoding variants. Nat Genet 48: 214–220. 10.1038/ng.3477 [DOI] [PMC free article] [PubMed] [Google Scholar]
- Iossifov I, Ronemus M, Levy D, Wang Z, Hakker I, Rosenbaum J, Yamrom B, Lee YH, Narzisi G, Leotta A, et al. 2012. De novo gene disruptions in children on the autistic spectrum. Neuron 74: 285–299. 10.1016/j.neuron.2012.04.009 [DOI] [PMC free article] [PubMed] [Google Scholar]
- Iossifov I, O'Roak BJ, Sanders SJ, Ronemus M, Krumm N, Levy D, Stessman HA, Witherspoon KT, Vives L, Patterson KE, et al. 2014. The contribution of de novo coding mutations to autism spectrum disorder. Nature 515: 216–221. 10.1038/nature13908 [DOI] [PMC free article] [PubMed] [Google Scholar]
- Jagadeesh KA, Wenger AM, Berger MJ, Guturu H, Stenson PD, Cooper DN, Bernstein JA, Bejerano G. 2016. M-CAP eliminates a majority of variants of uncertain significance in clinical exomes at high sensitivity. Nat Genet 48: 1581–1586. 10.1038/ng.3703 [DOI] [PubMed] [Google Scholar]
- Keightley PD, Eyre-Walker A. 2007. Joint inference of the distribution of fitness effects of deleterious mutations and population demography based on nucleotide polymorphism frequencies. Genetics 177: 2251–2261. 10.1534/genetics.107.080663 [DOI] [PMC free article] [PubMed] [Google Scholar]
- Keinan A, Clark AG. 2012. Recent explosive human population growth has resulted in an excess of rare genetic variants. Science 336: 740–743. 10.1126/science.1217283 [DOI] [PMC free article] [PubMed] [Google Scholar]
- Kelley DR, Snoek J, Rinn J. 2016. Basset: learning the regulatory code of the accessible genome with deep convolutional neural networks. Genome Res 26: 990–999. 10.1101/gr.200535.115 [DOI] [PMC free article] [PubMed] [Google Scholar]
- Kellogg EH, LeaverFay A, Baker D. 2011. Role of conformational sampling in computing mutation induced-changes in protein structure and stability. Proteins: Structure, Function, and Bioinformatics 79: 830–838. 10.1002/prot.22921 [DOI] [PMC free article] [PubMed] [Google Scholar]
- Kim BY, Huber CD, Lohmueller KE. 2017. Inference of the distribution of selection coefficients for new nonsynonymous mutations using large samples. Genetics 206: 345–361. 10.1534/genetics.116.197145 [DOI] [PMC free article] [PubMed] [Google Scholar]
- Kircher M, Witten DM, Jain P, O'Roak BJ, Cooper GM, Shendure J. 2014. A general framework for estimating the relative pathogenicity of human genetic variants. Nat Genet 46: 310–315. 10.1038/ng.2892 [DOI] [PMC free article] [PubMed] [Google Scholar]
- Kondrashov FA, Ogurtsov AY, Kondrashov AS. 2006. Selection in favor of nucleotides G and C diversifies evolution rates and levels of polymorphism at mammalian synonymous sites. J Theor Biol 240: 616–626. 10.1016/j.jtbi.2005.10.020 [DOI] [PubMed] [Google Scholar]
- Kousathanas A, Keightley PD. 2013. A comparison of models to infer the distribution of fitness effects of new mutations. Genetics 193: 1197–1208. 10.1534/genetics.112.148023 [DOI] [PMC free article] [PubMed] [Google Scholar]
- Landrum MJ, Lee JM, Riley GR, Jang W, Rubinstein WS, Church DM, Maglott DR. 2014. ClinVar: public archive of relationships among sequence variation and human phenotype. Nucleic Acids Res 42: D980–D985. 10.1093/nar/gkt1113 [DOI] [PMC free article] [PubMed] [Google Scholar]
- Lee D, Gorkin DU, Baker M, Strober BJ, Asoni AL, McCallion AS, Beer MA. 2015. A method to predict the impact of regulatory variants from DNA sequence. Nat Genet 47: 955–961. 10.1038/ng.3331 [DOI] [PMC free article] [PubMed] [Google Scholar]
- Lek M, Karczewski KJ, Minikel EV, Samocha KE, Banks E, Fennell T, O'Donnell-Luria AH, Ware JS, Hill AJ, Cummings BB, et al. 2016. Analysis of protein-coding genetic variation in 60,706 humans. Nature 536: 285–291. 10.1038/nature19057 [DOI] [PMC free article] [PubMed] [Google Scholar]
- Lindblad-Toh K, Garber M, Zuk O, Lin MF, Parker BJ, Washietl S, Kheradpour P, Ernst J, Jordan G, Mauceli E, et al. 2011. A high-resolution map of human evolutionary constraint using 29 mammals. Nature 478: 476–482. 10.1038/nature10530 [DOI] [PMC free article] [PubMed] [Google Scholar]
- Liu X, Jian X, Eric B. 2013. dbNSFP v2.0: a database of human non-synonymous SNVs and their functional predictions and annotations. Hum Mutat 34: E2393–E2402. 10.1002/humu.22376 [DOI] [PMC free article] [PubMed] [Google Scholar]
- MacArthur J, Bowler E, Cerezo M, Gil L, Hall P, Hastings E, Junkins H, McMahon A, Milano A, Morales J, et al. 2017. The new NHGRI-EBI Catalog of published genome-wide association studies (GWAS Catalog). Nucleic Acids Res 45: D896–D901. 10.1093/nar/gkw1133 [DOI] [PMC free article] [PubMed] [Google Scholar]
- Mallick S, Li H, Lipson M, Mathieson I, Gymrek M, Racimo F, Zhao M, Chennagiri N, Nordenfelt S, Tandon A, et al. 2016. The Simons Genome Diversity Project: 300 genomes from 142 diverse populations. Nature 538: 201–206. 10.1038/nature18964 [DOI] [PMC free article] [PubMed] [Google Scholar]
- Massingham T, Goldman N. 2005. Detecting amino acid sites under positive selection and purifying selection. Genetics 169: 1753–1762. 10.1534/genetics.104.032144 [DOI] [PMC free article] [PubMed] [Google Scholar]
- Mi H, Huang X, Muruganujan A, Tang H, Mills C, Kang D, Thomas PD. 2017. PANTHER version 11: expanded annotation data from Gene Ontology and Reactome pathways, and data analysis tool enhancements. Nucleic Acids Res 45: D183–D189. 10.1093/nar/gkw1138 [DOI] [PMC free article] [PubMed] [Google Scholar]
- Ng PC, Henikoff S. 2003. SIFT: predicting amino acid changes that affect protein function. Nucleic Acids Res 31: 3812–3814. 10.1093/nar/gkg509 [DOI] [PMC free article] [PubMed] [Google Scholar]
- Nielsen R. 2005. Molecular signatures of natural selection. Annu Rev Genet 39: 197–218. 10.1146/annurev.genet.39.073003.112420 [DOI] [PubMed] [Google Scholar]
- O'Roak BJ, Vives L, Girirajan S, Karakoc E, Krumm N, Coe BP, Levy R, Ko A, Lee C, Smith JD, et al. 2012. Sporadic autism exomes reveal a highly interconnected protein network of de novo mutations. Nature 485: 246–250. 10.1038/nature10989 [DOI] [PMC free article] [PubMed] [Google Scholar]
- Petrovski S, Wang Q, Heinzen EL, Allen AS, Goldstein DB. 2013. Genic intolerance to functional variation and the interpretation of personal genomes. PLoS Genet 9: e1003709 10.1371/journal.pgen.1003709 [DOI] [PMC free article] [PubMed] [Google Scholar]
- Pollard KS, Hubisz MJ, Rosenbloom KR, Siepel A. 2010. Detection of nonneutral substitution rates on mammalian phylogenies. Genome Res 20: 110–121. 10.1101/gr.097857.109 [DOI] [PMC free article] [PubMed] [Google Scholar]
- Pruitt KD, Harrow J, Harte RA, Wallin C, Diekhans M, Maglott DR, Searle S, Farrell CM, Loveland JE, Ruef BJ, et al. 2009. The consensus coding sequence (CCDS) project: identifying a common protein-coding gene set for the human and mouse genomes. Genome Res 19: 1316–1323. 10.1101/gr.080531.108 [DOI] [PMC free article] [PubMed] [Google Scholar]
- R Core Team. 2018. R: a language and environment for statistical computing. R Foundation for Statistical Computing, Vienna: https://www.R-project.org/. [Google Scholar]
- Racimo F, Schraiber JG. 2014. Approximation to the distribution of fitness effects across functional categories in human segregating polymorphisms. PLoS Genet 10: e1004697 10.1371/journal.pgen.1004697 [DOI] [PMC free article] [PubMed] [Google Scholar]
- Rasmussen MD, Hubisz MJ, Gronau I, Siepel A. 2014. Genome-wide inference of ancestral recombination graphs. PLoS Genet 10: e1004342 10.1371/journal.pgen.1004342 [DOI] [PMC free article] [PubMed] [Google Scholar]
- Reva B, Antipin Y, Sander C. 2011. Predicting the functional impact of protein mutations: application to cancer genomics. Nucleic Acids Res 39: e118 10.1093/nar/gkr407 [DOI] [PMC free article] [PubMed] [Google Scholar]
- Ritchie GRS, Dunham I, Zeggini E, Flicek P. 2014. Functional annotation of noncoding sequence variants. Nat Methods 11: 294–296. 10.1038/nmeth.2832 [DOI] [PMC free article] [PubMed] [Google Scholar]
- Roadmap Epigenomics Consortium, Kundaje A, Meuleman W, Ernst J, Bilenky M, Yen A, Heravi-Moussavi A, Kheradpour P, Zhang Z, Wang J, et al. 2015. Integrative analysis of 111 reference human epigenomes. Nature 518: 317–330. 10.1038/nature14248 [DOI] [PMC free article] [PubMed] [Google Scholar]
- Sadri J, Diallo AB, Blanchette M. 2011. Predicting site-specific human selective pressure using evolutionary signatures. Bioinformatics 27: i266–i274. 10.1093/bioinformatics/btr241 [DOI] [PMC free article] [PubMed] [Google Scholar]
- Samocha KE, Robinson EB, Sanders SJ, Stevens C, Sabo A, McGrath LM, Kosmicki JA, Rehnstrom K, Mallick S, Kirby A, et al. 2014. A framework for the interpretation of de novo mutation in human disease. Nat Genet 46: 944–950. 10.1038/ng.3050 [DOI] [PMC free article] [PubMed] [Google Scholar]
- Samocha KE, Kosmicki JA, Karczewski KJ, O'Donnell-Luria AH, Pierce-Hoffman E, MacArthur DG, Neale BM, Daly MJ. 2017. Regional missense constraint improves variant deleteriousness prediction. bioRxiv 10.1101/148353 [DOI]
- Sanders SJ, Murtha MT, Gupta AR, Murdoch JD, Raubeson MJ, Willsey AJ, Ercan-Sencicek AG, DiLullo NM, Parikshak NN, Stein JL, et al. 2012. De novo mutations revealed by whole-exome sequencing are strongly associated with autism. Nature 485: 237–241. 10.1038/nature10945 [DOI] [PMC free article] [PubMed] [Google Scholar]
- Sawyer SA, Hartl DL. 1992. Population genetics of polymorphism and divergence. Genetics 132: 1161–1176. [DOI] [PMC free article] [PubMed] [Google Scholar]
- Schwarz JM, Cooper DN, Schuelke M, Seelow D. 2014. MutationTaster2: mutation prediction for the deep-sequencing age. Nat Methods 11: 361–362. 10.1038/nmeth.2890 [DOI] [PubMed] [Google Scholar]
- Shihab HA, Gough J, Cooper DN, Stenson PD, Barker GLA, Edwards KJ, Day INM, Gaunt TR. 2013. Predicting the functional, molecular, and phenotypic consequences of amino acid substitutions using hidden Markov models. Hum Mutat 34: 57–65. 10.1002/humu.22225 [DOI] [PMC free article] [PubMed] [Google Scholar]
- Siepel A, Bejerano G, Pedersen JS, Hinrichs AS, Hou M, Rosenbloom K, Clawson H, Spieth J, Hillier LW, Richards S, et al. 2005. Evolutionarily conserved elements in vertebrate, insect, worm, and yeast genomes. Genome Res 15: 1034–1050. 10.1101/gr.3715005 [DOI] [PMC free article] [PubMed] [Google Scholar]
- Sing T, Sander O, Beerenwinkel N, Lengauer T. 2005. ROCR: visualizing classifier performance in R. Bioinformatics 21: 3940–3941. 10.1093/bioinformatics/bti623 [DOI] [PubMed] [Google Scholar]
- Uhlen M, Fagerberg L, Hallstrom BM, Lindskog C, Oksvold P, Mardinoglu A, Sivertsson A, Kampf C, Sjostedt E, Asplund A, et al. 2015. Tissue-based map of the human proteome. Science 347: 1260419 10.1126/science.1260419 [DOI] [PubMed] [Google Scholar]
- The UK10K Consortium. 2015. The UK10K project identifies rare variants in health and disease. Nature 526: 82–90. 10.1038/nature14962 [DOI] [PMC free article] [PubMed] [Google Scholar]
- Williamson SH, Hernandez R, Fledel-Alon A, Zhu L, Nielsen R, Bustamante CD. 2005. Simultaneous inference of selection and population growth from patterns of variation in the human genome. Proc Natl Acad Sci 102: 7882–7887. 10.1073/pnas.0502300102 [DOI] [PMC free article] [PubMed] [Google Scholar]
- Wong WC, Kim D, Carter H, Diekhans M, Ryan MC, Karchin R. 2011. CHASM and SNVBox: toolkit for detecting biologically important single nucleotide mutations in cancer. Bioinformatics 27: 2147–2148. 10.1093/bioinformatics/btr357 [DOI] [PMC free article] [PubMed] [Google Scholar]
- Worth CL, Preissner R, Blundell TL. 2011. SDM—a server for predicting effects of mutations on protein stability and malfunction. Nucleic Acids Res 39: W215–W222. 10.1093/nar/gkr363 [DOI] [PMC free article] [PubMed] [Google Scholar]
- Xiong HY, Alipanahi B, Lee LJ, Bretschneider H, Merico D, Yuen RK, Hua Y, Gueroussov S, Najafabadi HS, Hughes TR, et al. 2015. The human splicing code reveals new insights into the genetic determinants of disease. Science 347: 1254806 10.1126/science.1254806 [DOI] [PMC free article] [PubMed] [Google Scholar]
- Yang Z. 2006. Computational molecular evolution. Oxford University Press, Oxford. [Google Scholar]
- Zeng J, de Vlaming R, Wu Y, Robinson MR, Lloyd-Jones LR, Yengo L, Yap CX, Xue A, Sidorenko J, McRae AF, et al. 2018. Signatures of negative selection in the genetic architecture of human complex traits. Nat Genet 50: 746–753. 10.1038/s41588-018-0101-4 [DOI] [PubMed] [Google Scholar]
- Zhang J, Yang J-R. 2015. Determinants of the rate of protein sequence evolution. Nat Rev Genet 16: 409–420. 10.1038/nrg3950 [DOI] [PMC free article] [PubMed] [Google Scholar]
- Zhou J, Troyanskaya OG. 2015. Predicting effects of noncoding variants with deep learning–based sequence model. Nat Methods 12: 931–934. 10.1038/nmeth.3547 [DOI] [PMC free article] [PubMed] [Google Scholar]
Associated Data
This section collects any data citations, data availability statements, or supplementary materials included in this article.