

Abstract
Binding to isolectin-B4 (IB4) and expression of tyrosine kinase A (trkA) (the high-affinity NGF receptor) have been used to define two different subgroups of nociceptive small dorsal root ganglion (DRG) neurons. We previously showed that only nociceptors have high trkA levels. However, information about sensory and electrophysiological properties in vivo of single identified IB4-binding neurons, and about their trkA expression levels, is lacking. IB4-positive (IB4+) and small dark neurons had similar size distributions. We examined IB4-binding levels in >120 dye-injected DRG neurons with sensory and electrophysiological properties recorded in vivo. Relative immunointensities for trkA and two TTX-resistant sodium channels (Nav1.8 and Nav1.9) were also measured in these neurons. IB4+ neurons were classified as strongly or weakly IB4+.
All strongly IB4+ neurons were C-nociceptor type (C-fiber nociceptive or unresponsive). Of 32 C-nociceptor-type neurons examined, ∼50% were strongly IB4+, ∼20% were weakly IB4+ and ∼30% were IB4−. Aδ low-threshold mechanoreceptive (LTM) neurons were weakly IB4+ or IB4−. All 33 A-fiber nociceptors and all 44 Aα/β-LTM neurons examined were IB4−. IB4+ compared with IB4− C-nociceptor-type neurons had longer somatic action potential durations and rise times, slower conduction velocities, more negative membrane potentials, and greater immunointensities for Nav1.9 but not Nav1.8. Immunointensities of IB4 binding in C-neurons were positively correlated with those of Nav1.9 but not Nav1.8. Of 23 C-neurons tested for both trkA and IB4, ∼35% were trkA+/IB4+ but with negatively correlated immunointensities; 26% were IB4+/trkA−, and 35% were IB4−/trkA+. We conclude that strongly IB4+ DRG neurons are exclusively C-nociceptor type and that high Nav1.9 expression may contribute to their distinct membrane properties.
Keywords: IB4, nociceptive, sodium channel, action potential, trkA, DRG, pain, NGF
Introduction
Isolectin-B4 (IB4) from the plant Griffonia simplicifolia binds to small dorsal root ganglion (DRG) neurons through α-d-galactose carbohydrate residues on their soma membranes (Silverman and Kruger, 1990; Fullmer et al., 2004). Common assumptions, that IB4-binding [IB4-positive (IB4+)] DRG neurons are nociceptive and that nociceptors can be divided into nonoverlapping populations of trkA+ (tyrosine kinase A) and IB4+ neurons, are based on circumstantial evidence with little confirmatory data from definitively identified neurons. This circumstantial (mainly immunohistochemical) evidence includes restriction of IB4 binding to small DRG neurons and dorsal horn lamina II (inner), a region receiving nociceptive inputs (Plenderleith et al., 1992; Kitchener et al., 1993; Molliver et al., 1995). The only previous study on identified DRG neurons reported that IB4+ neurons included both C- and A-fiber nociceptors (Gerke and Plenderleith, 2001). However, small numbers of neurons in that study left room for doubt about whether IB4 binding is nociceptor specific. Furthermore, their findings conflict with evidence that IB4+ neurons are rarely neurofilament rich (Wang et al., 1994), suggesting (Lawson and Waddell, 1991) that few, if any, have A-fibers.
IB4+ DRG neurons express receptor components for glial cell line-derived neurotrophic factor (GDNF) and preferentially transport GDNF, which influences their survival and properties (Molliver et al., 1997; Bennett et al., 1998; Leitner et al., 1999; Zwick et al., 2002). TrkA, the high-affinity nerve growth factor (NGF) receptor, is expressed by nociceptive DRG neurons (Fang et al., 2005a). The extent of colocalization between trkA expression and IB4 binding in DRG neurons is generally assumed to be very low, despite reported variability (Averill et al., 1995; Kashiba et al., 2001). Thus, neither proportions nor sensory properties of neurons showing both trkA expression and IB4 binding are clear.
Acutely isolated IB4+ and IB4− small DRG neurons (rat and mouse) show distinct electrophysiological properties. IB4+ neurons have longer somatic action potential (AP) duration and higher TTX-resistant Na+-current densities (Stucky and Lewin, 1999; Wu and Pan, 2004), but the identity of the TTX-resistant channel(s) was unknown. Furthermore, fiber conduction velocities (CVs) could not be measured. Because A-fiber neurons have narrower APs than C-fiber neurons (Fang et al., 2005c), any small A-fiber neurons in the IB4− group would have contributed to these findings. We have therefore determined whether this difference exists between IB4+ and IB4− C-fiber neurons. Ion channels that could cause such differences include the TTX-resistant channels Nav1.8 and Nav1.9, which are both expressed most strongly in small C-nociceptors (Fang et al., 2002; Djouhri et al., 2003b). Nav1.9 probably contributes to long AP durations typical of slowly conducting nociceptors (Herzog et al., 2001; Fang et al., 2002); Nav1.8 has been associated with somatic AP amplitude and long AP duration in A-fiber nociceptors (Renganathan et al., 2001; Djouhri et al., 2003b; Fang et al., 2005a).
We therefore determined in >120 rat lumbar DRG neurons physiologically characterized in vivo: whether (1) all IB4+ neurons are nociceptive; (2) any A-fiber nociceptors are IB4+; (3) C-fiber neuron electrophysiological properties differ in relation to IB4 binding; (4) Nav1.8 and/or Nav1.9 immunoreactivities differ between IB4+ and IB4− C-fiber neurons; and (5) proportions and properties of neurons that are both IB4+ and trkA+.
Materials and Methods
Experimental procedures complied throughout with Home Office guidelines (United Kingdom). Details of experimental methods have been described previously (Fang et al., 2002, 2005c).
Young female adult Wistar rats (7 weeks of age, 160–180 g) were deeply anesthetized initially with sodium pentobarbitone (70–80 mg/kg, i.p.) and maintained areflexic with supplementary doses (10 mg/kg) throughout the experiments. Cannulation of the left external jugular vein and carotid artery allowed supplementary anesthetic at regular intervals and blood pressure monitoring. Animals were intubated and artificially ventilated, and end-tidal CO2 was monitored throughout. After laminectomy, the left L3–L6 DRGs were exposed, and a liquid paraffin pool was constructed using silicone dental impression paste Xantopren VL Plus (Heraeus Kulzer, Hanau, Germany). The temperature around the DRGs was monitored and maintained between 28.5 and 32°C throughout. The dura over the spinal cord was opened, and the dorsal root of the DRG under examination was cut, close to its entry to the spinal cord, and placed over a pair of platinum stimulating electrodes. Before recording, the left leg was extended. The dorsal surface of the foot was glued downward to a platform with Loctite super glue (Henkel, Dublin, UK), leaving the back of the leg and the plantar surface of the foot facing upward. The dorsal (downward) surface of the foot was therefore not available for stimulation.
Intracellular recording.
To improve recording stability, a muscle relaxant, pancuronium bromide (0.6 mg/kg, i.v.) accompanied by anesthetic (10 mg/kg, i.v.) was administered just before recording; the same doses of muscle relaxant and anesthetic were given together at regular intervals (∼1 h) throughout recording (usually ∼3 h). Intracellular voltage recordings from DRG neuronal somata were made with sharp glass microelectrodes filled with a fluorescent dye. The fluorescent dyes were: 50 mg/ml Lucifer yellow CH (Sigma, St. Louis, MO) in 0.1 m LiCl, 6 mg/ml ethidium bromide (Sigma) in 1 m KCl, 3% cascade blue (Invitrogen, Eugene, OR) in 0.1 m LiCl. The microelectrode was advanced in 1 μm steps, and cell penetration was often made by a brief high-frequency pulse of current, although such pulses were used minimally to avoid dye leakage, especially when the electrode contained ethidium bromide (Lawson et al., 1997). When a resting membrane potential (Em) was obtained, electrical stimulation was applied to the dorsal root with single rectangular pulses (duration, 0.03 ms for A-fiber neurons or 0.3 ms for C-fiber neurons). The stimulation voltage was 1–2 times the threshold for evoking a somatic AP. These APs were recorded online with a CED 1401 plus interface (Cambridge Electronic Design, Cambridge, UK) and the SIGAV program (Cambridge Electronic Design).
Spontaneous activities.
Before the receptive field was stimulated (see below), the presence of any spontaneous/ongoing activities was recorded usually for 1–2 min. Even 1 nonevoked AP during this time would be classed as spontaneous firing.
Conduction velocity.
CV was determined by division of the conduction distance between the neuron in the DRG and the cathode (in these experiments: range, 3.6–14.2 mm; mean, 7.7 ± 2.1 mm) by the latency to the onset of the somatic AP of that neuron as described previously (Djouhri and Lawson, 2001). Utilization time was not taken into account. The dorsal root fiber CV of each neuron was classified as C (<0.8 m/s), C/Aδ (0.8–1.5 m/s, included with Aδ neurons unless stated otherwise), Aδ (1.5–6.5 m/s), or Aα/β (>6.5 m/s), using class boundaries determined previously by compound action potential recordings in rats of the same sex and weight as the experimental animals in this paper (Fang et al., 2002).
Identification of sensory properties.
Details of methods used to identify sensory receptive properties were described previously (Fang et al., 2005c). In brief, hand-held stimulation was applied to the left hindlimb and flank. Initially, non-noxious natural stimuli, including light touch, brushing, tapping, stretching, and light pressure, were applied to the accessible surfaces of the left hindlimb. Neurons responding to these non-noxious mechanical stimuli were classified as low-threshold mechanoreceptive (LTM) units as follows. Fast conducting (Aα/β-fiber) units include the following: glabrous rapidly adapting (RA), slowly adapting (SA), guard hair or field units with cutaneous receptive fields (G/F) and muscle spindle (MS) units. Slowly conducting LTM units include the following: Aδ-fiber down hair (D hair) units (Aδ-LTMs) and C-fiber mechanoreceptor (C-LTM) units.
If neurons failed to respond to these innocuous stimuli, noxious stimuli were applied, including high-intensity mechanical stimulation (pricking, pinching, or strong pressure with needle or fine forceps for superficial cutaneous tissue or coarse toothed forceps for deeper cutaneous and subcutaneous tissues) and noxious thermal stimulation (cooling by a brief localized spray of ethyl chloride and/or noxious heating with hot water >50°C). Neurons that responded only to the above noxious mechanical and/or thermal stimuli were called nociceptors. These units included high-threshold mechanoreceptors (HTMs), polymodal, mechano-heat, and mechano-cold units (see below).
Nociceptive units that responded to mechanical stimuli were classified into three subgroups according to depth of their receptive field: superficial (probably epidermal or at the border of epidermis and dermis), dermal, or subcutaneous as follows. Units that responded to needle pressure and pinch of only superficial tissues with fine forceps were defined as having superficial receptive fields. Units that failed to respond to this stimulation of superficial tissues but responded to squeeze of a fold of skin tissue including dermis were classified as having dermal receptive fields. Units that failed to respond to both the above superficial and dermal stimuli but responded to squeeze across the foot or whole leg, or pressure to deeper tissues including deep fascia, muscle, and associated connective tissue and periosteum were defined as having subcutaneous receptive fields. A-fiber nociceptors with dermal or subcutaneous receptive fields were pooled and categorized as deep.
Nociceptive units that responded to noxious mechanical stimuli were classified as HTM units if they had either (1) superficial receptive fields but failed to respond to noxious thermal stimuli or (2) dermal or subcutaneous receptive fields and were not tested with noxious thermal stimuli because of difficulty of adequate penetration of thermal stimuli to the terminals of these units. A-fiber HTM units included moderate pressure units (Burgess and Perl, 1967; Fang et al., 2005c).
The heat stimulus used in this study was a noxious heat stimulus. This was a single brief (a few seconds) application to the skin of hot water >50°C in temperature, applied through a 20 ml syringe with no needle attached. C-fiber units that responded promptly to heat as well as to noxious mechanical stimuli were classified as C-polymodal neurons if their receptive fields were superficial in skin tissues or as C-mechano-heat neurons if they had dermal receptive fields. Using this stimulus, we find that very few A-nociceptors respond to this heat stimulus; presumably, their heat thresholds are rarely reached by this stimulus. Because such units were not dye injected, they could not be included in the present study. C- and A-fiber mechano-cold neurons responded to both noxious mechanical and to noxious cooling stimuli.
Unresponsive neurons did not respond to any of the above stimuli. C-fiber unresponsive neurons recorded in this preparation have electrophysiological properties that are similar to C-nociceptive neurons and very different from those of C-LTMs both in guinea pig (Djouhri et al., 1998) and rat (Fang et al., 2005c). Their immunocytochemical properties (Nav1.8, Nav1.9, and trkA immunoreactivities) are also similar to C-nociceptors in rat (Fang et al., 2002, 2005a; Djouhri et al., 2003b). They are therefore likely to be nociceptive units with very high thresholds, sometimes called “silent nociceptors,” although they may include a few units with inaccessible receptive fields [see above; also for discussion see Djouhri et al. (1998) and Fang et al. (2005c)]. Therefore, in this paper we use the term C-nociceptor type to include C-unresponsive neurons (n = 14) and C-fiber nociceptive neurons (n = 18). There were 33 A-fiber nociceptive neurons (Aδ, n = 12; Aα/β, n = 21). We excluded A-fiber unresponsive neurons (unless specifically stated) from the analyses because the electrophysiological properties of some were similar to A-fiber LTMs, whereas those of others were similar to A-fiber nociceptors (Fang et al., 2005c); these unresponsive units may have had deep or otherwise inaccessible receptive fields (see above).
Neuronal labeling.
The methods for labeling an identified DRG neuronal soma have been described in detail previously (Fang et al., 2002). In brief, after completion of electrophysiological recordings and characterization of sensory receptive properties, the neuron was electrophoretically injected with fluorescent dye from the recording electrode by rectangular current pulses (1.0–1.3 nA for 500 ms at 1 Hz) for periods of up to 15 min for A-fiber neurons and 8 min for C-fiber neurons. Lucifer yellow and cascade blue were ejected with negative current, and ethidium bromide was ejected with positive current. All but 11 neurons were recorded in L5 DRGs. In these ∼2-mm-long DRGs, usually five neurons per DRG were dye injected. These were spaced approximately equally longitudinally along the DRG as follows. Lucifer yellow was injected into one neuron at the proximal end, one distal, and one neuron in the midregion, and ethidium bromide was injected into two neurons, one proximal and one distal to the middle Lucifer yellow-injected neuron. In some ganglia, a neuron lateral to the Lucifer yellow-injected neuron was injected with cascade blue.
At the end of the experiment, the animal was given an additional dose of anesthetic, and a transcardiac perfusion was made with normal saline followed by Zamboni's fixative. DRGs were removed, further fixed for 1 h, and then stored overnight in 30% sucrose buffer at 4°C. Serial 7-μm-thick cryostat sections were cut and scanned for the presence of dye-labeled neuronal profiles. A Hamamatsu (Hamamatsu City, Japan) digital camera was used to capture images of dye-labeled neurons. Slides were stored at −20°C until immunocytochemistry was performed.
Precautions described previously (Lawson et al., 1997) were taken to avoid any problems and pitfalls associated with identification of dye-injected cells attributable to possible occasional dye leakage. In addition, after dye injection, the receptive field and somatic AP shape were re-examined to ensure that the electrode tip remained in the same neuron. Neurons were rejected if, during subsequent histological examination, the position and depth of each dye-labeled neuron relocated within the DRG did not match closely with records made during intracellular recording, if more than one cell was labeled with any one dye in that region of the DRG, or if the fluorescent dye labeling of the neuronal soma was very weak (Lawson et al., 1997).
Immunocytochemistry.
For immunostaining of IB4 binding, after blocking endogenous peroxidase and biotin-like activity with 2% H2O2 and an avidin–biotin blocking kit (Vector Laboratories, Peterborough, UK), respectively, sections were incubated for 1 h with unconjugated IB4 lectin (2.5 μg/ml; catalog #L-1104; Vector Laboratories) in PBS, followed by incubation with primary polyclonal antibody made in goat against IB4 (1:8000, catalog #AS-2104; Vector Laboratories) for 48 h at 4°C. Sections were then incubated for 30 min at room temperature with secondary antibody: horse anti-goat Ig (Vector Laboratories) at 1:200. ABC reagents (Vector Laboratories) were applied at room temperature for 30 min followed by a DAB color reaction (Vector Laboratories). Omission either of primary antibody or of the IB4-binding step resulted in no staining.
On separate sections of the same dye-injected neurons that were stained for IB4 (above), ABC immunocytochemistry was performed with fully characterized primary antibodies (see below) to demonstrate trkA-like immunoreactivity (Fang et al., 2005a) and, where possible, Nav1.8-like immunoreactivity (Djouhri et al., 2003b) and Nav1.9-like immunoreactivity (Fang et al., 2002). Only one antibody was tested on each section. Polyclonal primary antibodies included the following: anti-trkA (1:7500; a gift from L. F. Reichardt, University of California, San Francisco, CA); anti-Nav1.8 α-subunit (1.7 × 10⁻³ μg/ml; from J. N. Wood, Department of Biology University College, London, UK, and K. Okuse, Faculty of Life Sciences, Imperial College, London, UK); anti-Nav1.9 α-subunit (1.7 × 10⁻³ μg/ml; from S.G. Waxman). For characterization of these antibodies, see the following: anti-trkA (Clary and Reichardt, 1994), anti-Nav1.9 (Fjell et al., 2000), and anti-Nav1.8 (Djouhri et al., 2003b).
Image analysis.
The semiquantitative methods to measure immunocytochemical reaction product intensities (immunointensity) for trkA (Fang et al., 2005a), Nav1.8 (Djouhri et al., 2003b), and Nav1.9 (Fang et al., 2002) have been described previously and are described below for IB4 binding. For each neuronal profile measured, the mean pixel density of IB4 binding within the cytoplasm (excluding the nucleus), as well as the cell cross-sectional area (including the nucleus), was determined with image analysis using Digital Pixel software (Digital Pixel, Brighton, UK) after image capture under standardized conditions with a digital camera (Hamamatsu) through a Leica (Wetzlar, Germany) DMRBE microscope under bright-field optics using a 40× objective.
The relative immunointensity of each dye-injected neuron was first scored subjectively as 0 (negative) or 1–5 (positive, 5 being the score of the most intensely stained profile in the section). It was then calculated objectively with image analysis (see above) of pixel density as follows. The 0 and 100% immunointensity values for neurons in the same section as the dye-injected neuron were calculated by averaging the cytoplasmic pixel density of the three least intensely (0%, a) and three most intensely stained cell profiles (100%, b); for each dye-injected neuron, the cytoplasmic pixel density (c) was used to determine its relative intensity (percentage of maximum) using the following equation: percentage relative immunointensity = (100 × (c − a)/(b − a))%
Therefore, the relative immunointensity provides a measure of the absorbance of light by the reaction product in the cytoplasm of each dye-labeled cell, relative to that in the cytoplasm of other cells in the same section.
It was necessary to determine whether dye injection had an effect on IB4 binding or immunostaining and to determine the relationship between staining intensity of IB4 binding and soma size (cross-sectional area) for all non-dye-injected DRG neurons (for comparison with that for dye-injected neurons). For this, images of all sections at 280 μm intervals through ipsilateral L5 DRGs containing no dye-injected neurons from three experimental rats were captured with the 40× objective. A high-power montage was produced of each section. All neuronal profiles containing a nucleus in each section were measured using image analysis as above. The relative intensity of the cytoplasm of each such neuronal profile was derived, using the same equation as the above, by comparing its cytoplasmic intensity with the mean cytoplasmic intensities of the five least intensely stained (0%) and the five most intensely stained neurons (100%) in all sections from that DRG.
The terms intensity or immunointensity are used to indicate relative staining intensity (percentage of maximum staining intensity) for IB4 binding, trkA, Nav1.8, and Nav1.9 immunoreactivities from this point.
The methods of determining the borderline of intensity for positive and negative neurons have been described previously for trkA (Fang et al., 2005a), Nav1.8 (Djouhri et al., 2003b), and Nav1.9 (Fang et al., 2002). As previously described for trkA, Nav1.8, and Nav1.9, intensities of IB4 binding were highly positively correlated with subjective scores (linear regression analysis, r2 = 0.96, p < 0.0001, n = 126; data not shown). Neurons that were judged as IB4+ by the observer (subjective score ≥1) consistently had intensities ≥20%, whereas those scored as negative (subjective score <1) consistently had intensities <20%. Therefore, the borderline between IB4− and IB4+ in this study was taken as 20% intensity; thus, IB4+ neurons had intensities of ≥20% and IB4− neurons had intensities of <20%, although even in these neurons, very low levels of IB4 binding cannot be excluded. Based on the distributions of data (see later), neurons were classed as strongly IB4+ if their intensity was ≥40% and weakly IB4+ if their intensity was 20–40%.
Cell size.
The largest cross-sectional area of all of the sections of each dye-injected neuron was taken as its profile size. The methods used to determine size distributions of DRG neurons in young female Wistar rats have been described previously (Fang et al., 2005a). In brief, neurons were divided into small, medium, and large sizes as follows: neurons within the small cell peak were called small (cross-sectional area up to 400 μm2; diameter, 23 μm), those of >800 μm2 area (diameter, 32 μm) were called large because this includes only the extreme right end of the large light cell distribution (Lawson et al., 1984), and those between 400 and 800 μm2 (diameter, 23–32 μm), a size range which included most Aδ-fiber neurons (Fang et al., 2002) (see Fig. 1), were called medium sized. These values relate to size distributions for DRGs in this study but are not necessarily applicable to other studies, because size distributions vary with species, age, tissue processing, methods, etc.
Figure 1.

IB4 intensity versus cell size. A–D, Staining intensity of IB4 binding versus cell size in control (non-dye-injected) (A, B) and dye-injected, identified (C, D) DRG neurons. A, B, All neuronal profiles with visible nuclei in sections of three L5 DRGs (one from each of three rats) were measured. Relative intensity of IB4 binding is plotted against soma size (A; cross-sectional area) and as size distribution histograms (B). B, Cross-hatched histograms of all neurons are superimposed by gray histograms of all IB4+ neurons (intensity ≥20%), and superimposed in black are histograms of strongly IB4+ neurons (intensity ≥40%). The inset histogram a shows all IB4− (intensity <20%), and histogram b replicates the gray histogram in B to show all IB4+ (intensity ≥20%) neurons for ease of comparison with a. C, D, Relative intensity of IB4 binding versus cell size in dye-injected, physiologically identified neurons is shown, with overall layout similar to A and B. C, Nociceptors are indicated with filled circles and LTMs with open circles. NOC, Nociceptive neurons; CUNR, C-fiber unresponsive neurons; +ve, positive; -ve, negative. D, Neurons are subdivided according to their dorsal root CVs. Histogram shading in D is as for B. C, There was a significant correlation between the cross-sectional area and IB4-binding intensity in all dye-injected neurons studied (n = 64, Aα/β unresponsive excluded; p < 0.0001; r2 = 0.37) as well as in all nociceptor-type units (n = 38; p = 0.0005; r2 = 0.29) and all LTMs (n = 26, p < 0.01, r2 = 0.27). Vertical dotted lines indicate boundaries between small, medium, and large neurons. Horizontal dotted lines in A and C indicate 20 and 40% borderlines between negative (<20%), weakly positive (20–40%), and strongly positive (>40%) neurons.
Analyzed AP variables.
Somatic AP variables [Djouhri et al. (1998), their Fig. 1] were measured off-line with a script in the Spike II program (Cambridge Electronic Design). These variables were measured only in neurons with Ems equal to or more negative than −40 mV. AP overshoot and AP height were included in the analysis for neurons that met the −40 mV Em criterion above and that also had overshooting somatic APs, i.e., a positive AP overshoot. CV measures were included from all neurons regardless of AP amplitude and Em.
Possible sources of error or sampling bias.
Intracellular penetrations and stable recordings are much easier to achieve in large neurons, which tend to have fast conducting fibers. The most commonly recorded neurons were Aα/β-fiber LTM neurons, and thus in order to concentrate on nociceptors and slowly conducting LTMs, many Aα/β-fiber LTM neurons were rejected during recording. Furthermore, it took longer to ensure that unresponsive neurons really responded to none of the available stimuli; because of the difficulty of maintaining stable recordings in C-fiber neurons, a higher proportion of unresponsive C-fiber neurons were lost before they were fully tested. For all of these reasons, the proportions of different types of dye-labeled neurons (e.g., A-fiber neurons compared with C-fiber neurons) do not represent their numerical distribution within the DRG. However, the percentages of immunopositive neurons within a particular group (e.g., C-fiber nociceptive units) are considered representative for that group.
Statistics.
Linear regression analysis (see Figs. 1, 3, 4, 6), and nonparametric Mann–Whitney U test (see Figs. 2, 5) and Kruskal–Wallis tests (see Fig. 2) were performed with GraphPad Prism 4 software (GraphPad Software, San Diego, CA).
Figure 3.
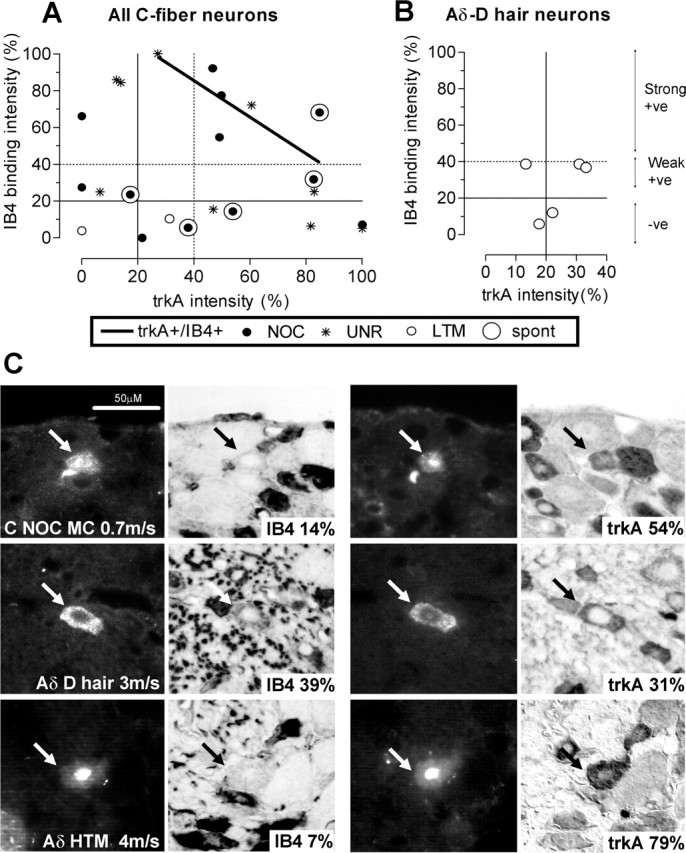
TrkA and IB4 colocalization in identified DRG neurons. Immunoreactivity for trkA and IB4 binding measured on different sections through the same dye-injected neurons. A, B, The relationship between relative intensity of IB4-binding (y-axis) and trkA (x-axis) immunoreactivity on different sections of the same C-fiber neurons (A) and Aδ-LTM units (B). From each axis, the solid lines indicate the 20% (positive/negative) borderline and the dotted lines indicate the 40% (weakly positive/strongly positive) borderline. For all C-fiber neurons positive (>20%) for both (5 nociceptive and 3 unresponsive units), there was a significant negative linear correlation between the relative intensity of the two markers (p < 0.05; r2 = 0.62; n = 8). +ve, positive; -ve, negative. C, Photomicrographs of three representative neurons to show IB4 binding and trkA staining on two different sections. Arrows indicate dye-injected profiles before immunocytochemistry (columns 1 and 3) and after immunocytochemistry (columns 2 and 4). Sensory receptive properties and conduction velocity are given on column 1 image; percentage relative staining intensity is also shown (columns 2 and 4). The scale bar (top left image) applies to all photomicrographs. MC, C-mechano-cold; NOC, nociceptive; HTM, high threshold mechanoreceptor.
Figure 4.

IB4 intensity versus CV. Relationship between IB4-binding immunointensity and CV in identified DRG neurons. IB4 staining for C- (<0.8 m/s) and A- (>1.5 m/s) fiber neurons are shown separately. A-fiber unresponsive units are excluded. The vertical dotted lines from the x-axis indicate the upper border of CV for C-fibers (0.8 ms), C/Aδ- (1.5 m/s), and Aδ-fibers (6.5 m/s). Regression lines, p values, and r2 values are given for significant linear correlations. The dotted lines from the y-axis and symbols are as in Figure 2. NOC, Nociceptive neurons; LTM, low-threshold mechanoreceptive; C UNR, C-fiber unresponsive neurons; +ve, positive; -ve, negative.
Figure 6.
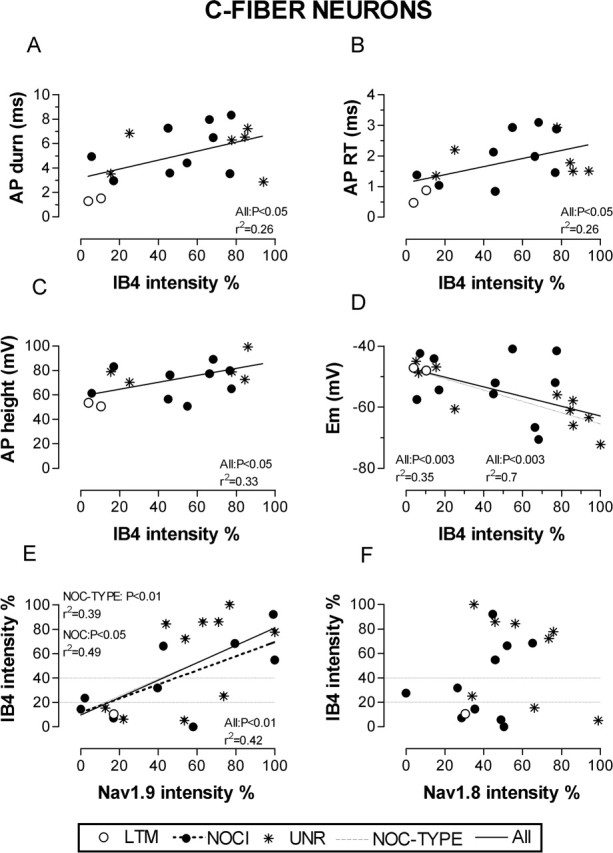
IB4 intensity versus electrophysiology and Na+ channel expression in C-neurons. A–D, IB4-binding intensity in C-fiber DRG neurons in relation to membrane properties. A, AP duration; B, AP rise time (RT); C, AP height; D, Em. E, F, IB4-binding intensity plotted against Na+ channel expression. E, Nav1.9 intensity; F, Nav1.8 intensity. The criteria for accepting neurons for AP variable analysis are as in Figure 5. NOC/NOCI, nociceptors; UNR, unresponsive; NOC-TYPE, nociceptors and unresponsive units altogether. Where a significant linear correlation exists, regression lines, p values, and r2 values are given for significant linear correlations. The dotted lines from the y-axis and symbols are as in Figure 2.
Figure 2.
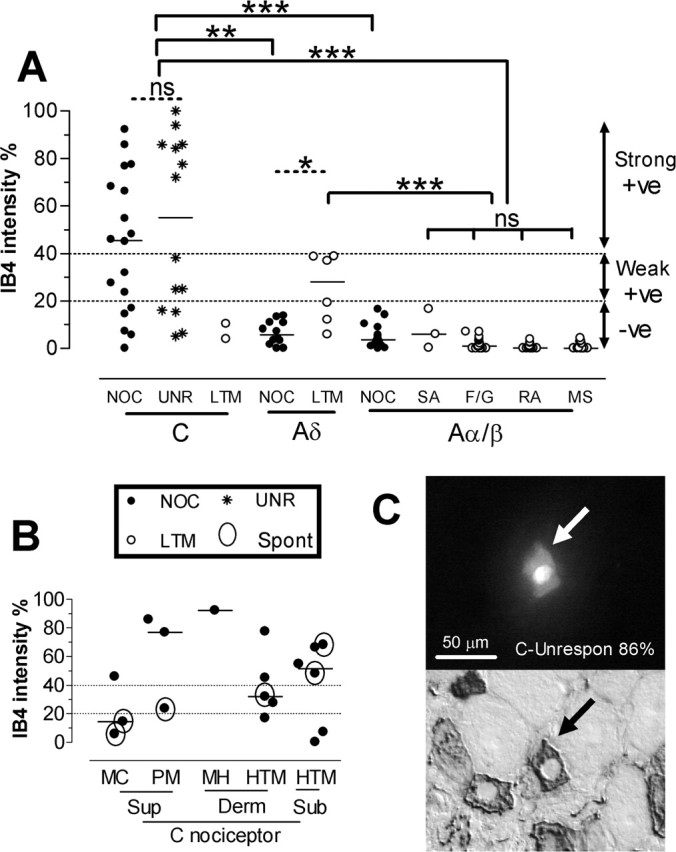
A, Intensity of IB4 binding in relation to sensory properties and CV. Medians are shown with fine horizontal lines. A-fiber unresponsive units are excluded. NOC, Nociceptive neurons; UNR, C-fiber unresponsive neurons; LTM, low-threshold mechanoreceptive neurons; F/G, field or guard hair neurons; RA, rapidly adapting LTM neurons; SA, slowly adapting LTMs; MS, muscle spindle afferents; +ve, positive; -ve, negative. The dotted lines from the y-axis are as described for Figure 1. Horizontal lines above the columns indicate statistical tests (dotted, Wilcoxon ranking test; solid, Kruskal–Wallis test) between column medians. There was no significant difference between the C-nociceptive and C-unresponsive groups or between the four Aα/β-LTM groups (Kruskal–Wallis test). These were therefore combined to create C-nociceptor-type and Aα/β-LTM groups, respectively. C-nociceptor-type units were compared using a Kruskal–Wallis test with all other groups except C-LTM (too few data). Levels of significance are shown above the lines linking appropriate groups: ns, not significant; *p < 0.05; **p < 0.01; ***p < 0.001. B, The inset shows the data for C-fiber nociceptors divided into subgroups defined by receptive properties and receptive field depth in the tissues. MC, C-mechano-cold; PM, C-polymodal; MH, C-mechano-heat; Sup, superficial; Derm, dermal; Sub, subcutaneous. Open circles around data points indicate which units showed spontaneous (Spont)/ongoing firing. C, An example of a dye-injected C-fiber unresponsive nociceptor-type neuron (top) and the same neuron after immunocytochemistry show strong IB4-binding intensity.
Figure 5.
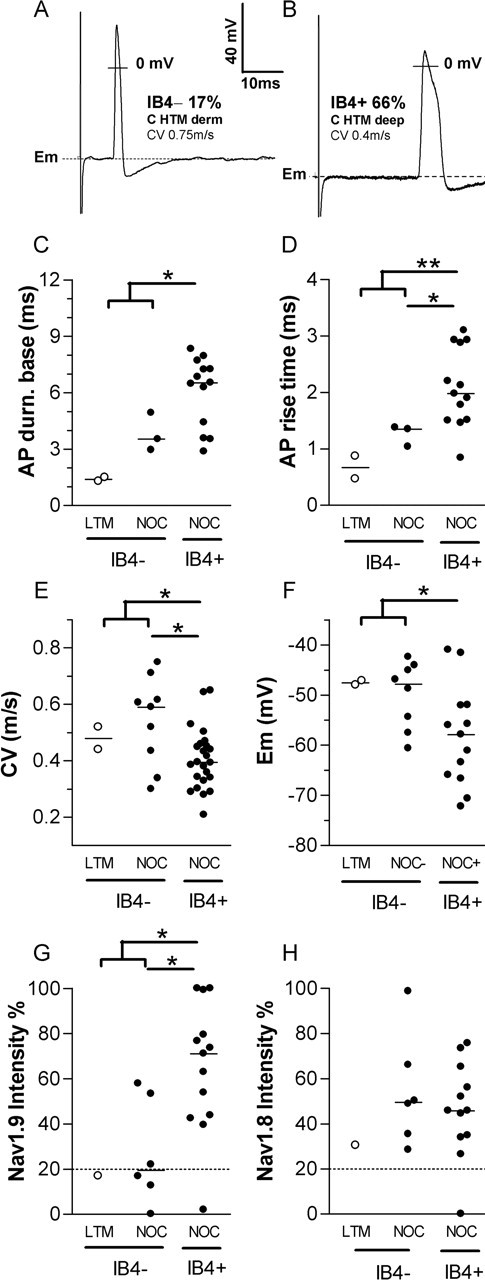
Electrophysiology and Na+ channel expression in IB4+ and IB4− C-fiber neurons. A, B, Examples of typical somatic APs evoked by dorsal root stimulation in an IB4− C-nociceptor (A), and an IB4+ C-nociceptor (B). derm, Dermal. C–H, Comparison of electrophysiological properties (C–F) and relative intensities of two TTX-resistant Na+ channels (G, H) between IB4− and IB4+ C-fiber neurons (CV, <0.8 m/s). C, AP duration at base; D, AP rise time; E, CV; F, Em; G, Nav1.9 relative intensity; H, Nav1.8 relative intensity. AP duration at base (AP durn. base; C) and AP rise time (D) are plotted only in neurons with overshooting somatic AP and membrane potential more negative than, or equal to, −40 mV. Mann–Whitney U tests were performed to compare the median values of each plotted variable between all of the IB4+ (C-fiber-nociceptor type, nociceptive and unresponsive) units and all of the IB4− units together (nociceptor type plus C-LTM) or all C-fiber IB4− nociceptor-type units. Where a significance was found, asterisks indicate significance levels: *p < 0.05, **p < 0.01. Open symbols indicate C-LTMs; solid symbols indicate C-fiber nociceptor-type units. LTM, Low-threshold mechanoreceptors; NOC, C-nociceptor-type neurons.
Abstracts containing some of the preliminary data from this study were published previously (Fang et al., 2001, 2005b).
Results
Normal non-dye-injected DRG neurons
The overall relationship of soma size to IB4 staining intensity in normal (non-dye-injected) DRG neurons shows that IB4+ and IB4− neurons have distinct distributions. The sizes of both IB4+ and IB4− neurons appear normally distributed, with IB4+ neurons being small (≤400 μm2), as reported previously (Wang et al., 1994; Molliver et al., 1995), and IB4− neurons being small, medium, and large sized (Fig. 1A,B). Most (89%; 662 of 741) small neurons were IB4+ (intensity ≥20%); indeed 81% (597 of 741) were strongly IB4+ (intensity ≥40%). This differs from trkA staining, because many medium-sized and some large neurons are trkA+ (Fang et al., 2005a). Interestingly, the size distribution of IB4+ neurons closely mimics that of the “small dark” neurofilament-poor neurons that have C-fibers (Fig. 1 B, inset b), whereas the IB4− neuronal size distribution has a larger mean size and a broader size range (Fig. 1 B, inset a), similar to that of “large light” or neurofilament-rich DRG neurons that have A-fibers (Lawson et al., 1984; Lawson and Waddell, 1991). These size distributions are thus consistent with a report that only 3% of DRG neurons were both neurofilament-rich and IB4+ in rat (Wang et al., 1994). Of the normal neuronal profiles, 64% (683 of 1059) were IB4+, and 60% (638/1059) were strongly IB4+. These values are similar to previously reported percentages of lumbar DRG neurons that are IB4+ as follows: 51% (Wang et al., 1994), 67% (Molliver et al., 1995), and 64% (Kashiba et al., 2001). They are also similar to the percentages of neuronal profiles that are neurofilament-poor (60%) or small dark neurons (64%) (Lawson et al., 1984). All of these findings suggest that (1) IB4 may be a marker for most or all of the small dark, neurofilament-poor neuronal population, and therefore that (2) IB4+ neurons have C-fibers and (3) that most IB4− neurons have A-fibers.
IB4 binding in identified DRG neurons
In total, 126 neurons were successfully injected with fluorescent dye, appropriately located and immunostained for IB4 binding. These included 68 neurons labeled with Lucifer yellow, 44 with ethidium bromide, and 14 with cascade blue. Of these, 115 were in L5, 6 in L6, 4 in L4, and 1 in L3 DRGs. They included 51 nociceptors, 52 LTMs, and 23 unresponsive units. The LTMs included 2 C-LTMs, 6 Aδ-LTMs, and 44 Aα/β units, including 16 G/F, 11 MS afferents, 14 RA glabrous units, and 3 SA units. In 64 of these 126 neurons, the largest of all of the sections through the neuron was measured as an estimate of cell size; in the rest, the largest section was not available, and cell size was not measured. Comparison of Figure 1A and C shows that recording and dye injection (Fig. 1C) did not discernibly alter the relationship between cell size and IB4 binding, although the proportion of small neurons that was IB4− was higher in the dye-injected population. The reason for this is unclear, but it may indicate that some of the smallest neurons that are strongly IB4+ may have been underrepresented in the physiological recordings because of greater ease of recording from larger neurons. In addition, receptive fields of some of our dye-injected neurons may have been in muscle, and very few muscle afferents are reported to be IB4+ (Plenderleith and Snow, 1993; Thornton et al., 2005). Comparison of Figure 1B (not dye injected) and D (dye injected) shows similar size distributions, with all strongly IB4+ neurons having small somata and C-fibers (Fig. 1D) and most medium sized IB4+ neurons having C-fibers, although two Aδ-fiber neurons were also weakly IB4+.
C-fiber nociceptive neurons
Most (72%) C-fiber nociceptors and most (71%) C-unresponsive units were IB4+ (intensity ≥20%). There was no difference in the median intensities of C-nociceptive and C-unresponsive neurons, and they were combined into C-nociceptor-type neurons. Approximately half of C-nociceptor-type units (55% C-nociceptors and 50% C-unresponsive units) were strongly IB4+ (intensity ≥40%) (Fig. 2A, Table 1), for example, see Figure 2C. Nearly one-third of C-nociceptor-type units (28% C-nociceptors and 29% C-unresponsive units) were IB4−. C-unresponsive neurons fell into two groups, with no neurons having IB4 intensities between 40 and 70%. All strongly IB4+ neurons were C-nociceptor type (Fig. 2A). Aδ-nociceptors (n = 12) and Aα/β-nociceptors (n = 21, including five moderate pressure units) were all IB4− (Figs. 2A, 3C, Table 1). The median intensity of C-nociceptor-type neurons (45%) was significantly greater than that of all Aα/β-LTMs (0.4%), Aδ-nociceptors (5.7%), and Aα/β-nociceptors (3.6%) (Fig. 2A). An example of an Aδ-nociceptor that was IB4− is shown in Figure 3C. The only C/Aδ unit was unresponsive and IB4−.
Table 1.
Median IB4 intensities and percentages of neuronal groups with IB4 binding
| CV | Sensory receptor type | All cells |
Relative immunointensity |
IB4+ weak (20–40%) |
IB4+ strong (≥ 40%) |
Total IB4+ (≥ 20%) |
||||
|---|---|---|---|---|---|---|---|---|---|---|
| N | Median % | N | % cells | n | % cells | N | % cells | |||
| C | NOCI | 18 | 45 | 3 | 17 | 10 | 55 | 13 | 72 | |
| UNR | 14 | 55 | 3 | 21 | 7 | 50 | 10 | 71 | ||
| LTM | 2 | 7 | 0 | 0 | 0 | 0 | ||||
| Total | 34 | 42 | 6 | 18 | 17 | 50 | 23 | 68 | ||
| Aδ | NOCI | 12 | 5.7 | 0 | 0 | 0 | 0 | 0 | 0 | |
| LTM | 6 | 28 | 3 | 50 | 0 | 0 | 3 | 50 | ||
| Total | 18 | 9 | 3 | 17 | 0 | 0 | 3 | 17 | ||
| Aα/β | NOCI | 21 | 4 | 0 | 0 | 0 | 0 | 0 | 0 | |
| LTM | 44 | 0.4 | 0 | 0 | 0 | 0 | 0 | 0 | ||
| Total | 65 | 1.6 | 0 | 0 | 0 | 0 | 0 | 0 | ||
Median immunointensity in all neurons is shown regardless of whether they were IB4+ or IB4− (column 3). Numbers and percentages of neurons in different groups, defined by CV and sensory properties (columns 1 and 2), which showed weak positive (20–40%) or strongly positive (≥40%) or all positive (≥20%) immunostaining for IB4 binding are shown.
The IB4 intensities of different subgroups of C-nociceptor-type units are illustrated in Figure 2B. There were too few in each subgroup for statistical analysis. However, all heat responsive units (1 of 1 C-mechano-heat and 3 of 3 C-polymodal) were IB4+, but only 1 of 3 C-mechano-cold units was IB4+ but only weakly so, which may indicate a greater tendency for heat rather than cold responsive nociceptors to be strongly IB4+. The median IB4 intensity was 81% for the three heat-responsive and 14% for the three C-mechano-cold units, but these were not significantly different because of the small numbers of neurons (p = 0.11, Mann–Whitney U test). Similar proportions (Fig. 2B) of superficial (4 of 6) and dermal plus deep units (9 of 12) were positive, and their median intensities (35 and 47%) respectively were not significantly different.
C-fiber neurons with ongoing/spontaneous firing
None of the C-unresponsive units showed ongoing/spontaneous activity, nor did the two C-LTMs. In contrast, six nociceptive units showed ongoing firing. These are indicated by open circles around the data points on Figure 2B. The median intensities of all C-nociceptors with ongoing firing compared with those without, had (not significantly) lower IB4 intensity (median 28%, n = 6, compared with 50%, n = 12); the trkA intensity did not differ significantly between these groups (median 54%, n = 5, compared with 48%, n = 8; data not shown). Of the six C-nociceptors with superficial receptive fields (all of which were mechanical nociceptors also responsive to cold and/or heat), the three with the lowest IB4 staining (median 14.5%, n = 3) showed ongoing firing, whereas the rest did not (median IB4 staining 77%, n = 3). Of the units with ongoing firing, the two with the lowest IB4 intensity were C-mechano-cold units. Comparison of cutaneous (superficial plus dermal) C-nociceptors shows that cutaneous C-fiber units with ongoing firing had significantly lower median IB4 staining (19%, n = 4 vs 61%, n = 8; p = 0.028). More data are needed to determine whether the more hyperpolarized Ems of strongly IB4+ neurons might reduce the likelihood of ongoing/spontaneous firing in cutaneous C-nociceptors.
LTM neurons
The only two C-LTMs and all Aα/β-LTM units (n = 44) were IB4− (Fig. 2A). Surprisingly, three of six Aδ-LTM (D hair) units were weakly IB4+ with intensities just <40% (Fig. 2A), although the rest were negative. An example of a weakly positive D-hair unit is shown in Figure 3C. The median IB4 intensity for Aδ-LTM units (28%, n = 6), was significantly higher than that for Aδ-nociceptors (median 6%, n = 12, p < 0.05, Mann–Whitney U test) (Fig. 2A) and than that for all Aα/β-fiber LTM neurons (median 0.4%, n = 44, p < 0.001, Kruskal–Wallis) (Fig. 2A).
Colocalization of trkA and IB4 binding in identified neurons
For the two neuronal subgroups that included IB4+ neurons, namely C-fiber neurons and Aδ-LTMs, linear regression analysis was performed between IB4 and trkA intensities measured on different sections of the same identified dye-injected neurons (Fig. 3A,B). Examples of neurons stained for both are in Figure 3C.
C-fiber neurons
Of 23 C-fiber units tested for both trkA and IB4, 12 were nociceptors, 9 were unresponsive, and 2 were LTMs. A C-mechano-cold nociceptor that was IB4− and trkA+ is illustrated in Figure 3C. Of these 23 units, 26% (6) were IB4+ but trkA− (3 nociceptive and 3 unresponsive units); 35% (8) were IB4− but trkA+ (4 nociceptive, 3 unresponsive, and 1 LTM); 35% (8) were both IB4+ and trkA+ (5 nociceptive and 3 unresponsive units), and 4% (1 C-LTM unit) was negative for both. Considering only C-nociceptor type neurons, 38% were IB4+/trkA+, 33% were IB4+/trkA−, and 29% were IB4−/trkA+. There was a negative linear correlation between trkA and IB4 intensities (p < 0.05, r2 = 0.67) (Fig. 3A) for the 8 units that were positive for both (Fig. 3A, top right quadrant). There was no obvious difference in the distribution of data for nociceptive and unresponsive neurons on this graph.
Aδ-LTMs
In contrast, there was no correlation between staining intensities of IB4 and trkA within the five Aδ-LTM (D hair) units stained for both (Fig. 3B). A D-hair unit that was weakly positive for both trkA and IB4 is shown in Figure 3C.
IB4 binding and dorsal root CV
All strongly IB4+ neurons had C-fiber CVs, whereas weakly IB4+ neurons had either C- or Aδ-fiber CVs (D-hair LTM neurons) (Figs. 2, 4). There was no linear correlation between IB4 intensity and dorsal root CV in C-fiber units (whether all, nociceptive or unresponsive were considered) (Fig. 4), although the faster conducting C-fiber units were mainly IB4− or weakly positive. However, because of the weak positive labeling in some D-hair neurons, there was a negative correlation for A-fiber LTMs and as a consequence also for all A-fiber units, but not for A-fiber nociceptors, which were all negative (Fig. 4).
Electrophysiological differences between IB4+ and IB4− C-fiber neurons
Examination of cultured small DRG neurons of mouse show that IB4+ neurons have longer AP durations than IB4− neurons (Stucky and Lewin, 1999; Wu and Pan, 2004). However, without CV measurements, it was not possible to exclude the possibility that inclusion of small A-fiber neurons in the IB4− group might have contributed to this observation (see Introduction). To determine whether such differences would be seen if only C-fiber DRG neurons were studied and whether any differences would be detectable in vivo and in rat, we compared medians of AP variables of IB4+ and IB4− C-fiber neurons using the Mann–Whitney U test. Of the 17 C-fiber neurons with APs that met the criteria for AP analysis and were examined for IB4 staining (see Materials and Methods), 12 were IB4+ (7 nociceptive and 5 unresponsive neurons), all 12 of which had inflections (humps) on the AP falling phase. The other five were IB4− (two LTMs, two nociceptive, and one unresponsive neuron). The only IB4− neuron with an inflection on the falling phase was the C-unresponsive neuron.
The IB4+ neurons had significantly longer AP duration at base than the IB4− neurons (p < 0.05) (Fig. 5A–C, Table 2) but only if the C-LTMs were included. The differences were more highly significant for AP rise time, with IB4+ nociceptor-type units having significantly longer AP rise times than IB4− neurons regardless of whether C-LTMs were included (p < 0.01) or excluded (p < 0.05) (Fig. 5D, Table 2). Both of these variables were correlated with IB4 intensity (Fig. 6A,B). The AP maximum rate of rise, however, was not significantly different between IB4+ and IB4− neurons, nor was it significantly correlated with IB4 intensity for all C-neurons or C-nociceptor-type neurons. Although the 6 units with AP fall times >4 ms were all IB4+ (data not shown), the difference between the median AP fall times of IB4+ and IB4− subgroups did not quite reach significance (p = 0.0512) (Table 2). Similarly, the linear regression for AP fall time with IB4 intensity did not quite reach significance (p < 0.1; data not shown). Neither AP height nor AP overshoot (data not shown) showed a significant difference between IB4+ and IB4− C-fiber neurons. AP height was, however, correlated with IB4 intensity (Fig. 6C), although AP overshoot was not (data not shown). The above tests were also performed on a larger group of C-fiber neurons by including all units with Ems of at least −40 and AP height >35 mV and whose peak reached to −20 mV or more positive. Similar patterns and significance levels were seen.
Table 2.
Electrophysiological properties of IB4+ and IB4− C-fiber neurons
| Types | IB4 | CV |
Em |
Action potential |
Nav1.9 |
Nav1.8 |
|||||||||
|---|---|---|---|---|---|---|---|---|---|---|---|---|---|---|---|
| n | m/s | n | mV | n | Base (ms) | RT (ms) | FT (ms) | Ht (mV) | Over (mV) | n | % rel intens | n | % rel intens | ||
| All | + | 24 | 0.39 | 13 | 57.9 | 12 | 6.5 | 2.1 | 4.01 | 77 | 21 | 13 | 71 | 12 | 46 |
| − | 11 | 0.52* | 10 | 47.6* | 5 | 3* | 1.04** | 1.92† | 61 | 6.4 | 7 | 17* | 7 | 49 | |
| LTMs | − | 2 | 0.48 | 2 | 47.6 | 2 | 1.4 | 0.67 | 0.72 | 52 | 4.5 | 1 | 19 | 1 | 31 |
| Noci type | + | 24 | 0.39 | 13 | 57.9 | 12 | 6.5 | 2.1 | 4.01 | 77 | 21 | 13 | 71 | 12 | 46 |
| − | 9 | 0.59* | 8 | 47.9† | 3 | 3.5 | 1.35* | 2.18 | 79 | 29 | 6 | 17* | 6 | 50 | |
Median values for IB4+ and IB4− C-fiber neurons for CV, Em, and AP variables. AP variables included base (AP duration at base), RT (rise time), FT (fall time), Ht (AP height), and Over (AP overshoot). The values for All IB4+ and for C-nociceptor-type IB4+ neurons are the same, because all IB4+ C-fiber neurons were nociceptor type. Ems were included only if they were more negative than or equal to −40 mV. AP variable values were from neurons with Em of at least −40 mV and an overshooting AP. Statistical tests were Mann–Whitney U tests between all IB4+ and all IB4− neurons (asterisks in All IB4− row) and between IB4+ and IB4− C-nociceptor-type neurons (asterisks in C-nociceptor type IB4− row).
*p < 0.05;
**p < 0.01;
†p = 0.05–0.1. rel intens, Relative intensity. For distribution of values, see Fig. 5.
Because CV and AP rise time are closely related (Fang et al., 2005), it was not surprising that IB4+ C-nociceptor-type units had a significantly slower median CV than IB4− C-fiber units regardless of whether C-LTMs were included (p < 0.05) (Fig. 5E, Table 2). A tendency for faster conducting C-fiber neurons to show lower IB4 intensities can be seen in Figure 4.
Unexpectedly, IB4+ nociceptor-type neurons had a median Em that was ∼10 mV more negative than that of the IB4− neurons including LTMs, a difference that became significant if the LTMs were included in the IB4− group (p < 0.05) (Table 2) (Fig. 5F). A similar observation has recently been made for IB4+ and IB4− isolated neurons in vitro (J. S. Choi, S. D. Dib-Hajj, and S. G. Waxman, unpublished observations). Furthermore, Em and IB4 intensity were positively correlated (Fig. 6D), that is, neurons with higher IB4 intensity had more negative Ems. For these neurons, there was also a positive correlation (data not shown) between AP height and Em (p < 0.01; r2 = 0.43; n = 17); thus, the correlation between IB4 and AP height may have resulted from the more negative Ems of neurons with greater IB4 intensity. This view is supported by the lack of correlation of AP overshoot with IB4 intensity. Therefore, the correlation between AP height and IB4 staining [also reported by Stucky and Lewin (1999)] may be primarily attributable to the unexpected relationship between IB4 intensity and Em.
Nav1.8 and Nav1.9 in IB4+ and IB4− C-fiber neurons
To determine whether Nav1.8 or Nav1.9 expression might contribute to the distinct somatic AP properties and lower CVs in C-fiber IB4+ nociceptor-type units, we investigated the immunostaining of these subunits on different sections of the same identified C-fiber neurons. There was a significantly higher median Nav1.9 intensity in IB4+ (71%) than IB4− C-fiber units (17%) regardless of whether the C-LTM (19% intensity) was included or excluded (Fig. 5G, Table 2). This suggested a possible correlation between IB4 intensity and Nav1.9 intensity. This proved to be the case, because IB4 intensities were positively correlated with Nav1.9 intensities (Fig. 6E), but not Nav1.8 intensities (Fig. 6F), in C-fiber neurons. No such differences existed for Nav1.8 intensity in the same subgroups, and no such correlation was seen between IB4 and Nav1.8 intensities (Figs. 5H, 6F, Table 2).
The above findings taken with previous studies (see Discussion) suggest that the elevated Nav1.9 levels in IB4+ neurons may contribute to the greater AP durations and longer AP rise times (and thus slower CVs) in the IB4+ C-fiber neurons seen in Figure 5.
The more hyperpolarized Ems in IB4+ C-fiber neurons are harder to explain. Previous studies (Herzog et al., 2001; Baker et al., 2003) of isolated DRG neurons suggest that activation of Nav1.9 should result in depolarization of the membrane. In contrast to this expectation, there was a significant correlation between Nav1.9 intensity and Em if neurons with Em equal to or more negative than −45 mV were examined (p < 0.05; r2 = 0.36; n = 12, including nine unresponsive, two nociceptive, and two LTM C-fiber neurons); if all neurons with Ems equal to or more negative than −40 mV were included, the trend persisted but the correlation was significant only for the seven C-unresponsive units (p < 0.05; r2 = 0.46). The correlation of Em with IB4 may therefore result from the higher expression of Nav1.9 in more intensely IB4+ neurons, although the mechanism by which Nav1.9 leads to hyperpolarization is not yet understood (see Discussion). However, it is also possible that Em in these neurons may be influenced by a molecule(s) other than Nav1.9, perhaps one that is also regulated by GDNF and/or related to IB4 expression.
Discussion
In rat lumbar DRGs in vivo, (1) intense IB4 binding was exclusively in C-nociceptor-type neurons; (2) IB4 intensity was as great in C-nociceptive as in C-unresponsive neurons; (3) one-third of C-neurons were IB4+/trkA+; (4) in C-nociceptor-type neurons, IB4+ neurons had slower CVs, longer AP rise times, and higher Nav1.9 intensities than IB4− neurons; IB4 intensity was correlated with rise time and Nav1.9 intensity; and (5) all A-nociceptors and Aα/β-LTMs were IB4−, but some Aδ-LTMs were weakly IB4+.
IB4 binding in nociceptors
Our finding that most C-nociceptors are IB4+ confirms and extends that of Gerke and Plenderleith (2001). That most C-nociceptors responding to noxious heat are strongly IB4+ is interesting, but the numbers are too small to draw conclusions. The heat responsiveness of IB4+ neurons may result from their expression of GFRα2 receptors (Bennett et al., 1998; Stucky et al., 2002) and/or TRPV1 (Guo et al., 1999).
In contrast, our finding that no A-nociceptors (0 of 33) in lumbar DRGs are IB4+ differs from the report by Gerke and Plenderleith (2001) that 3 of 10 A-nociceptors in sacral DRGs were IB4+. However, their study was on sacral DRGs; the IB4+ intensity level required for neurons to be classed as positive was not given, and they did not report recording locations in the DRG of dye injections into neurons or checking whether dye-labeled neurons were correctly located, practices we find essential to ensure no spuriously labeled neurons are included in the data set (Lawson et al., 1997).
IB4 binding in LTM DRG neurons
Our findings that all Aα/β-LTM units were IB4− supports those of Gerke and Plenderleith (2001). Our finding that three Aδ-LTMs were weakly IB4+, whereas three were negative extends their finding that two Aδ-LTMs were IB4−. Because IB4+ neurons express GDNF receptor components (see Introduction), GDNF may influence IB4+ D-hair units. Similarly, NGF may influence those that are trkA+ (Fang et al., 2005a).
C-unresponsive neurons
The similarity in IB4 staining intensities in C-unresponsive and C-nociceptive neurons is additional evidence of similarities (see Materials and Methods) in properties of these neuronal groups and supports our proposal that most/all C-unresponsive neurons are “silent nociceptors” or nociceptors with inaccessible receptive fields.
trkA+/IB4+ C-fiber neurons
Only few DRG neurons were reported previously to be trkA+/IB4+; for example, ∼5% of DRG neurons were trkA+/IB4+, and 13% of trkA+ cells showed IB4 binding (Averill et al., 1995; Molliver et al., 1995). The apparent contradiction from our finding that ∼35% of C-neurons and ∼38% of C-nociceptor-type neurons are IB4+/trkA+ may be explained as follows. First, our percentages relate to C-neurons only, excluding the larger (very visible) A-nociceptors that are mainly IB4−/trkA+ (this study; Fang et al., 2005a). Second, the negative correlation between IB4 intensities and trkA intensities in IB4+/trkA+ C-neurons may result in some being classed under visual inspection as positive only for IB4 or for trkA. For example, if we use 40% instead of 20% as the positive–negative borderline (Fig. 3A, dotted lines), only 22% (5 of 23) of C-neurons would be classed as trkA+/IB4+. C-fiber DRG neurons are small dark neurons (Harper and Lawson, 1985). In rat DRG sections, ∼64% of all uncorrected neuronal profiles are of small dark neurons (Lawson et al., 1984). Our 22% of C-neurons translates into 14% (22 of 64%) of neuronal profile counts that would be IB4+ and trkA+, much closer to published values above.
The C-neurons that are IB4+/trkA+ may be subject to influences of both NGF through trkA and GDNF through GFRα1/ret receptors expressed by IB4+ neurons (Molliver et al., 1997; Bennett et al., 1998). The data of Orozco et al. (2001) suggest that many trkA+/IB4+ neurons express GFRα3. If so, they may also be influenced by artemin.
Electrophysiological differences between IB4+ and IB4− C-fiber neurons
Small dissociated cultured IB4+ DRG neurons have longer AP durations than IB4− neurons from mouse and rat (Stucky and Lewin, 1999; Wu and Pan, 2004). However, because “small” referred to ≤26 μm (area ≤530 μm2) or 15–30 μm (area ∼180–710 μm2) in those studies, respectively, it could include smaller A-neurons (Fig. 1D), which might have contributed to these AP shape differences. We confirm in C-neurons that IB4+ neurons have longer AP durations in vivo, including longer AP rise and fall times.
Slower AP rise times and CVs in IB4+ C-neurons suggest different ion channel expression/activities in these neurons. Nav1.9 is implicated by the following: correlations in C-neurons of greater IB4 intensity with (1) greater Nav1.9 intensity, (2) slower AP rise times, and (3) slower CVs, plus previous correlations of Nav1.9 intensity with slower AP rise times and slower CVs in C-nociceptors (Fang et al., 2002, 2005a). These observations suggest that elevated Nav1.9 levels in IB4+ C-fiber neurons contribute to their longer duration APs and AP rise times and thus their slower CVs. This interpretation is consistent with preferential expression of Nav1.9 in IB4+ DRG neuronal somata and IB4+ sciatic nerve C-fibers, preferential regulation of Nav1.9 expression by GDNF (Fjell et al., 1999; Cummins et al., 2000), and preferential uptake of GDNF by IB4+ DRG neurons (Bennett et al., 1998; Leitner et al., 1999). In contrast, our lack of evidence for a difference in Nav1.8 intensity between IB4+ and IB4− C-nociceptor-type neurons or of correlation between Nav1.8 intensity and IB4 intensity is consistent with Nav1.8 expression being regulated by both GDNF and NGF and occurring in both IB4+ and IB4− small DRG neurons (Fjell et al., 1999). Nav1.8 is therefore unlikely to be responsible for the above electrophysiological differences.
Nav1.9 may not be the only ion channel with expression/activation that differs between IB4+ and IB4− neurons. Acutely isolated small DRG neurons showed greater 4-AP-sensitive A-type Kv currents in IB4+ than IB4− neurons, which, it was suggested, may “dampen” AP initiation (Vydyanathan et al., 2005). This might also contribute to slower AP kinetics.
The more negative Ems in IB4+ than IB4− C-neurons, although unexpected, were also recently seen between small IB4+ and IB4− neurons in culture (Choi, Dib-Hajj, and Waxman, unpublished observations). Our data suggest that they may be related to the higher Nav1.9 expression in IB4+ C-neurons. Nav1.9 produces a persistent current (Cummins et al., 1999). Previous studies of Nav1.9 currents in isolated cells predicted that Nav1.9 activation should cause depolarization (Herzog et al., 2001; Baker et al., 2003). In contrast, and consistent with our findings of more negative Ems in IB4+ C-neurons, Morisset et al. (2005) observed significantly more depolarized Ems in DRG neurons from Nav1.9-null mice. One suggestion (Stys et al., 1993; Sontheimer et al., 1994) is that persistent inward Na+ current might prime the Na+ pump, increasing its activity and electrogenesis and thus causing hyperpolarization. The likely influence of this on excitability is unclear. Hyperpolarized Ems should reduce resting inactivation of Na+ channels (other than Nav1.8) that are present in IB4+ C-nociceptors, e.g., Nav1.7 and Nav1.9 (Cummins et al., 1999; Fang et al., 2002; Djouhri et al., 2003a; Rush et al., 2006).
IB4 as a neuronal marker in DRG sections
Our data suggest the previous division of small (assumed C-fiber-nociceptive) DRG neurons into IB4+ and IB4− neurons to be oversimplistic. They suggest a third subgroup comprising one-third of C-fiber neurons that are IB4+/trkA+; these probably express peptides [calcitonin gene-related peptide (CGRP) and substance P] (Averill et al., 1995), receptors for both GDNF and NGF, and possibly also artemin (see above).
The correlation of electrophysiological properties of DRG C-neurons with IB4-binding immunointensities suggests that IB4-binding sites are functionally important or are related to a functionally important molecule, such as GDNF-receptor components. Binding of IB4 to glycolipids and/or glycoproteins, laminin β2 (Fullmer et al., 2004), and versican V2 (an extracellular matrix proteoglycan) (Bogen et al., 2005) have been suggested, but the functional significance of these putative IB4-binding sites remains unclear.
Peripheral and central projections of IB4+ DRG neurons
IB4 binding of DRG neurons may be related to their peripheral targets. Our finding that 4 of 6 C-neurons with superficial receptive fields were IB4+ is consistent with 70% of neurons retrogradely labeled from hairy skin epidermis being IB4+ (Lu et al., 2001; Lawson, 2005). In contrast, joint afferents were reported to all be IB4− (Ivanavicius et al., 2004).
The recent suggestion (Braz et al., 2005) that IB4+ and peptide (CGRP)-expressing DRG neurons project to different central pathways is intriguing. It would be interesting to know how the central projections of the IB4+/trkA+ subgroup relate to these pathways. It is clear that IB4+ DRG neurons project to spinal cord lamina II inner (Plenderleith et al., 1992; Kitchener et al., 1993), thus differing from peptide-expressing, presumably trkA-expressing, DRG neurons that project to lamina I and II outer (Averill et al., 1995), indicating anatomical and thus functional differences in their central pathways.
Conclusions
In summary, rat lumbar somatic afferent DRG neurons with intense IB4 binding are exclusively C-nociceptor type. There are three main groups of somatic C-nociceptor-type neurons: IB4+/trkA−, IB4−/trkA+, and IB4+/trkA+ (∼35% of such neurons). The trkA+/IB4+ staining of the last group suggests their influence by NGF and GDNF. The higher level of Nav1.9 expression in IB4+ than IB4− C-nociceptor-type neurons may contribute to their slower APs and CVs. IB4+ C-neurons have more negative Ems. These differences in properties add substantially to growing evidence that IB4+ and IB4− C-neurons may have different functions and raise new questions about the functional properties of the third group of C-fiber neurons, which are IB4+/trkA+.
Footnotes
X. Fang's present address: Department of Biological Sciences, University of Warwick, Coventry CV4 7AL, UK.
S. McMullan's present address: Hypertension and Stroke Research Laboratory, University of Sydney, Royal North Shore Hospital, St Leonards, Sydney 2065, Australia.
This work was supported by The Biotechnology and Biological Sciences Research Council (United Kingdom) and Wellcome United Kingdom grants to S.N.L. and by a Bristol University Studentship to X.F. We thank L. F. Reichardt for the gift of anti-trkA antibody, J. Wood and K. Okuse for the anti-Nav1.8 antibody, and B. Carruthers for technical assistance.
References
- Averill S, McMahon SB, Clary DO, Reichardt LF, Priestley JV (1995). Immunocytochemical localization of trkA receptors in chemically identified subgroups of adult rat sensory neurons. Eur J Neurosci 7:1484–1494. [DOI] [PMC free article] [PubMed] [Google Scholar]
- Baker MD, Chandra SY, Ding Y, Waxman SG, Wood JN (2003). GTP-induced tetrodotoxin-resistant Na+ current regulates excitability in mouse and rat small diameter sensory neurones. J Physiol (Lond) 548:373–383. [DOI] [PMC free article] [PubMed] [Google Scholar]
- Bennett DL, Michael GJ, Ramachandran N, Munson JB, Averill S, Yan Q, McMahon SB, Priestley JV (1998). A distinct subgroup of small DRG cells express GDNF receptor components and GDNF is protective for these neurons after nerve injury. J Neurosci 18:3059–3072. [DOI] [PMC free article] [PubMed] [Google Scholar]
- Bogen O, Dreger M, Gillen C, Schroder W, Hucho F (2005). Identification of versican as an isolectin B4-binding glycoprotein from mammalian spinal cord tissue. FEBS J 272:1090–1102. [DOI] [PubMed] [Google Scholar]
- Braz JM, Nassar MA, Wood JN, Basbaum AI (2005). Parallel “pain” pathways arise from subpopulations of primary afferent nociceptor. Neuron 47:787–793. [DOI] [PubMed] [Google Scholar]
- Burgess PR, Perl ER (1967). Myelinated afferent fibers responding specifically to noxious stimulation of the skin. J Physiol (Lond) 190:541–562. [DOI] [PMC free article] [PubMed] [Google Scholar]
- Clary DO, Reichardt LF (1994). An alternatively spliced form of the nerve growth factor receptor TrkA confers an enhanced response to neurotrophin 3. Proc Natl Acad Sci USA 91:11133–11137. [DOI] [PMC free article] [PubMed] [Google Scholar]
- Cummins TR, Dib-Hajj SD, Black JA, Akopian AN, Wood JN, Waxman SG (1999). A novel persistent tetrodotoxin-resistant sodium current in SNS-null and wild-type small primary sensory neurons. J Neurosci 19:RC43. [DOI] [PMC free article] [PubMed] [Google Scholar]
- Cummins TR, Black JA, Dib-Hajj SD, Waxman SG (2000). Glial-derived neurotrophic factor upregulates expression of functional SNS and NaN sodium channels and their currents in axotomized dorsal root ganglion neurons. J Neurosci 20:8754–8761. [DOI] [PMC free article] [PubMed] [Google Scholar]
- Djouhri L, Lawson SN (2001). Increased conduction velocity of nociceptive primary afferent neurons during unilateral hindlimb inflammation in the anaesthetised guinea-pig. Neuroscience 102:669–679. [DOI] [PubMed] [Google Scholar]
- Djouhri L, Bleazard L, Lawson SN (1998). Association of somatic action potential shape with sensory receptive properties in guinea-pig dorsal root ganglion neurones. J Physiol (Lond) 513:857–872. [DOI] [PMC free article] [PubMed] [Google Scholar]
- Djouhri L, Newton R, Levinson SR, Berry CM, Carruthers B, Lawson SN (2003a). Sensory and electrophysiological properties of guinea-pig sensory neurones expressing Nav 1.7 (PN1) Na+ channel alpha subunit protein. J Physiol (Lond) 546:565–576. [DOI] [PMC free article] [PubMed] [Google Scholar]
- Djouhri L, Fang X, Okuse K, Wood JN, Berry CM, Lawson SN (2003b). The TTX-resistant sodium channel Nav1.8 (SNS/PN3): expression and correlation with membrane properties in rat nociceptive primary afferent neurons. J Physiol (Lond) 550:739–752. [DOI] [PMC free article] [PubMed] [Google Scholar]
- Fang X, Djouhri L, Lawson SN (2001). TrkA expression and IB4 binding in functionally identified dorsal root ganglion (DRG) nociceptive neurones in rats in vivo. J Physiol (Lond) 536P:S192. [Google Scholar]
- Fang X, Djouhri L, Black JA, Dib-Hajj SD, Waxman SG, Lawson SN (2002). The presence and role of the tetrodotoxin-resistant sodium channel Na(v)1.9 (NaN) in nociceptive primary afferent neurons. J Neurosci 22:7425–7433. [DOI] [PMC free article] [PubMed] [Google Scholar]
- Fang X, Djouhri L, McMullan S, Berry C, Okuse K, Waxman SG, Lawson SN (2005a). trkA is expressed in nociceptive neurons and influences electrophysiological properties via Nav1.8 expression in rapidly conducting nociceptors. J Neurosci 25:4868–4878. [DOI] [PMC free article] [PubMed] [Google Scholar]
- Fang X, Djouhri L, McMullan S, Berry C, Okuse K, Waxman SG, Lawson SN (2005b). Distinct electrophysiological properties in vivo of C-fiber nociceptive DRG neurons that bind IB4 relate to the expression of Nav1.9 Na+ channels in rat. J Physiol (Lond) 567P:C44. [Google Scholar]
- Fang X, McMullan S, Lawson SN, Djouhri L (2005c). Electrophysiological differences between nociceptive and non-nociceptive dorsal root ganglion neurones in the rat in vivo. J Physiol (Lond) 565:927–943. [DOI] [PMC free article] [PubMed] [Google Scholar]
- Fjell J, Cummins TR, Dib-Hajj SD, Fried K, Black JA, Waxman SG (1999). Differential role of GDNF and NGF in the maintenance of two TTX-resistant sodium channels in adult DRG neurons. Brain Res Mol Brain Res 67:267–282. [DOI] [PubMed] [Google Scholar]
- Fjell J, Hjelmstrom P, Hormuzdiar W, Milenkovic M, Aglieco F, Tyrrell L, Dib-Hajj S, Waxman SG, Black JA (2000). Localization of the tetrodotoxin-resistant sodium channel NaN in nociceptors. Neuroreport 11:199–203. [DOI] [PubMed] [Google Scholar]
- Fullmer JM, Riedl MS, Higgins L, Elde R (2004). Identification of some lectin IB4 binding proteins in rat dorsal root ganglia. Neuroreport 15:1705–1709. [DOI] [PubMed] [Google Scholar]
- Gerke MB, Plenderleith MB (2001). Binding sites for the plant lectin Bandeiraea simplicifolia I-isolectin B(4) are expressed by nociceptive primary sensory neurones. Brain Res 911:101–104. [DOI] [PubMed] [Google Scholar]
- Guo A, Vulchanova L, Wang J, Li X, Elde R (1999). Immunocytochemical localization of the vanilloid receptor 1 (VR1): relationship to neuropeptides, the P2X3 purinoceptor and IB4 binding sites. Eur J Neurosci 11:946–958. [DOI] [PubMed] [Google Scholar]
- Harper AA, Lawson SN (1985). Conduction velocity is related to morphological cell type in rat dorsal root ganglion neurones. J Physiol (Lond) 359:31–46. [DOI] [PMC free article] [PubMed] [Google Scholar]
- Herzog RI, Cummins TR, Waxman SG (2001). Persistent TTX-resistant Na+ current affects resting potential and response to depolarization in simulated spinal sensory neurons. J Neurophysiol 86:1351–1364. [DOI] [PubMed] [Google Scholar]
- Ivanavicius SP, Blake DR, Chessell IP, Mapp PI (2004). Isolectin B4 binding neurons are not present in the rat knee joint. Neuroscience 128:555–560. [DOI] [PubMed] [Google Scholar]
- Kashiba H, Uchida Y, Senba E (2001). Difference in binding by isolectin B4 to trkA and c-ret mRNA-expressing neurons in rat sensory ganglia. Brain Res Mol Brain Res 95:18–26. [DOI] [PubMed] [Google Scholar]
- Kitchener PD, Wilson P, Snow PJ (1993). Selective labelling of primary sensory afferent terminals in lamina II of the dorsal horn by injection of Bandeiraea simplicifolia isolectin B4 into peripheral nerves. Neuroscience 54:545–551. [DOI] [PubMed] [Google Scholar]
- Lawson SN (2005). The peripheral sensory nervous system: dorsal root ganglion neurons. In: Peripheral neuropathy, Chap 8 (Dyck PJ, Thomas PK, eds) pp. 163–202. Philadelphia, PA: W.B. Saunders; Elsevier.
- Lawson SN, Waddell PJ (1991). Soma neurofilament immunoreactivity is related to cell size and fiber conduction velocity in rat primary sensory neurons. J Physiol (Lond) 435:41–63. [DOI] [PMC free article] [PubMed] [Google Scholar]
- Lawson SN, Harper AA, Harper EI, Garson JA, Anderton BH (1984). A monoclonal antibody against neurofilament protein specifically labels a subpopulation of rat sensory neurones. J Comp Neurol 228:263–272. [DOI] [PubMed] [Google Scholar]
- Lawson SN, Crepps BA, Perl ER (1997). Relationship of substance P to afferent characteristics of dorsal root ganglion neurones in guinea-pig. J Physiol 505:177–191. [DOI] [PMC free article] [PubMed] [Google Scholar]
- Leitner ML, Molliver DC, Osborne PA, Vejsada R, Golden JP, Lampe PA, Kato AC, Milbrandt J, Johnson EM Jr (1999). Analysis of the retrograde transport of glial cell line-derived neurotrophic factor (GDNF), neurturin, and persephin suggests that in vivo signaling for the GDNF family is GFRα coreceptor-specific. J Neurosci 19:9322–9331. [DOI] [PMC free article] [PubMed] [Google Scholar]
- Lu J, Zhou XF, Rush RA (2001). Small primary sensory neurons innervating epidermis and viscera display differential phenotype in the adult rat. Neurosci Res 41:355–363. [DOI] [PubMed] [Google Scholar]
- Molliver DC, Radeke MJ, Feinstein SC, Snider WD (1995). Presence or absence of TrkA protein distinguishes subsets of small sensory neurons with unique cytochemical characteristics and dorsal horn projections. J Comp Neurol 361:404–416. [DOI] [PubMed] [Google Scholar]
- Molliver DC, Wright DE, Leitner ML, Parsadanian AS, Doster K, Wen D, Yan Q, Snider WD (1997). IB4-binding DRG neurons switch from NGF to GDNF dependence in early postnatal life. Neuron 19:849–861. [DOI] [PubMed] [Google Scholar]
- Morisset V, Randall AD, Davies AJ, Egerton J, Grose DT, Clare JJ, Tate SN, Green PJ, Gunthorpe MJ (2005). Functional differences in the behavior of TTX-resistant sodium currents in sensory neurons cultured from WT and Nav1.9 (SNS2) null mice: consequences for neuronal excitability and firing. Soc Neurosci Abstr 31:622–7. [Google Scholar]
- Orozco OE, Walus L, Sah DW, Pepinsky RB, Sanicola M (2001). GFRalpha3 is expressed predominantly in nociceptive sensory neurons. Eur J Neurosci 13:2177–2182. [DOI] [PubMed] [Google Scholar]
- Plenderleith MB, Snow PJ (1993). The plant lectin Bandeiraea simplicifolia I-B4 identifies a subpopulation of small diameter primary sensory neurones which innervate the skin in the rat. Neurosci Lett 159:17–20. [DOI] [PubMed] [Google Scholar]
- Plenderleith MB, Wright LL, Snow PJ (1992). Expression of lectin binding in the superficial dorsal horn of the rat spinal cord during pre- and postnatal development. Brain Res Dev Brain Res 68:103–109. [DOI] [PubMed] [Google Scholar]
- Renganathan M, Cummins TR, Waxman SG (2001). Contribution of Na(v)1.8 sodium channels to action potential electrogenesis in DRG neurons. J Neurophysiol 86:629–640. [DOI] [PubMed] [Google Scholar]
- Rush AM, Dib-Hajj SD, Liu S, Cummins TR, Black JA, Waxman SG (2006). A single sodium channel mutation produces hyper- or hypoexcitability in different types of neurons. Proc Nat Acad Sci USA 103:8245–8250. [DOI] [PMC free article] [PubMed] [Google Scholar]
- Silverman JD, Kruger L (1990). Selective neuronal glycoconjugate expression in sensory and autonomic ganglia: relation of lectin reactivity to peptide and enzyme markers. J Neurocytol 19:789–801. [DOI] [PubMed] [Google Scholar]
- Sontheimer H, Fernandez-Marques E, Ullrich N, Pappas C, Waxman SG (1994). Astrocyte Na+ channels are required for maintenance of Na+/K+-ATPase activity. J Neurosci 14:464–2475. [DOI] [PMC free article] [PubMed] [Google Scholar]
- Stucky CL, Lewin GR (1999). Isolectin B(4)-positive and -negative nociceptors are functionally distinct. J Neurosci 19:6497–6505. [DOI] [PMC free article] [PubMed] [Google Scholar]
- Stucky CL, Rossi J, Airaksinen MS, Lewin GR (2002). GFR alpha2/neurturin signalling regulates noxious heat transduction in isolectin B4-binding mouse sensory neurons. J Physiol (Lond) 545:43–50. [DOI] [PMC free article] [PubMed] [Google Scholar]
- Stys PK, Sontheimer H, Ransom BR, Waxman SG (1993). Non-inactivating, TTX-sensitive Na+ conductance in rat optic nerve axons. Proc Natl Acad Sci USA 90:6976–6980. [DOI] [PMC free article] [PubMed] [Google Scholar]
- Thornton PD, Gerke MB, Plenderleith MB (2005). Histochemical localisation of a galactose-containing glycoconjugate expressed by sensory neurones innervating different peripheral tissues in the rat. J Peripher Nerv Syst 10:47–57. [DOI] [PubMed] [Google Scholar]
- Vydyanathan A, Wu ZZ, Chen SR, Pan HL (2005). A-type voltage-gated K+ currents influence firing properties of isolectin B4-positive but not -negative primary sensory neurons. J Neurophysiol 93:3401–3409. [DOI] [PubMed] [Google Scholar]
- Wang H, Rivero-Melian C, Robertson B, Grant G (1994). Transganglionic transport and binding of the isolectin B4 from Griffonia simplicifolia I in rat primary sensory neurons. Neuroscience 62:539–551. [DOI] [PubMed] [Google Scholar]
- Wu ZZ, Pan HL (2004). Tetrodotoxin-sensitive and -resistant Na+ channel currents in subsets of small sensory neurons of rats. Brain Res 1029:251–258. [DOI] [PubMed] [Google Scholar]
- Zwick M, Davis BM, Woodbury CJ, Burkett JN, Koerber HR, Simpson JF, Albers KM (2002). Glial cell line-derived neurotrophic factor is a survival factor for isolectin B4-positive, but not vanilloid receptor 1-positive, neurons in the mouse. J Neurosci 22:4057–4065. [DOI] [PMC free article] [PubMed] [Google Scholar]