

Abstract
Rhythmic inhibition entrains the firing of excitatory neurons during oscillations throughout the brain. Previous work has suggested that the strength and duration of inhibitory input determines the synchrony and period, respectively, of these oscillations. In particular, sleep spindles result from a cycle of events including rhythmic inhibition and rebound bursts in thalamocortical (TC) neurons, and slowing and strengthening this inhibitory input may transform spindles into spike-wave discharges characteristic of absence epilepsy. Here, we used dynamic clamp to inject TC neurons with spindle-like trains of IPSCs and studied how modest changes in the amplitude and/or duration of these IPSCs affected the responses of the TC neurons. Contrary to our expectations, we found that prolonging IPSCs accelerates postinhibitory rebound (PIR) in TC neurons, and that increasing either the amplitude or duration of IPSCs desynchronizes PIR activity in a population of TC cells. Tonic injection of hyperpolarizing or depolarizing current dramatically alters the timing and synchrony of PIR. These results demonstrate that rhythmic PIR activity is an emergent property of interactions between intrinsic and synaptic currents, not just a passive reflection of incoming synaptic inhibition.
Keywords: absence epilepsy, dynamic clamp, oscillation, synchrony, GABAA receptor, inhibition
Introduction
Rhythmic inhibition plays an important role in oscillations throughout the brain (Soltesz and Deschenes, 1993; von Krosigk et al., 1993; Ylinen et al., 1995; Buhl et al., 1998; Fisahn et al., 1998). In particular, thalamic spindles result from a well studied cycle of events, in which neurons of the thalamic reticular (RE) nucleus inhibit thalamocortical (TC) neurons, eliciting rebound bursts and resulting in re-excitation of RE neurons (Steriade et al., 1985; von Krosigk et al., 1993). Indeed, blocking inhibitory synapses from RE to TC cells (Sanchez-Vives and McCormick, 1997) or disconnecting TC cells from the RE nucleus (Steriade et al., 1985) abolishes spindle rhythmicity in TC cells. Postinhibitory rebound (PIR) in TC neurons may also contribute to spike-wave discharge, characteristic of generalized absence epilepsy. Studies in humans suggest that the thalamus is critically involved in absence seizures (Williams, 1953; Salek-Haddadi et al., 2003), and several animal studies suggest that rebound bursts in TC cells may be particularly important. Knocking out the calcium channel α1g renders TC neurons unable to rebound burst and produces mice that exhibit reduced spindle-frequency EEG activity and are resistant to absence seizures induced by baclofen (Kim et al., 2001). The anti-absence drug ethosuximide blocks PIR in TC neurons (Coulter et al., 1989), suppresses oscillations in thalamic slices (Huguenard and Prince, 1994), and blocks seizures in various animal models (for review, see Snead et al., 1999).
Two assumptions are commonly made about oscillations entrained by rhythmic IPSCs: first, that the duration of IPSCs should determine the oscillatory period, and second, that synchrony between different neurons should reflect the strength of their common inhibitory input. For example, slow, synchronized epileptiform discharges occur in thalamic slices under conditions in which RE neurons fire prolonged bursts, which elicit large, slow, GABAB receptor (GABAAR)-mediated IPSCs in TC neurons (von Krosigk et al., 1993). Here we rigorously test the hypotheses that the duration and strength of rhythmic IPSCs determine the period and synchrony, respectively, of PIR activity in a population of TC neurons. Whereas previous studies have compared oscillations in which IPSCs are mediated primarily by GABAA receptors with those in which GABAB receptors predominate, we study the effects of modestly augmenting GABAA receptor-like IPSCs. We find that, contrary to the assumptions described above, prolonging IPSCs accelerates PIR in TC neurons, and that strengthening IPSCs desynchronizes PIR in different TC cells. We also find that injecting hyperpolarizing or depolarizing current dramatically alters the timing and synchrony of PIR. These results demonstrate that rhythmic PIR activity does not passively reflect incoming synaptic inhibition, but rather emerges from powerful interactions between intrinsic and synaptic currents.
Materials and Methods
Slice preparation
All procedures involving animals were performed in accordance with protocols approved by the Stanford Institutional Animal Care and Use Committee, and investigators adhered to the guidelines published in the National of Institutes of Health Guide for the Care and Use of Laboratory Animals. Slices were made as described previously (Huguenard and Prince, 1994) from either postnatal day 12 (P12) to P20 mice (extracellular multiunit recordings) or P17–P20 Sprague Dawley rats (Simonsen Laboratories, Gilroy, CA) (intracellular whole-cell patch-clamp recordings). Animals were deeply anesthetized with pentobarbital (50 mg/kg) and decapitated. Their brains were then rapidly removed and placed in chilled (4°C) slicing solution consisting of the following (in mm): 234 sucrose, 11 glucose, 24 NaHCO3, 2.5 KCl, 1.25 NaH2PO4, 10 MgSO4, and 0.5 CaCl2 (equilibrated with a 95% O2, 5% CO2 mixture). Horizontal slices, 200 μm (intracellular recordings) or 400 μm (extracellular multiunit recordings), were obtained using a vibratome (TPI, St. Louis, MO). The slices were incubated in 32°C oxygenated saline for at least 1 h before recording.
Extracellular multiunit recordings
Multiunit recordings were made in an interface chamber at 34 ± 1°C using slices from 12- to 20-d-old mice. The superfusion solution consisted of the following (in mm): 126 NaCl, 26 NaHCO3, 2.5 KCl, 1.25 NaH2PO4, 1 or 1.2 MgCl2, 2 CaCl2, and 10 glucose. The superfusion solution also included 0.1 mm glutamine to maintain neurotransmitter levels (Kapetanovic et al., 1993). Oscillations could be obtained without glutamine, but we found previously that glutamine prevents the rundown of evoked oscillations over tens of minutes. Electrical stimuli were delivered to the internal capsule through a pair of 50–100 KΩ tungsten electrodes (Frederick Haer Company, Bowdoinham, ME), with a separation of ∼100 μm. Zolpidem (ZOL) (obtained from Sigma, St. Louis, MO) was dissolved in DMSO before being added to the final solution, such that the final concentration of DMSO in the superfusion solution was ≤0.01%. Extracellular multiunit recordings, made from the ventrobasal complex, also used 50–100 KΩ tungsten electrodes and were bandpass filtered between 100 Hz and 3 kHz.
Intracellular recordings and dynamic clamp
Recordings.
Intracellular recordings were made in a submerged chamber at 32–33°C. We obtained whole-cell current-clamp recordings from ventrobasal TC neurons that had been identified using infrared video microscopy. The superfusion solution was the same used for extracellular multiunit recordings, but it lacked glutamine and instead contained picrotoxin (50 μm), DNQX (20 μm), and AP-5 (50 μm) to block ionotropic synaptic transmission. Patch electrodes (tip resistance, 3–4 MΩ) were filled with the following (in mm): 131 K-gluconate, 8 KCl, 2 NaCl, 10 HEPES, 3 EGTA, 4 MgATP, and 0.3 NaGTP. The pH of the intracellular solution was adjusted to 7.3 using KOH. Recordings were made using a Multiclamp 700A (Molecular Devices, Sunnyvale, CA) in current-clamp mode.
Dynamic clamp.
Two computers were used for simultaneous data acquisition. The first sampled the data at 20 kHz via pClamp 8.0 (Molecular Devices) for archival and illustrative purposes. The second computer, running the RealTime Application Interface for Linux (RTAI, www.rtai.org) sampled the intracellular potential at 50 kHz. Custom-written software used this membrane potential, along with a prespecified inhibitory conductance waveform, to update the inhibitory current that was injected into the TC neuron at 50 kHz. The reversal potential for this inhibitory current was −85 mV (Sanchez-Vives and McCormick, 1997; Ulrich and Huguenard, 1997). All measured voltages were corrected for a junction potential of 14 mV.
Generation of IPSP waveforms.
Inhibitory conductance waveforms were designed to simulate the output of multiple RE neurons during in vitro spindle oscillation. During such oscillations, individual RE neurons fire bursts, typically containing one to six spikes (Sohal and Huguenard, 2003). Neighboring RE neurons burst at similar times, so that multiunit recordings reveal “population bursts” composed of spikes from many RE neurons (Sohal et al., 2003). Inhibitory conductance waveforms were based on trains of “presynaptic” spikes. Each presynaptic train was constructed via a three-step process. First, we generated a sequence of times for successive population bursts. The interburst times were drawn from a Gaussian distribution whose mean corresponded to the oscillation period, 160 ms (Sohal et al., 2003). The SD of this distribution, 11 ms, was chosen to match the distribution of times at which population bursts occur in multiunit recordings during spontaneous spindles. Second, we determined whether and when each of 16 RE neurons would start to burst. Each RE neuron burst with probability 0.5, to match the sporadic bursting observed during intracellular recordings from RE neurons (Sohal and Huguenard, 2003). The times at which RE neurons burst were drawn from a Gaussian distribution centered on the time of the population burst. The SD of the distribution, 10 ms, was chosen to match the distribution of spike times observed in multiunit recordings during spontaneous spindles. Third, each RE neuron burst consisted of a stereotyped pattern of five spikes, with interspike intervals taken from an intracellular recording during a spindle oscillation (Sohal and Huguenard, 2003). We will refer to each compound IPSC, consisting of unitary IPSCs from several RE neurons during a simulated population burst, as a “population IPSC” (popIPSC).
Two additional steps would transform a presynaptic spike train into an inhibitory conductance waveform. First, each presynaptic spike triggered an instantaneous incremental change in the conductance equal to the unitary IPSC conductance (gIPSC) multiplied by a factor to account for short-term plasticity at RE to TC synapses. Based on paired recordings from RE and TC neurons (Cox et al., 1997), the factors were 1, 1.2, 0.4, 0.2, and 0.2, for the first, second, third, fourth, and fifth spikes in a burst, respectively. Second, the conductance decayed monoexponentially with a time constant, τIPSC, representing the duration of inhibitory synaptic currents. As described in Results, during experiments, we injected conductance waveforms that had been generated using the same presynaptic spike train but different values of gIPSC or τIPSC. Over the course of our experiments, we used a total of three different presynaptic spike trains to confirm that our results did not depend on one particular presynaptic train.
Figure 1 illustrates this process by which we constructed our dynamic clamp stimuli. The top panel shows the times at which different RE cell bursts begin. Although the numbers and times of individual RE cell bursts are random, RE cell bursts are organized into population bursts, and the population bursts reoccur at a frequency of ∼6.25 Hz. Each burst consisted of multiple spikes (data not shown), which trigger a sequence of IPSCs whose amplitudes reflect short-term plasticity, as described above. The second and third panels show the inhibitory conductance waveform and the injected current, respectively. The bottom panel shows the response of a TC neuron to this dynamic clamp stimulus.
Figure 1.

Dynamic clamp stimulation of TC a neuron using a spindle-like train of IPSCs. Top panel, Times at which simulated RE cells burst. Each RE cell burst contains multiple action potentials, and successive action potentials within a burst produce progressively smaller IPSCs attributable to short-term plasticity (data not shown). Middle panel, the resulting inhibitory conductance waveform. Bottom two panels, The net injected current, resulting from this conductance, and the response of the TC neuron.
Note that dynamic clamp approximates IPSCs using somatic current injections. Although the majority of inhibitory inputs to TC neurons are located beyond the soma (Liu et al., 1995), somatic current injection has been used to simulate inhibitory currents in many studies of TC neuron bursting (Le Masson et al., 2002; Wolfart et al., 2005). Furthermore, we recorded from TC cells with relatively high input resistances, and the IPSPs that elicited rebound bursts lasted ∼100 ms. Under these conditions, we expect IPSPs to be transmitted through dendrites with high fidelity.
IPSC analysis and pharmacology.
For these experiments, age-matched groups of α3(H126R) mutant and wild-type mice (Low et al., 2000), together with Sprague Dawley rat pups (Simonsen Laboratories), were used at P11–P14. Spontaneous IPSCs (sIPSCs) were recorded in whole-cell configuration (of the patch-clamp technique) from visually identified TC relay cell neurons at room temperature. Cell recording pipettes contained the following (in mm): 135 CsCl, 5 QX-314 [2-((2,6-dimethylphenyl)amino)-N,N,N-triethyl-2-oxoethanaminium], 2 MgCl2, 10 EGTA, and 10 HEPES. Neurons were voltage clamped at −60 mV and perfused with oxygenated (95% O2, 5%CO2) artificial CSF containing APV and CNQX for isolation of GABAAR-mediated inhibition. Spontaneous events were sampled at 5–10 kHz, low-pass filtered at 2 kHz, collected with pClamp software, and detected and isolated with locally written software [Metatape, WDetecta, and WinScanSelect (J. R. Huguenard)]. The following biophysical parameters of IPSCs (n > 50 events per cell) were determined from averages of >50 well isolated events from each cell: rise time, half-width, peak current amplitude, and weighted decay time constant (τd,w), which was calculated using the following equation: τd,w = [(Afast × τfast) + (Aslow × τslow)]/(Afast + Aslow)].
Data analysis
Our methods for analyzing extracellularly recorded, multiunit activity during evoked thalamic oscillations have been described previously (Sohal et al., 2003). Briefly, we found spikes in extracellular multiunit recordings using custom-written software. To find the period of evoked oscillations, first we computed the autocorrelogram based on multiunit spikes that occurred during the first second of the evoked oscillation. Then, we calculated the period based on the first nonzero satellite peak of this autocorrelogram.
The “oscillatory index” (O.I.) was also computed from the same autocorrelogram, using the following formula: O.I. = [A(τmax) − A(τmin)]/A(0), where τmax is the location of the first nonzero satellite peak, τmin is the location of the trough between this satellite peak and zero, and A(0) is the height of the central peak (located at τ = 0).
Unless otherwise noted, all data are reported as mean ± SEM.
Computational modeling
We simulated thalamocortical neurons as single compartments with an area of 29,000 μm2. Model neurons contained a leak current (Eleak was randomly selected from a uniform distribution between −70 and −80 mV, and gleak was randomly selected from a uniform distribution between 18 and 20 μS/cm2), voltage-dependent Na and K currents underlying action potentials, a T-type low-threshold calcium current (IT), a hyperpolarization-activated nonspecific cationic current (IH), and an inhibitory synaptic current generated in the same manner as for dynamic clamp experiments. Details of voltage-dependent currents have been given previously (Sohal et al., 2000). The resting membrane potential was approximately −60 mV. As in dynamic clamp experiments, inhibitory synaptic currents rose instantaneously and decayed with first-order kinetics, and Erev = −75 mV.
Results
Strengthening GABAA synapses on TC cells reduces the period and synchrony of thalamic oscillations
To begin with, we studied how pharmacologically enhancing inhibitory input onto TC cells affects oscillations in thalamic slices. We did this by applying zolpidem while recording oscillations in thalamic slices from α3(H126R) mice. GABAARs containing this mutant subunit are insensitive to classical benzodiazepine modulation but have a normal sensitivity for GABA (Wieland et al., 1992; Benson et al., 1998). Because the α3 subunit is selectively expressed in the RE nucleus, but not relay nuclei (Wisden et al., 1992; Pirker et al., 2000), in thalamic slices from these mice, zolpidem and most other benzodiazepine site ligands preferentially modulate IPSCs in TC neurons. Furthermore, zolpidem displays higher affinity for α1-containing receptors than those containing other α subunits (Crestani et al., 2000; Rudolph and Mohler, 2004). Thus, under these conditions, the effects of zolpidem are expected to be relatively specific and to preferentially enhance RE to TC synapses. Figure 2A–E demonstrates the effects of zolpidem on spontaneous IPSCs recorded at room temperature in TC cells from α3(H126R) mice. Under these conditions, 1 μm zolpidem increases IPSC amplitude and slows IPSC decay, by ∼35 and 60%, respectively. Table 1 shows the effects of varying concentrations of zolpidem on spontaneous IPSCs recorded at room temperature from wild-type mice, α3(H126R) mice, and rats. In each case tested, 1 μm zolpidem increases the amplitude and duration of spontaneous IPSCs, whereas 100 nm zolpidem mainly influenced duration (Fig. 2E, Table 1). The effects on IPSC duration were similar with either concentration of the drug (Table 1), suggesting that this effect is maximal at the lower concentration. In the following extracellular experiments, we used 1 μm zolpidem to ensure rapid penetration into the slice within the interface chamber, which has a relatively slow superfusion rate.
Figure 2.

The effect of ZOL on sIPSCs recorded from TC neurons in thalamic slices of mutant mice [α3(H126R); abbreviated as α3] and their wild-type controls (wt). A, Zolpidem (Zlp) at 100 nm has little effect on sIPSC amplitude during an 8 min wash-in period (marked by gray bar) in an α3(H126R) ventrobasal cell. A1, Composite average of >50 individual well isolated sIPSCs recorded from an α3(H126R) ventrobasal cell in the absence (black trace; Ctr) or presence (gray trace; Zlp) of 100 nm zolpidem, demonstrating that zolpidem at this concentration increases IPSC duration but does not affect amplitude. B, In another cell, 1 μm zolpidem causes a time-dependent increase in sIPSC amplitude. B1, Composite average of >50 individual well isolated sIPSCs recorded from an α3 ventrobasal cell in the absence (black trace; Ctr) or presence (gray trace; Zlp) of 1 μm zolpidem. C, No differences were observed between genotypes in terms of sensitivity to 100 nm zolpidem, i.e., τd,w was increased in both α3(H126R) and wild-type (left; ∗∗p < 0.01) mice, whereas peak amplitude was not affected in either (right) α3(H126R) or wt mice. D, Averaged responses from another α3 ventrobasal cell exposed to 1 μm zolpidem showing increases in amplitude and duration. Note in the scaled responses in the inset that the degree of prolongation is similar to that seen with 100 nm ZOL (∗p < 0.05).
Table 1.
Effects of zolpidem on IPSC duration in thalamocortical neurons of α3(H126R) mutant and wild-type mice and in rats
| τd,w (ms) |
Peak amplitude (pA) |
|||||
|---|---|---|---|---|---|---|
| α3(H126R) | α3(H126H) | Rat | α3(H126R) | α3(H126H) | Rat | |
| Control | 17.6 ± 1.6 | 16.3 ± 0.3 | 20.7 ± 1.3 | 31.1 ± 2.7 | 26.4 ± 5.7 | 26.4 ± 2.0 |
| 100 nm zolpidem | 26.4 ± 2.2** | 23.5 ± 0.6** | 32.6 ± 1.9** | 32.1 ± 2.9 | 26.4 ± 6.6 | 27.3 ± 2.0 |
| 1 μm zolpidem | 23.4 ± 0.5** | n.t. | 26.6 ± 1.6** | 53.9 ± 1.6* | n.t. | 44.6 ± 4.8* |
IPSC duration and peak amplitude was measured from averaged isolated spontaneous IPSCs as described in Materials and Methods from TC neurons at P11–P14. Thalamic slices were obtained from α3(H126R) mutant mice (n = 12), their wild-type controls [α3(H126H); n = 4], and rat (n = 11). Significance assessed by two-tailed t test;
n.t., Not tested.
*p < 0.05,
**p < 0.01.
We evoked spindle-like oscillations in slices from α3(H126R) mice by delivering a single shock to internal capsule. Oscillations typically lasted a few seconds. To study the properties of these oscillations, we recorded multiunit activity from TC cells. Control oscillations had periods between 6.5 and 10.6 Hz (mean, 8.6 Hz; n = 9 slices). Figure 3a shows extracellular multiunit activity recorded before and after application of high doses of ZOL (500 nm or 1 μm) to enhance GABAAR-mediated synapses on TC cells. We did not observe appreciable differences between the effects of 500 nm or 1 μm ZOL and therefore grouped together data from these two conditions. Figure 3b shows autocorrelation functions calculated from the spike rate functions obtained in control conditions or during ZOL application.
Figure 3.

ZOL accelerates and desynchronizes oscillations in thalamic slices from α3(H126R) mice. a, Extracellular multiunit recordings from TC neurons during evoked oscillations in control conditions (left) and after application of 500 nm ZOL (right). b, Un-normalized autocorrelogram, averaged over five consecutive evoked oscillations, in control conditions (solid line) and after application of 500 nm ZOL (dashed line). Inset, Normalized autocorrelograms. c, Population data showing that ZOL significantly reduces both the period (left) and the oscillatory index (right), a measure of synchrony, in nine slices (∗p < 0.05).
ZOL has two major effects on the autocorrelogram. First, the location of the satellite peak, i.e., the first nonzero peak, shifts toward the left after ZOL application, corresponding to a reduction in the period (i.e., an increase in the frequency) of the oscillation. Second, ZOL reduces the height of the satellite peak relative to the preceding trough, corresponding to a reduction in network synchrony. Figure 3c shows the magnitude of these effects, averaged over many experiments. ZOL reduces the period of oscillations from 118 ± 5 ms in control conditions to 110 ± 5 ms after ZOL application (p < 0.05, paired t test; n = 9 slices). The oscillatory index, i.e., the difference between the heights of the satellite peak and preceding trough normalized by the height of the central peak, decreases from 0.43 ± 0.04 in control conditions to 0.30 ± 0.03 after ZOL application (p < 0.05, paired t test; n = 9 slices). We were not able to consistently wash out these effects of high-dose ZOL. However, application of either vehicle alone (n = 2) or low-dose (100 nm) ZOL (n = 2) did not affect the period or oscillatory index of evoked thalamic oscillations (data not shown).
Strengthening IPSCs or injecting depolarizing current increases rebound bursts in TC cells
Next, we tested whether changes in the amplitude and duration of IPSCs on TC cells could explain these effects of zolpidem on thalamic network oscillations. To do this, we recorded intracellularly from individual TC cells and used dynamic clamp to inject “spindle-like” trains of IPSCs. The resting membrane potential and input resistance of these cells were −64.4 ± 3.7 mV and 177 ± 60 MΩ, respectively (mean ± SD; n = 8 cells). As described in Materials and Methods, to construct these IPSC trains, we first generated presynaptic spike trains based on recordings from RE cells during spindle oscillations. Each presynaptic spike triggered a GABAAR-like IPSC in the “postsynaptic” TC cell. This IPSC comprised a conductance change equal to the unitary IPSC conductance (gIPSC) multiplied by a factor to account for short-term plasticity at RE to TC synapses. The conductance decayed monoexponentially according to a specific decay time constant (τIPSC). TC cells responded to the injected IPSCs with patterns of rebound bursts similar to those observed during spindle oscillations in vitro or in vivo. The number of bursts elicited by each train, as well as the numbers of spikes in each burst, both depended on the gIPSC, τIPSC, and the amount of tonic current injected into the TC cell (itonic). To study these effects, we repeatedly injected a TC cell with trains of IPSCs generated from the same train of presynaptic inhibitory events. However, during successive presentations of the same presynaptic train, we varied gIPSC, τIPSC, and/or itonic. Figure 4 shows the responses of a single TC cell to multiple presentations of the same train of presynaptic events as gIPSC is progressively increased (for each of these sweeps, τIPSC = 5 ms, and there is no tonic current). In this example, strengthening inhibition by increasing gIPSC clearly increases the number of rebound bursts elicited by the train.
Figure 4.

Effect of increasing IPSC amplitude on the responses of a TC neuron to spindle-like train of IPSCs. We used dynamic clamp to inject a TC neuron with spindle-like train of IPSCs. Each train was generated from the same sequence of presynaptic spikes. However, we progressively increased the unitary IPSC conductance from 2 to 6 nS, eliciting more bursts (the burst probability increased from 25 to 75%) and more spikes per burst (data not shown).
Figure 5 summarizes how gIPSC, τIPSC, and itonic each affects the burst probability, i.e., the fraction of popIPSPs in each IPSC train that led to rebound bursts (note that, in our analysis, a single spike following an IPSP counted as a rebound burst). To analyze the effects of conductance and decay time constant, we pooled together data from all experiments with zero tonic current and performed a four-way ANOVA. The four factors were the cell from which each recording was made, the train of presynaptic events that was used to generate the injected IPSC waveform, gIPSC, and τIPSC. To analyze the effect of tonic current, we performed a five-way ANOVA using the four factors mentioned above, along with itonic. ANOVA constructs a best-fit linear model, which estimates the burst probability using a sum of coefficients, each of which corresponds to one of the factors. For each possible value of the factor, there is a particular value for the corresponding coefficient.
Figure 5.

Effect of IPSC amplitude, IPSC duration, and tonic current on the burst probability, i.e., the probability that each IPSC within a spindle-like train will elicit a rebound burst. Each panel shows the estimate of a linear ANOVA model for the burst probability given different values for IPSC amplitude (left), IPSC duration (middle), and tonic current (right).
Figure 5 plots the estimate of the linear ANOVA model for the burst probability given various values for each of the different parameters. For example, when τIPSC is 4 or 8 ms, the estimated burst probabilities are 0.05 ± 0.02 and 0.34 ± 0.02, respectively (mean ± SEM). Similarly, the burst probability increased from 0.08 ± 0.02 when gIPSC = 3 nS to 0.35 ± 0.02 when gIPSC = 6 nS. Increasing either gIPSC or τIPSC elicits more rebound bursts (p < 0.001; n = 8 cells), presumably via greater T-current deinactivation. Tonic depolarizing current also increases the burst probability, whereas tonic hyperpolarizing current reduces the bursts probability (p < 0.001; n = 8 cells). These effects will be considered in more detail in Discussion.
Table 2 shows how gIPSC, τIPSC, and itonic affect the number of spikes in each burst. Again, we have used a linear ANOVA model to estimate the number of spikes per burst given different values of these three parameters. Changing gIPSC or τIPSC had little effect on the number of spikes per burst, but tonic current dramatically modulated the duration of bursts, i.e., the number of spikes per burst. Although depolarizing and hyperpolarizing current increase or decrease the number of bursts, respectively, they have the opposite effects on the number of spikes per burst (p < 0.001; n = 8 cells). Thus, tonic depolarizing current results in numerous, short-duration bursts, whereas tonic hyperpolarizing current biases TC cells to produce a smaller number of relatively long-lasting bursts.
Table 2.
Effects of IPSC amplitude and duration and of tonic current on the number of spikes per burst
| gIPSC (nS) | Spikes/burst | τIPSC (ms) | Spikes/burst | itonic (pA) | Spikes/burst |
|---|---|---|---|---|---|
| 3 | 2.9 ± 0.1 | 5 | 2.9 ± 0.1 | −50 | 4.3 ± 0.1 |
| 4 | 3.1 ± 0.1 | 6 | 3.0 ± 0.1 | −25 | 3.7 ± 0.1 |
| 5 | 3.0 ± 0.1 | 7 | 3.2 ± 0.1 | 0 | 3.0 ± 0.1 |
| 6 | 3.1 ± 0.1 | 8 | 3.3 ± 0.1 | 25 | 2.3 ± 0.1 |
| 50 | 2.3 ± 0.1 |
Changes in gIPSC or τIPSC have relatively modest effects on the numbers of spikes per burst, whereas tonic depolarizing and hyperpolarizing currents have dramatic effects on burst duration (p < 0.001; n = 8 cells).
Strengthening inhibition or depolarizing TC cells accelerates rebound bursts
Changing parameters of the IPSC train (e.g., gIPSC or τIPSC) or of the TC cell (e.g., itonic) affected the timing as well as the number and duration of TC cell bursts. Figure 6 shows responses of a single TC neuron to three consecutive popIPSCs as gIPSC, τIPSC, and itonic were varied during presentations of the same presynaptic spike train. In this example, increases in gIPSC, τIPSC, and itonic all seem to accelerate rebound bursts. We measured the “burst latency” as the time between the onset of a popIPSC and the time of the first spike in the subsequent rebound burst. We ignored popIPSCs that did not elicit rebound bursts. Because each popIPSC was composed of many unitary IPSCs triggered by bursts of presynaptic spikes, we defined the “onset” of a popIPSC as a weighted average of the times at which these unitary IPSC began. The weighting was proportional to the postsynaptic conductance triggered by each unitary IPSC. Thus, earlier spikes in a burst had greater influence on the onset of the popIPSC, because later spikes elicited smaller conductance changes to mimic synaptic depression.
Figure 6.
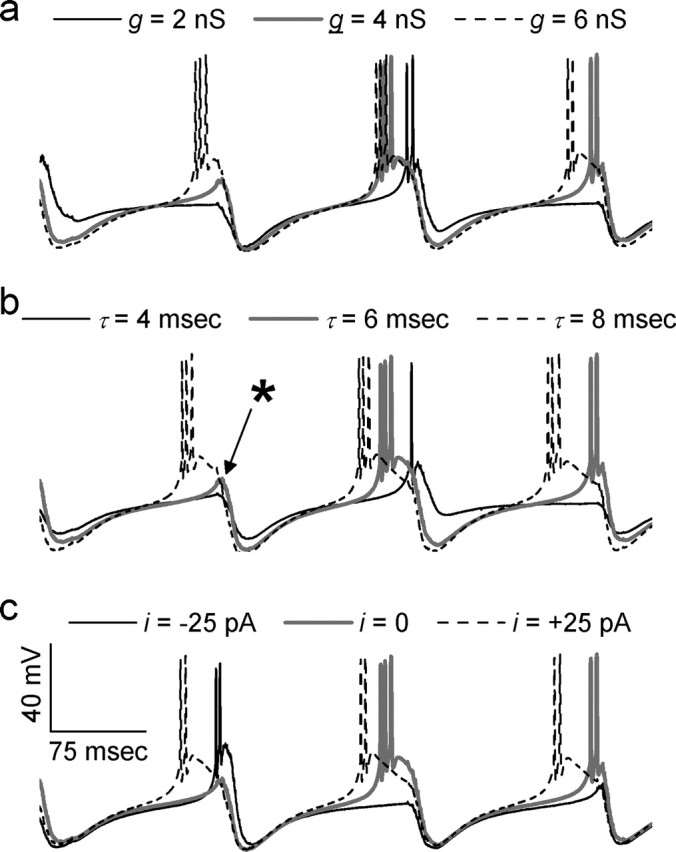
Effect of IPSC amplitude, IPSC duration, and tonic current on the timing and morphology of rebound bursts. Each panel shows responses of a single TC cell as gIPSC (a), τIPSC (b), or itonic (c) were varied. Unless otherwise specified, the parameters were as follows: gIPSC = 4 nS, τIPSC = 6 ms, and itonic = 0. In b, ∗ indicates a potential rebound burst that is “vetoed” by incoming IPSCs. Note that the thick gray trace is the same in each panel.
To analyze the effects of gIPSC and τIPSC on burst latency, we performed a five-way ANOVA on data from all experiments with zero tonic current. The five factors were gIPSC, τIPSC, the cell from which each recording was made, the particular train of IPSCs that was injected into the cell, and an index identifying the position of each popIPSC within the train. Again, we plotted the estimates of the linear ANOVA model for burst latency given different values of either gIPSC or τIPSC (Fig. 7). Increases in either the unitary IPSC conductance or the time constant of IPSC decay produced modest reductions in burst latency (p < 0.001; n = 8 cells). For example, increasing gIPSC from 2 to 6 nS decreases the burst latency from 155 ± 2 to 148 ± 1 ms (p < 0.001; n = 8 cells) (Fig. 6a). Similarly, prolonging τIPSC from 4 to 8 ms reduces burst latency from 154 ± 2 to 148 ± 1 ms (p < 0.001; n = 8 cells) (Fig. 6b). Note that we used gIPSC = 2–6 nS because this was similar to the range of conductances observed in vitro (Cox et al., 1997).
Figure 7.

Effect of IPSC amplitude, IPSC duration, and tonic current on latency of bursts elicited by a spindle-like train of IPSCs. Each panel shows the estimate of a linear ANOVA model for the burst latency given different values for IPSC amplitude (left), IPSC duration (middle), and tonic current (right).
In contrast to the relatively modest results of changing IPSC properties, changes in the amount of tonic current injected into TC cells dramatically alters burst latency (p < 0.001; n = 8 cells) in a very nonlinear way. For example, bursts occur with a latency of 167 ± 3 ms when itonic = −50 pA, but the latency is just 129 ± 1 ms when itonic = +50 pA (p < 0.001; n = 8 cells). Thus, depolarizing current dramatically accelerates rebound bursting in TC cells.
Strengthening inhibition or hyperpolarizing TC cells desynchronizes rebound bursts
Because changing the properties of either IPSCs (e.g., gIPSC or τIPSC) or TC cells (e.g., itonic) affects the timing of rebound bursts, as measured by the burst latency, changes in these same parameters might be expected to modulate the synchrony with which different TC cells rebound burst. We examined this possibility by calculating average phase differences as a function of gIPSC, τIPSC, and itonic. To do this, we first identified recordings from different TC cells in which IPSCs were generated using the same train of presynaptic events and the same values of gIPSC and τIPSC. (As in previous analyses, to study the effects of gIPSC and τIPSC, we only used experiments in which itonic = 0.) For each such pair of TC cell recordings, we found instances in which a particular popIPSC within the train elicited rebound bursts from both TC cells and calculated the difference between the times of the first spike in each rebound burst. Finally, we performed five-way ANOVA on these differences using the identities of the two TC cells, the particular train of presynaptic events, gIPSC, and τIPSC, as factors. To study the effect of itonic on phase differences, we took a similar approach, except that we only calculated phase differences for pairs of recordings in which itonic, in addition to the factors mentioned above, were equal, and we included the value of itonic as a factor in the ANOVA. Figure 8 shows the estimates of the linear ANOVA model for the phase difference given different values of the three parameters gIPSC, τIPSC, or itonic.
Figure 8.

Effect of IPSC amplitude, IPSC duration, and tonic current on the mean phase difference between bursts in different TC neurons responding to the same spindle-like train of IPSCs. Each panel shows the estimate of a linear ANOVA model for the phase difference given different values for IPSC amplitude (left), IPSC duration (middle), and tonic current (right).
Whereas increases in gIPSC, τIPSC, or itonic all have the same qualitative effect on absolute burst timing, i.e., they all reduce burst latency, increases in these three parameters have disparate effects on the relative timing of bursts in different TC cells. Increasing either gIPSC or τIPSC increases the absolute phase difference (Δt) between bursts in different TC cells (p < 0.001; n = 8 cells). For example, Δt is 27 ± 2 ms when gIPSC = 2 nS, but, when gIPSC = 4 nS, Δt increases to 35 ± 2 ms (p < 0.001; n = 8 cells). In contrast, increasingly depolarizing amounts of tonic current dramatically reduce phase differences. Injecting 50 pA of tonic hyperpolarizing current produces mean phase differences of 40 ± 5 ms, but the same amount of depolarizing current reduces Δt to just 22 ± 2 ms (p < 0.001; n = 8 cells).
Contributions of IT and IH to burst timing in simulations
Both low-threshold calcium currents (IT) and hyperpolarization-activated cationic currents (IH) could contribute to our observation that strengthening inhibition accelerates rebound bursts and that changes in tonic current that would modify Vm and thus voltage-gated channel activity would strongly influence rebound bursting. To explore the roles of these two currents, we simulated single-compartment TC cells containing IT, IH, voltage-dependent Na and K currents underlying action potentials, and a leak current, as described in Materials and Methods. We studied the responses of model TC cells to trains of rhythmic IPSCs similar to those used in experiments. Table 3 shows how slowing unitary IPSCs affected the timing of rebound bursts, as a function of gT and gH, the maximum conductances for IT and IH, respectively. In these relatively simple model TC cells, rebound bursts occurred when IT was present without IH but not when IH was present in the absence of IT. Furthermore, IH was not necessary to reproduce our observation that strengthening inhibition accelerates rebound bursts.
Table 3.
The amount by which prolonging τIPSC (from 4 to 8 ms) accelerates rebound bursts in simulated TC cells, as a function of gT and gH, the maximum conductance associated with IT and IH, respectively (model cells in which gT = 0 did not produce rebound bursts, irrespective of gH)
| g T |
g
H
|
|||
|---|---|---|---|---|
| 0 mS/cm2 | 0.04 mS/cm2 | 0.08 mS/cm2 | 0.12 mS/cm2 | |
| 4 mS/cm2 | 5.3 ± 1.4 | 5.2 ± 1.1 | 6.6 ± 1.4 | 6.9 ± 1.9 |
| 8 mS/cm2 | 3.3 ± 0.5 | 4.9 ± 0.8 | 5.7 ± 0.9 | 4.8 ± 0.9 |
Prolongation of IPSCs in simulated TC cells accelerates rebound bursts whether or not IH is present. Values are the change in timing of rebound bursts (in milliseconds) produced by doubling of τIPSC. n = 8 simulations from different initial conditions.
Discussion
Rhythmic inhibition entrains oscillations in many brain regions. It has been generally assumed that period and synchrony of the resulting activity reflect the duration and strength, respectively, of inhibitory input. For example, in TC neurons, dramatically increasing IPSC strength and duration by activating GABABRs slows and synchronizes oscillations (von Krosigk et al., 1993). However, we found that more modest increases (25–200%) in the amplitude or duration of GABAAR-mediated IPSCs actually produce the opposite effects. Using dynamic clamp to increase either IPSC strength or duration accelerated and desynchronized rebound bursts in TC neurons. Consistent with this finding, selectively enhancing inhibition in TC neurons, using zolpidem in thalamic slices from α3(H126R) mice, accelerated and desynchronized spindle-like oscillations.
As described above, previous studies have compared oscillations in which IPSCs are mediated primarily by GABAA or GABAB receptors. In these two conditions, IPSC duration differs by more than an order of magnitude, and IPSC amplitude, latency, and reversal potentials differ as well. Here, we used zolpidem and dynamic clamp to increase IPSC duration more modestly (25–200%), while keeping other IPSC properties fixed. During room temperature recordings from TC cells in α3(H126R) mice, we found that 1 μm zolpidem increased the amplitude and decay constant of IPSCs by 35 and 60%, respectively. Thus, the amounts by which we increased the amplitude and duration of IPSCs using dynamic clamp were comparable with the expected effects of zolpidem in vitro. Other studies under various conditions (temperature, concentration, and cell type) found that zolpidem always prolongs IPSCs and sometimes increases IPSC amplitude as well (Perrais and Ropert, 1999; Bacci et al., 2003). In our dynamic clamp experiments, the effects of selectively increasing the duration or amplitude of IPSCs were similar. Thus, the effects of zolpidem on thalamic oscillations may be explained by increases in either the duration or amplitude of IPSCs in TC cells.
Strengthening inhibition has competing effects on rebound bursts. Increasing either the amplitude or duration of hyperpolarizing current steps (Crunelli et al., 1989), or the amplitude of IPSCs (Ulrich and Huguenard, 1996), increases the probability that TC cells will rebound burst, by deinactivating T-current. Slowing IPSCs might also slow the rate of depolarization, which is known to reduce the probability of rebound bursts (Crunelli et al., 1989). Our finding that increases in either gIPSC or τIPSC increase the burst probability suggests that the former effect (T-current deinactivation) dominates over the latter (changes in the rate of depolarization).
The effect of strengthening inhibition on rebound burst timing also involves competing factors. Increasing either IPSC duration or amplitude increases T-current deinactivation but also increases the hyperpolarizing current that must be overcome before a burst can occur. Our finding that strengthening inhibition ultimately accelerates bursts demonstrates that the former effect dominates. Note that, when IPSCs are much slower (e.g., τdecay of ∼150 ms at 30°C), strengthening inhibition can slow rebound bursts in TC cells (Ulrich and Huguenard, 1996).
Increasing the amplitude or duration of IPSCs could synchronize TC cells by strengthening their common input and deinactivating T-current, so that a ceiling effect brings the times of their bursts closer together. However, strengthening inhibition could also desynchronize TC cells. For example, TC cells could have different amounts of T-current, which are “unmasked” when inhibition is sufficiently strong. In fact, increasing either IPSC amplitude or duration desynchronized rebound bursts in TC cells, suggesting that TC cells have variable propensities to burst, and that hyperpolarizing synaptic currents accentuate these differences.
Increasing IPSC amplitude or duration produced very similar effects. This suggests that the major effect of prolonging unitary IPSCs is to facilitate temporal summation and increase the popIPSC amplitude, not to slow recovery from inhibition, which seems instead to be governed by intrinsic currents. Figure 6b shows that that slowing τdecay actually accelerates the recovery from inhibition and increases the popIPSC amplitude in much the same way as increasing gIPSC.
Role of tonic current
Tonic current always involves competing factors, e.g., depolarizing current helps TC neurons reach burst threshold, increasing the number of bursts, but also inactivates T-current, reducing the number of spikes per burst. Similarly, increasing depolarizing current inactivates T-channels but nevertheless induces TC neurons to burst earlier. These competing effects may also explain how depolarizing current synchronizes bursts in different neurons. Depolarizing current provides a source of common input that brings all TC neurons to the burst threshold more quickly, reducing the influence of heterogeneous amounts of IT, etc., on burst timing. Additionally, by inactivating T-current, tonic current may partially mask heterogeneity in the burst propensity of TC neurons.
Our finding that tonic depolarization increases the number and synchrony of rebound bursts contrasts with a recent finding that a relatively hyperpolarized resting membrane potential for TC neurons may contribute to absence epilepsy in mice lacking the HCN2 channel (Ludwig et al., 2003). These differences may be explained by the fact that, in this study and in thalamic slices, TC neurons are driven exclusively by rhythmic inhibition, whereas during absence seizures in vivo, bursts may be elicited by a combination of excitation and inhibition (Pinault et al., 1998; Pinault, 2003). Future studies should examine TC neuron responses to such combinations of phasic excitation and inhibition.
Future studies
Many of the hypotheses presented above about interactions between intrinsic currents and synaptic inhibition can be tested using experiments and simulations. For example, under conditions of reduced heterogeneity, e.g., by blocking IH, strengthening inhibition should produce less desynchronization of TC neuron activity. Future dynamic clamp experiments could also explore the effects of larger changes in inhibition by including simulated GABABR activation.
Implications for information processing
Our results demonstrate ways in which interactions between synaptic inhibition and other currents could regulate firing throughout the brain. For example, during many oscillations, excitatory neurons only fire on a subset of cycles (von Krosigk et al., 1993; Bragin et al., 1995). We found that, during trains of rhythmic IPSCs, depolarizing input, e.g., from excitatory synapses or from neuromodulatory alterations in resting K+ conductances (McCormick and Bal, 1997), accelerates and synchronizes PIR, enabling a subset of neurons that receive excitatory input to fire synchronously before the next cycle of inhibition arrives. (Note that we studied tonic currents rather than conductance changes, but we expect conductance changes to produce qualitatively similar effects.)
Much has been made of the fact that TC neurons can fire in burst or tonic mode (Jahnsen and Llinas, 1984), and that each of these contributes to sensory processing (Sherman, 2001). Here, we further demonstrate that the burst mode is not homogeneous. Rather, TC neurons produce either relatively rapid, synchronized, and short-duration bursts in response to depolarizing current, or slow-onset, poorly synchronized, longer-lasting bursts in response to hyperpolarizing current. We observed a nonlinear switch between these modes (cf. Table 2, Figs. 7, 8), suggesting a mechanism by which tonic inputs and neuromodulators could modulate information processing.
Implications for absence epilepsy
Rhythmic rebound bursts in TC neurons are thought to contribute to spike-wave discharge in generalized absence epilepsy, and some phenomena we described may constitute novel antiepileptic mechanisms. For example, strengthening inhibitory input to TC neurons recruits additional rebound bursts (Figs. 4, 5), which, by activating additional RE neurons, could further strengthen inhibitory input to TC neurons. Unchecked, this feedback loop might generate epileptiform discharges. However, as we found, strengthening inhibitory input also accelerates rebound bursts, and the first few of these bursts could recruit feedback inhibition from RE neurons. This would reduce the window during which subsequent rebound bursts could occur, potentially preventing delayed bursts from other TC neurons (cf. Fig. 6b, ∗). Strengthening inhibition also desynchronizes TC neuron activity. These effects may explain why strengthening inhibitory input to TC cells using zolpidem does not elicit epileptiform activity.
Oscillations in other brain regions
Outside of the thalamus, rhythmic IPSCs are prominent in pyramidal cells during hippocampal theta oscillations (Soltesz and Deschenes, 1993; Ylinen et al., 1995) and in subthalamic neurons during synchronized low-frequency oscillations (Plenz and Kital, 1999). Although these oscillations differ significantly from thalamic spindle oscillations, both hippocampal pyramidal cells and subthalamic neurons strongly expresses T-type calcium channels (Talley et al., 1999) and exhibit PIR (Cobb et al., 1995; Plenz and Kital, 1999; Bevan et al., 2002), suggesting that the properties of rhythmic bursting we described for thalamocortical neurons may be relevant to oscillations in other regions of the brain as well.
Conclusions
We set out to test the hypothesis that the amplitude and duration of rhythmic IPSCs determine the period and synchrony, respectively, of oscillations driven by PIR. Using in vitro pharmacology together with a dynamic clamp approach, we found that, contrary to our expectations, strengthening inhibition accelerates and desynchronizes PIR in individual cells as well as oscillations driven by PIR. These results demonstrate that PIR is an emergent property of interactions between intrinsic and synaptic currents, not just a passive reflection of incoming synaptic inhibition. They also illustrate how, by unmasking heterogeneity between different neurons, selectively synchronizing subsets of neurons, and checking potentially epileptogenic activity in feedback loops, these interactions may contribute to the function of PIR networks throughout the brain.
Footnotes
V. S. Sohal’s present address: Department of Psychiatry, Stanford University Medical Center, Stanford, CA 94305.
This work was supported by National Institutes of Health Grants GM07365 from the National Institute of General Medical Sciences and NS34774 and NS06477 from the National Institute of Neurological Disorders and Stroke, and the Pimley Research Fund. We thank Ruth Keist for providing the α3(H126R) mice.
References
- Bacci A, Rudolph U, Huguenard JR, Prince DA (2003). Major differences in inhibitory synaptic transmission onto two neocortical interneuron subclasses. J Neurosci 23:9664–9674. [DOI] [PMC free article] [PubMed] [Google Scholar]
- Benson JA, Low K, Keist R, Mohler H, Rudolph U (1998). Pharmacology of recombinant gamma-aminobutyric acidA receptors rendered diazepam-insensitive by point-mutated alpha-subunits. FEBS Lett 431:400–404. [DOI] [PubMed] [Google Scholar]
- Bevan MD, Magill PJ, Hallworth NE, Bolam JP, Wilson CJ (2002). Regulation of the timing and pattern of action potential generation in rat subthalamic neurons in vitro by GABA-A IPSPs. J Neurophysiol 87:1348–1362. [DOI] [PubMed] [Google Scholar]
- Bragin A, Jando G, Nadasdy Z, Hetke J, Wise K, Buzsaki G (1995). Gamma (40–100 Hz) oscillation in the hippocampus of the behaving rat. J Neurosci 15:47–60. [DOI] [PMC free article] [PubMed] [Google Scholar]
- Buhl EH, Tamas G, Fisahn A (1998). Cholinergic activation and tonic excitation induce persistent gamma oscillations in mouse somatosensory cortex in vitro. J Physiol (Lond) 513:117–126. [DOI] [PMC free article] [PubMed] [Google Scholar]
- Cobb SR, Buhl EH, Halasy K, Paulsen O, Somogyi P (1995). Synchronization of neuronal activity in hippocampus by individual GABAergic interneurons. Nature 378:75–78. [DOI] [PubMed] [Google Scholar]
- Coulter DA, Huguenard JR, Prince DA (1989). Specific petit mal anticonvulsants reduce calcium currents in thalamic neurons. Neurosci Lett 98:74–78. [DOI] [PubMed] [Google Scholar]
- Cox CL, Huguenard JR, Prince DA (1997). Nucleus reticularis neurons mediate diverse inhibitory effects in thalamus. Proc Natl Acad Sci USA 94:8854–8859. [DOI] [PMC free article] [PubMed] [Google Scholar]
- Crestani F, Martin JR, Mohler H, Rudolph U (2000). Mechanism of action of the hypnotic zolpidem in vivo. Br J Pharmacol 131:1251–1254. [DOI] [PMC free article] [PubMed] [Google Scholar]
- Crunelli V, Lightowler S, Pollard CE (1989). A T-type Ca2+ current underlies low-threshold Ca2+ potentials in cells of the cat and rat lateral geniculate nucleus. J Physiol (Lond) 413:543–561. [DOI] [PMC free article] [PubMed] [Google Scholar]
- Fisahn A, Pike FG, Buhl EH, Paulsen O (1998). Cholinergic induction of network oscillations at 40 Hz in the hippocampus in vitro. Nature 394:186–189. [DOI] [PubMed] [Google Scholar]
- Huguenard JR, Prince DA (1994). Intrathalamic rhythmicity studied in vitro: nominal T-current modulation causes robust antioscillatory effects. J Neurosci 14:5485–5502. [DOI] [PMC free article] [PubMed] [Google Scholar]
- Jahnsen H, Llinas R (1984). Voltage-dependent burst-to-tonic switching of thalamic cell activity: an in vitro study. Arch Ital Biol 122:73–82. [PubMed] [Google Scholar]
- Kapetanovic IM, Yonekawa WD, Kupferberg HJ (1993). Time-related loss of glutamine from hippocampal slices and concomitant changes in neurotransmitter amino acids. J Neurochem 61:865–872. [DOI] [PubMed] [Google Scholar]
- Kim D, Song I, Keum S, Lee T, Jeong MJ, Kim SS, McEnery MW, Shin HS (2001). Lack of the burst firing of thalamocortical relay neurons and resistance to absence seizures in mice lacking alpha(1G) T-type Ca2+ channels. Neuron 31:35–45. [DOI] [PubMed] [Google Scholar]
- Le Masson G, Renaud-Le Masson S, Debay D, Bal T (2002). Feedback inhibition controls spike transfer in hybrid thalamic circuits. Nature 417:854–858. [DOI] [PubMed] [Google Scholar]
- Liu XB, Honda CN, Jones EG (1995). Distribution of four types of synapse on physiologically identified relay neurons in the ventral posterior thalamic nucleus of the cat. J Comp Neurol 352:69–91. [DOI] [PubMed] [Google Scholar]
- Low K, Crestani F, Keist R, Benke D, Brunig I, Benson JA, Fritschy JM, Rulicke T, Bluethmann H, Mohler H, Rudolph U (2000). Molecular and neuronal substrate for the selective attenuation of anxiety. Science 290:131–134. [DOI] [PubMed] [Google Scholar]
- Ludwig A, Budde T, Stieber J, Moosmang S, Wahl C, Holthoff K, Langebartels A, Wotjak C, Munsch T, Zong X, Feil S, Feil R, Lancel M, Chien KR, Konnerth A, Pape HC, Biel M, Hofmann F (2003). Absence epilepsy and sinus dysrhythmia in mice lacking the pacemaker channel HCN2. EMBO J 22:216–224. [DOI] [PMC free article] [PubMed] [Google Scholar]
- McCormick DA, Bal T (1997). Sleep and arousal: thalamocortical mechanisms. Annu Rev Neurosci 20:185–215. [DOI] [PubMed] [Google Scholar]
- Perrais D, Ropert N (1999). Effect of zolpidem on miniature IPSCs and occupancy of postsynaptic GABAA receptors in central synapses. J Neurosci 19:578–588. [DOI] [PMC free article] [PubMed] [Google Scholar]
- Pinault D (2003). Cellular interactions in the rat somatosensory thalamocortical system during normal and epileptic 5–9 Hz oscillations. J Physiol (Lond) 552:881–905. [DOI] [PMC free article] [PubMed] [Google Scholar]
- Pinault D, Leresche N, Charpier S, Deniau JM, Marescaux C, Vergnes M, Crunelli V (1998). Intracellular recordings in thalamic neurones during spontaneous spike and wave discharges in rats with absence epilepsy. J Physiol (Lond) 509:449–456. [DOI] [PMC free article] [PubMed] [Google Scholar]
- Pirker S, Schwarzer C, Wieselthaler A, Sieghart W, Sperk G (2000). GABA(A) receptors: immunocytochemical distribution of 13 subunits in the adult rat brain. Neuroscience 101:815–850. [DOI] [PubMed] [Google Scholar]
- Plenz D, Kital ST (1999). A basal ganglia pacemaker formed by the subthalamic nucleus and external globus pallidus. Nature 400:677–682. [DOI] [PubMed] [Google Scholar]
- Rudolph U, Mohler H (2004). Analysis of GABAA receptor function and dissection of the pharmacology of benzodiazepines and general anesthetics through mouse genetics. Annu Rev Pharmacol Toxicol 44:475–498. [DOI] [PubMed] [Google Scholar]
- Salek-Haddadi A, Lemieux L, Merschhemke M, Friston KJ, Duncan JS, Fish DR (2003). Functional magnetic resonance imaging of human absence seizures. Ann Neurol 53:663–667. [DOI] [PubMed] [Google Scholar]
- Sanchez-Vives MV, McCormick DA (1997). Functional properties of perigeniculate inhibition of dorsal lateral geniculate nucleus thalamocortical neurons in vitro. J Neurosci 17:8880–8893. [DOI] [PMC free article] [PubMed] [Google Scholar]
- Sherman SM (2001). Tonic and burst firing: dual modes of thalamocortical relay. Trends Neurosci 24:122–126. [DOI] [PubMed] [Google Scholar]
- Snead OC, Depaulis A, Vergnes M, Marescaux C (1999). Absence epilepsy: advances in experimental animal models. Adv Neurol 79:253–278. [PubMed] [Google Scholar]
- Sohal VS, Huguenard JR (2003). Inhibitory interconnections control burst pattern and emergent network synchrony in reticular thalamus. J Neurosci 23:8978–8988. [DOI] [PMC free article] [PubMed] [Google Scholar]
- Sohal VS, Huntsman MM, Huguenard JR (2000). Reciprocal inhibitory connections regulate the spatiotemporal properties of intrathalamic oscillations. J Neurosci 20:1735–1745. [DOI] [PMC free article] [PubMed] [Google Scholar]
- Sohal VS, Keist R, Rudolph U, Huguenard JR (2003). Dynamic GABAA receptor subtype-specific modulation of the synchrony and duration of thalamic oscillations. J Neurosci 23:3649–3657. [DOI] [PMC free article] [PubMed] [Google Scholar]
- Soltesz I, Deschenes M (1993). Low- and high-frequency membrane potential oscillations during theta activity in CA1 and CA3 pyramidal neurons of the rat hippocampus under ketamine-xylazine anesthesia. J Neurophysiol 70:97–116. [DOI] [PubMed] [Google Scholar]
- Steriade M, Deschenes M, Domich L, Mulle C (1985). Abolition of spindle oscillations in thalamic neurons disconnected from nucleus reticularis thalami. J Neurophysiol 54:1473–1497. [DOI] [PubMed] [Google Scholar]
- Talley EM, Cribbs LL, Lee JH, Daud A, Perez-Reyes E, Bayliss DA (1999). Differential distribution of three members of a gene family encoding low voltage-activated (T-type) calcium channels. J Neurosci 19:1895–1911. [DOI] [PMC free article] [PubMed] [Google Scholar]
- Ulrich D, Huguenard JR (1996). Gamma-aminobutyric acid type B receptor-dependent burst-firing in thalamic neurons: a dynamic clamp study. Proc Natl Acad Sci USA 93:13245–13249. [DOI] [PMC free article] [PubMed] [Google Scholar]
- Ulrich D, Huguenard JR (1997). Nucleus-specific chloride homeostasis in rat thalamus. J Neurosci 17:2348–2354. [DOI] [PMC free article] [PubMed] [Google Scholar]
- von Krosigk M, Bal T, McCormick DA (1993). Cellular mechanisms of a synchronized oscillation in the thalamus. Science 261:361–364. [DOI] [PubMed] [Google Scholar]
- Wieland HA, Luddens H, Seeburg PH (1992). A single histidine in GABAA receptors is essential for benzodiazepine agonist binding. J Biol Chem 267:1426–1429. [PubMed] [Google Scholar]
- Williams D (1953). A study of thalamic and cortical rhythms in petit mal. Brain 76:50–69. [DOI] [PubMed] [Google Scholar]
- Wisden W, Laurie DJ, Monyer H, Seeburg PH (1992). The distribution of 13 GABAA receptor subunit mRNAs in the rat brain. I. Telencephalon, diencephalon, mesencephalon. J Neurosci 12:1040–1062. [DOI] [PMC free article] [PubMed] [Google Scholar]
- Wolfart J, Debay D, Le Masson G, Destexhe A, Bal T (2005). Synaptic background activity controls spike transfer from thalamus to cortex. Nat Neurosci 8:1760–1767. [DOI] [PubMed] [Google Scholar]
- Ylinen A, Soltesz I, Bragin A, Penttonen M, Sik A, Buzsaki G (1995). Intracellular correlates of hippocampal theta rhythm in identified pyramidal cells, granule cells, and basket cells. Hippocampus 5:78–90. [DOI] [PubMed] [Google Scholar]