Abstract
Correlated spontaneous activity in the form of retinal “waves” has been observed in a wide variety of developing animals, but whether retinal waves occur in the primate has not been determined previously. To address this issue, we recorded from isolated retinas using multielectrode arrays at six fetal ages: embryonic day 51 (E51), E55, E60, E67, E71, and E76. These recordings revealed that the fetal monkey retina is essentially silent at E51 and E55, with only few cells firing on rare occasions and without any obvious spatial or temporal order. Because previous work has shown that the magnocellular and parvocellular subdivisions of the dorsal lateral geniculate are selectively innervated during this early period, our results suggest that this process is unlikely to be regulated by retinal activity. Highly structured retinal waves were first observed at E60, >1 week before the segregation of eye-specific retinal dorsal lateral geniculate nucleus projections commences. The incidence of such waves decreased rapidly and progressively during the developmental period (E67–E76) when segregated eye-specific projections become established. Our findings indicate that retinal waves first occur in the fetal monkey at a remarkably early stage of development, >100 d before birth, and that this activity undergoes rapid changes in salient properties when eye-specific retinogeniculate projections are being formed.
Keywords: retina, development, lateral geniculate, lgn, spontaneous activity, primate, retinal waves
Introduction
Spontaneous neuronal activity that occurs before the onset of sensory experience has been observed in many regions of the developing nervous system (for review, see Feller, 1999; Wong, 1999). This activity has been implicated in a wide variety of developmental phenomena, including neurogenesis (Weissman et al., 2004), the specification of neurotransmitter phenotype (Borodinsky et al., 2004), axon guidance cue expression (Hanson and Landmesser, 2004), axon outgrowth (Goldberg et al., 2002), and the refinement of dendrites (Bodnarenko and Chalupa, 1993) and axons (Sretavan et al., 1988; Penn et al., 1998; Misgeld et al., 2002). In the developing visual system, retinal ganglion cells manifest periodic bursts of action potentials even before photoreceptors are capable of responding to light (Galli and Maffei, 1988). In rodents and carnivores, this activity occurs as “waves” of excitation that propagate across the retina, during the developmental period when initially overlapping left- and right-eye inputs to the dorsal lateral geniculate nucleus (dlgn) segregate into eye-specific domains (ferret, Meister et al., 1991; Wong et al., 1993; mouse, Demas et al., 2003). Blocking all spontaneous retinal activity can prevent (Penn et al., 1998; Huberman et al., 2002) or delay (Cook et al., 1999) the formation of eye-specific projections to the dlgn. However, whether the wave-like nature of retinal activity is essential for this segregation process remains controversial (Huberman et al., 2003; Grubb and Thompson, 2004; Torborg et al., 2005).
In an attempt to clarify the role of neuronal activity in the formation of connections between the retina and the dlgn, we focus here on recordings from the isolated retina of the prenatal macaque monkey. In addition to having a visual system similar to that of humans, the macaque offers some unique advantages for developmental studies. The gestational period during which visual connections are formed is relatively protracted in the macaque, providing an opportunity to clearly delineate the various cellular processes that occur during visual system development (such as axon outgrowth, target innervation, cell death, etc.). Moreover, previous studies have defined the fetal ages when two hallmark features of the primate visual system are established: the selective ingrowth of magnocellular (M) and parvocellular (P) subsystems (Meissirel et al., 1997) and the segregation of eye-specific ganglion cell inputs to the dlgn (Rakic, 1976; Huberman et al., 2005a) so a comparison of the timing of these events with retinal activity can now be made.
In the present study, we performed multielectrode recordings from the retinas of fetal monkeys of known gestational ages, spanning the period when segregated M and P pathways and eye-specific inputs form. We sought to answer three main questions. (1) Is spontaneous retinal activity present during the time when segregated M and P pathways and/or eye-specific retino-dlgn inputs are established? (2) If retinal activity is present, what are the spatiotemporal properties of that activity? (3) How do the spontaneous retinal discharges that may be present in the fetal monkey compare with those documented in the retina of other species during comparable stages of development?
Materials and Methods
Animals
All procedures were performed according to National Institutes of Health guidelines and in strict compliance with institutional protocols of the California Regional Primate Center at the University of California, Davis. Eyes were obtained from six fetal macaque monkeys (Macaca fascicularis) at the following gestational ages: embryonic day 51 (E51), E55, E60, E67, E71, and E76. To obtain timed-pregnant monkeys, optimal breeding days were determined by monitoring the average length of a given animal's menstrual cycle over 6 consecutive months, dividing this average cycle by 2, and subtracting 2 d from this value. Animals were on a 12 h light/dark cycle and were paired with a breeder male from 2 d before until 2 d after this optimal breeding day. This allows the gestational age of the fetus to be determined to within ±2 d. E1 represents the 24 h after mating. The mean duration of gestation for M. fascicularis is 165 d (for additional details and comparison with other macaque species, see Huberman et al., 2005a, their Materials and Methods).
Surgery and tissue preparation
Timed-pregnant macaques were prepared for surgery under ketamine (10 mg/kg), and anesthesia was induced with 1–3% isoflurane. The fetuses were delivered by cesarean section and killed by swift decapitation. The eyes were removed, placed in oxygenated media, and transported in a cooled, insulated container from the surgical suite to the multielectrode recording facility. Retinas were isolated while submerged in buffered and oxygenated media (Minimum Essential Medium Eagle; M7278; Sigma, St. Louis, MO) at room temperature. Approximately one-third of the retina was further isolated by cutting radially out from the optic nerve head to the temporal periphery. This piece was then trimmed as necessary to remove any remaining vitreous. The resulting piece of retina was ∼25% larger than the 1.4 × 1.4 mm recording area of the multielectrode array. In this manner, we confined our recordings to approximately equivalent regions of the retina at each of the ages studied. At all ages, the peripheral regions of the fetal monkey retina had a tendency to fold and curl, which rendered these retinal segments unsuitable for multi-array recordings.
Recordings
The retina was placed ganglion cell layer down onto a multielectrode array (Multi-Channel Systems, Tubingen Germany), held in place with a piece of dialysis membrane (Spectrapore 132130; Spectrum, Los Angeles, CA), and superfused at 1–2 ml/min at 37°C. The array electrodes were 30 μm in diameter and arranged on an 8 × 8 rectilinear grid with 200 μm interelectrode spacing. At this interelectrode spacing, the signal of a given cell appeared on only one electrode so each cell was assigned the coordinates of the electrode that recorded its signal. Note that, for a 5-mm-diameter eye, the array covers ∼50% [1.4 mm × sqrt(2))/(π × 2.5 mm/2, where sqrt is the square root] of the area between the optic disc and the peripheral edge of the retina, so the multielectrode recording samples from a large fraction of the available retina. For each piece of retina, simultaneous analog data were acquired at 20 kHz per channel from the array of 60 electrodes for a period of ∼1 h (E60, 111 min; E67, 50 min; E71, 58 min; E76, 53 min). Overall firing rates of the ensemble appeared stable over this time period (supplemental data, available at www.jneurosci.org as supplemental material). To assess this impression quantitatively, we performed a statistical analysis of the distribution of wave frequency in the first half of the recording versus the last half of the recording. For a given age, we assumed that the waves come independently with a mean rate m. Given that the probability of two Poisson samples with mean rate m having a difference d is P(d) = exp(−2m) × besseli(d, 2m), where besseli is the Bessel function of the first kind of order d and argument 2m; we verified that any rate difference d occurring in the first half of the experiment versus the last half of the experiment for each age is consistent with what is expected from a uniform rate m using a 95% significance level.
Spike identification
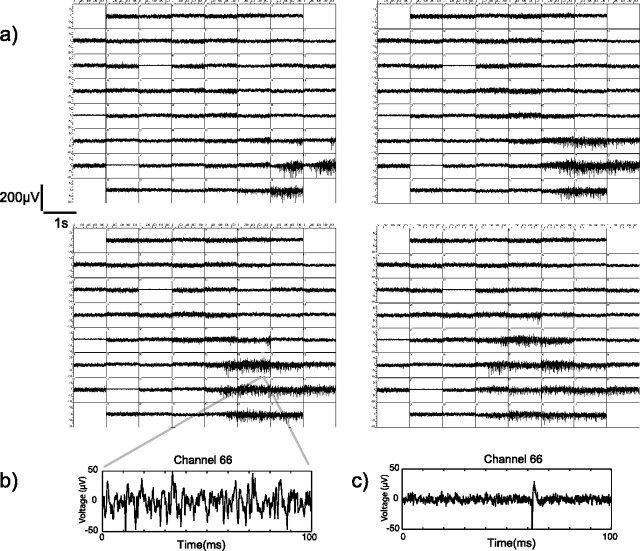
Before sorting spike events, the data were digitally filtered with a 125 Hz high-pass filter (four-pole Butterworth). A threshold of six times the SD of the channel was set individually for each channel, and 1 ms of data before a threshold-crossing event and 4 ms after the threshold event were stored for each negative-slope event. These candidate spike waveforms were then sorted with the OfflineSorter (Plexon, Denton, TX) using the first three principle components of the spike waveforms. Coincident events within 0.5 ms of one another that occurred on all electrodes were attributed to perfusion noise and removed. Clusters were first identified using an EM cluster algorithm by Shoham et al. (2003) and then manually edited for clustering errors. Because multiple cells near a given electrode fire simultaneously, it was not always possible to accurately assign a spike to an individual cell. This was especially the case for the E60 recordings in which cells fired together in rapid bursts and resulted in overlapping spike waveforms (see Fig. 1b,c). Therefore, for the E60 recordings, we chose to characterize the records using multiunit responses (e.g., if multiple spikes overlap, they were assigned to a single event). We estimate that there are between 1 and 3 cells in these multi-unit responses. For other ages, it was possible to identify single units in part because cells also fired in between burst events.
Figure 1.
Analog multielectrode array recordings during a wave of activity from developing E60 monkey retina. a, Each of the four panels consists of 61 individual electrode traces arranged on a grid that approximates the rectangular electrode array geometry. Within each panel, each electrode trace shows 1 s of data. The panels are arranged to be consecutive in time left-to-right for a total of 4 s of data displayed. The wave begins in the bottom right corner of the array and spreads up and to the left over the next 4 s. b, An example of a 100 ms section of raw analog data taken from a particular electrode during a wave. c, An example of a single unit in another 100 ms segment from this same electrode before this wave.
Statistical analyses
Burst length and interburst interval.
The burst duration was measured using the maxInterval algorithm provided by Neuroexplorer (Nex Technologies, Littleton, MA). Briefly, this algorithm scans the spike train until an interspike interval is found that is less than or equal to an interval I1 = 0.1 s. If the interspike intervals are less than an interval I2 = 1 s, then they are included in the burst. If the interspike interval is more than I2, the burst ends. The algorithm then merges all of the bursts that are less than an interval I3 = 5 s and removes the bursts that have duration less than I4 = 0.5 s or have fewer than n = 4 spikes. Results of this algorithm were similar to the width of the autocorrelation function in which we fit a Gaussian (a × exp(((x − μ)/s)⋀2) + c) to the autocorrelation function and defined the burst length as the width 2 s of the Gaussian fit. The maxInterval algorithm also provides the interburst interval statistics. These results were crosschecked by forming the rate histograms binned into 1 s bins and setting a threshold at 50% of the maximum rate provided that it was not less than 10 Hz. Burst locations were defined to be at the locations of positive threshold crossings.
Correlation analysis.
To quantify the degree of correlated firing between all recorded pairs of cells, all cross-correlation functions were calculated and summarized by a correlation index (CI). The CI measures how more likely a pair of cells fires together within a particular time window than by chance. The correlation index was computed as described by Wong et al. (1993) using the following formula: Nab(−w, +w) × T/(Na(0,T) × Nb(0,T) × 2 × w), where Nab(−w, +w) is the number of spike pairs from cells a and b for which cell b fires within ±w seconds of cell a, T is the duration of the recording in seconds, Na(0,T) and Nb(0,T) are the total number of spikes from cell a and b during the recording, and 2 × w is the width of the correlation window. Nab was computed using w = 0.1 s, and the cross-correlation function was binned at 0.05 s. The particular values of the correlation index depend on the choice of the correlation window w. A value of 0.1 s is typically chosen based on what has been commonly used by other investigators as a reasonable timescale for activity-dependent modification of synaptic strength (Meister et al., 1991; Torborg et al., 2005).
Results
Recordings from the two youngest animals (E51 and E55) indicated that, at these early ages, the fetal monkey retina is essentially electrically silent. In the E51 retina, we recorded spiking activity from a total of only seven cells. The firing rates of these neurons were very low, ∼1 spike/min (median, 13 mHz; min, 6 mHz; max, 387 mHz). In the E55 retina, we recorded from two cells, with firing rates of 50 and 30 mHz. At these early ages, there was no indication of bursts or correlated firing patterns.
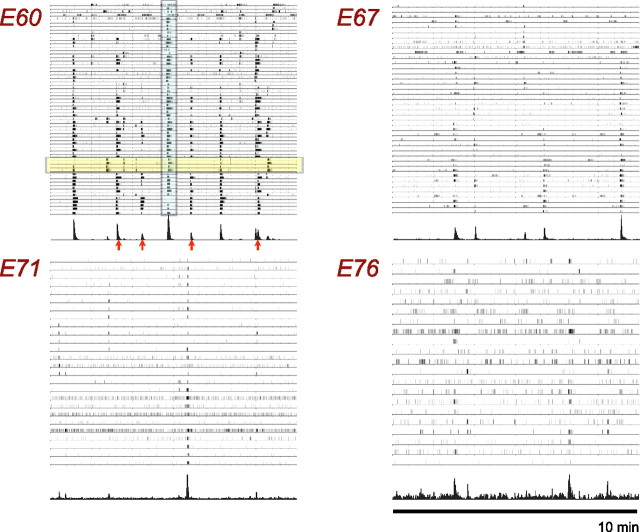
At E60, there was a dramatic change in the functional state of the fetal monkey retina. At this age, slow periodic waves of activity became evident. An example of such activity is shown in Figure 1a, which depicts analog data (1 s in duration) for each of the 60 electrodes from the multielectrode array. A wave can be seen to begin near a single electrode in the lower part of the array that traveled outward over the next 5 s. These types of waves in this region of the retina occurred approximately once every 2 min; the size of the domains was variable, ranging from ∼200 μm to >1 mm. At this age, it was problematic to isolate single units during a burst of activity, so we characterized these recordings by relying on multiunit responses (see Materials and Methods). A raster plot of a 10 min portion of a 1 h recording is shown in the top left of Figure 2. Note that, although the wave domains are large and appear on nearly all electrodes (e.g., central blue highlighted region), not every unit participates in every wave event. For instance, in Figure 2 (top left), the four highlighted units (yellow) participated in the central wave but not in the wave events labeled by the arrows.
Figure 2.
Representative spike trains for 10 min of recording taken at four developmental ages E60, E67, E71, and E76. A histogram of the total activity across the entire array is also shown beneath each raster plot to assist in identifying a retinal wave. Units of histogram are cell spikes per second. Arrows and blue highlighted area indicate the times of particular wave events discussed in Results. Spike trains highlighted in yellow indicate examples of cells that do not participate in every wave event. The different number of traces in each panel reflects the different number of cells identified in each recording.
To characterize the overall activity of the retina over the area of the array, we summed the spike trains over all electrodes. These histograms can be seen at the bottom of each raster plot in Figure 2. Note that the wave events stand out in this histogram compared with the raw raster plots because cells both burst and fire together during a wave.
To determine the number of wave events in the entire region of retina over the array, we set an empirical threshold at 20 cell spikes per second and counted the number of positive threshold crossings. Because the wave events create sharp peaks in the histogram, the particular value for the threshold was not critical as long as it was above the total background firing rate. Visual inspection of the raster plots for wave propagation at these threshold-crossing times confirmed that these events were attributable to wave events and not just to high spontaneous activity. For the E60 recording, we observed on average one wave every 52 s within the whole 2 mm2 area of retina. Note that the average interburst interval can be different than the average time between waves because there can be multiple wave domains active in the retinal region being recorded.
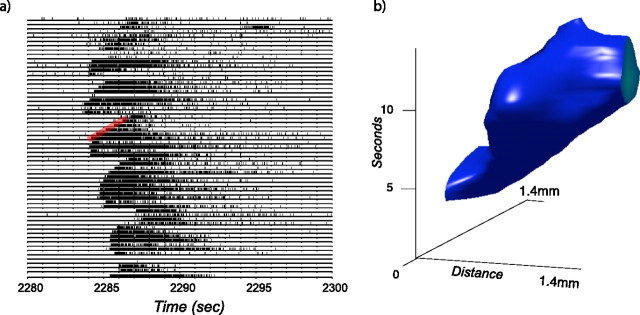
The highlighted larger wave event in the middle of Figure 2 (top left) is shown at a finer timescale in Figure 3a. From this plot, one can estimate the speed of the wave front from the beginning of the bursts on neighboring electrodes. For this segment of data, these waves appear to travel between 300 and 500 μm/s. Note that the speed and direction of the wave is temporally and spatially dependent. To better visualize this dependence, we represented the data as a volume V(x,y,t), where x and y represent the spatial location of the unit binned in 200 μm bins, t is time binned in 100 ms bins, and the value V(x,y,t) is the response of the unit normalized to its maximum firing rate. It is then possible to find the isosurfaces with the same relative rate. An example of such a wave event is shown in Figure 3b for the event of Figure 3a. Additional figures can be found in the supplemental data (available at www.jneurosci.org as supplemental material). If cells burst for a fixed duration, and the beginning of the bursts could be described as a uniform wave traveling at a constant speed, one would see a planar region of constant thickness in such a plot. Here we see quite a different behavior: the wave front has different velocities at different spatial locations, and the duration of the activity is different for different spatial locations. For the E60 retina, many of the waves appeared to have a larger spatial extent than the underlying recording array.
Figure 3.
Detail of an E60 retinal wave. a, The 20 s segment of the highlighted region of the raster plot in Figure 2 is expanded here to show the propagation of the wave front in more detail. The red reference line shows the expected slope for a wave front traveling at 400 μm/s. b, To better visualize the spatial relationships of the spike trains in a, we represent the data as a volume where the x- and y-axes encode the spatial position of the cells on the array, and the z-axis encodes the time a cell fires a spike. We then plot the iso-rate surface corresponding to 25% of the maximal firing rate of the cells in this volume. Note that the speed and duration of the wave is quite variable across the array.
At age E60, cells tended to either burst with an average burst length of 5.9 s (min, 2.7 s; max, 12.6 s) or remain silent with an average interburst interval of 120 s (min, 57 s; max, 393 s). However, a mixture of wave-like activity and increasing amounts of background activity characterized retinas older than E60. Figure 2 shows 10 min of recordings at four different ages. Note that wave-like activity dominates the recordings at E60, but, by E76, most of the activity appears to be only weakly correlated. At age E67, the average firing rate for all 41 cells was 0.20 Hz (min, 0.01; max, 0.69), and the average burst length was 4.5 s (min, 1.1 s; max, 14.1 s). The distribution of burst lengths appeared to be bimodal, with one group of cells having burst lengths of 5 s or less, and the other having durations of 10 s or more, perhaps indicating a differentiation of cell types. The average interburst interval was found to be 225 s (min, 72 s; max, 494 s), and, within the entire 2 mm2 area of retina, we observed on average one wave every 143 s.
By age E71, a greater variety of spontaneous background (nonwave-like) activity was evident (Fig. 2). Approximately 12% (3 of 26 cells) exhibited Poisson-like activity and did not appear to participate in wave events, whereas an additional 12% of the cells exhibited both high background firing and participated in wave events. The average firing rate for all 26 cells was 0.25 Hz (min, 0.02; max, 1.43). Leaving out the Poisson-like cells, the average burst length was 2.1 s (min, 1.2 s; max, 3.1 s), and the average interburst interval was found to be 325 s (min, 136 s; max, 650 s). Over the entire area of the array, we observed on average one wave every 222 s.
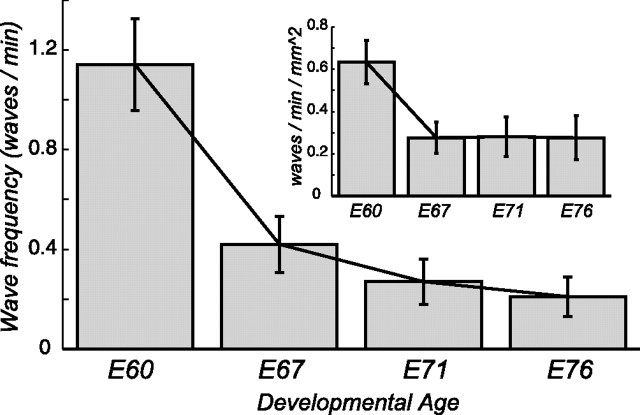
By age E76, the association of the burst statistics with the wave events was nearly absent because the background activity of the cells increased (including cells that burst outside wave events), and the wave event rate declined. Nevertheless, the average burst length was 2.9 s (min, 1.1 s; max, 7.6 s), and the average interburst interval was found to be 282 s (min, 24 s; max, 828 s). The average firing rate for all 21 cells was 0.26 Hz (min, 0.03; max, 0.89). Over the entire array, we observed on average one wave every 286 s. Overall, the rate of wave events decreased by approximately a factor of 2 from age E60 to age E76 (Fig. 4). A summary of these statistics is given in Table 1.
Figure 4.
Dependence of wave frequency with developmental age. The number of waves per minute observed over the array decreases from age E60 to age E76. Inset, Same data normalized by the number of active electrodes to control for possible sampling bias. Each electrode is assumed to sample from a 200 × 200 μm area. Error bars are calculated from ±sqrt(number of wave events).
Table 1.
Summary of wave properties for four developmental ages
| E60 | E67 | E71 | E76 | |
|---|---|---|---|---|
| Burst length (s) | 5.9 | 4.5 | 2.1 | 2.9 |
| Burst interval (s) | 120 | 225 | 325 | 282 |
| Wave interval (s) | 52 | 143 | 222 | 286 |
| Firing rate (Hz) | NA | 0.20 | 0.25 | 0.26 |
Over this period, there is a decrease in the rate at which retinal waves occur. Note that, although most cells burst during a retinal wave, the interburst interval and the interwave interval are different values because multiple wave domains can be active in the retinal region being recorded. The firing rate for the E60 recording is not included here because the recording is multiunit. Wave properties are defined in Materials and Methods. NA, Not applicable.
Correlation analysis
An individual retinal wave defines a domain in which ganglion cells fire in a coordinated manner. These domains typically remain refractory for periods of 1–2 min. After this refractory period, subsequent waves may enter the domain such that, over time, the entire retina is tiled by this correlated activity (Feller et al., 1996). As a result, cell pairs within this critical distance will be correlated, and cell pairs that are well separated will be less correlated because they participate in separate wave events. To quantify this, we calculated the cross-correlation functions for the cells isolated in these recordings and summarized them with a CI. The CI measures how more likely a pair of cells fires together within a particular time window than by chance. For example, a CI of 20 means that the pair of cells are 20 times more likely to fire together than by chance; a CI of 1 means that they are just as likely to fire together as a pair of independent cells. A CI of <1 means that they tend not fire together.
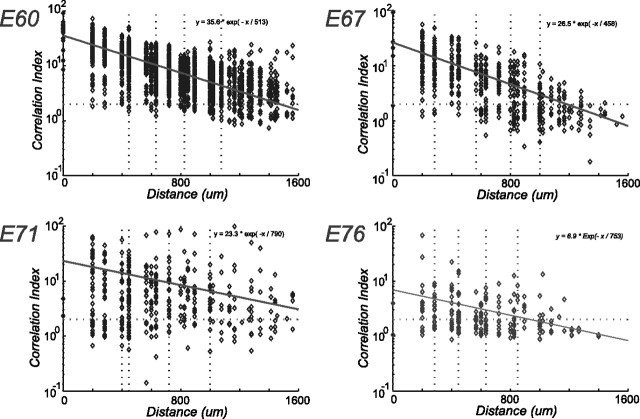
For every pair of cells at a given developmental age, the correlation index was computed as described in Materials and Methods and plotted logarithmically against the estimated intercell distance in Figure 5. The number of cell pairs analyzed at ages E60, E67, E71, and E76 were 1830, 820, 325, and 210, respectively. The red trend line through the data points is a fit of an exponential CI = Ae−x/L, where A is defined as the maximal correlation index, and L is the correlation length in micrometers. The location of the cell on the array was assigned the position of the electrode on which it was recorded. Because the interelectrode spacing was large in these recordings (∼200 μm), the signal of a given cell only appears on one electrode, and the location cannot be triangulated using the signals from neighboring electrodes. As a result, one can see clustering around particular intercell distances constrained by the electrode array geometry. An intercell distance of zero means that two or more cells are identified on a single electrode.
Figure 5.
Spatial dependence of the correlation index with developmental age. For each age, a scatter plot of the correlation index versus intercell distance for all cell pairs is shown together with an exponential fit of the data (trend line). The parameters of these fits are shown in the top right of each plot. The vertical dotted lines denote the quintile boundaries. Although there is a clear trend of decreasing correlation index with intercell distance, there is a wide distribution of values at any given intercell distance.
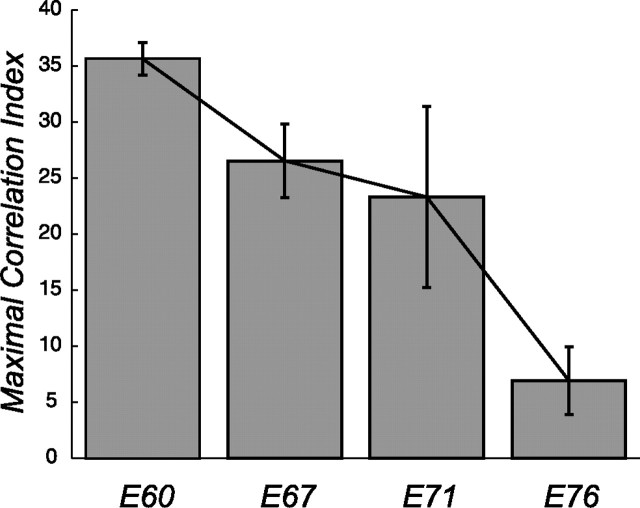
The maximal correlation index (Fig. 5, the y-intercept for the exponential trend lines) is an indication of the degree of correlation between cell pairs. Figure 6 plots this maximal correlation index against developmental age. The error bars represent the 95% confidence limits on the intercept of the exponential fit (see Materials and Methods). Over this 2 week period, the strength of ganglion cell correlations appears to decrease by approximately a factor of 3. Note that there also is a trend of increasing correlation length L during this same developmental period.
Figure 6.
Dependence of the maximal correlation index with developmental age. The y-intercepts (maximum correlation index) from the scatted plots of Figure 5 are a measure of the strength of the overall correlated firing in the recording. The maximum correlation index is plotted for each age together with the 95% confidence limits obtained from the exponential fit. The degree of correlated firing decreases steadily over the ∼2 week period from E60 to E76.
Frequency analysis
High-frequency bursts synchronized across neighboring ganglion cells have been reported to correlate with eye-specific segregation and high levels of asynchronous spikes not to inhibit the segregation process (Torborg et al., 2005). These authors measured the percentage of time that a cell fired above two specific rates: 1 and 10 Hz. They proposed that bursts of high-frequency action potentials at or above 10 Hz could be the essential factor for driving eye-specific segregation. Here, we provide a version of this analysis by transforming the standard interspike interval histogram into a plot of percentage of time spent firing above a particular rate. Such a plot allows one to see the trends leading up to these two frequencies.
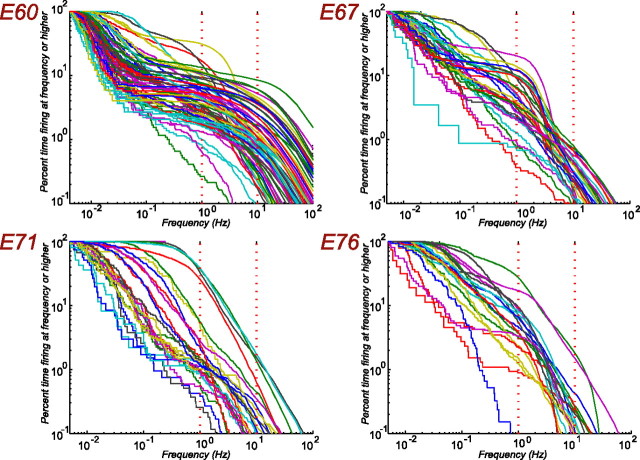
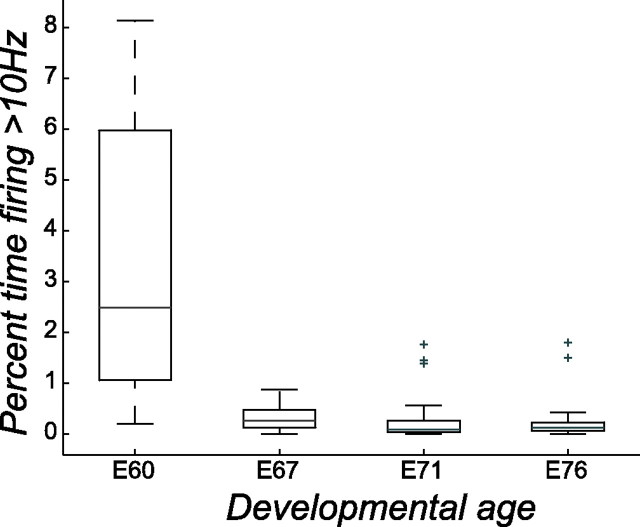
The percentage of time a cell spends firing at a particular frequency or above is plotted in Figure 7 for each developmental age. At E60, there is a distinctive S-shape to the curves attributable to the tendency of the cell to either fire a burst as part of a wave or be completely silent. On average, these cells spend 3.4% of their time firing at 10 Hz or above. One week later, at age E67, there is a mixture of cells that fire only in bursts and others that have more regular “background” activity, perhaps suggesting a differentiation of cell types at this age. On average, the E67 cells spend an order of magnitude less time (0.33%) firing at 10 Hz or above than their E60 counterparts. As shown in Figure 8, this trend continued at older ages, with cells at E71 and E76 firing less often at 10 Hz or above.
Figure 7.
Distribution of cells firing at a particular rate or higher. For each developmental age, the percentage of time firing at a given frequency or higher is plotted as a function of firing frequency. Each curve within a plot is a different cell. The red dotted vertical reference lines are for 1 and 10 Hz firing frequencies. Note that the distinctive plateaus seen in the E60 plot are attributable to the long silent intervals between bursts attributable to a wave.
Figure 8.
Percentage of time firing at 10 Hz or higher as a function of developmental age. For each age in Figure 7, the distribution of times spent firing at 10 Hz or above is plotted as a box plot. The box has lines at the lower quartile, median, and upper quartile values. The whiskers are lines extending from each end of the box to show the extent of the rest of the data. Outliers (+) are data with values beyond the ends of the whiskers. Median values for E60, E67, E71, and E76 are 2.5, 0.3, 0.1, and 0.1%, respectively.
Discussion
In the present study, we used multielectrode recordings to characterize the spatiotemporal properties of spontaneous activity in the fetal macaque retina. We find that such activity is generated remarkably early during prenatal development and that it undergoes pronounced and rapid changes during a relatively brief period of gestation. Before discussing the implications of our results, we note three important caveats to the findings described here. First, we assume that recordings from the isolated retina provide a valid account of the events that ordinarily occur in the intact animal. This assumption is common to all studies involving recordings from the isolated retina, and, although it would be preferable to perform multielectrode recordings from fetal macaque retinas in vivo, at present this is not technically feasible. However, the few studies that have recorded spontaneous activity in vivo in other species (Galli and Maffei, 1988; Maffei and Galli-Resta, 1990; Weliky and Katz, 1999) reveal that the activity is similar to what is observed in vitro. Second, for technical reasons (noted in Materials and Methods), our recordings were confined to a retinal segment between the optic nerve head and the temporal periphery, so we are unable to assess the possibility of regional differences in activity as a function of nasal versus temporal position. Moreover, at the ages studied here, the fetal macaque retina is structurally quite homogenous at all retinal eccentricities (supplemental data, available at www.jneurosci.org as supplemental material). Third, the results we describe are based on a limited number of animals. Timed-pregnant macaque monkeys are a rare commodity, and it is common for work on this species to use relatively few specimens.
Spontaneous discharges were first observed at E51, the youngest retina studied. At this age, and at E55, spikes were exceedingly rare with no indication of any clear spatial or temporal order. Only a few cells fired at very low frequencies (less than once per minute), so with the exception of these occasional discharges, at these early ages the monkey retina appears to be essentially silent. To put the results of these early retinal recordings in a broader context, the initial contingent of retinal ganglion cell axons innervates the dlgn at E48, and the early divergence of magnocellular and parvocellular retinogeniculate pathways commences at E53 (Meissirel et al., 1997). Thus, retinal activity is unlikely to play a role in the targeting of the dlgn by retinal axons or the initial segregation of M and P retino-dlgn pathways.
By E60, the fetal monkey retina exhibits a markedly different functional landscape. At this age, periodic bursts of spatially and temporally correlated action potentials are clearly present. Such activity appears reminiscent of the retinal waves that have been documented in the postnatal ferret (Meister et al., 1991; Wong et al., 1993; Feller et al., 1996) and mouse (Demas et al., 2003). Subsequently, the spatial properties of retinal discharges undergo pronounced and rapid changes from E60 to E76, indicated by the progressive drop in the incidence of waves and the associated correlation index values. After E60, there was also a progressive increase in spontaneous discharges during the interwave intervals. This was particularly notable at E76 in which the overall level of background activity virtually eclipsed the few waves that did occur.
Another marked developmental change we observed was in maximum firing frequency. At E60, cells tended to fire in a coherent manner, and the percentage of time firing above 10 Hz was the highest of all the ages we studied. With maturation, the firing patterns of different cells tended to become more heterogeneous, and there was a general decline in the time spent firing at high frequencies. At all ages, we found that only a small percentage of cells firing at a rate of 10 Hz or higher. Thus, at E60, only 2.5% of the discharges were at 10 Hz or higher, and, at the older fetal ages, firing rates at 10 Hz or higher were exceeding rare, <1% of the recordings. These results should be compared with the recent suggestion based on studies of the mouse retina that retinal discharge rates at or above 10 Hz are essential for the refinement of eye-specific retinogeniculate projections (Torborg et al., 2005).
The time period during which eye-specific retinogeniculate projections are formed in the fetal monkey has been documented recently using modern axonal tracing methods (Huberman et al., 2005a). This allows one to compare the temporal correspondence between the functional changes in retinal discharge patterns documented in the present study with the segregation of left- and right-eye inputs in the prenatal monkey. In the ferret and mouse, the gradual separation of initially intermingled binocular projections in the dlgn occurs during the same developmental period when retinal waves of activity are present (Linden et al., 1981; Godement et al., 1984; Wong et al., 1993; Demas et al., 2003). Indeed, such temporal correspondence provided the major impetus for the prevalent notion that, early in development, retinal waves of activity instruct the formation of eye-specific retinogeniculate projections (Penn et al., 1998).
The results of the present study indicate that retinal waves emerge in the fetal monkey by E60, which is >1 week before projections from the two eyes begin to segregate in the dlgn (Huberman et al., 2005a). During the developmental period when eye-specific inputs segregate (from E69 to E84), retinal waves decrease markedly in occurrence, becoming progressively less frequent with a concomitant increase in interwave activity. In contrast, in mouse (Demas et al., 2003; Torborg et al., 2005) and ferret (Meister et al., 1991; Wong et al., 1993; Feller et al., 1996), wave activity is robust throughout the period when segregated left- and right-eye retinogeniculate projections form, with such activity becoming progressively less frequent once eye-specific connections are established. Nevertheless, our results certainly do not rule out the possibility that retinal activity influences the formation of eye-specific projections to the fetal macaque dlgn. To address this issue, future studies will require manipulations of the patterns of correlated retinal activity in the intact fetal macaque during the period when eye-specific segregation occurs, as was done previously in the developing ferret (Huberman et al., 2003).
In this context, it is pertinent to note that, based on the remarkable mirror symmetry of ocular dominance columns in the two cortical hemispheres of individual monkeys, Adams and Horton (2003) have argued that retinal waves are unlikely to be responsible for patterning of ocular dominance columns in primates. They point out that, to accomplish this, waves in the two eyes would have to be coordinated so as to occur simultaneously at mirror-symmetric locations in the nasal hemi-retina of one eye and temporal hemi-retina of the other eye. This clearly never occurs: in all species examined, waves emerge and propagate in essentially random manner, their spatial domain constrained only by the activation history of a given retinal region (Feller et al., 1996; Demas et al., 2003; present data).
There is now evidence that, in binocular animals, graded expression of axon guidance cues such as ephrin-As can induce retinotopy and eye-specific circuitry in the dlgn (Huberman et al., 2005b; Lambot et al., 2005; Pfeiffenberger et al., 2005). It remains for future studies to determine the role of axon guidance cues in the development of primate retinogeniculate pathways. Our results suggest that such cues contribute to the development of segregated M versus P retinogeniculate pathways because these are formed at an early stage of development when the fetal macaque retina is essentially electrically silent. Also, M versus P retinogeniculate pathways emerge through directed ingrowth of ganglion cell axons into separate domains in the dlgn rather than refinement of initially imprecise projections (Meissirel et al., 1997). The results documented here offer the possibility that putative eye-specific cues in the prenatal monkey may be subject to regulation by the retinal waves of activity.
Footnotes
A. D. Huberman's present address: Department of Neurobiology, Stanford University School of Medicine, Stanford. CA 94305. E-mail: adh1@stanford.edu.
This work was supported by National Eye Institute Grant EY016182 and Core Grant P20 MH6095 and Research to Prevent Blindness. We thank Deborah van der List for excellent technical support and Dr. G. Y. Wang for his assistance.
References
- Adams DL, Horton JC (2003). Capricious expression of cortical columns in the primate brain. Nat Neurosci 6:113–114. [DOI] [PubMed] [Google Scholar]
- Bodnarenko SR, Chalupa LM (1993). Stratification of ON and OFF ganglion cell dendrites depends on glutamate-mediated afferent activity in the developing retina. Nature 364:144–146. [DOI] [PubMed] [Google Scholar]
- Borodinsky LN, Root CM, Cronin JA, Sann SB, Gu X, Spitzer NC (2004). Activity-dependent homeostatic specification of transmitter expression in embryonic neurons. Nature 429:523–530. [DOI] [PubMed] [Google Scholar]
- Cook PM, Prusky G, Ramoa AS (1999). The role of spontaneous retinal activity before eye opening in the maturation of form and function in the retinogeniculate pathway of the ferret. Vis Neurosci 16:491–501. [DOI] [PubMed] [Google Scholar]
- Demas J, Eglen SJ, Wong RO (2003). Developmental loss of synchronous spontaneous activity in the mouse retina is independent of visual experience. J Neurosci 23:2851–2860. [DOI] [PMC free article] [PubMed] [Google Scholar]
- Feller MB (1999). Spontaneous correlated activity in developing neural circuits. Neuron 22:653–656. [DOI] [PubMed] [Google Scholar]
- Feller MB, Wellis DP, Stellwagen D, Werblin FS, Shatz CJ (1996). Requirement for cholinergic synaptic transmission in the propagation of spontaneous retinal waves. Science 272:1182–1187. [DOI] [PubMed] [Google Scholar]
- Galli L, Maffei L (1988). Spontaneous impulse activity of rat retinal ganglion cells in prenatal life. Science 242:90–91. [DOI] [PubMed] [Google Scholar]
- Godement P, Salaun J, Imbert M (1984). Prenatal and postnatal development of retinogeniculate and retinocollicular projections in the mouse. J Comp Neurol 230:552–575. [DOI] [PubMed] [Google Scholar]
- Goldberg JL, Espinosa JS, Xu Y, Davidson N, Kovacs GT, Barres BA (2002). Retinal ganglion cells do not extend axons by default: promotion by neurotrophic signaling and electrical activity. Neuron 33:689–702. [DOI] [PubMed] [Google Scholar]
- Grubb MS, Thompson ID (2004). The influence of early experience on the development of sensory systems. Curr Opin Neurobiol 14:503–512. [DOI] [PubMed] [Google Scholar]
- Hanson MG, Landmesser LT (2004). Normal patterns of spontaneous activity are required for correct motor axon guidance and the expression of specific guidance molecules. Neuron 43:687–701. [DOI] [PubMed] [Google Scholar]
- Huberman AD, Stellwagen D, Chapman B (2002). Decoupling eye-specific segregation from lamination in the lateral geniculate nucleus. J Neurosci 22:9419–9429. [DOI] [PMC free article] [PubMed] [Google Scholar]
- Huberman AD, Wang GY, Liets LC, Collins OA, Chapman B, Chalupa LM (2003). Eye-specific retinogeniculate segregation independent of normal neuronal activity. Science 300:994–998. [DOI] [PMC free article] [PubMed] [Google Scholar]
- Huberman AD, Dehay C, Berland M, Chalupa LM, Kennedy H (2005a). Early and rapid targeting of eye-specific axonal projections to the lateral geniculate nucleus in the fetal macaque. J Neurosci 25:4014–4023. [DOI] [PMC free article] [PubMed] [Google Scholar]
- Huberman AD, Murray KD, Warland DK, Feldheim DA, Chapman B (2005b). Ephrin-As mediate targeting of eye-specific projections to the lateral geniculate nucleus. Nat Neurosci 8:1013–1021. [DOI] [PMC free article] [PubMed] [Google Scholar]
- Lambot MA, Depasse F, Noel JC, Vanderhaeghen P (2005). Mapping labels in the human developing visual system and the evolution of binocular vision. J Neurosci 25:7232–7237. [DOI] [PMC free article] [PubMed] [Google Scholar]
- Linden DC, Guillery RW, Cucchiaro J (1981). The dorsal lateral geniculate nucleus of the normal ferret and its postnatal development. J Comp Neurol 203:189–211. [DOI] [PubMed] [Google Scholar]
- Maffei L, Galli-Resta L (1990). Correlation in the discharges of neighboring rat retinal ganglion cells during prenatal life. Proc Natl Acad Sci USA 87:2861–2864. [DOI] [PMC free article] [PubMed] [Google Scholar]
- Meissirel C, Wikler KC, Chalupa LM, Rakic P (1997). Early divergence of magocellular and parvocellular functional subdivisions in the embryonic primate visual system. Proc Natl Acad Sci USA 94:5900–5905. [DOI] [PMC free article] [PubMed] [Google Scholar]
- Meister M, Wong RO, Baylor DA, Shatz CJ (1991). Synchronous bursts of action potentials in ganglion cells of the developing mammalian retina. Science 252:939–943. [DOI] [PubMed] [Google Scholar]
- Misgeld T, Burgess RW, Lewis RM, Cunningham JM, Lichtman JW, Sanes JR (2002). Roles of neurotransmitter in synapse formation: development of neuromuscular junctions lacking choline acetyltransferase. Neuron 36:635–648. [DOI] [PubMed] [Google Scholar]
- Penn AA, Riquelme PA, Feller MB, Shatz CJ (1998). Competition in retinogeniculate patterning driven by spontaneous activity. Science 279:2108–2112. [DOI] [PubMed] [Google Scholar]
- Pfeiffenberger C, Cutforth T, Woods G, Yamada J, Rentería RC, Copenhagen DR, Flanagan JG, Feldheim DA (2005). Ephrin-As and neural activity are required for eye-specific patterning during retinogeniculate mapping. Nat Neurosci 8:1022–1027. [DOI] [PMC free article] [PubMed] [Google Scholar]
- Rakic P (1976). Prenatal genesis of connections subserving ocular dominance in the rhesus monkey. Nature 261:467–471. [DOI] [PubMed] [Google Scholar]
- Shoham S, Fellows MR, Normann RA (2003). Robust, automatic spike sorting using mixtures of multivariate t-distributions. J Neurosci Methods 127:111–122. [DOI] [PubMed] [Google Scholar]
- Sretavan DW, Shatz CJ, Stryker MP (1988). Modification of retinal ganglion cell axon morphology by prenatal infusion of tetrodotoxin. Nature 336:468–471. [DOI] [PubMed] [Google Scholar]
- Torborg CL, Hanson KA, Feller MB (2005). High frequency, synchronized bursting drives eye-specific segregation of retinogeniculate axons. Nat Neurosci 8:72–78. [DOI] [PMC free article] [PubMed] [Google Scholar]
- Weissman TA, Riquelme PA, Ivic L, Flint AC, Kriegstein AR (2004). Calcium waves propagate through radial glial cells and modulate proliferation in the developing neocortex. Neuron 43:647–661. [DOI] [PubMed] [Google Scholar]
- Weliky M, Katz LC (1999). Correlational structure of spontaneous neuronal activity in the developing lateral geniculate nucleus in vivo. Science 285:599–604. [DOI] [PubMed] [Google Scholar]
- Wong RO, Meister M, Shatz CJ (1993). Transient period of correlated bursting activity during development of the mammalian retina. Neuron 11:923–938. [DOI] [PubMed] [Google Scholar]
- Wong RO (1999). Retinal waves and visual system development. Annu Rev Neurosci 22:29–47. [DOI] [PubMed] [Google Scholar]


