

Abstract
Cerebral amyloid angiopathy (CAA), the deposition of cerebrovascular β-amyloid (Aβ) in the walls of arterial vessels, has been implicated in hemorrhagic stroke and is present in most cases of Alzheimer disease. Previous studies of the progression of CAA in humans and animal models have been limited to the comparison of pathological tissue from different brains at single time points. Our objective was to visualize in real time the initiation and progression of CAA in Tg2576 mice by multiphoton microscopy through cranial windows. Affected vessels were labeled by methoxy-X04, a fluorescent dye that selectively binds cerebrovascular β-amyloid and plaques. With serial imaging sessions spaced at weekly intervals, we were able to observe the earliest appearance of CAA in leptomeningeal arteries as multifocal deposits of band-like Aβ. Over subsequent imaging sessions, we were able to identify growth of these deposits (propagation), as well as appearance of new bands (additional initiation events). Statistical modeling of the data suggested that as the extent of CAA progressed in this vascular bed, there was increased prevalence of propagation over initiation. During the early phases of CAA development, the overall pathology burden progressed at a rate of 0.35% of total available vessel area per day (95% confidence interval, 0.3–0.4%). The consistent rate of disease progression implies that this model is amenable to investigations of therapeutic interventions.
Keywords: amyloid-β, Alzheimer, vascular, angiopathy, mouse, transgenic
Introduction
There is increasing recognition of cerebrovascular disease as a contributing factor to cognitive impairment and dementia (O'Brien et al., 2003; Greenberg et al., 2004). Cerebral amyloid angiopathy (CAA) is the deposition of β-amyloid peptide (Aβ) in cerebral arteries (and not veins), eventually resulting in smooth muscle cell death (Mandybur, 1975; Vinters, 1987; Vonsattel et al., 1991). CAA is often found in the presence of lobar hemorrhages and cerebral infarcts and is believed to play a causative role in these lesions in many people (Okazaki et al., 1979; Mandybur, 1986; Olichney et al., 1995; Cadavid et al., 2000). Aβ, which is cleaved from the amyloid precursor protein (APP) and ranges from 39 to 43 amino acids long, is also a key component of the senile plaques characteristic of Alzheimer disease (AD). CAA may occur without evidence of AD, although it is more often associated with AD (Yamada, 2002). There is no method for visualizing CAA in humans in vivo and therefore little opportunity for understanding when or how CAA pathology develops. As new imaging agents are developed based on ability to bind Aβ in the brain (Klunk et al., 2004), it may become possible to have a presymptomatic measure of CAA pathology.
In the past decade, transgenic mouse models of brain Aβ deposition have played an important role in the understanding of AD. Through the overexpression of forms of APP carrying AD- or CAA-linked mutations, sometimes in combination with mutations in presenilin-1, these animals generate high levels of Aβ peptides. These animals develop Aβ deposits in the form of plaques and represent a model of one component of the neuropathology of AD (Games et al., 1995; Hsiao et al., 1996). In addition, many of these models develop CAA (Calhoun et al., 1999; Van Dorpe et al., 2000; Christie et al., 2001a; Kimchi et al., 2001). As with the human disease, these murine models of CAA are age dependent (Domnitz et al., 2005), and the accumulation of Aβ has deleterious effects including impaired reactivity (Iadecola et al., 1999; Niwa et al., 2000; Christie et al., 2001a), microhemorrhages (Winkler et al., 2001; Fryer et al., 2003), and loss of smooth muscle cells (Van Dorpe et al., 2000; Christie et al., 2001a; Winkler et al., 2001).
Although most previous studies of CAA in murine models have focused on examination of histologic sections, that approach obscures the spatial relationship between different sites of Aβ deposition along the length of an individual vessel and the temporal progression of Aβ deposition over time. We recently began to address these issues through a study of fixed intact whole brains from transgenic mice, finding a consistent and stereotyped age-dependent spatial distribution of CAA (Domnitz et al., 2005). The data presented below extend this mapping of the spatial and temporal progression of CAA through serial observations over several weeks of individual leptomeningeal arterial segments in living transgenic mice. By demonstrating that the rate of progression is a consistent feature in this mouse model, we establish it as a useful system in which to assess candidate treatments intended to prevent growth or promote clearance of Aβ deposits. With this method, we are also able to demonstrate that continued CAA progression occurs primarily through propagation of existing deposits, rather than through initiation of new deposits. This is a distinct pattern of kinetics, which is different from that describing accumulation of Aβ deposits in the form of plaques in these animals.
Materials and Methods
Animals and imaging methods. Tg2576 mice (Hsiao et al., 1996) between the ages of 8 and 16 months (n = 12) had permanent cranial windows placed for serial in vivo imaging by multiphoton microscopy, with some modifications from previously described approaches (Lombardo et al., 2003). After anesthesia was induced by Avertin (tribromoethanol) or isoflurane, the scalp was removed, and a 6 mm craniotomy was performed. The dura was left intact to minimize potential alterations of leptomeningeal vascular dynamics, and the craniotomy site was then covered with a glass coverslip attached with dental cement. This cranial window provided optical access to the underlying region of brain. Windows remained intact for many weeks, allowing repeated imaging sessions at weekly intervals.
Mice were imaged immediately after surgery and weekly thereafter. Aβ was visualized with methoxy-X04, a Congo red derivative that binds fibrillar Aβ, administered via intraperitoneal injection the day before each imaging session (Klunk et al., 2002). A Bio-Rad (Hercules, CA) 1024 MP microscope was used with a Ti:sapphire laser (Mai Tai; Spectra Physics, Mountain View, CA) at 750 nm for excitation. External photodetectors (Hamamatsu Photonics, Hamamatsu City, Japan) collected the blue fluorescent signal from bound methoxy-X04. Several 615.8 μm2 fields along leptomeningeal cerebral arteries were imaged at 20× magnification (numerical aperture, 0.95; Olympus UMPlanFl; Olympus, Melville, NY) to a depth of ∼200 μmin 5 μm steps. Maximum intensity projections of z-series were obtained using NIH ImageJ. All animal studies were approved by the Institutional Subcommittee on Research Animal Care.
Analysis of serial imaging results. Quantitative analysis of images was performed using ImageJ, Adobe Photoshop 7.0 (Adobe Systems, San Jose, CA), and AutoDeblur 9.3 software packages. Autofluorescent signal from the dura was removed by deleting the uppermost slices of the z-series. CAA-affected vessels were then outlined and isolated from the background field, which was colored black. CAA deposits appeared as bright areas circumferential to the vessel. The outlined vessels were manually thresholded so that CAA-positive regions were set white and CAA-negative regions were set black. The number of white pixels was then counted using a noise reduction algorithm that counted only the number of pixels in white clusters composed of more than six contiguous pixels. The total number of pixels in the area of the vessel outline was also counted. The CAA burden was calculated as the percentage of the vessel area affected by CAA. The inter-rater reliability of this method was assessed by independent determinations of CAA burden on 30 fields and was found to be very high (intraclass correlation coefficient, 0.95). The vessel area from the initial imaging session was used for calculation of CAA burden because of the tendency for vessels to dilate in subsequent weeks. Additionally, vessel diameter was measured in ImageJ at three points along each vessel segment at each time point. The average diameter of each was taken from these three measurements.
New growth of CAA deposits was classified as occurring by either initiation or propagation. To determine how deposition occurred in serially imaged vessel segments, images from consecutive weeks were aligned in AutoDeblur 9.3 with minimal warping. Color overlays of the aligned images showed distinct areas of initiation where new growth was separated by at least one pixel from old deposits. The amount of growth by initiation was quantified by counting the number of pixels in these initiated deposits. Growth by propagation was taken as the difference between total new growth and growth by initiation.
Statistical analysis. To assess the nature of disease progression, we considered various mixed-effects models of CAA burden as a function of time. We adjusted for correlation within mice and within vessel segments through inclusion of random effects for mice and segments in the linear model. In this modeling process, variability was assumed to originate on the basis of mouse-to-mouse variation (interanimal variation) as well as be influenced by location in the vascular tree (intra-animal variation), as suggested in previous studies (Domnitz et al., 2005). In practice, this amounts to allowing for mouse-specific and vessel segment-specific intercepts in the linear model. We also analyzed the effects of gender and vessel segment diameter. We assessed goodness-of-fit of the models through examination of histograms of the residuals and selected the linear model as the best fitting model that best conforms to the normality assumptions of the mixed effects regression. To assess the relationship between propagation and initiation with respect to CAA progression, we modeled the log odds of percentage propagation as a linear function of time. Sparseness of the data precluded use of a mixed-effects model to account for potential correlation within vessel segment and within mouse.
Results
The placement of cranial windows onto the skulls of Tg2576 mice allowed us to observe the increasing burden of CAA in individual arterial segments with weekly in vivo imaging sessions over 2–7 weeks. Although some animals died during subsequent anesthesia exposures (a complication that was minimized with the introduction of isoflurane inhalation anesthesia), most mice could be imaged until tissue growth between the dura and the coverslip made it no longer possible to visualize the brain through the cranial window.
Our previous studies of the time course of leptomeningeal CAA in Tg2576 mice (Domnitz et al., 2005) indicated that CAA deposition typically begins by 9 months of age. We therefore began our observations with mice between 8 and 11 months of age. All mice of this age (n = 6) displayed CAA growth in leptomeningeal arteries in the weeks after the initial imaging session (Fig. 1A,B). Similar changes were evident in older mice aged 12–16 months (n = 6), with the additional observation that the rate of deposition slowed as the overall CAA burden in the vessel segments under study increased (Fig. 1C). No convincing evidence of naturally occurring clearance of Aβ from CAA-affected arterial segments was observed. Although Aβ plaques were not the focus of these studies, plaque formation was noted in animals under study here; as has been reported previously, plaques were stable once formed (Christie et al., 2001b). Progression of CAA over specific arterial segments was also well demonstrated with the generation of time lapse movies from serial images.
Figure 1.
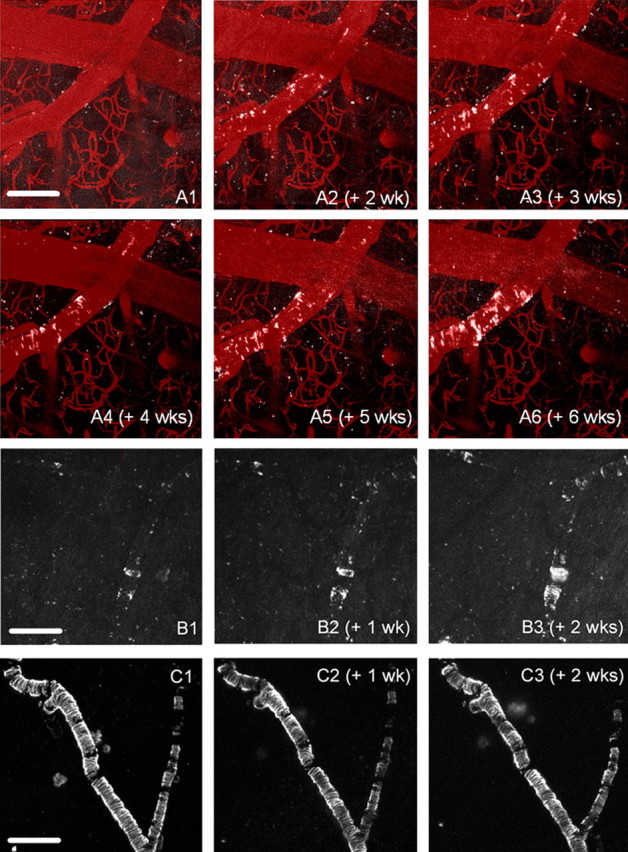
Serial in vivo imaging reveals progression of vascular amyloid pathology. Three representative sets of images that demonstrate the kinetics of amyloid deposition are shown. A1–A6, A Tg2576 mouse (starting at 10.3 months of age) was imaged with multiphoton microscopy, using systemically administered methoxy-XO4 to label all of the congophilic amyloid deposits (white pseudocolor). An angiogram was imaged at the first session using Texas Red dextran (70 kDa) injected in a tail vein and overlaid with each session (red pseudocolor) to delineate the vasculature. No amyloid deposits were detected in the first imaging session (A1), but new deposits were initiated within 2 weeks (A2). Subsequent growth (A3–A6) occurs mostly through propagation from these deposits. B1–B3, Serial imaging of a 9.7-month-old mouse revealed growth by propagation from existing nodes of CAA, as well as the appearance of a plaque underneath the CAA-affected vessel in the third week. C1–C3, An older (16-month-old) mouse was imaged over a 3 week period. No discernable growth of CAA was seen in these severely affected vessels. Scale bars: (in A1) A1–A6, 100 μm; (in B1) B1–B3, 200 μm; (in C1) C1–C3, 200 μm.
To rule out the effects of cranial window implantation on the kinetics of amyloid deposition, we examined the intact, postmortem brains after serial in vivo imaging. Figure 2 shows a representative example from a 15-month-old mouse after 6 weeks of chronic imaging after staining the entire brain with thioflavin S and imaging with multiphoton microscopy. An 8 mm circle indicates the position of the cranial window. No obvious qualitative differences were observed inside versus outside of the window. Quantitative analysis of CAA burden also revealed no differences in affected vessels in 12-month-old (37.2 ± 4.96 vs 39.3% ± 3.48; n = 21 vessel segments, 4 mice; mean ± SE; p = 0.397) or 15-month-old (57.6 ± 3.08 vs 62.2% ± 4.49; n = 18 vessel segments, 4 mice; mean ± SE; p = 0.726) animals in diameter-matched vessels. We also examined the possible influence of both brain trauma caused by surgery or repeated injections of the amyloid labeling contrast agent methoxy-XO4 on amyloid deposition kinetics by comparing the initial rates of CAA progression with final rates of CAA progression within animals during serial imaging sessions. We found that the progression rate after the initial imaging (0.358) was not significantly different from what it was at the initial imaging pair (0.359; p = 0.65). Also, the progression rate 16 or more days after the initial injection of methoxy-XO4 (0.354) was not significantly different from what it was at the initial injection (0.359; p = 0.19). Therefore, the cranial window technique and repeated administration of methoxy-XO4 does not affect the kinetics of CAA progression, and the imaged vessels within the cranial window area are representative of all surface vessels in this mouse model.
Figure 2.

The vessels imaged under the cranial window are representative of the whole brain. This is a representative image of an intact postmortem brain stained with thioflavin S from a 15-month-old mouse used for in vivo imaging. The circle indicates the location of the 8 mm cranial window. There is no difference in the pattern or amount of CAA in vessels inside versus outside the window. Scale bar, 1.2 mm.
To further characterize the progression of CAA, serial images from individual vessel lengths were overlaid digitally to identify new vascular Aβ at each time point (Fig. 3). These color-coded images indicated that most CAA growth occurs by propagation from existing deposits. The percentage of the total growth to occur by propagation as opposed to initiation of new foci of CAA was measured for all vessel segments that could be overlaid with minimal warping (n = 45). Comparisons were made of vessel segments at weekly intervals and quantitative data plotted as a function of the CAA burden on the first week of the pair (Fig. 4). As the severity of CAA increased, the amount of new disease that developed through initiation of new foci of CAA diminished from ∼50 to <10% (p < 0.001 for the increase in log odds of percentage propagation with increasing CAA burden). Neither gender nor vessel segment diameter was significantly predictive of propagation after adjusting for CAA burden.
Figure 3.

Week-by-week progression of CAA. We analyzed the progression of CAA by thresholding, segmenting, and pseudocoloring the image from each time point. A, The segmented areas of CAA in a representative vessel are color-coded for new deposits at each time point and overlaid into a single image. Examples of progression by initiation and propagation are shown. B, A higher-magnification image of a vessel segment showing just two time points (1 week apart, segmented and pseudocolored) is shown. Examples of progression by initiation are circled.
Figure 4.

Quantitative analysis of the mechanism of propagation of CAA. CAA progression between weeks occurs either by initiation of new deposits or propagation from existing deposits. The figure shows the relative percentage of new CAA deposits scored as either initiation or propagation plotted versus initial vascular amyloid burden. Pre-existing CAA burden determines the percentage of growth occurring by each event, with initiation providing initial growth and propagation dominating as burden increases. Error bars represent mean ± SD.
We used our data to plot the kinetics of CAA progression (Fig. 5). Examination of the graphed quantitative data across the full population of mice in this study revealed several characteristics of the process of CAA development and progression. First, the process showed an approximately sigmoid shape, with a “lag” period as the animals reached the threshold age at which CAA first becomes evident (∼8–10 months). Second, the process eventually saturated in mice older than 16 months, in which the CAA burden reached upwards of 75% of available vasculature. Ex vivo images from Tg2576 mice older than 20 months demonstrate near complete involvement of leptomeningeal vessels (Domnitz et al., 2005), so it can be assumed there is a constant, slow increase in CAA burden for animals beyond the maximum age imaged in the current study.
Figure 5.

A linear model describes the progression of CAA in vivo. Trajectories of CAA progression obtained from the in vivo imaging sessions for each vessel segment, for each mouse, were drawn as a function of age in days. Segments from the same mouse are drawn in the same color. Data from vessel segments with large diameters are drawn with thicker lines than segments with small diameters. The straight line drawn through the data depicts the fitted linear regression model with a slope of 0.35%/d.
Despite the suggestion of a sigmoidal or logistic shape to the CAA progression curve, we found that a simple linear mixed-effects model best fit the data and conformed to the normality assumptions over a broad age range (9–16 months of age) (line fit in Fig. 5). When the data were analyzed in this manner, the rate of CAA progression was 0.35% of available area per day (95% confidence interval, 0.3–0.4%), which corresponds to 2.45% per week. The baseline diameter of the vessel segment was independently predictive (p = 0.041), with CAA burden being 5.1% larger for vessel segments with diameters >44.2 μm (the median diameter across all segments). Gender was not significantly predictive of CAA burden. Based on our mixed-effects model that adjusted properly for repeated measurements, we found that gender did not significantly modify either the intercept of CAA burden (i.e., the baseline level) (p = 0.225) or the slope of CAA burden (i.e., the progression rate) (p = 0.213; n = 5 female and 7 male mice).
The observed variability inherent in the animal-by-animal analysis of CAA progression shown in Figure 5 arises from both differences between animals (when each mouse enters into the progressive phase of CAA growth) and differences between vessel segments within animals. Based on our model, the proportion of the overall variability explained by segment-to-segment variation within mice is ∼48%. An additional 35% of the variability is explained by mouse-to-mouse variation, with measurement error or other unmeasured biologic variation accounting for the remaining 17%. Several examples of vessels with negative slopes can be observed in Figure 5, suggesting a natural clearance of CAA over time. However, careful examination of the images suggests that these negative slopes are indicative of the measurement error and not a definitive demonstration of CAA clearance.
Discussion
With this work, we have extended our observations of CAA deposition in a mouse model by continuing to study vascular amyloid in whole-brain surface areas rather than the single vessel profiles seen in histologic sections. The advantage of this approach is the ability to understand progression over long, contiguous vascular segments (up to several millimeters in length). These studies demonstrated that the combination of a stable cranial window for visualization of surface vasculature and methoxy-X04 allows us to follow the progression of CAA in individual vessels in living animals over time.
With serial observation of CAA burden in given vessel segments, we were able to determine that increasing Aβ deposits in arterial walls occurs primarily by propagation from existing deposits, with only the least-affected population of vessels showing an approximately even balance of propagation and new initiation. This finding is consistent with current theories of Aβ aggregation as a seeded process, in which fibril growth occurs at a faster rate than new initiation (Jarrett and Lansbury, 1993; Harper and Lansbury, 1997; Kane et al., 2000; Rochet and Lansbury, 2000). Because our observations were made at weekly intervals, it remains possible that we have slightly overestimated the rate in propagation. This could have occurred if foci of new initiation occurring close to an existing deposit then propagated and reached confluence with the previous deposits during the interval between imaging sessions. These observations are in agreement with the indirect measures from a previous study of histologic sections of human tissue with CAA. It was found that there was increased Aβ40 per affected cortical vessel (rather than increasing numbers of affected vessels) with advancing disease severity (Alonzo et al., 1998), supporting a model of propagation of existing deposits. The data are also consistent with inferences from observation of CAA patterns in transgenic mice of a range of ages (Domnitz et al., 2005). Nonetheless, these kinetics of deposition will allow us to differentiate genetic or pharmacologic interventions that target initiation, propagation, or even clearance.
The relative balance between initiation of new CAA foci and growth by continued propagation should be contrasted with the pattern observed in the same mouse model of Aβ deposition as related to plaque formation. Similar longitudinal imaging studies have shown that plaques appear over a short time interval, assume their “mature” size quickly, and are then stable (Christie et al., 2001b). The increasing burden of Aβ deposition over time represents an increase in number of plaques without an ever-increasing size of individual plaques. Whether there are characteristic features of the blood vessel wall and neuropil that provide the basis for this difference and whether it represents a difference in the composition of these types of deposits or a combination of these factors with others remains to be determined.
CAA is well recognized as a risk factor for lobar hemorrhage in humans (Vinters, 1987; Vonsattel et al., 1991) and can also lead to hemorrhages in mouse models of Aβ deposition, including the Tg2576 model (Winkler et al., 2001, 2002; Pfeifer et al., 2002; Lee et al., 2003, 2005). We did not observe evidence of hemorrhage in the animals examined in this study, however. Most of the animals examined here were younger than those more likely to develop spontaneous hemorrhages. Additionally, these experiments focused on the leptomeningeal vessels, and it remains possible that small hemorrhages were present within these brains, although there was no external evidence of this.
Our quantitative measures and data analysis allowed us to determine that the average rate of progression of CAA was ∼0.35% of total available vessel area per day. The predictability of this measurement despite the observed differences between animals, as reflected in the small p value associated with this result, indicates that this measurement is amenable to further quantitative investigation, such as examination for effects of therapeutic intervention of CAA progression. The evident differences across animals in terms of the exact timing of the onset of CAA is comparable with that observed in various transgenic models of Aβ deposition when examined through the lens of plaque formation (Hsiao et al., 1996; Irizarry et al., 1997; Takeuchi et al., 2000).
The ability to measure vascular Aβ deposition in living mice offers the possibility of addressing a series of questions concerning the biology of CAA and its potential modification by candidate therapies. It remains to be determined, for example, whether treatments that inhibit production of new Aβ will block initiation of new foci of CAA, reduce propagation of existing vascular foci, or even allow clearance of the existing foci. Similar questions remain regarding treatment strategies for enhancing clearance of Aβ such as immune-based therapies (Schenk et al., 1999; Bacskai et al., 2001). An additional consideration for such treatments is whether clearing Aβ from brain parenchyma could actually increase the amount of Aβ available for vascular deposition via perivascular clearance pathways (Weller et al., 1998; Preston et al., 2003). Studies performed to date suggest that the overall effects on CAA of immune-based therapies may be complex. CAA burdens appear essentially unaffected by immune therapy protocols that are effective at clearance of Aβ from the brain parenchyma (Nicoll et al., 2003). In fact, there have been suggestions that these therapies may result in an increased risk of hemorrhage (Pfeifer et al., 2002; Racke et al., 2005) or inflammation-related vascular dysfunction (Greenberg et al., 2003). Whether these potentially deleterious processes are associated with localized clearance of Aβ from a CAA-affected vessel segment leading to structural weakness in an injured vessel or with increased CAA deposition and acceleration of vascular injury is uncertain. Further exploitation of the model and approach described here should be able to address these questions directly and will likely have substantial implications for therapeutic approaches to Alzheimer disease and CAA.
Thus, we have been able to demonstrate that there is a consistent and predictable progression of CAA in this mouse model. Although growth of CAA by the initiation of new deposits is a common event during early stages of the disease, there is a relatively rapid shift toward growth by accretion through propagation. In addition, this report demonstrates that the progression of CAA in mouse models of Aβ deposition in surface vasculature occurs at a rate that can be measured accurately and shows moderate consistency across animals and regions of the vascular bed. These observations will allow evaluation of anti-Aβ therapeutics on prevention or removal of CAA in an informative manner.
Footnotes
This work was supported by National Institutes of Health Grants EB000768, AG020570, AG021084, and AG08487, an Alzheimer's Association Pioneer Award, the Harvard Center for Neurodegeneration and Repair, and a fellowship from the Secretaria de Estado de Educacion y Universidades (M.G.-A). We thank W. Klunk (University of Pittsburgh) for the gift of methoxy-X04.
Correspondence should be addressed to Dr. M. P. Frosch, B114-2700, Massachusetts General Hospital, 114 16th Street, Charlestown, MA 02129. E-mail: matthew_frosch@hms.harvard.edu.
DOI:10.1523/JNEUROSCI.3854-05.2006
Copyright © 2006 Society for Neuroscience 0270-6474/06/260365-07$15.00/0
References
- Alonzo NC, Hyman BT, Rebeck GW, Greenberg SM (1998) Progression of cerebral amyloid angiopathy. Accumulation of amyloid-β40 in already affected vessels. J Neuropathol Exp Neurol 57: 353–359. [DOI] [PubMed] [Google Scholar]
- Bacskai BJ, Kajdasz ST, Christie RH, Carter C, Games D, Seubert P, Schenk D, Hyman BT (2001) Imaging of amyloid-beta deposits in brains of living mice permits direct observation of clearance of plaques with immunotherapy. Nat Med 7: 369–372. [DOI] [PubMed] [Google Scholar]
- Cadavid D, Mena H, Koeller K, Frommelt RA (2000) Cerebral beta amyloid angiopathy is a risk factor for cerebral ischemic infarction. A case control study in human brain biopsies. J Neuropathol Exp Neurol 59: 768–773. [DOI] [PubMed] [Google Scholar]
- Calhoun ME, Burgermeister P, Phinney AL, Stalder M, Tolnay M, Wiederhold KH, Abramowski D, Sturchler-Pierrat C, Sommer B, Staufenbiel M, Jucker M (1999) Neuronal overexpression of mutant amyloid precursor protein results in prominent deposition of cerebrovascular amyloid. Proc Natl Acad Sci USA 96: 14088–14093. [DOI] [PMC free article] [PubMed] [Google Scholar]
- Christie R, Yamada M, Moskowitz M, Hyman B (2001a) Structural and functional disruption of vascular smooth muscle cells in a transgenic mouse model of amyloid angiopathy. Am J Pathol 158: 1065–1071. [DOI] [PMC free article] [PubMed] [Google Scholar]
- Christie RH, Bacskai BJ, Zipfel WR, Williams RM, Kajdasz ST, Webb WW, Hyman BT (2001b) Growth arrest of individual senile plaques in a model of Alzheimer's disease observed by in vivo multiphoton microscopy. J Neurosci 21: 858–864. [DOI] [PMC free article] [PubMed] [Google Scholar]
- Domnitz S, Robbins E, Hoang A, Garcia-Alloza M, Hyman B, Rebeck G, Greenberg S, Bacskai B, Frosch M (2005) Progression of CAA in transgenic mouse models of AD. J Neuropathol Exp Neurol 64: 588–594. [DOI] [PubMed] [Google Scholar]
- Fryer JD, Taylor JW, DeMattos RB, Bales KR, Paul SM, Parsadanian M, Holtzman DM (2003) Apolipoprotein E markedly facilitates age-dependent cerebral amyloid angiopathy and spontaneous hemorrhage in amyloid precursor protein transgenic mice. J Neurosci 23: 7889–7896. [DOI] [PMC free article] [PubMed] [Google Scholar]
- Games D, Adams D, Alessandrini R, Barbour R, Berthelette P, Blackwell C, Carr T, Clemens J, Donaldson T, Gillespie F, Guido T, Hagopian S, Johnsonwood K, Khan K, Lee M, Leibowitz P, Lieberburg I, Little S, Masliah E, Mcconlogue L, et al. (1995) Alzheimer-type neuropathology in transgenic mice overexpressing V717F beta-amyloid precursor protein. Nature 373: 523–527. [DOI] [PubMed] [Google Scholar]
- Greenberg SM, Bacskai BJ, Hyman BT (2003) Alzheimer disease's double-edged vaccine. Nat Med 9: 389–390. [DOI] [PubMed] [Google Scholar]
- Greenberg SM, Gurol ME, Rosand J, Smith EE (2004) Amyloid angiopathy-related vascular cognitive impairment. Stroke 35: 2616–2619. [DOI] [PubMed] [Google Scholar]
- Harper JD, Lansbury Jr PT (1997) Models of amyloid seeding in Alzheimer's disease and scrapie: mechanistic truths and physiological consequences of the time-dependent solubility of amyloid proteins. Annu Rev Biochem 66: 385–407. [DOI] [PubMed] [Google Scholar]
- Hsiao K, Chapman P, Nilsen S, Eckman C, Harigaya Y, Younkin S, Yang F, Cole G (1996) Correlative memory deficits, Abeta elevation, and amyloid plaques in transgenic mice. Science 274: 99–102. [DOI] [PubMed] [Google Scholar]
- Iadecola C, Zhang F, Niwa K, Eckman C, Turner SK, Fischer E, Younkin S, Borchelt DR, Hsiao KK, Carlson GA (1999) SOD1 rescues cerebral endothelial dysfunction in mice overexpressing amyloid precursor protein. Nat Neurosci 2: 157–161. [DOI] [PubMed] [Google Scholar]
- Irizarry MC, McNamara M, Fedorchak K, Hsiao K, Hyman BT (1997) APPSw transgenic mice develop age-related A beta deposits and neuropil abnormalities, but no neuronal loss in CA1. J Neuropathol Exp Neurol 56: 965–973. [DOI] [PubMed] [Google Scholar]
- Jarrett JT, Lansbury Jr PT (1993) Seeding “one-dimensional crystallization” of amyloid: a pathogenic mechanism in Alzheimer's disease and scrapie? Cell 73: 1055–1058. [DOI] [PubMed] [Google Scholar]
- Kane MD, Lipinski WJ, Callahan MJ, Bian F, Durham RA, Schwarz RD, Roher AE, Walker LC (2000) Evidence for seeding of β-amyloid by intracerebral infusion of Alzheimer brain extracts in β-amyloid precursor protein-transgenic mice. J Neurosci 20: 3606–3611. [DOI] [PMC free article] [PubMed] [Google Scholar]
- Kimchi EY, Kajdasz S, Bacskai BJ, Hyman BT (2001) Analysis of cerebral amyloid angiopathy in a transgenic mouse model of Alzheimer disease using in vivo multiphoton microscopy. J Neuropathol Exp Neurol 60: 274–279. [DOI] [PubMed] [Google Scholar]
- Klunk WE, Bacskai BJ, Mathis CA, Kajdasz ST, McLellan ME, Frosch MP, Debnath ML, Holt DP, Wang Y, Hyman BT (2002) Imaging Abeta plaques in living transgenic mice with multiphoton microscopy and methoxy-X04, a systemically administered Congo red derivative. J Neuropathol Exp Neurol 61: 797–805. [DOI] [PubMed] [Google Scholar]
- Klunk WE, Engler H, Nordberg A, Wang Y, Blomqvist G, Holt DP, Bergstrom M, Savitcheva I, Huang GF, Estrada S, Ausen B, Debnath ML, Barletta J, Price JC, Sandell J, Lopresti BJ, Wall A, Koivisto P, Antoni G, Mathis CA, et al. (2004) Imaging brain amyloid in Alzheimer's disease with Pittsburgh Compound-B. Ann Neurol 55: 306–319. [DOI] [PubMed] [Google Scholar]
- Lee JM, Yin KJ, Hsin I, Chen S, Fryer JD, Holtzman DM, Hsu CY, Xu J (2003) Matrix metalloproteinase-9 and spontaneous hemorrhage in an animal model of cerebral amyloid angiopathy. Ann Neurol 54: 379–382. [DOI] [PubMed] [Google Scholar]
- Lee JM, Yin K, Hsin I, Chen S, Fryer JD, Holtzman DM, Hsu CY, Xu J (2005) Matrix metalloproteinase-9 in cerebral-amyloid-angiopathy-related hemorrhage. J Neurol Sci 229–230: 249–254. [DOI] [PubMed] [Google Scholar]
- Lombardo JA, Stern EA, McLellan ME, Kajdasz ST, Hickey GA, Bacskai BJ, Hyman BT (2003) Amyloid-β antibody treatment leads to rapid normalization of plaque-induced neuritic alterations. J Neurosci 23: 10879–10883. [DOI] [PMC free article] [PubMed] [Google Scholar]
- Mandybur TI (1975) The incidence of cerebral amyloid angiopathy in Alzheimer's disease. Neurology 25: 120–126. [DOI] [PubMed] [Google Scholar]
- Mandybur TI (1986) Cerebral amyloid angiopathy: the vascular pathology and complications. J Neuropathol Exp Neurol 45: 79–90. [PubMed] [Google Scholar]
- Nicoll JA, Wilkinson D, Holmes C, Steart P, Markham H, Weller RO (2003) Neuropathology of human Alzheimer disease after immunization with amyloid-beta peptide: a case report. Nat Med 9: 448–452. [DOI] [PubMed] [Google Scholar]
- Niwa K, Younkin L, Ebeling C, Turner SK, Westaway D, Younkin S, Ashe KH, Carlson GA, Iadecola C (2000) Abeta 1–40-related reduction in functional hyperemia in mouse neocortex during somatosensory activation. Proc Natl Acad Sci USA 97: 9735–9740. [DOI] [PMC free article] [PubMed] [Google Scholar]
- O'Brien JT, Erkinjuntti T, Reisberg B, Roman G, Sawada T, Pantoni L, Bowler JV, Ballard C, DeCarli C, Gorelick PB, Rockwood K, Burns A, Gauthier S, DeKosky ST (2003) Vascular cognitive impairment. Lancet Neurol 2: 89–98. [DOI] [PubMed] [Google Scholar]
- Okazaki H, Reagan TJ, Campbell RJ (1979) Clinicopathologic studies of primary cerebral amyloid angiopathy. Mayo Clin Proc 54: 22–31. [PubMed] [Google Scholar]
- Olichney JM, Hansen LA, Hofstetter CR, Grundman M, Katzman R, Thal LJ (1995) Cerebral infarction in Alzheimer's disease is associated with severe amyloid angiopathy and hypertension. Arch Neurol 52: 702–708. [DOI] [PubMed] [Google Scholar]
- Pfeifer M, Boncristiano S, Bondolfi L, Stalder A, Deller T, Staufenbiel M, Mathews PM, Jucker M (2002) Cerebral hemorrhage after passive anti-Abeta immunotherapy. Science 298: 1379. [DOI] [PubMed] [Google Scholar]
- Preston SD, Steart PV, Wilkinson A, Nicoll JA, Weller RO (2003) Capillary and arterial cerebral amyloid angiopathy in Alzheimer's disease: defining the perivascular route for the elimination of amyloid beta from the human brain. Neuropathol Appl Neurobiol 29: 106–117. [DOI] [PubMed] [Google Scholar]
- Racke MM, Boone LI, Hepburn DL, Parsadainian M, Bryan MT, Ness DK, Piroozi KS, Jordan WH, Brown DD, Hoffman WP, Holtzman DM, Bales KR, Gitter BD, May PC, Paul SM, DeMattos RB (2005) Exacerbation of cerebral amyloid angiopathy-associated microhemorrhage in amyloid precursor protein transgenic mice by immunotherapy is dependent on antibody recognition of deposited forms of amyloid β. J Neurosci 25: 629–636. [DOI] [PMC free article] [PubMed] [Google Scholar]
- Rochet JC, Lansbury Jr PT (2000) Amyloid fibrillogenesis: themes and variations. Curr Opin Struct Biol 10: 60–68. [DOI] [PubMed] [Google Scholar]
- Schenk D, Barbour R, Dunn W, Gordon G, Grajeda H, Guido T, Hu K, Huang J, Johnson-Wood K, Khan K, Kholodenko D, Lee M, Liao Z, Lieberburg I, Motter R, Mutter L, Soriano F, Shopp G, Vasquez N, Vandevert C, et al. (1999) Immunization with amyloid-beta attenuates Alzheimer-disease-like pathology in the PDAPP mouse. Nature 400: 173–177. [DOI] [PubMed] [Google Scholar]
- Takeuchi A, Irizarry MC, Duff K, Saido TC, Hsiao Ashe K, Hasegawa M, Mann DM, Hyman BT, Iwatsubo T (2000) Age-related amyloid beta deposition in transgenic mice overexpressing both Alzheimer mutant presenilin 1 and amyloid beta precursor protein Swedish mutant is not associated with global neuronal loss. Am J Pathol 157: 331–339. [DOI] [PMC free article] [PubMed] [Google Scholar]
- Van Dorpe J, Smeijers L, Dewachter I, Nuyens D, Spittaels K, Van Den Haute C, Mercken M, Moechars D, Laenen I, Kuiperi C, Bruynseels K, Tesseur I, Loos R, Vanderstichele H, Checler F, Sciot R, Van Leuven F (2000) Prominent cerebral amyloid angiopathy in transgenic mice overexpressing the London mutant of human APP in neurons. Am J Pathol 157: 1283–1298. [DOI] [PMC free article] [PubMed] [Google Scholar]
- Vinters HV (1987) Cerebral amyloid angiopathy. A critical review. Stroke 18: 311–324. [DOI] [PubMed] [Google Scholar]
- Vonsattel JP, Myers RH, Hedley-Whyte ET, Ropper AH, Bird ED, Richardson EP (1991) Cerebral amyloid angiopathy without and with cerebral hemorrhages: a comparative histological study. Ann Neurol 30: 637–649. [DOI] [PubMed] [Google Scholar]
- Weller RO, Massey A, Newman TA, Hutchings M, Kuo YM, Roher AE (1998) Cerebral amyloid angiopathy: amyloid beta accumulates in putative interstitial fluid drainage pathways in Alzheimer's disease. Am J Pathol 153: 725–733. [DOI] [PMC free article] [PubMed] [Google Scholar]
- Winkler DT, Bondolfi L, Herzig MC, Jann L, Calhoun ME, Wiederhold KH, Tolnay M, Staufenbiel M, Jucker M (2001) Spontaneous hemorrhagic stroke in a mouse model of cerebral amyloid angiopathy. J Neurosci 21: 1619–1627. [DOI] [PMC free article] [PubMed] [Google Scholar]
- Winkler DT, Biedermann L, Tolnay M, Allegrini PR, Staufenbiel M, Wiessner C, Jucker M (2002) Thrombolysis induces cerebral hemorrhage in a mouse model of cerebral amyloid angiopathy. Ann Neurol 51: 790–793. [DOI] [PubMed] [Google Scholar]
- Yamada M (2002) Risk factors for cerebral amyloid angiopathy in the elderly. Ann NY Acad Sci 977: 37–44. [DOI] [PubMed] [Google Scholar]