

Abstract
Regulation of glutamate reuptake occurs along with several forms of synaptic plasticity. These associations led to the hypothesis that regulation of glutamate uptake is a general component of plasticity at glutamatergic synapses. We tested this hypothesis by determining whether glutamate uptake is regulated during both the early phases (E-LTP) and late phases (L-LTP) of long-term potentiation (LTP). We found that glutamate uptake was rapidly increased within minutes after induction of LTP and that the increase in glutamate uptake persisted for at least 3 h in CA1 of the hippocampus. NMDA receptor activation and Na+-dependent high-affinity glutamate transporters were responsible for the regulation of glutamate uptake during all phases of LTP. However, different mechanisms appear to be responsible for the increase in glutamate uptake during E-LTP and L-LTP. The increase in glutamate uptake observed during E-LTP did not require new protein synthesis, was mediated by PKC but not cAMP, and as previously shown was attributable to EAAC1 (excitatory amino acid carrier-1), a neuronal glutamate transporter. On the other hand, the increase in glutamate uptake during L-LTP required new protein synthesis and was mediated by the cAMP–PKA (protein kinase A) pathway, and it involved a different glutamate transporter, GLT1a (glutamate transporter subtype 1a). The switch in mechanisms regulating glutamate uptake between E-LTP and L-LTP paralleled the differences in the mechanisms responsible for the induction of E-LTP and L-LTP. Moreover, the differences in signaling pathways and transporters involved in regulating glutamate uptake during E-LTP and L-LTP indicate that different functions and/or sites may exist for the changes in glutamate uptake during E-LTP and L-LTP.
Keywords: LTP, glutamate transporters, EAAC1, GLT1a, plasticity, second messengers, signaling pathways, hippocampus
Introduction
Clearance of glutamate by Na+-dependent high-affinity glutamate transporters has an important role in synaptic function. In mammals, glutamate uptake is mediated by different glutamate transporters (Danbolt, 2001). Glutamate transporter subtype 1 (GLT1) and excitatory amino acid carrier-1 (EAAC1) are the main glutamate transporters in the hippocampus (Rothstein et al., 1996). GLT1 is highly expressed in glial cells (Rothstein et al., 1994). Two isoforms of GLT1, GLT1a and GLT1b, have been identified in the hippocampus (Chen et al., 2002). The major isoform appears to be GLT1a, which is expressed in astrocytes and neurons, primarily in presynaptic terminals, and much less in postsynaptic spines (Chen et al., 2004). GLT1b mRNA has been found in astrocytes and neurons, but the pattern of its protein expression remains unclear (Berger et al., 2005). EAAC1, a primarily neuronal glutamate transporter, is expressed in pyramidal cells (Rothstein et al., 1994).
Regulation of glutamate uptake may also play important roles in synaptic plasticities as well as memory formation (Maleszka et al., 2000; Katagiri et al., 2001; Yang et al., 2005). For example, in both vertebrates and invertebrates, changes in glutamate uptake parallel changes in synaptic efficacy (Levenson et al., 2000, 2002). In addition, changes in synaptic efficacy produced by morphine withdrawal were associated with increases in glutamate uptake in synaptosomes obtained from hippocampus (Xu et al., 2003). Furthermore, a protocol known to induce depression of AMPA receptors in cerebellar Purkinje cells produces an increase in glutamate transporter activity (Shen and Linden, 2005).
Here, we tested the hypothesis that regulation of glutamate uptake is a general component of plasticity at glutamatergic synapses. This hypothesis was tested by investigating whether glutamate uptake is regulated during both the early phases (E-LTP) and late phases (L-LTP) of long-term potentiation (LTP). Previously, we established that glutamate uptake is increased 30 min after induction of E-LTP in the CA1 region of the hippocampus (Levenson et al., 2002). In our new work, we found that glutamate uptake was rapidly increased within minutes after induction of LTP and that the increase in uptake persisted for at least 3 h. We next determined whether the same induction and expression mechanisms were responsible for the changes in uptake during different phases of LTP. Interestingly, we found that different transporters and mechanisms were responsible for the early and late changes in glutamate uptake. The increase in glutamate uptake during L-LTP required macromolecular synthesis, was sensitive to dihydrokainate (DHK), a selective GLT1 glutamate transporter inhibitor, and corresponded to an increase in the amount of GLT1a in CA1 membranes. In contrast, the increase in glutamate uptake during E-LTP did not require macromolecular synthesis, was not sensitive to DHK, and corresponded to an increase in EAAC1. Additionally, different signaling pathways appear to induce the increases in glutamate uptake during E-LTP and L-LTP. The cAMP–protein kinase A (PKA) pathway mediates the increase in glutamate uptake during L-LTP but not E-LTP. In contrast, PKC activation was necessary and sufficient to produce changes in glutamate uptake during E-LTP, but activation of PKC with phorbol esters did not produce changes in glutamate uptake during L-LTP.
Materials and Methods
Hippocampal slices and electrophysiology.
Transverse hippocampal slices (400 μm) were obtained from male Sprague Dawley rats (100–150 g) according to protocols approved by the University of Houston Institutional Animal and Use Committee. Slices were cut using a vibratome slicer in ice-cold “cutting” solution (in mm: 110 sucrose, 60 NaCl, 3 KCl, 1.25 NaH2PO4, 25 NaHCO3, 2 d-glucose, 0.5 CaCl2, and 7 MgCl2) saturated with 95% O2 and 5% CO2. After 1 h of recovery in 50% cutting solution, 50% artificial CSF (ACSF) (in mm: 125 NaCl, 2.5 KCl, 1.25 NaH2PO4, 25 NaHCO3, 10 d-glucose, 2 CaCl2, and 1 MgCl2 saturated with 95% O2 and 5% CO2), slices were incubated for 1 h in 100% ACSF at room temperature. Then, slices were placed in an interface chamber (Fine Science Tools, Foster City, CA) and perfused at a flow rate of 1 ml/min with ACSF and maintained at 32°C. One-half of the slices (10–12 slices total per rat) were considered “experimental”; the other one-half were “control.” Slices were equilibrated in the recording chamber for 1 h before recording.
A bipolar stimulating electrode was placed in stratum radiatum of CA1 next to area CA3, and the recording electrode was placed in the stratum radiatum of area CA1 (see Fig. 1A). Recording electrodes were introduced ∼100 μm into the slice. Electrical stimulation with a current pulse of 100 μs duration was applied using an A-M Systems (Carlsborg, WA) analog stimulus isolator. Extracellular field potential recordings were amplified using an A-M Systems Neuroprobe amplifier low-pass filtered at 1 kHz (low-pass Bessel four-pole), digitized at 50 kHz, and analyzed using Molecular Devices (Foster City, CA) acquisition and analysis programs (Digidata 1322A and pClamp 8.2). Stimulus intensities were adjusted to record baseline field EPSPs (fEPSPs) with slopes that were 50% of maximum as determined from an input/output curve. Only slices that exhibited stable fEPSPs were used in uptake experiments. High-frequency stimulation (HFS) (two bursts; each 1 s, 100 Hz; bursts spaced 20 s apart) to elicit LTP in a broad area of tissue was given to HFS slices at an intensity that elicited 70% of the maximum fEPSP slope. Slices stimulated with HFS were called “HFS slices.”
Figure 1.
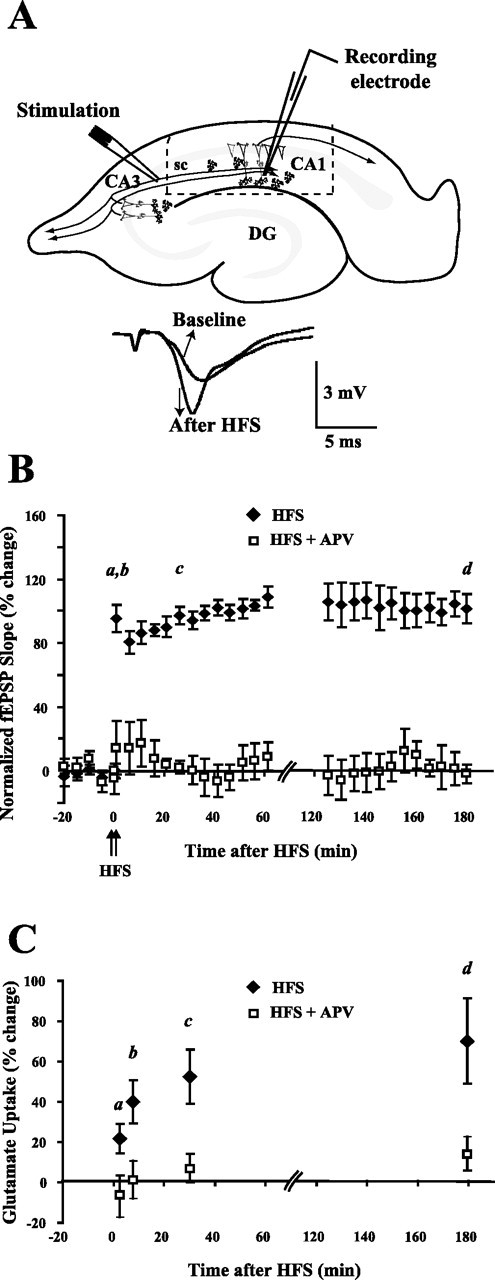
Glutamate uptake is increased during all phases of LTP. A, An example of LTP produced by HFS is shown at the bottom. Baseline fEPSP recording 10 min before HFS and LTP fEPSP recording 30 min after HFS are shown. The dashed line shows the area of CA1 in which glutamate uptake was measured in the hippocampal slice. DG, Dentate gyrus; sc, Schaffer collaterals. B, LTP was induced using HFS (two 100 Hz, 1 s stimulations; 20 s apart) after a baseline recording period of 20 min. HFS produced LTP that lasted at least 180 min. The induction of LTP was blocked by the NMDA receptor blocker, APV (50 μm), administered during baseline recording and HFS (n = 4). fEPSPs were followed until determination of glutamate uptake at the times shown by a, b, c, and d in the figure. For the 2.5 (a) and 7.5 min (b) time points, only posttetanic potentiation was verified by test stimulation. For the 30 min (c) time point, maintenance of potentiation was verified each minute, and for the 3 h (d) time point, potentiation was verified every 5 min. Values are mean ± SEM (n = 5 rats). C, Glutamate uptake was measured in area CA1 of the hippocampus. The letters refer to times shown in B. Significant increases in glutamate uptake occurred as early as 2.5 min after HFS (a) and as late as 180 min after HFS (d). APV (50 μm) administered during baseline and HFS inhibited the increase in glutamate uptake at each time point. Open squares are slices that were treated with APV during baseline recording and HFS. Data were analyzed using a two-way ANOVA (F(1,43) = 27.6, p < 0.001 for the effect of treatment; F(3,43) = 3.3, p < 0.05 for the effect of time; F(3,43) = 0.5, p = 0.67 for the interaction between treatment and time). Error bars indicate SEM.
Drug treatments.
Paired control and experimental slices from a single rat were maintained together in a single chamber except during drug treatments. dl-2-Amino-5-phosphonopentanoic acid (APV), anisomycin, 5,6-dichlorobenzimidazole 1-β-d-ribofuranoside (DRB), forskolin, and phorbol 12,13-diacetate (PDA) were obtained from Sigma (St. Louis, MO). Sp-cAMPs, Rp-cAMPs, (9S,10R,12R)-2,3,9,10,11,12-hexahydro-10-hydroxy-9-methyl-1-oxo-9,12-epoxy-1H-diindolo-[1,2,3-fg:3′,2′,1′-kl]pyrrolo[3,4-i][1,6]benzodiazocine-10-carboxylicacid hexyl ester (KT5720), chelerythrine, and bisindolylmaleimide I (GF 109203X) were obtained from Tocris (Ellisville, MO). DRB, forskolin, PDA, GF 109203X, and KT5720 were dissolved in dimethylsulfoxide (DMSO). The DMSO concentration used in experiments was <0.01%. In Na+-free experiments, NaCl from ACSF labeling solution was replaced by choline chloride (Sigma). In Ca2+-free experiments, CaCl2 from ACSF was omitted and replaced by MgCl2. When the effect of uptake inhibitors was studied, dihydrokainate (DHK) (500 μm; Tocris) and dl-threo-β-benzyloxyaspartic acid (TBOA) (100 μm; Tocris) were prepared as a stock solution in ACSF, and then added to incubation vials with labeling ACSF solution during measurements of glutamate uptake.
Glutamate uptake.
Glutamate uptake was measured 2.5, 7.5, 30, and 180 min after HFS. After measurement of potentiation, one HFS and one control slice for each time point were separately incubated in an oxygenated chamber containing labeling ACSF. Labeling ACSF consisted of ACSF plus radiolabeled glutamate at 5 μm final concentration (4 μm cold plus 1 μm radioactive glutamate, l-[14C(U)]glutamic acid; 250 μCi/μmol; PerkinElmer, Boston, MA). The glutamate concentration used was chosen to be within the range of the Km for high-affinity glutamate transport previously reported. Also, uptake of label was linear over time from 2.5 to 17.5 min. Glutamate uptake was measured within this linear range of uptake. The incubation time with glutamate was 2.5 min for the 2.5 min time point after HFS and 7.5 min for the 7.5 min time point after HFS. The absolute number of counts taken up varied from 700 to 2000 dpm with a background of ∼20 dpm. Also, incubation time was 7.5 min during the last portion of the 30 and 180 min time points after HFS. After incubation, slices were rinsed with cold ACSF, blotted, and frozen on dry ice. Area CA1 was dissected and solubilized in 1% SDS. Uptake was calculated using the specific radioactivity of the labeling ACSF (∼50 μCi/μmol) solution and normalized to total protein and time of incubation. Glutamate uptake was expressed as femtomoles per microgram per minute in experiments in which the drug treatment was performed during the glutamate incubation and as percentage change in uptake of HFS slices compared with control slices in experiments in which the slices were treated with drugs during electrophysiological recordings. In each experiment, “n” equaled the number of rats. At the short-term points, the value for each animal is an average for the slices used in the experiment. At the long-term point (180 min), only one experimental slice could be used for each animal. Data are expressed as mean ± SEM. Student's two-tailed paired t test was used to analyze significance of percentage change between the two groups; p < 0.05 was taken as significant. When comparing glutamate uptake of several groups, data were analyzed using one-way or two-way ANOVA and post hoc analysis was performed using Tukey–Kramer's analysis.
Western blots.
Isolated CA1 was homogenized in a buffered, isotonic protease inhibitor solution (150 mm NaCl, 1 μm bestatin, 1 μm aprotonin, 1 μm leupeptin, 1 mm PMSF, 5 mm benzamidine, 1 mm EDTA, 1 mm EGTA, and 20 mm Tris, pH 7.5). The sample was centrifuged at 16,000 × g for 5 min at 4°C to pellet large membranes. Vesicles, mitochondria, and soluble proteins were removed in the supernatant. The pellet was resuspended in 1 mm Tris, pH 7.5, and was centrifuged and rinsed with 1 mm Tris, pH 7.5. The resulting pellet was resuspended in 1% SDS, 1 mm Tris, pH 7.5, and boiled for 5 min to extract membrane proteins before the addition of sample buffer. Equal amounts of proteins were loaded and resolved via 12% SDS-PAGE, transferred to polyvinylidene difluoride membranes, and then blocked for 1 h with 5% milk in Tris-buffered saline with Tween 20 (TBST) (TBST, 0.1% Tween 20, 150 mm NaCl, 20 mm Tris, pH 7.5). We used commercially available affinity-purified anti-peptide antibodies to EAAC1 (Alpha Diagnostic, San Antonio, TX) and GLT1a (BD Transduction Laboratories, San Diego, CA). GLT1b antibody, a splice variant of GLT1 that differs in the C terminus, was a generous gift from Dr. Paul Rosenberg (Harvard Medical School, Boston, MA) and has been previously shown to be effective for Western blot analysis (Chen et al., 2004). Antibodies were applied to membranes (1:500 EAAC1; 1:4000 GLT1a; 1:40,000 GLT1b) and incubated overnight at 4°C. Actin was used as a loading control. Thus, a monoclonal anti-actin antibody (clone AC-40; Sigma) was applied simultaneously (1:500) with anti-glutamate transporter antisera. Binding of the antibodies was detected with chemiluminescence (ECL; Amersham Biosciences, Piscataway, NJ). Each blot was exposed to x-ray film for multiple durations to ensure linearity. Densitometry was performed using NIH Image software.
Results
HFS produced a rapid and prolonged increase in glutamate uptake that required activation of NMDA receptors
The glutamatergic Schaffer collateral synapse (CA3–CA1) undergoes an activity-dependent enhancement of synaptic strength, called long-term potentiation (Fig. 1A) (Bliss and Collingridge, 1993). The induction of Schaffer collateral LTP requires NMDA receptor activation and is typically evoked by HFS. LTP can be divided into an early phase (E-LTP) which lasts 1–2 h after HFS and is not dependent on macromolecular synthesis, and a late phase (L-LTP) lasting >3 h which requires transcription and translation (Frey et al., 1988; Nguyen and Kandel, 1996).
Previously, we discovered that glutamate uptake was increased in CA1 30 min after HFS (Levenson et al., 2002). To define more completely the temporal domains in which plasticity of glutamate uptake occurred, glutamate uptake was measured in area CA1 2.5 (a), 7.5 (b), 30 (c), or 180 (d) min after induction of LTP (Fig. 1B). The Schaffer collaterals in CA3 received HFS (two bursts; each 1 s, 100 Hz; bursts separated by 20 s) after a 20 min period of baseline recording. LTP induced by HFS could be followed for at least 180 min (Fig. 1B). Glutamate uptake was measured in a region removed from the slice as outlined by the dashed region in Figure 1A. Glutamate uptake was significantly increased as early as 2.5 min after HFS, and the increase lasted at least 180 min after HFS, demonstrating that glutamate uptake is regulated during the two different temporal domains of LTP, E-LTP and L-LTP (Fig. 1C). Glutamate uptake was significantly increased 21.6 ± 7.2% 2.5 min after HFS (mean ± SEM; n = 7 rats; p < 0.05), 39.9 ± 10.7% 7.5 min after HFS (n = 8; p < 0.01), 55.0 ± 11.9% 30 min after HFS (n = 5; p < 0.01), and 70.1 ± 21.3% 180 min after HFS (n = 6; p < 0.05) (Fig. 1C). The increase in glutamate uptake observed at 30 min after HFS confirmed the result previously obtained at this time point (Levenson et al., 2002).
To investigate the first steps of the mechanism for the induction of the increase in glutamate uptake, we tested whether the rapid and prolonged increases in glutamate uptake depended on NMDA receptor activation, as does the induction of LTP. NMDA receptors were blocked by 50 μm APV applied during baseline and HFS (Harris et al., 1984; Morris et al., 1986). The increases in glutamate uptake as well as LTP were blocked by APV at each time point examined after HFS (Fig. 1B,C). APV by itself had no effect on the uptake of glutamate in control slices (data not shown). Therefore, NMDA receptor activation was necessary during HFS to produce early and late increases in glutamate uptake. This result was confirmed in an experiment testing the effect of removal of extracellular Ca2+ on the increase in glutamate uptake. Elimination of extracellular Ca2+ (replaced with Mg2+) blocked synaptic transmission during HFS and the increase in glutamate uptake 30 min after HFS. The glutamate uptake of slices that received HFS during Ca2+ removal was 5.2 ± 9.0% (n = 4; p = 0.60) compared with slices that only received the removal of Ca2+. The transient removal of Ca2+ by itself did not affect glutamate uptake. The difference between glutamate uptake in control slices and Ca2+-free slices was 15.1 ± 11.8% (n = 4; p = 0.29).
Na+-dependent high-affinity glutamate transporters mediated the increase in glutamate uptake
Next, we investigated whether the increases in glutamate uptake at all time domains were attributable to changes in Na+-dependent high-affinity glutamate transporters. Glutamate uptake by high-affinity glutamate transporters can be differentiated from glutamate receptor binding and low-affinity glutamate transporters using low-Na+ solutions and a specific inhibitor of high-affinity glutamate transporters, TBOA (Lebrun et al., 1997; Shimamoto et al., 1998; Danbolt, 2001). Glutamate uptake in control and HFS-treated slices was measured at 7.5 and 180 min after HFS in Na+-free solutions or TBOA (100 μm). Control slices and HFS slices were incubated in the Na+-free or TBOA solutions for 7.5 min during the measurement of glutamate uptake after HFS. The Na+-free solution and TBOA inhibited glutamate uptake in the control slices as expected if high-affinity glutamate transporters were predominantly responsible for glutamate uptake in area CA1 (Fig. 2A,B). As shown in Figure 2, glutamate uptake in control slices was reduced by 75% in the Na+-free solution, and 64% in the TBOA solution at the 7.5 min time point and by 60% in the Na+-free solution, and by 74% in the TBOA solution at the 180 min time point. Importantly, application of TBOA or a Na+-free solution during measurement of glutamate uptake abolished the increase in glutamate uptake produced by HFS (Fig. 2A,B). Therefore, the increase in glutamate uptake produced by HFS was mediated by Na+-dependent high-affinity glutamate transporters during L-LTP as well as E-LTP (Fig. 2A,B). The results obtained during E-LTP are in agreement with our previously published results that the increase in glutamate uptake 30 min after HFS was dependent on Na+ and abolished by THA (threo-β-hydroxyaspartate), another inhibitor of Na+-dependent high-affinity glutamate transporters (Levenson et al., 2002).
Figure 2.
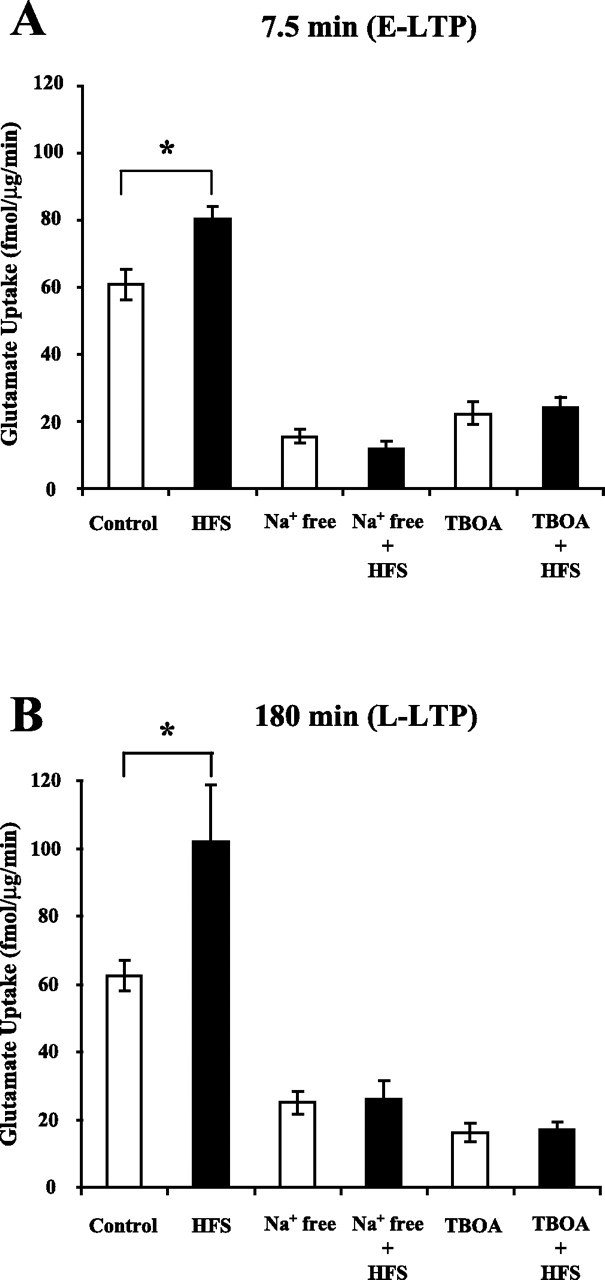
The increase in glutamate uptake during E-LTP and L-LTP is mediated by a Na+-dependent high-affinity glutamate transporter. HFS produced a significant increase in glutamate uptake 7.5 min (A) and 180 min (B) after HFS. TBOA (100 μm), a selective inhibitor of high-affinity glutamate transporters, or Na+ removal during measurement of glutamate uptake inhibited basal uptake as well as the increase in glutamate uptake observed 7.5 or 180 min after HFS. Data were analyzed using a one-way ANOVA (F(5,28) = 75.3, p < 0.001 for A; F(5,24) = 19.3, p < 0.001 for B), and post hoc analysis was done by Tukey–Kramer's test. *Statistically different, p < 0.05. Error bars indicate SEM.
Inhibition of transcription and translation blocked the increase in glutamate uptake during L-LTP
L-LTP requires transcription and translation, whereas E-LTP expression for shorter periods such as 30 min after HFS does not. To examine whether macromolecular synthesis was required for the increases in glutamate uptake, we blocked protein synthesis and transcription. Inhibition of transcription by DRB and inhibition of translation by anisomycin in hippocampal slices has been shown by others (Frey et al., 1988, 1996; Nguyen et al., 1994). Anisomycin (40 μm) or DRB (100 μm) was perfused during baseline recording (20 min before) and during 180 min of recording after HFS. As seen by others, anisomycin or DRB blocked L-LTP, but did not prevent E-LTP (Fig. 3A). Basal glutamate uptake in control slices was not affected when anisomycin or DRB was added for 180 min (data not shown). Anisomycin did not block the increase in glutamate uptake 30 min after HFS (Fig. 3B) (Levenson et al., 2002). However, DRB and anisomycin blocked the increase in glutamate uptake observed 180 min after HFS (0.2 ± 14.2%, n = 5, p = 0.71 for DRB; −9.4 ± 4.0%, n = 4, p = 0.14 for anisomycin) (Fig. 3C). Therefore, the requirement of macromolecular synthesis to increase glutamate uptake differed between the 30 and 180 min time points.
Figure 3.
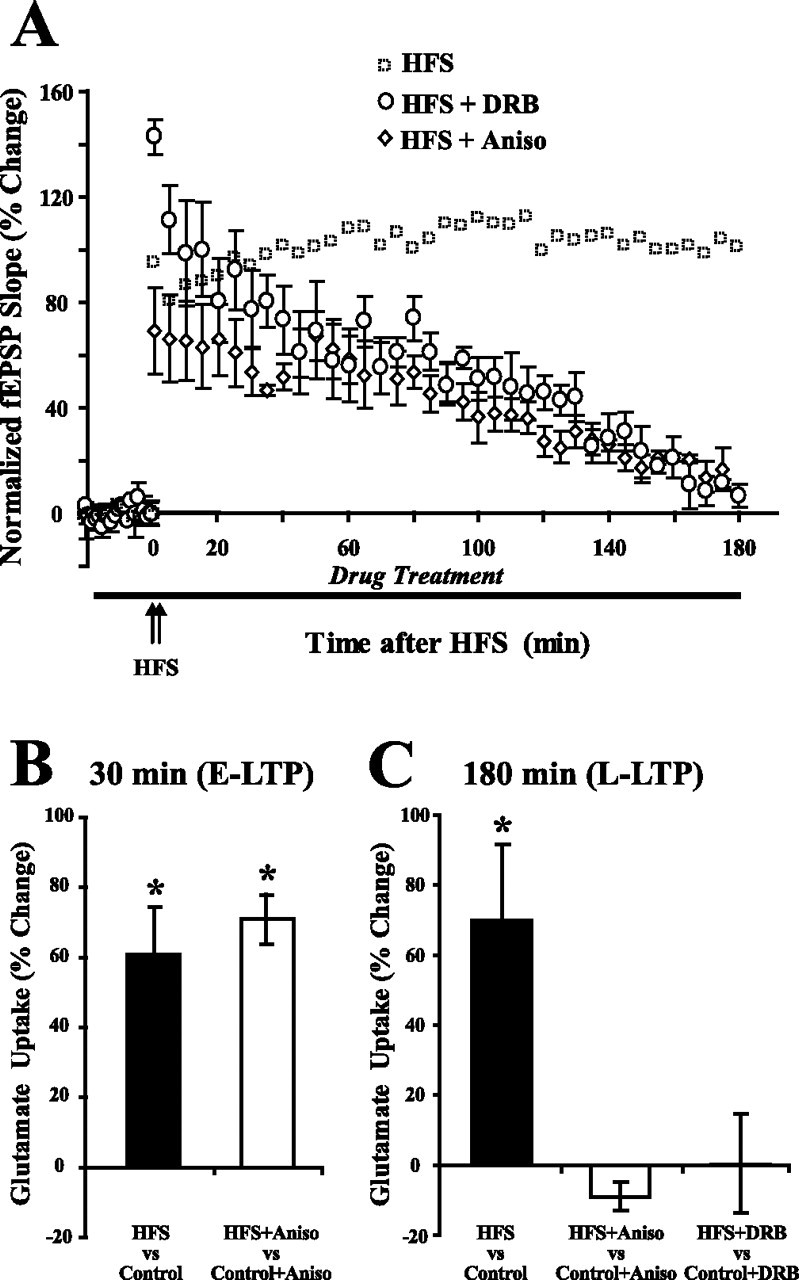
Transcription and translation are required for the increase in glutamate uptake during L-LTP. A, A translation inhibitor, anisomycin (40 μm), or a transcription inhibitor, DRB (100 μm), was applied from 20 min before HFS to 180 min after HFS. RNA synthesis (DRB) or protein synthesis (anisomycin) inhibitors did not block the appearance of E-LTP but did block the appearance of L-LTP. Data for HFS alone (open boxes) were reproduced from Figure 1B. B, Anisomycin (40 μm) had no effect on the increase in glutamate uptake during E-LTP (30 min after HFS). Data for B were taken from Levenson et al. (2002). C, In contrast to 30 min after HFS, anisomycin (40 μm) or DRB (100 μm) blocked the increase in glutamate uptake 180 min after HFS. Anisomycin or DRB given alone for 180 min had no effect on the basal level of glutamate uptake (data not shown). Data were analyzed using a one-way ANOVA (F(2,12) = 6.7, p < 0.05), and post hoc analysis was done by Tukey–Kramer's test. *Statistically different, p < 0.05. Error bars indicate SEM. Aniso, Anisomycin.
Different glutamate transporters are responsible for the increases in glutamate uptake during E-LTP and L-LTP
Is the same type of high-affinity Na+-dependent glutamate transporter responsible for the increases in glutamate uptake during early and late phases of LTP? We initially investigated this question using a pharmacological approach, and then confirmed our findings by analyzing glutamate transporter levels in membranes. DHK has a 100-fold greater selectivity for the glial transporter GLT1 than for the neuronal transporter EAAC1 (Arriza et al., 1994). Changes in EAAC1 appear to be responsible for the changes in uptake that occur 30 min after HFS (Levenson et al., 2002). Levenson et al. (2002) showed that DHK did not inhibit the increase in glutamate uptake 30 min after HFS. We found that DHK (500 μm) significantly reduced basal glutamate uptake by 50% in control slices (compare Fig. 2A,B, control data, with Fig. 4A,B, control plus DHK data). However, DHK (500 μm) did not block the increase in glutamate uptake observed 7.5 min after induction of LTP by HFS. The potentiated slices showed a significant increase in glutamate uptake of 36.7 ± 3.7% (n = 7; p < 0.01) at 7.5 min after HFS when DHK was present (Fig. 4A). Thus, DHK did not block the increase in glutamate uptake during E-LTP (7.5 and 30 min after HFS), but it did block a large amount of basal glutamate uptake at this time. These results suggest that GLT1 is not responsible for the increase in glutamate uptake during E-LTP. However, different from E-LTP, the increase in glutamate uptake during L-LTP was blocked by DHK (500 μm) (14.3 ± 8.1%; n = 6; p = 0.37) (Fig. 4B), suggesting that a GLT1 isoform plays a major role in the increase in glutamate uptake during L-LTP. Also, the fact that no increase in glutamate uptake was observed in the presence of DHK during L-LTP suggests that EAAC1 is no longer increased at this time point (as it is 30 min after HFS).
Figure 4.
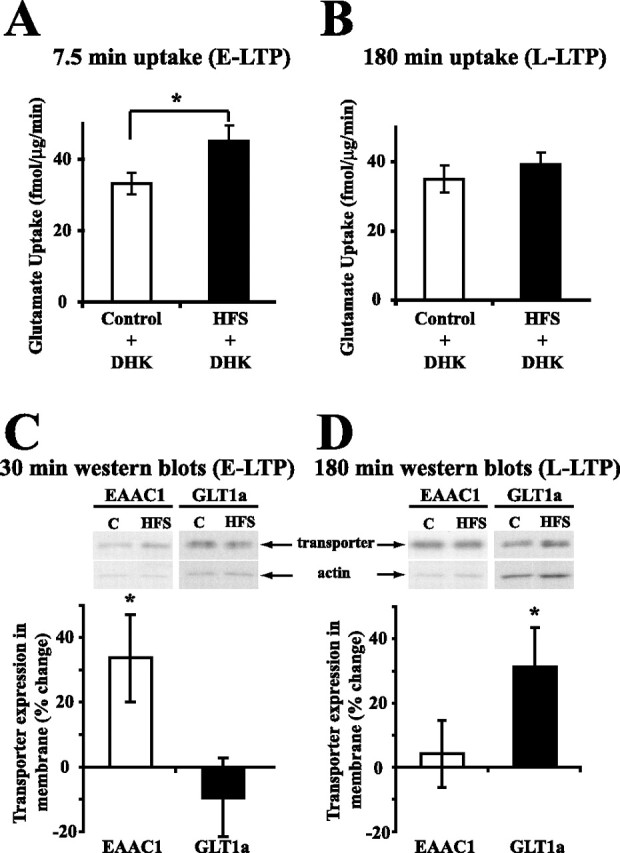
DHK, an inhibitor of GLT1, blocked the increase in glutamate uptake during L-LTP, and HFS increased the level of GLT1a during L-LTP. A, B, DHK (500 μm) was applied to control and potentiated slices during measurement of glutamate uptake. DHK is an inhibitor of GLT1 isoforms. DHK decreased basal (control) uptake >50% in control slices in A and B (compare with controls of Fig. 2A,B). The increase in glutamate uptake during E-LTP (A) (n = 7) was not blocked by DHK, but DHK did block the increase in glutamate uptake during L-LTP (B) (n = 6). Data were analyzed using a two-tailed paired t test (t = 6.4, p < 0.01 in A; and t = 1.0, p = 0.37 in B). C, D, Representative Western blots of transporter protein from membrane fractions are shown above the summary of results obtained from densitometry. During E-LTP (30 min), a significant increase in the level of EAAC1 (t = 2.5; p < 0.05; n = 9) was produced by HFS, but no significant increase in the level of GLT1a (t = 0.8; p = 0.46; n = 7) was produced (C). During L-LTP (180 min), the level of GLT1a was significantly increased (t = 2.6; p < 0.05; n = 10) by HFS, but no significant increase in the level of EAAC1 (t = 0.4; p = 0.70; n = 9) was produced (D). Data were analyzed using one-sample t test. C, Control slices; HFS, slices receiving HFS. *Statistically different, p < 0.05. Error bars indicate SEM.
Our previous and new results led to the hypothesis that EAAC1 is responsible for the increase in glutamate uptake during E-LTP, but some form of GLT1 is responsible for the increase in glutamate uptake during L-LTP. GLT1a is equivalent to GLT1, whereas the C terminus of GLT1b is different from that of GLT1a. The localization of GLT1a and GLT1b appears to differ in astrocytes and perhaps neurons (Chen et al., 2002, 2004; Berger et al., 2005). GLT1a is located in astrocytic distal processes adjacent to synapses, whereas GLT1b appears to be more evenly distributed in astrocytes. Neuronal GLT1a is predominantly located in presynaptic terminals and less in postsynaptic spines, whereas neuronal GLT1b localization is unclear. Based on their localization, GLT1a probably has a larger effect on the synapse than does GLT1b. Thus, we hypothesized that GLT1a expression would be increased during L-LTP. To test this possibility, levels of EAAC1 and GLT1a were examined 180 min (L-LTP) and 30 min (E-LTP) after HFS using quantitative analysis of Western blots. Importantly, as predicted, a significant increase of 31.2 ± 12.2% (n = 10; p < 0.05) in the levels of GLT1a was observed 180 min after HFS, whereas no changes occurred in levels of EAAC1 at this time point (4.2 ± 10.4%; n = 9; p = 0.70) (Fig. 4D). Also, as predicted, a significant increase of 33.7 ± 13.5% (n = 9; p < 0.05) in levels of EAAC1 was observed 30 min after HFS, whereas no change occurred in the level of GLT1a at this time (−9.4 ± 12.1%; n = 7; p = 0.46) (Fig. 4C). No change in actin during E-LTP or L-LTP was produced by HFS (data not shown). As a comparison to GLT1a, a change in expression of GLT1b was tested. No change occurred in the level of GLT1b 180 min after HFS (7.8 ± 15.0%; n = 6; p = 0.62). Therefore, different glutamate transporters appear to be responsible for the increase in glutamate uptake during E-LTP (EAAC1) and L-LTP (GLT1a). It is worth noting that the magnitudes of changes we observed in levels of transporters were similar to changes observed by others in AMPA levels after induction of LTP (Nayak et al., 1998; Heynen et al., 2000).
Elevating cAMP induced an increase in glutamate uptake during L-LTP but not during E-LTP
The induction of L-LTP by HFS is dependent on cAMP and the activation of PKA (Frey et al., 1993; Huang and Kandel, 1994; Abel et al., 1997; Huang et al., 2005). Also, Chetkovich and Sweatt (1993) showed that NMDA receptor activation by HFS produces an increase in cAMP in pyramidal cells in CA1 of the hippocampus. Moreover, an increase in cAMP produces a long-term increase of GLT1 and GLAST in astrocytes without affecting other transporters (Schlag et al., 1998). Therefore, we hypothesized that the cAMP–PKA signaling pathway mediated the effect of HFS on the long-term increase in glutamate uptake. We tested this hypothesis by investigating effects of elevating cAMP and alternatively inhibiting PKA activity on the long-term increase in glutamate uptake produced by HFS.
To elevate cAMP, we used forskolin (50 μm) or Sp-cAMPs (100 μm) along with test stimulation. Forskolin (Fig. 5A) and Sp-cAMPs (data not shown) with test stimulation produce L-LTP similar to that produced by HFS (Chavez-Noriega and Stevens, 1992; Frey et al., 1993). Test stimulation alone or forskolin alone did not produce L-LTP (Fig. 5A). Simultaneous test stimulation during elevation of cAMP may be required to elicit L-LTP, because test stimulation releases glutamate that activates glutamatergic receptors, or other processes (Otmakhov et al., 2004). Forskolin treatment for 15 min paired with test stimulation induced a significant increase in glutamate uptake 180 min after treatment (53.4 ± 18.2%; n = 7; p < 0.05) (Fig. 5B). Test stimulation during forskolin treatment was required to induce an increase in glutamate uptake as forskolin without test stimulation or test stimulation by itself did not increase glutamate uptake 180 min after treatment (−10.5 ± 14.2%, n = 7, p = 0.50, forskolin; 1.0 ± 9.7%, n = 6, p = 0.92, stimulation) (Fig. 5B). Another method was used to elevate cAMP. Sp-cAMPs (100 μm) applied for 15 min with test stimulation also significantly increased glutamate uptake in slices 180 min after treatment (42.1 ± 6.5%; n = 5; p < 0.01) (Fig. 5B). Sp-cAMPs treatment without test stimulation did not produce a significant increase in glutamate uptake 180 min after treatment (14.3 ± 17.0%; n = 4; p = 0.46). Thus, elevating cAMP by two different methods, each led to a long-term increase in glutamate uptake.
Figure 5.
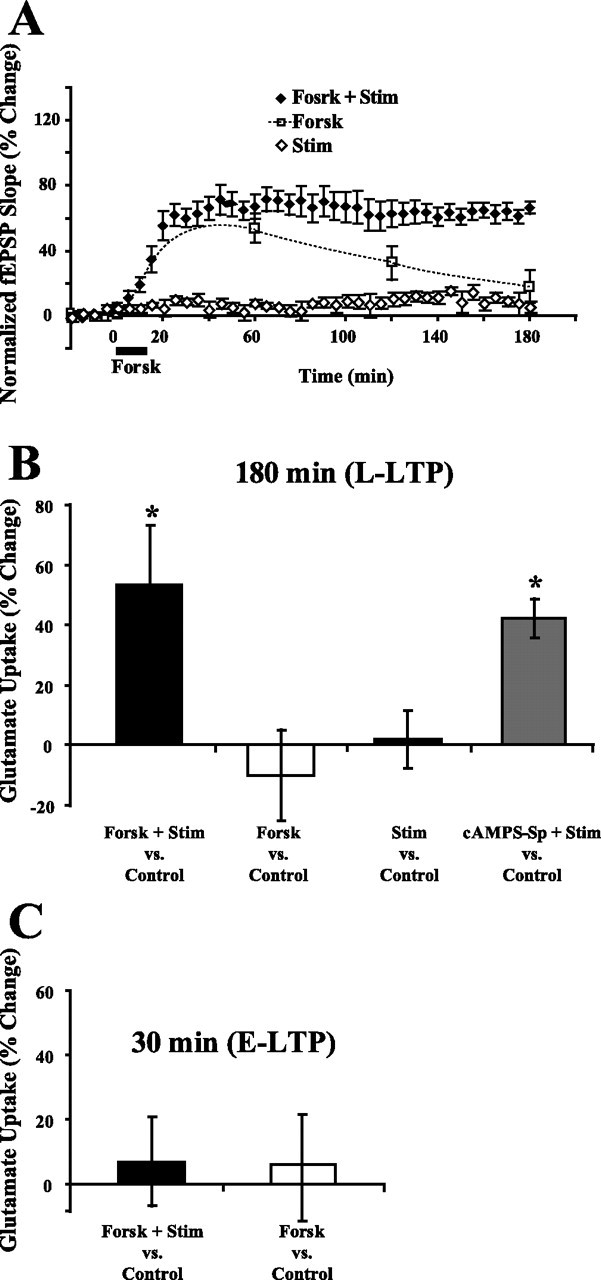
Elevating cAMP induced an increase in glutamate uptake during L-LTP. A, Forskolin (50 μm) was applied for 15 min after 20 min baseline recording. L-LTP was observed 180 min after treatment in slices that received test stimulation during forskolin treatment (n = 7; closed diamonds). Synaptic stimulation has been shown before to be necessary for forskolin to elicit L-LTP (Otmakhov et al., 2004). Slices that received forskolin treatment and no test stimulation, showed a transient potentiation at 60 min but did not exhibit L-LTP at 180 min (n = 7; dashed line). Test stimulation by itself (open diamonds) did not induce E-LTP or L-LTP (n = 5). B, Treatment with forskolin or Sp-cAMPs plus test stimulation induced a significant increase in glutamate uptake during L-LTP. Forskolin or test stimulation alone did not induce an increase in glutamate uptake 180 min after treatment. Data were analyzed using a one-way ANOVA (F(3,21) = 5.1; p < 0.01), and post hoc analysis was done by Tukey–Kramer's test. C, Although forskolin alone or forskolin plus test stimulation induced E-LTP (A), glutamate uptake was not changed 30 min after forskolin or forskolin plus test stimulation treatments. *Statistically different, p < 0.05. Error bars indicate SEM. Forsk, Forskolin; Stim, test stimulation.
Interestingly, neither forskolin alone nor forskolin plus test stimulation produced an increase in glutamate uptake during E-LTP (6.9 ± 12.7%, n = 7, p = 0.86; and 5.9 ± 14.8%, n = 7, p = 0.89, respectively) (Fig. 5C) supporting the difference in mechanisms of plasticity of glutamate uptake during E-LTP and L-LTP.
The GLT1 inhibitor, DHK, blocked the increase in glutamate uptake produced by forskolin
Does forskolin and HFS increase glutamate uptake during L-LTP through the same mechanism? DHK blocked the long-term effect of HFS on glutamate uptake (Fig. 4B). DHK given during glutamate uptake also blocked the increase in glutamate uptake induced 180 min after treatment with forskolin and test stimulation (11.0 ± 11.4%, n = 5, p = 0.37) (Fig. 6). Therefore, the same type of glutamate transporter appears to mediate the long-term effects of both HFS and forskolin on glutamate uptake. These results demonstrate that forskolin mimics the effect of HFS on glutamate uptake during L-LTP.
Figure 6.
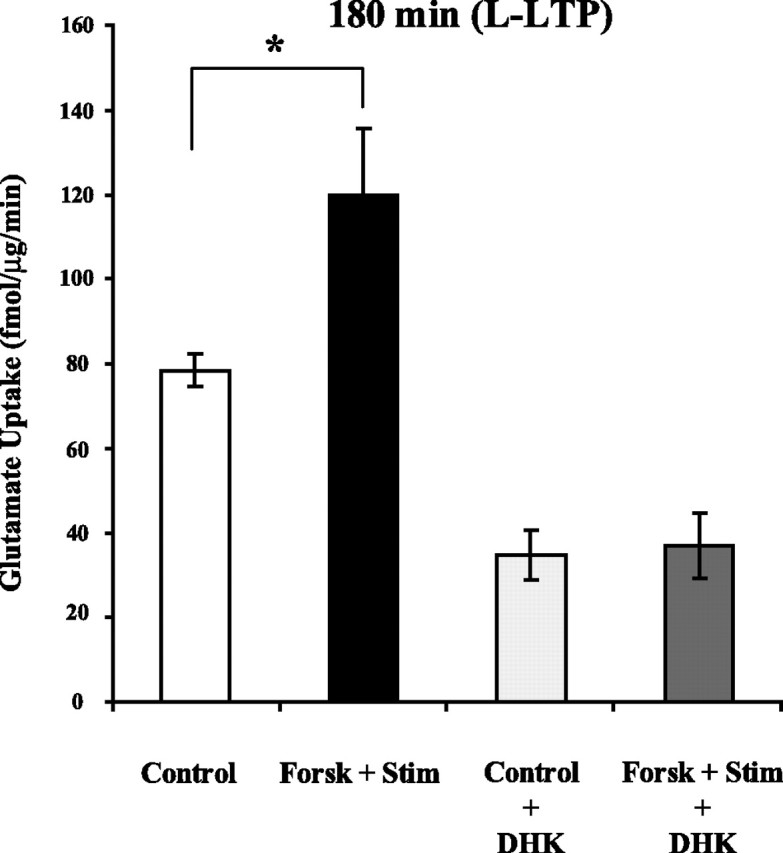
DHK blocked the increase in glutamate uptake during L-LTP induced by forskolin plus test stimulation. Glutamate uptake in slices was significantly increased 180 min after treatment with forskolin plus test stimulation. DHK (500 μm) applied during the measurement of glutamate uptake reduced basal glutamate uptake and inhibited the increase in glutamate uptake observed 180 min after treatment with forskolin plus test stimulation. Data were analyzed using a one-way ANOVA (F(3,20) = 16.5; p < 0.001), and post hoc analysis was done by Tukey–Kramer's test. *Statistically different, p < 0.05. Error bars indicate SEM. Forsk, Forskolin; Stim, test stimulation.
PKA activity was necessary for HFS to increase glutamate uptake during L-LTP
To further test that the cAMP signaling pathway mediates the induction of the increase in glutamate uptake during L-LTP, two different inhibitors, KT5720 and Rp-cAMPs, were used to block PKA. Slices were treated with KT5720 (1 μm) or Rp-cAMPs (100 μm) for 30 min starting 15 min before HFS. As shown by others, the late phase of LTP induced by HFS was blocked by KT5720 or Rp-cAMPs (Fig. 7A) (Frey et al., 1993; Huang and Kandel, 1994). As shown in Figure 7B, the increase in glutamate uptake normally observed 180 min after HFS was blocked by KT5720 (12.9 ± 10.9%, n = 6, p = 0.39) or Rp-cAMPs (−3.7 ± 9.8%, n = 4, p = 0.73). KT5720 or Rp-cAMPs treatments by themselves for 30 min had no effect on glutamate uptake measured 180 min after addition of the inhibitors (data not shown). Together, the results obtained using forskolin and the analog of cAMP to induce the increases in glutamate uptake, DHK to block the increases in glutamate uptake produced by HFS or by forskolin, KT5720 or Rp-cAMPs to inhibit PKA, and others showing that HFS can elevate cAMP (Chetkovich and Sweatt, 1993), demonstrated that the cAMP–PKA signaling pathway, mediates, at least in part, the induction of the long-term increase of glutamate uptake produced by HFS. The requirement for test stimulation while elevating cAMP with forskolin or the analog of cAMP suggests that other signaling pathways such as intracellular Ca2+ are required along with the cAMP–PKA pathway to elicit the long-term increase in glutamate uptake.
Figure 7.

Inhibiting PKA activity blocked the increase in glutamate uptake during L-LTP. A, Two different inhibitors of PKA, KT5720 (1 μm; n = 5), and Rp-cAMPs (100 μm; n = 4), for 30 min starting 15 min before HFS, prevented the induction of L-LTP without affecting E-LTP. LTP data for HFS (open boxes) were taken from Figure 1B. B, KT5720 (1 μm) or Rp-cAMPs (100 μm) for 30 min starting 15 min before HFS blocked the increase in glutamate uptake observed 180 min after HFS. KT5720 or Rp-cAMPs treatments by themselves for 30 min had no effect on glutamate uptake. Data were analyzed using a one-way ANOVA (F(2,13) = 5.66; p < 0.05), and post hoc analysis was done by Tukey–Kramer's test. *Statistically different, p < 0.05. Error bars indicate SEM.
Activation of PKC produces short-term but not long-term changes in glutamate uptake
Activation of PKC with the phorbol ester PDA produces a short-term increase in glutamate uptake (Levenson et al., 2002). Furthermore, Levenson et al. (2002) demonstrated that EAAC1 was increased 30 min after HFS or PDA (also see Fig. 4C). Previous work has shown that chelerythrine and GF 109203X selectively inhibits PKC activity in hippocampal cells (Toullec et al., 1991; Cabell and Audesirk, 1993). To further test the role of PKC activation in mediating the increase in glutamate uptake by HFS during E-LTP, chelerythrine (10 μm) or GF 109203X (0.5 μm) was used to inhibit PKC activation during HFS. Slices were treated with chelerythrine (10 μm) or GF 109203X for 30 min starting 15 min before HFS. As shown by others, LTP induction by HFS was decreased when PKC activity was inhibited by chelerythrine or GF 109203X (Fig. 8A). The increase in glutamate uptake induced 30 min after HFS (77.3 ± 21.8%; n = 5; p < 0.01 in DMSO control) was blocked by chelerythrine (7.2 ± 9.9%; n = 5; p = 0.65) and by GF 109203X (−0.1 ± 7.0%; n = 5; p = 0.86) (Fig. 8B). Chelerythrine (10 μm) or GF 109203X (0.5 μm) treatments by themselves for 30 min had no effect on glutamate uptake of control slices measured 30 min later (data not shown). Together, the results using phorbol ester to activate PKC (Levenson et al., 2002), and using chelerythrine and GF 109203X to inhibit PKC, demonstrated that activation of PKC is necessary and sufficient for the induction of the short-term increase of glutamate uptake produced by HFS.
Figure 8.
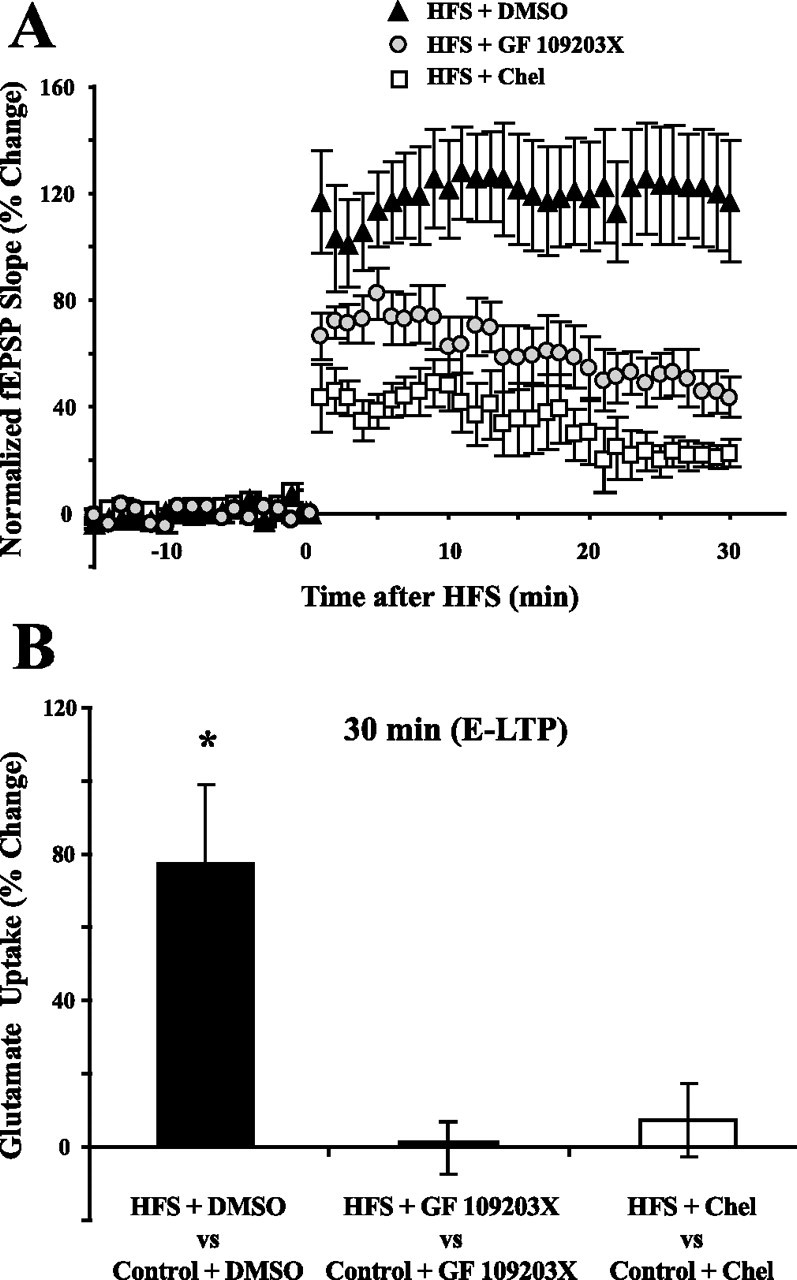
Inhibitors of PKC blocked the increase in glutamate uptake during E-LTP. A, Two different inhibitors of PKC, Chelerythrine (10 μm) and GF 109203X (0.5 μm), had inhibitory effects on the induction of E-LTP (n = 5). Chelerythrine and GF 109203X were applied from 15 min before HFS to 15 min after HFS. B, The two different PKC inhibitors applied during HFS blocked the increase in glutamate uptake observed 30 min after HFS (n = 5 for each inhibitor). Chelerythrine or GF 109203X treatments by themselves for 30 min had no effect on glutamate uptake measured 30 min later (data not shown). Data were analyzed using a one-way ANOVA (F(2,12) = 8.8; p < 0.01), and post hoc analysis was done by Tukey–Kramer's test. *Statistically different, p < 0.05. Error bars indicate SEM. Chel, Chelerythrine.
Because changes in glutamate uptake during E-LTP elicited by HFS were not blocked by DHK, we investigated whether the increase in glutamate uptake 30 min after PDA was sensitive to DHK. PDA for 30 min elicited a transient synaptic potentiation (Fig. 9A). DHK applied during the measurement of glutamate uptake 30 min after PDA did not inhibit the increase in glutamate uptake normally observed during E-LTP (52.5 ± 9.9%; n = 6; p < 0.01) (Fig. 9B).
Figure 9.

Phorbol ester, PDA, induced only a short-term increase in glutamate that was not blocked by DHK. A, PDA (3 μm), a phorbol ester that activates PKC, was given for 30 min after baseline recording (n = 6). PDA induced a transient potentiation. B, PDA induced a significant short-term increase in glutamate uptake during E-LTP, which was not blocked by DHK (500 μm) during measurement of glutamate uptake (t = 5.6; p < 0.01; n = 6). C, PDA (3 μm) given for 30 min after 20 min of baseline recording did not produce a long-term increase in glutamate uptake (t = 2.0; p = 0.09; n = 6). Data were analyzed using two-tailed paired t test. *Statistically different, p < 0.05. Error bars indicate SEM.
Thus far, we have shown that PDA produces an increase in glutamate uptake during E-LTP. Does activation of the PKC signaling pathway produce an increase in glutamate uptake during L-LTP? PDA applied for 30 min did not produce significant changes in glutamate uptake during L-LTP (−8.8 ± 4.1%; n = 6; p = 0.09) (Fig. 9C). Thus, our results suggest that activation of different signaling pathways are responsible for the increases in glutamate uptake during different phases of LTP (PKC for E-LTP vs PKA for L-LTP).
Discussion
Increases in glutamate uptake occurred rapidly after HFS and, importantly, persisted for an additional 3 h. Previously, glutamate diffusion models predicted that glutamate does not penetrate very far because of glutamate uptake that prevents diffusion of glutamate deep into the slice (Garthwaite, 1985). Therefore, what glutamate uptake was measured by labeling slices with radioactive glutamate? First, the glutamate uptake that is altered in our experiments is attributable to Na+-dependent high-affinity glutamate transporters. Second, the increases in uptake we measured during E-LTP are the same with and without DHK (Fig. 4A). Thus, although DHK should block a lot of the peripheral (buffering) uptake, we obtained the same answer when the penetration of glutamate was increased by the presence of DHK. Third, it is possible that only a portion of the slice gets potentiated. However, the change induced in glutamate transporter activity in this portion of the tissue is large enough to be observed molecularly through changes in levels of transporters and biochemically through changes in glutamate uptake. Finally, there is a major correlation between the synaptic physiology (i.e., properties of LTP) and the properties of the glutamate transporter we are studying. This correlation indicates that our uptake measurements are connected with the synaptic plasticity elicited by HFS. In support of this, contextual fear conditioning also produces an increase in glutamate uptake in synaptosomes prepared from CA1 (Levenson et al., 2002).
The parallel time courses of the increase in glutamate uptake and LTP (Fig. 1) suggests that the regulation of high-affinity glutamate transporters is important at all phases of this form of synaptic plasticity in the hippocampus. LTP is a very rapid phenomenon that appears immediately after HFS. Our results suggest the possibility that glutamate uptake also changes immediately after HFS, but technically we were unable to resolve changes in glutamate uptake sooner than a few minutes after HFS. The persistent increase in glutamate uptake observed for at least 3 h after HFS indicates that glutamate uptake might be increased as long as the plasticity or memory lasts.
During induction of E-LTP, NMDA receptor activation leads to an increase in intracellular Ca2+ that is responsible for activation of various kinases including Ca2+/calmodulin-dependent kinase (CaMKII), PKC, and PKA (Sweatt, 1999). We, along with Levenson et al. (2002), presented evidence showing that activation of PKC and the transporter EAAC1 play a major role in mediating the increase in glutamate uptake that occurs during E-LTP. Additionally, activation of PKC increased activity and membrane expression of EAAC1 (but not GLT1) in C6 glioma cells (Davis et al., 1998; Tan et al., 1999; Gonzalez et al., 2002, 2003). Therefore, PKC and EAAC1 appear to be involved in mediating the effect of HFS on glutamate uptake during E-LTP. However, PKA may not be involved during E-LTP, because forskolin did not induce an increase in glutamate uptake during E-LTP but it did during L-LTP (Fig. 5B,C). The role of CaMKII in regulation of glutamate uptake during E-LTP remains to be investigated.
Induction of L-LTP occurs also via the increase in intracellular Ca2+ triggered by NMDA activation during HFS. This Ca2+ increase leads to activation of adenylate cyclase, PKA, and gene expression required for L-LTP (Deisseroth et al., 1996; Huang et al., 2000; Poser and Storm, 2001). Signaling pathways similar to those that induce L-LTP appear to be involved in mediating the long-term increase in glutamate uptake. Macromolecular synthesis was required for the increase in glutamate uptake during L-LTP, and the cAMP–PKA signaling pathway appears to mediate the induction of the increase in glutamate uptake associated with L-LTP. Activation of PKC with PDA did not induce long-term changes in glutamate uptake (Fig. 9C). Additionally, PKA activation increases expression of GLT1 but has no effect on EAAC1 in cultured astrocytes (Schlag et al., 1998; Guillet et al., 2005). Therefore, different signaling pathways are involved in triggering the increases in glutamate uptake that occur during E-LTP (PKC) and during L-LTP (PKA).
Different glutamate transporters appear to be responsible for the increase in glutamate uptake during E-LTP and during L-LTP. The level of the neuronal glutamate transporter, EAAC1, was increased in the membrane 30 min after HFS, but GLT1a was not increased at this time. On the other hand, GLT1a but not EAAC1 or GLT1b was increased during L-LTP. Consistent with these results, the increase in glutamate uptake during L-LTP produced by HFS or forskolin was blocked by DHK, but the increase during E-LTP produced by HFS and phorbol ester was not blocked by DHK. Although DHK did not block the increase in glutamate uptake during E-LTP, DHK was effective because it did block a large percentage of the basal glutamate uptake during E-LTP.
To have a persistent change in synaptic strength, the transient E-LTP must be followed by L-LTP. Our results suggest that the regulation of glutamate uptake persisted by switching the transporters that mediate the increases in glutamate uptake from EAAC1 during E-LTP to GLT1a during L-LTP. The change in the involvement from EAAC1 to GLT1a suggests that regulation of the two different transporters may have different functions and/or function in different places. The early increase in glutamate uptake mediated by EAAC1 during E-LTP, which may occur in postsynaptic neurons, could prevent glutamate receptor desensitization during high-frequency activity or limit the extrasynaptic diffusion of glutamate. The late increase in glutamate uptake mediated by GLT1a may occur in extensions of glial processes or neuronal processes and may help to prevent spillover, ensure a supply of glutamate for the presynaptic terminal, as well as reduce receptor desensitization. Alternatively, the switch in transporters may relate to different half-lives of transporters, with GLT1a perhaps having a longer half-life than EAAC1.
GLT1a but not GLT1b was increased during the late increase in glutamate uptake after HFS. The differential regulation of the GLT1 isoforms also suggests that these different transporters might have different functions, locations, or regulation. No differences have been detected in the basic transport functions of the two transporters (Sullivan et al., 2004). However, the difference in the C terminus of these two transporters is consistent with different locations or regulation of the two transporters (Berger et al., 2005).
Several previous studies found that the astrocytic glutamate transporter current does not change during E-LTP. Glial glutamate transporter currents (or membrane depolarization of astrocytes) were used to analyze glutamate release from the presynaptic terminals during E-LTP (Diamond et al., 1998; Luscher et al., 1998; Kawamura et al., 2004). In these experiments, the astrocytic glutamate transporter current was induced by glutamate that escapes the synapse after presynaptic stimulation. If glutamate uptake by astrocytes were increased, one would predict that an increase in astrocytic glutamate transporter current should be observed. However, it is possible that no changes in the glutamate transporter current were observed in previous experiments, because the currents were recorded during E-LTP, whereas our experiments predict that glutamate transporter currents in astrocytes would change only during L-LTP.
Our data suggest that there may actually be at least three phases of increase in glutamate uptake that occurs, each phase induced by different mechanisms. The HFS induced increases in glutamate uptake were smaller at 2.5 and 7.5 min than at 30 min after HFS. This may indicate that different mechanisms are also responsible for the expression of the increase in glutamate uptake between earlier and later phases of E-LTP. At 30 min, the increase in glutamate uptake seems to be mediated by insertion of transporters from a reserve pool, whereas phosphorylation of transporters already in the plasma membrane could account for a rapid increase in uptake that occurs within a few minutes of HFS (Fig. 1C) (Levenson et al., 2002). Phosphorylation of transporters has been shown to rapidly increase glutamate transporter activity (Davis et al., 1998; Gonzalez et al., 2002, 2003). The persistence of the increase in glutamate uptake as well as LTP for 3 h required transcription and translation but translation was not required for such increases during E-LTP (Fig. 3) (Frey et al., 1988, 1996; Huang and Kandel, 1994; Kang and Schuman, 1996). New glutamate transporters may have to be synthesized to produce the increase in glutamate uptake during L-LTP. Alternatively, gene expression of molecules other than glutamate transporters might be required for the induction of the long-term increase in glutamate uptake rather than for the synthesis of new glutamate transporters during L-LTP.
The regulation of glutamate uptake appears to be an important component of plasticity at glutamatergic synapses. Regulation of glutamate uptake may have several different functions depending on the particular type of plasticity and time domain in which it is involved. In the future, it will be important to determine the different signaling molecules, locations, and functions of the increases in glutamate uptake that occur during the different phases of LTP. In addition, the study of the regulation of glutamate uptake in other synaptic plasticities induced by neurodegenerative disorders or drug addictions may contribute to future therapeutic approaches for these conditions.
Footnotes
This work was supported by National Institutes of Health Grant NS42156 (A.E.). We thank Dr. Lisa Lyons for helpful discussions of experiments and comments on this manuscript.
References
- Abel T, Nguyen PV, Barad M, Deuel TA, Kandel ER, Bourtchouladze R. Genetic demonstration of a role for PKA in the late phase of LTP and in hippocampus-based long-term memory. Cell. 1997;88:615–626. doi: 10.1016/s0092-8674(00)81904-2. [DOI] [PubMed] [Google Scholar]
- Arriza JL, Fairman WA, Wadiche JI, Murdoch GH, Kavanaugh MP, Amara SG. Functional comparisons of three glutamate transporter subtypes cloned from human motor cortex. J Neurosci. 1994;14:5559–5569. doi: 10.1523/JNEUROSCI.14-09-05559.1994. [DOI] [PMC free article] [PubMed] [Google Scholar]
- Berger UV, DeSilva TM, Chen W, Rosenberg PA. Cellular and subcellular mRNA localization of glutamate transporter isoforms GLT1a and GLT1b in rat brain by in situ hybridization. J Comp Neurol. 2005;492:78–89. doi: 10.1002/cne.20737. [DOI] [PMC free article] [PubMed] [Google Scholar]
- Bliss TV, Collingridge GL. A synaptic model of memory: long-term potentiation in the hippocampus. Nature. 1993;361:31–39. doi: 10.1038/361031a0. [DOI] [PubMed] [Google Scholar]
- Cabell L, Audesirk G. Effects of selective inhibition of protein kinase C, cyclic AMP-dependent protein kinase, and Ca2+-calmodulin-dependent protein kinase on neurite development in cultured rat hippocampal neurons. Int J Dev Neurosci. 1993;11:357–368. doi: 10.1016/0736-5748(93)90007-z. [DOI] [PubMed] [Google Scholar]
- Chavez-Noriega LE, Stevens CF. Modulation of synaptic efficacy in field CA1 of the rat hippocampus by forskolin. Brain Res. 1992;574:85–92. doi: 10.1016/0006-8993(92)90803-h. [DOI] [PubMed] [Google Scholar]
- Chen W, Aoki C, Mahadomrongkul V, Gruber CE, Wang GJ, Blitzblau R, Irwin N, Rosenberg PA. Expression of a variant form of the glutamate transporter GLT1 in neuronal cultures and in neurons and astrocytes in the rat brain. J Neurosci. 2002;22:2142–2152. doi: 10.1523/JNEUROSCI.22-06-02142.2002. [DOI] [PMC free article] [PubMed] [Google Scholar]
- Chen W, Mahadomrongkul V, Berger UV, Bassan M, DeSilva T, Tanaka K, Irwin N, Aoki C, Rosenberg PA. The glutamate transporter GLT1a is expressed in excitatory axon terminals of mature hippocampal neurons. J Neurosci. 2004;24:1136–1148. doi: 10.1523/JNEUROSCI.1586-03.2004. [DOI] [PMC free article] [PubMed] [Google Scholar]
- Chetkovich DM, Sweatt JD. nMDA receptor activation increases cyclic AMP in area CA1 of the hippocampus via calcium/calmodulin stimulation of adenylyl cyclase. J Neurochem. 1993;61:1933–1942. doi: 10.1111/j.1471-4159.1993.tb09836.x. [DOI] [PubMed] [Google Scholar]
- Danbolt NC. Glutamate uptake. Prog Neurobiol. 2001;65:1–105. doi: 10.1016/s0301-0082(00)00067-8. [DOI] [PubMed] [Google Scholar]
- Davis KE, Straff DJ, Weinstein EA, Bannerman PG, Correale DM, Rothstein JD, Robinson MB. Multiple signaling pathways regulate cell surface expression and activity of the excitatory amino acid carrier 1 subtype of Glu transporter in C6 glioma. J Neurosci. 1998;18:2475–2485. doi: 10.1523/JNEUROSCI.18-07-02475.1998. [DOI] [PMC free article] [PubMed] [Google Scholar]
- Deisseroth K, Bito H, Tsien RW. Signaling from synapse to nucleus: postsynaptic CREB phosphorylation during multiple forms of hippocampal synaptic plasticity. Neuron. 1996;16:89–101. doi: 10.1016/s0896-6273(00)80026-4. [DOI] [PubMed] [Google Scholar]
- Diamond JS, Bergles DE, Jahr CE. Glutamate release monitored with astrocyte transporter currents during LTP. Neuron. 1998;21:425–433. doi: 10.1016/s0896-6273(00)80551-6. [DOI] [PubMed] [Google Scholar]
- Frey U, Huang YY, Kandel ER. Effects of cAMP simulate a late stage of LTP in hippocampal CA1 neurons. Science. 1993;260:1661–1664. doi: 10.1126/science.8389057. [DOI] [PubMed] [Google Scholar]
- Frey U, Krug M, Reymann KG, Matthies H. Anisomycin, an inhibitor of protein synthesis, blocks late phases of LTP phenomena in the hippocampal CA1 region in vitro. Brain Res. 1988;452:57–65. doi: 10.1016/0006-8993(88)90008-x. [DOI] [PubMed] [Google Scholar]
- Frey U, Frey S, Schollmeier F, Krug M. Influence of actinomycin D, a RNA synthesis inhibitor, on long-term potentiation in rat hippocampal neurons in vivo and in vitro. J Physiol (Lond) 1996;490:703–711. doi: 10.1113/jphysiol.1996.sp021179. [DOI] [PMC free article] [PubMed] [Google Scholar]
- Garthwaite J. Cellular uptake disguises action of l-glutamate on N-methyl-d-aspartate receptors. With an appendix: diffusion of transported amino acids into brain slices. Br J Pharmacol. 1985;85:297–307. doi: 10.1111/j.1476-5381.1985.tb08860.x. [DOI] [PMC free article] [PubMed] [Google Scholar]
- Gonzalez MI, Kazanietz MG, Robinson MB. Regulation of the neuronal glutamate transporter excitatory amino acid carrier-1 (EAAC1) by different protein kinase C subtypes. Mol Pharmacol. 2002;62:901–910. doi: 10.1124/mol.62.4.901. [DOI] [PubMed] [Google Scholar]
- Gonzalez MI, Bannerman PG, Robinson MB. Phorbol myristate acetate-dependent interaction of protein kinase Cα and the neuronal glutamate transporter EAAC1. J Neurosci. 2003;23:5589–5593. doi: 10.1523/JNEUROSCI.23-13-05589.2003. [DOI] [PMC free article] [PubMed] [Google Scholar]
- Guillet BA, Velly LJ, Canolle B, Masmejean FM, Nieoullon AL, Pisano P. Differential regulation by protein kinases of activity and cell surface expression of glutamate transporters in neuron-enriched cultures. Neurochem Int. 2005;46:337–346. doi: 10.1016/j.neuint.2004.10.006. [DOI] [PubMed] [Google Scholar]
- Harris EW, Ganong AH, Cotman CW. Long-term potentiation in the hippocampus involves activation of N-methyl-d-aspartate receptors. Brain Res. 1984;323:132–137. doi: 10.1016/0006-8993(84)90275-0. [DOI] [PubMed] [Google Scholar]
- Heynen AJ, Quinlan EM, Bae DC, Bear MF. Bidirectional, activity-dependent regulation of glutamate receptors in the adult hippocampus in vivo. Neuron. 2000;28:527–536. doi: 10.1016/s0896-6273(00)00130-6. [DOI] [PubMed] [Google Scholar]
- Huang YY, Kandel ER. Recruitment of long-lasting and protein kinase A-dependent long-term potentiation in the CA1 region of hippocampus requires repeated tetanization. Learn Mem. 1994;1:74–82. [PubMed] [Google Scholar]
- Huang YY, Martin KC, Kandel ER. Both protein kinase A and mitogen-activated protein kinase are required in the amygdala for the macromolecular synthesis-dependent late phase of long-term potentiation. J Neurosci. 2000;20:6317–6325. doi: 10.1523/JNEUROSCI.20-17-06317.2000. [DOI] [PMC free article] [PubMed] [Google Scholar]
- Huang YY, Zakharenko SS, Schoch S, Kaeser PS, Janz R, Sudhof TC, Siegelbaum SA, Kandel ER. Genetic evidence for a protein-kinase-A-mediated presynaptic component in NMDA-receptor-dependent forms of long-term synaptic potentiation. Proc Natl Acad Sci USA. 2005;102:9365–9370. doi: 10.1073/pnas.0503777102. [DOI] [PMC free article] [PubMed] [Google Scholar]
- Kang H, Schuman EM. A requirement for local protein synthesis in neurotrophin-induced hippocampal synaptic plasticity. Science. 1996;273:1402–1406. doi: 10.1126/science.273.5280.1402. [DOI] [PubMed] [Google Scholar]
- Katagiri H, Tanaka K, Manabe T. Requirement of appropriate glutamate concentrations in the synaptic cleft for hippocampal LTP induction. Eur J Neurosci. 2001;14:547–553. doi: 10.1046/j.0953-816x.2001.01664.x. [DOI] [PubMed] [Google Scholar]
- Kawamura Y, Manita S, Nakamura T, Inoue M, Kudo Y, Miyakawa H. Glutamate release increases during mossy-CA3 LTP but not during Schaffer-CA1 LTP. Eur J Neurosci. 2004;19:1591–1600. doi: 10.1111/j.1460-9568.2004.03258.x. [DOI] [PubMed] [Google Scholar]
- Lebrun B, Sakaitani M, Shimamoto K, Yasuda-Kamatani Y, Nakajima T. New β-hydroxyaspartate derivatives are competitive blockers for the bovine glutamate/aspartate transporter. J Biol Chem. 1997;272:20336–20339. doi: 10.1074/jbc.272.33.20336. [DOI] [PubMed] [Google Scholar]
- Levenson J, Weeber E, Selcher JC, Kategaya LS, Sweatt JD, Eskin A. Long-term potentiation and contextual fear conditioning increase neuronal glutamate uptake. Nat Neurosci. 2002;5:155–161. doi: 10.1038/nn791. [DOI] [PubMed] [Google Scholar]
- Levenson J, Endo S, Kategaya LS, Fernandez RI, Brabham DG, Chin J, Byrne JH, Eskin A. Long-term regulation of neuronal high-affinity glutamate and glutamine uptake in Aplysia. Proc Natl Acad Sci USA. 2000;97:12858–12863. doi: 10.1073/pnas.220256497. [DOI] [PMC free article] [PubMed] [Google Scholar]
- Luscher C, Malenka RC, Nicoll RA. Monitoring glutamate release during LTP with glial transporter currents. Neuron. 1998;21:435–441. doi: 10.1016/s0896-6273(00)80552-8. [DOI] [PubMed] [Google Scholar]
- Maleszka R, Helliwell P, Kucharski R. Pharmacological interference with glutamate re-uptake impairs long-term memory in the honeybee, Apis mellifera. Behav Brain Res. 2000;115:49–53. doi: 10.1016/s0166-4328(00)00235-7. [DOI] [PubMed] [Google Scholar]
- Morris RG, Anderson E, Lynch GS, Baudry M. Selective impairment of learning and blockade of long-term potentiation by an N-methyl-d-aspartate receptor antagonist, AP5. Nature. 1986;319:774–776. doi: 10.1038/319774a0. [DOI] [PubMed] [Google Scholar]
- Nayak A, Zastrow DJ, Lickteig R, Zahniser NR, Browning MD. Maintenance of late-phase LTP is accompanied by PKA-dependent increase in AMPA receptor synthesis. Nature. 1998;394:680–683. doi: 10.1038/29305. [DOI] [PubMed] [Google Scholar]
- Nguyen PV, Kandel ER. A macromolecular synthesis-dependent late phase of long-term potentiation requiring cAMP in the medial perforant pathway of rat hippocampal slices. J Neurosci. 1996;16:3189–3198. doi: 10.1523/JNEUROSCI.16-10-03189.1996. [DOI] [PMC free article] [PubMed] [Google Scholar]
- Nguyen PV, Abel T, Kandel ER. Requirement of a critical period of transcription for induction of a late phase of LTP. Science. 1994;265:1104–1107. doi: 10.1126/science.8066450. [DOI] [PubMed] [Google Scholar]
- Otmakhov N, Khibnik L, Otmakhova N, Carpenter S, Riahi S, Asrican B, Lisman J. Forskolin-induced LTP in the CA1 hippocampal region is NMDA receptor dependent. J Neurophysiol. 2004;91:1955–1962. doi: 10.1152/jn.00941.2003. [DOI] [PubMed] [Google Scholar]
- Poser S, Storm DR. Role of Ca2+-stimulated adenylyl cyclases in LTP and memory formation. Int J Dev Neurosci. 2001;19:387–394. doi: 10.1016/s0736-5748(00)00094-0. [DOI] [PubMed] [Google Scholar]
- Rothstein JD, Martin L, Levey AI, Dykes-Hoberg M, Jin L, Wu D, Nash N, Kuncl RW. Localization of neuronal and glial glutamate transporters. Neuron. 1994;13:713–725. doi: 10.1016/0896-6273(94)90038-8. [DOI] [PubMed] [Google Scholar]
- Rothstein JD, Dykes-Hoberg M, Pardo CA, Bristol LA, Jin L, Kuncl RW, Kanai Y, Hediger MA, Wang Y, Schielke JP, Welty DF. Knockout of glutamate transporters reveals a major role for astroglial transport in excitotoxicity and clearance of glutamate. Neuron. 1996;16:675–686. doi: 10.1016/s0896-6273(00)80086-0. [DOI] [PubMed] [Google Scholar]
- Schlag BD, Vondrasek JR, Munir M, Kalandadze A, Zelenaia OA, Rothstein JD, Robinson MB. Regulation of the glial Na+-dependent glutamate transporters by cyclic AMP analogs and neurons. Mol Pharmacol. 1998;53:355–369. doi: 10.1124/mol.53.3.355. [DOI] [PubMed] [Google Scholar]
- Shen Y, Linden DJ. Long-term potentiation of neuronal glutamate transporters. Neuron. 2005;46:715–722. doi: 10.1016/j.neuron.2005.04.033. [DOI] [PubMed] [Google Scholar]
- Shimamoto K, Lebrun B, Yasuda-Kamatani Y, Sakaitani M, Shigeri Y, Yumoto N, Nakajima T. dl-Threo-β-benzyloxyaspartate, a potent blocker of excitatory amino acid transporters. Mol Pharmacol. 1998;53:195–201. doi: 10.1124/mol.53.2.195. [DOI] [PubMed] [Google Scholar]
- Sullivan R, Rauen T, Fischer F, Wiessner M, Grewer C, Bicho A, Pow DV. Cloning, transport properties, and differential localization of two splice variants of GLT-1 in the rat CNS: implications for CNS glutamate homeostasis. Glia. 2004;45:155–169. doi: 10.1002/glia.10317. [DOI] [PubMed] [Google Scholar]
- Sweatt JD. Toward a molecular explanation for long-term potentiation. Learn Mem. 1999;6:399–416. doi: 10.1101/lm.6.5.399. [DOI] [PubMed] [Google Scholar]
- Tan J, Zelenaia O, Correale D, Rothstein JD, Robinson MB. Expression of the GLT-1 subtype of Na+-dependent glutamate transporter: pharmacological characterization and lack of regulation by protein kinase C. J Pharmacol Exp Ther. 1999;289:1600–1610. [PubMed] [Google Scholar]
- Toullec D, Pianetti P, Coste H, Bellevergue P, Grand-Perret T, Ajakane M, Baudet V, Boissin P, Boursier E, Loriolle F, et al. The bisindolylmaleimide GF 109203X is a potent and selective inhibitor of protein kinase C. J Biol Chem. 1991;266:15771–15781. [PubMed] [Google Scholar]
- Xu NJ, Bao L, Fan HP, Bao GB, Pu L, Lu YJ, Wu CF, Zhang X, Pei G. Morphine withdrawal increases glutamate uptake and surface expression of glutamate transporter GLT1 at hippocampal synapses. J Neurosci. 2003;23:4775–4784. doi: 10.1523/JNEUROSCI.23-11-04775.2003. [DOI] [PMC free article] [PubMed] [Google Scholar]
- Yang CH, Huang CC, Hsu KS. Behavioral stress enhances hippocampal CA1 long-term depression through the blockade of the glutamate uptake. J Neurosci. 2005;25:4288–4293. doi: 10.1523/JNEUROSCI.0406-05.2005. [DOI] [PMC free article] [PubMed] [Google Scholar]