

Abstract
Ageing research has focused either on assessing organ- and tissue-based changes, such as lung capacity and cardiac function, or on changes at the molecular scale such as gene expression, epigenetic modifications and metabolism. Here, by using a cohort of 32 samples of primary dermal fibroblasts collected from individuals between 2 and 96 years of age, we show that the degradation of functional cellular biophysical features—including cell mechanics, traction strength, morphology and migratory potential—and associated descriptors of cellular heterogeneity predict cellular age with higher accuracy than conventional biomolecular markers. We also demonstrate the use of high-throughput single-cell technologies, together with a deterministic model based on cellular features, to compute the cellular age of apparently healthy males and females, and to explore these relationships in cells from individuals with Werner syndrome and Hutchinson-Gilford progeria syndrome, two rare genetic conditions that result in phenotypes that show aspects of premature ageing. Our findings suggest that the quantification of cellular age may be used to stratify individuals on the basis of cellular phenotypes and serve as a biological proxy of healthspan.
Ageing is a multifaceted, temporal process of functional deterioration and progressive decline across multiple organs and tissues1,2. These changes arise in part from the progressive accumulation of cellular damage and tissue dysfunction1, which results in pathophysiological phenotypic transformations. In humans, biological age is an important risk factor for numerous pathologies and chronic disease states, many of which negatively impact human healthspan and survival2,3. Moreover, many diseases that were considered disparate in the fundamental mechanisms of their progression have more recently been understood to be connected through ageing1,4. Recent developments in geroscience—the study of how biological ageing relates to chronic disease manifestation and healthspan—have prompted efforts to develop methods to determine the biological age of individuals, with the hope that resulting correlates will help facilitate interventions that could delay the onset of chronic age-related diseases2,4–7. Here biological age is defined as the ongoing longitudinal changes that determine the functional healthspan and survival of individuals, typically measured at the clinical level.
For decades, ageing research has been primarily focused on the progressive changes that occur at either the molecular scale, such as changes in genetic, epigenetic and metabolic states, or at larger tissue-level scales, such as changes in muscle physiology and cardiac function. Paradoxically, changes at the intermediate length scales of cells themselves, which we term here as biophysical properties, have been understudied. Importantly, age-related biophysical changes may well drive many observed progressive dysfunctional tissue changes8. Multivariate determination of biological age at the clinical level (patient scale) via measures such as total cholesterol, mean arterial pressure, lung capacity and grip strength, provide a robust solution to assess the biological age in humans2. However, these changes tend to be secondary to changes in the cells themselves, thus advocating the value of cell-based technologies to assess biological age9,10.
Dysfunctions that resonate at the cellular level often have profound effects on the functional decline of organisms, and furthermore enhance their susceptibility to various pathologies, including cancer, cardiovascular disease and frailty11–13. Hence, the integrative nature of cells and tissues captured in biophysical cellular measurements, cell mechanics, cell migration, cell morphology and so on, may better capture a variety of perturbations in underlying molecular networks that foster ensemble effects in gross cellular behaviour and properties. Indeed, large differences in gene expression or epigenetic profiles of isogenic individual cells can lead to similar properties14 (that is, similar cell motility or morphology), while highly similar proteomic profiles can lead to significantly different overall cell properties due, for instance, to dynamic, stochastic differences in protein location within the cells (non-measurable) or subtle differences in phosphorylation status. Hence instead of only profiling the molecular changes of cells, either in bulk or at the single-cell level, here we comprehensively assess both the molecular and cellular functions themselves, by way of cellular biophysical characteristics, considered here as ‘integrators’ of these molecular differences.
We hypothesize that specific biophysical features encoded in cells can determine the ‘cellular biological age, ultimately shedding light on the ageing process, and its role in the overall functional decline, and the development of chronic disease states in older adults. Furthermore, because cellular biophysics represents the ensemble orchestration of many molecular inputs, biophysical features may predict the cellular biological age with more accuracy relative to biomolecular features. To preserve information about cell-to-cell variation and its potential role in ageing, and to provide an unbiased comparison, both biophysical and conventional biomolecular characteristics of hundreds of cells were assessed (most at the single-cell level), and the contribution of heterogeneity to the cellular ageing of apparently healthy individuals and those with ‘accelerated/premature ageing’ disorders was determined.
Results
To decipher key cellular properties that undergo significant changes with increasing age1,15,16, we procured a panel of primary human dermal fibroblasts from 32 individuals ranging in chronological age from 2 to 96 years old, from the Coriell Institute’s Biobank repository (Supplementary Dataset 1, Replicative history; Supplementary Fig. 4b,c and Supplementary Table 1). Next, we probed key biophysical8 and biomolecular 1 characteristics of the cells for direct comparisons within this donor cohort. Taking this comprehensive, single-cell-based approach, donor cells were subjected to four classes of biophysical measurements, that is, cell motility (single-and multi-cell), cell mechanics (particle tracking microrheology), cellular traction strength (traction-force microscopy) and cell and nuclear morphology (high throughput cell phenotyping, HTCP), and five classes of biomolecular measurements, that is, adenosine triphosphate (ATP) content, cellular secretions, DNA damage response (DDR), nuclear organization, and cytoskeletal content and organization.
Cellular biophysics as a hallmark of ageing.
Molecular investigations have dominated ageing research with few studies focused on possible changes in cellular biophysics. Often, molecular changes lead to changes in cell functions, and in particular changes in the biophysical properties of cells, which require the orchestration and integration of multiple signalling pathways involving a myriad of molecules and proteins. Here, we conducted a series of biophysical measurements on a panel of apparently healthy donor samples (Fig. 1).
Figure 1 |. Changes in cell biophysics: a hallmark of ageing.

a-e, Biophysical assays used in the study and associated trends as a function of age. a, Single-cell motility measures cell movements on two-dimensional substrates as a function of time (n = 2; average of 115 single cells per sample). Left: Traces of cell motility paths for samples from two individuals aged 3 and 92 years old (A03 and A92). Middle: Total path for all the cells in each of these samples. Right: Scatter plots of the directional anisotropy (top) and persistence (time; bottom). All error bars in a-e represent the s.e.m. and the lines denote the best fit. The colour of each plot point indicates the sample to which it corresponds (see top of f, A02 to A92). b, Scratch wound assessment measures the multicellular movements of cells to close a void (or wound; boundaries marked in green) made in a confluent monolayer of cells (n = 2; 10 images per condition). c, Cellular traction strength measures the stresses exerted by individual cells seeded on a deformable polyacrylamide (8 kPa) substrate containing fluorescent bead markers, cell stresses are quantified by the degree of distortion of the underlying fluorescent bead-array (n = 2; 15–25 cells per condition). d, Intracellular microrheology measures the degree of cytoplasmic deformability and the viscoelastic properties of the cell (n = 3; ~3,597 particles across 9 samples). Panels 1, 2, and 3 denote the trajectories of nanoparticles embedded in the cytoplasm. MSD-1s and MSD-10s are the mean squared displacements of the nanoparticles after 1 and 10 s, respectively. e, Cellular and nuclear morphology measurements generated by the delineation of cell and nuclear boundaries on the basis of corresponding fluorescently stained cells (n = 3; 300–700 single cells per in-plate technical replicate; 2 technical replicates per sample, per trial). f, Heat map illustrating how the cellular biophysical features extracted per sample group with age; each column denotes an individual age-dependent sample and each row denotes a single biophysical parameter normalized on the basis of the z score. Using unsupervised hierarchical clustering analysis; the cellular features were clustered and reordered. The dendrogram on the left depicts the higher-order association and natural groupings that exist within the dataset. Colour-coded branches of the dendrogram illustrate eight distinct clusters in the dataset, which are based on the correlation distance among parameters. The heat map key on the left, labelled κ, denotes the colour-coded parameters on the basis of the assays from which the parameters were extracted. The heat map key on the right, labelled ρ, denotes the Pearson correlation coefficients for all measured parameters. g, Correlation analysis data showing the distribution of Pearson correlation coefficients stratified as a function of the correlation magnitude and the biophysical feature set. The red trend line shows the overall frequency of correlation coefficients independent of the specified biophysical feature set, with grey trend lines delineating the correlation distribution for biomolecular features.
Since cell migration and coordination of cellular movements play critical roles in healthy tissue and organ physiology17, we assessed the migratory propensities of dermal fibroblasts at both the single-cell18,19 and multicellular levels. Results indicated that there was not only a modest decrease in the cell speed and the distance explored by individual cells, but also a decrease in the directional persistence and anisotropy of cell movements (Fig. 1 and Supplementary Fig. 1b–j). Further analysis of these migratory trajectories using the anisotropic persistent random walk model19,20 also suggest that the cellular migratory patterns of cells from young donors, compared with those from older donors, may follow this anisotropic model more closely than the classic persistent random walk model. This is revealed and explained by properties such as the probability density functions of cellular displacements, the autocorrelation function, angular velocities and the angular displacements as a function of time lag (Supplementary Fig. 1d–j). This decline in migratory persistence was similarly manifested at the multicellular level, resulting in a decreased rate of scratch wound closure and a corresponding increase in wound half-life with increasing age (Fig. 1b and Supplementary Fig. 1a), indicating an inverse relationship between cellular migratory coordination and age.
Cells exert pushing and pulling forces on surrounding cells and their underlying substrates to facilitate many cellular functions, including their migration and extracellular matrix remodelling21,22. To determine the magnitude of mechanical (traction) stresses exerted by individual cells with respect to age, we used traction force microscopy to determine and thereby calculate the vector displacements of fluorescent bead markers embedded within the polyacrylamide gel in the local region directly beneath migratory cells23,24 (see Methods). Interestingly, cells displayed an increase in total cellular traction stresses with increasing age, as measured by the summed displacement of all fluorescent bead markers underneath the cells of interest. In addition, the index of stress disproportionality—defined here as the vector distance between the geometric centroid of the cells of interest and its corresponding stress centroid, termed stress anisotropy—indicated that cells from elderly donors displayed increased stress disproportionality relative to young donors (for details see Methods and Fig. 1c). Collectively, these results indicate that, in addition to the observed increase in cellular traction stresses observed for older-donor samples, there was an associated increase in the disproportionality and localization of cellular traction stresses within the cells.
A multitude of cellular and subcellular processes critically depend on the mechanical deformability of the cytoplasm11, from the regulation of genetic material25 to the polarization and movements of cells26. To determine the association between age and cell mechanics, we used particle-tracking microrheology to probe the changes in cytoplasmic viscoelasticity and deformability27,28. Cells derived from older adult donors tended to be stiffer (or less deformable) relative to cells derived from young donors (Fig. 1d). This increased cytoplasmic stiffness observed with increased age, measured here as the reduction in the mean squared displacements of submicrometre particles lodged within the cytoplasm (see Methods), has been shown to be largely due to increases in F-actin content and bundling11,29,30 (Fig. 2e).
Figure 2 |. Comprehensive biomolecular assessment of age-dependent cellular phenotypes.
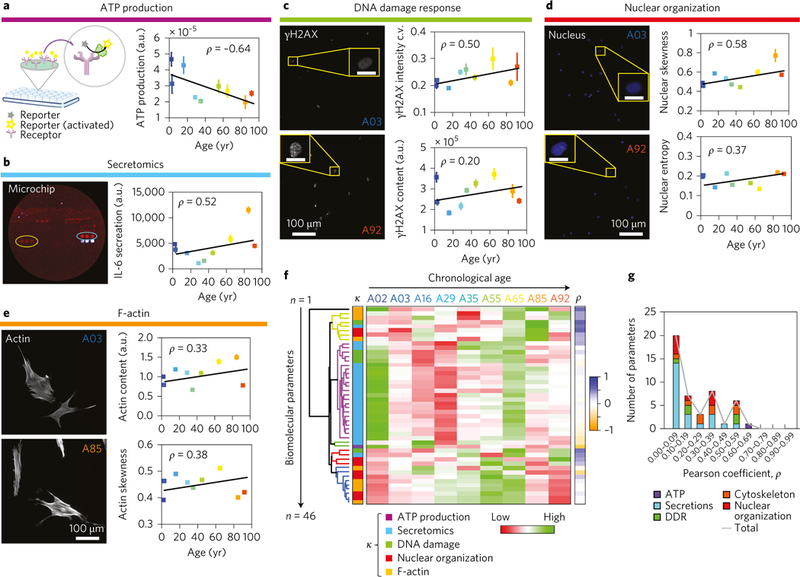
a-e, Biomolecular assays used in the present study and associated trends as a function of age. For all scatter plots (right panels), the error bars represent the s.e.m. and the lines denote the best fit. The colour of each point indicates the sample to which it corresponds (see top of f, A02 to A92; samples from individuals aged 2 to 92). a, Left: Schematic of how luminescence readings are obtained when a probe binds an ATP substrate. Right: Cellular ATP production as a function of age (n = 2; 4 wells per sample). b, Secretion profiles of 23 proteins measured using high-throughput secretome-profiling microchip technology (sample protein blot shown on left), with interleukin 6 being the top age correlate (n = 2; 20,000 cells per well). c, DDR after bleomycin exposure, as measured by the amount, organization and localization of intranuclear γH2AX foci (n = 3; 300–700 individual cells per in-plate technical replicate; 2 technical replicates per sample, per trial; same for DDR (c), nuclear organization (d) and F-actin content (e); representative fluorescence micrographs on left). d, Nuclear organization as measured by texture patterns of DNA and chromatin from Hoechst 33342 staining. e, F-actin content and organization per cell. f, Heat map illustrating all the measured age-dependent biomolecular features; each column denotes an individual and each row denotes a single biomolecular parameter. Each parameter is normalized on the basis of a zscore. Unsupervised hierarchical clustering was used to determine the natural clusters of features in the dataset, with each colour of the dendrogram branches representing a single cluster. Eight clusters were observed on the basis of the correlation distances among parameters. The heat map key on left, labelled κ, denotes the colour-coded parameters on the basis of the biomolecular assays used in the study. The heat map key on the right, labelled ρ, represents the Pearson correlation coefficients for all measured parameters. g, Correlation analysis showing the distribution of Pearson correlation coefficients stratified as a function of correlation magnitude and the biomolecular feature sets. The grey trend line shows the overall frequency of correlation coefficients independent of the specified biomolecular feature set.
To further assess age-associated biophysical changes, we evaluated the cellular and nuclear morphologies of cells by utilizing HTCP31–36. In agreement with published results, cell and nuclear size increased with age37, and the cells displayed progressively more irregularities in shape (Fig. 1e and Supplementary Fig. 2). To provide a comprehensive quantitative handle on these observations, we computed a list of morphological descriptors to better describe the complex shapes, some of which yielded strong correlations with age (see Methods and Supplementary Dataset 1, Parameter descriptions and 1D age correlations).
To decipher the fundamental association between age and cellular biophysical properties, we normalized parameters on the basis of their z score and assessed global trends to define a biophysical signature of cellular ageing (Fig. 1f and Supplementary Fig. 3a). Unsupervised hierarchical clustering analysis of the average correlation distances among features revealed seven dominant clusters within the 70 biophysical properties assessed in our experiments. Furthermore, global correlation analysis of the distributions of each parameter’s age-correlation magnitude showed (Fig. 1g) that ~50% of the biophysical parameters had absolute Pearson correlation coefficients (ρ) above 0.50, with the highest being the anisotropy of motility (ρ=0.97; Supplementary Dataset 1, 1D age correlations).
Age-altered biomolecular characteristics.
As a means to directly compare the properties and magnitudes of our ageing trends with previously published data, we conducted a series of benchmark bio-molecular experiments, many of which are considered hallmarks of ageing1. Consistent with previous mitochondrial studies, our results showed a significant linear decrease in intracellular ATP content with increasing age (ρ=–0.64; Fig. 2a)1,38–40. Prompted by the association between protein secretion levels and cellular energetics41, we next determined whether ageing affected the composition and amount of secreted molecules by utilizing a recently developed and well validated high-throughput single-cell secretion microchip technology42. Cellular secretion profiles revealed that, of the 23 proteins probed, interleukin 6, a proinflammatory cytokine, surfaced as a key protein exhibiting a significant correlation with age (ρ = 0.52; Fig. 2b). To further validate this result we compared it with previously published data42,43 and found that there was agreement (Supplementary Fig. 4a).
Next, we investigated the effects of age on DDR using HTCP31,34,44,45. We analysed the phosphorylation of histone 2a at Ser 139 (γH2AX) content, as well as the intranuclear localization of the γH2AX signal, which are both associated with the degree of DNA breakage and the number of γH2AX foci34 (see Methods and the parameter descriptions in Supplementary Dataset 1). The results indicated that after a 1 h treatment with the DNA-damaging agent bleomycin (10 μgml–1) and subsequent wash out and recovery for 1 h, there was an age-dependent response (Fig. 2c) in the intranuclear γH2AX content and signal localization (coefficient of variation (c.v.) for the γH2AX intensity), indicating an inverse relationship between the DDR rate and age46.
To determine whether this change in DDR rate could be related to changes in the organization of DNA and chromatin in the nucleus, we again used HTCP to evaluate nuclear texture features as a proxy for chromatin arrangement and compaction associated with heterochromatic (high intranuclear signal) and euchromatic (low intranuclear signal) regions. The results indicated a global reorganization of nuclear material and an increase in the frequency of high-intensity regions, as represented by parameters such as nuclear intensity skewness and nuclear intensity entropy, which exhibited correlations of 0.58 and 0.37, respectively (Fig. 2d; for details, see Methods and Supplementary Dataset 1, Parameter descriptions). These shifts suggest a directly proportional relationship between heterochromatin (transcriptionally repressed regions) and age; a similar relationship was found previously using a different method47.
Key cellular processes depend on the content and organization of the cytoskeleton11. Recent studies have suggested that through mechanotransductive mechanisms involving the cytoskeleton, cells can modulate their chromosomal organization through physical forces exerted by the dynamics of cytoskeletal proteins, primarily through F-actin fibres48–50. Here, we observed that both F-actin content (ρ = 0.33) and the degree of fibre bundling (ρ = 0.38; determined as the F-actin intensity skewness) showed a direct proportional association with increasing age (Fig. 2e). These findings support a cellular framework of bidirectional interactions between the regulated dynamics of the cytoskeleton and the response of transcriptionally defined DNA and chromatin25,51.
Further, we asked whether the above 49 biomolecular features exhibited higher-order associations that defined a biomolecular signature of cellular ageing (Fig. 2f and Supplementary Fig. 3b). Again, using unsupervised hierarchical clustering of the average correlation distances of the z-score normalized features, we found that there were five dominant clusters in the dataset, delineating mathematically similar cellular feature patterns. Correlation analysis using the absolute values of the Pearson correlation coefficients, based on feature sets (Fig. 2g) showed that intracellular ATP content had the highest absolute value for correlation with age (ρ = 0.64), with 15% of the 46 biomolecular parameters having absolute values for age correlation above 0.50 (Supplementary Dataset 1, 1D age correlations).
Cellular heterogeneity as another hallmark of ageing.
Recent evidence indicates that genetically identical cell populations can give rise to diverse cellular phenotypes42,52,53. Here, our results suggest that cell-to-cell variation may play an important role in the ageing process. Since a large fraction of the parameters quantified previously (Figs 1 and 2) are measured at the single-cell level, we asked whether cell-to-cell variation in these biophysical and biomolecular features helped define the cellular age phenotype. Results indicated that there were significant changes in cellular heterogeneity with age, as assessed by the magnitude of the c.v. for both biophysical (Fig. 3a and Supplementary Fig. 3c) and biomolecular features (Fig. 3b and Supplementary Fig. 3d). Using clustering analysis, we determined interrelations between the 92 c.v.s to probe the natural grouping comprising both datasets. Interestingly, feature-dependent correlative trends exhibited both positive and negative changes in cellular heterogeneity with increasing age; for instance, although there was a directly proportional relationship between the c.v.s of both cellular and nuclear size with age (that is, an increase in heterogeneity with age), the c.v.s of cellular speed and directional persistence exhibited inverse relationships (decreased heterogeneity) with age, thus implicating the underlying functional biology and substantial heterogeneity in ageing (Supplementary Dataset 1, 1D age correlations). Global correlation analysis indicated that ~29% and ~23% of the 70 biophysical and 22 biomolecular c.v.s, respectively, exhibited absolute Pearson correlation coefficients above 0.50 (Fig. 3c,d). Together, our results suggest that cellular heterogeneity is an important hallmark of ageing, and that it can be measured to help determine the extent of age-related deterioration of cellular phenotypes.
Figure 3 |. Cellular heterogeneity: a hallmark of ageing.
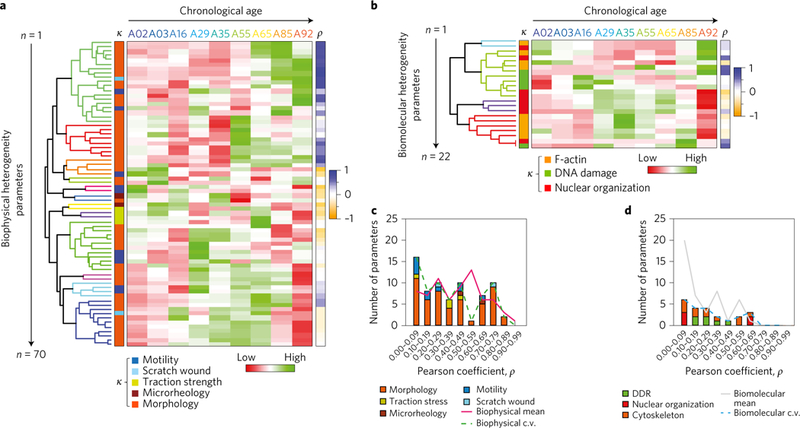
a,b, Cellular variations as quantified by the c.v. of the biophysical (a) and the biomolecular (b) features. The heat maps illustrate the z score-normalized parameters with corresponding colour-coded dendrograms to illustrate the feature groupings. The heat map key on left, labelled κ, denotes the colour-coded parameters on the basis of the specified features, and the heat map key on the right, labelled ρ, represents the magnitude of the Pearson correlation coefficients with age. c,d, Correlation analysis of heterogeneity features stratified as a function of the correlation magnitude and the feature sets for both biophysical (c) and biomolecular (d) parameters. The plots display trend lines for the correlation distributions of both mean-valued and heterogeneity parameters.
Biophysical signatures display stronger association with cellular age.
Next, we asked the following questions: (1) can we determine a cellular age for donors based solely on the quantification of cellular features, both univariate and bivariate, and (2) which parameters exhibit enhanced quantitative age associations. Due to the comprehensive nature of our study, exploring 208 parameters in total (116 mean-valued biomolecular and biophysical parameters + 92 c.v.s) across a 90 yr age range, we adopted an unbiased and agnostic approach to further determine key age-prediction parameters. First, using a univariate approach, we rank-ordered all 208 measured parameters; of these, a large fraction of the top correlates were descriptors of the biophysical features, with the highest biomolecular parameter (ATP content) ranking 29th overall (Fig. 4a and Supplementary Dataset 1, 1D age correlations). Moreover, many of the top-ten univariate parameters were descriptors of cellular and nuclear morphology and single-cell motility, consisting of both mean-value parameters and c.v.s, with the top univariate predictor (anisotropy of cell motility) showing an average fit error of 8 yr relative to the chronological age (see Methods and Fig. 4b).
Figure 4 |. Univariate and bivariate age-associated parameters provide a reliable prediction of the functional age index of donors on the basis of cellular features.

a, Plot showing correlation coefficients for all 208 parameters (mean and c.v.) stratified on the basis of feature sets for both biomolecular and biophysical parameters. The results indicate that the biophysical parameters constitute the top quadrant of the correlation spectrum, with the top biomolecular correlate (ATP content) ranking 29th overall. b, The heat map on the left denotes the predicted cellular biological age from the training set for the top ten rank-ordered correlates, with 60% being mean-valued parameters and the remaining 40% representing cell-to-cell variations of biophysical features. The heat map on the right confirms the trends on the basis of the data from the validation set. c–e, Using a bivariate generalized linear model of cellular features, we compared whether two biophysical features (c) or two biomolecular features (d) or one biophysical and one biomolecular feature (e) were better able to determine the cellular biological age. The top five bivariate combinations of the various feature sets demonstrates that two biophysical features predicts the age with comparable levels of accuracy to one biomolecular and one biophysical feature, with both of these pairs showing higher accuracy versus the two biomolecular features. Scatter plots on the right display the chronological age versus the predicted age for the top pair predictor in each category. The heat map key on the right, labelled ρ denotes the Pearson correlation coefficient, and e denotes the error, with the colour-coded range legends below.
These results, established in the training set, were further validated by the inclusion of additional donor samples (Fig. 4b, right). This validation set confirmed the robust and superior predictive power of biophysical features relative to biomolecular features. In addition, there were strong similarities observed in the distributions of correlation coefficients for both the training and validation sets (Supplementary Fig. 6a).
Although univariate analysis revealed the ability to determine the age of the donors at the cellular level, the magnitude of the fit error between the first and tenth rank-ordered parameters, ranging from 8 to 21 yr, limits its utility. To further enhance the predictive power on the basis of the cellular feature space, we utilized a bivariate approach using a generalized linear model (GLM) of the following general form:
| (1) |
where E(a) represents the expected value of a (here, the cellular age), Xβ is the linear predictor of parameter β (the biophysical and biomolecular features) and y is the data-dependent link function delineating a weighted association among parameters. Following the GLM analysis (see Methods), we rank-ordered the pair interactions on the basis of the magnitude of the correlation coefficients, and further separated them into three categories: biophysical-biophysical, biomolecular-biomolecular and biomolecular-biophysical. The best pair predictors consisting of two parameters from separate cluster groups, on the basis of the hierarchical clustering, were used to determine the cellular age (Supplementary Dataset 1, Pair predictions, and Supplementary Fig. 6c). This was done with the rationale that parameters from different cluster groups probably provide non-overlapping information, thereby strengthening the prediction (probably due to the orthogonality of parameters). To further validate this notion, correlation analyses were computed for all pair associations on the basis of the GLM (208 parameters amounting to 21,736 combinations), and a 2 × 2 correlation topography map was generated (Supplementary Fig. 6b).
This analysis indicated that the combination of two biophysical parameters (Fig. 4c) displayed stronger predictive power and a lower error compared with using two biomolecular parameters (Fig. 4d), and the combination of one biomolecular and one biophysical parameter had the same predictive power and error as the two biophysical parameters (Fig. 4e). Taking the top five bivariate predictors of cellular biological age in each category, and comparing the first and fifth best predictors demonstrated that the combination of two biophysical parameters had an average predictive error, ranging from 6 to 7 yr; the combinations of two biomolecular parameters had a mean error ranging from 10 to 13 yr (comparable to methylation age in dermal fibroblasts6); and the combination of one biomolecular and one biophysical parameters had a mean error ranging from 6 to 8 yr.
To further validate these results, we conducted the analysis on the five samples in our validation set. The results revealed high consistency, which was further confirmedvia an iterative leave-one-out validation method using all 14 samples (training and validation samples), thus providing an unbiased estimation of the predictive accuracy with regards to age (Table 1). Furthermore, the preserved high predictive performance observed with the inclusion of the validation samples suggest that the system is robust and does not overreact to minor fluctuations suggesting a low potential for the model being over fitted.
Table 1 |.
Correlations and errors for the top five pair predictors per testing category for both training and cross-sectional ageing validation datasets.
| Class of parameter 1 | Parameter 1 | Class of parameter 2 | Parameter 2 | Training |
Validation |
Leave one out |
||||
|---|---|---|---|---|---|---|---|---|---|---|
| Error | ρ | Error | ρ | Error | ρ | |||||
| Biophysical– biophysical |
Morphology | Nuclear size | Motility | Anisotropy | 5.9 | 0.97 | 2.7 | 0.99 | 7.5 | 0.95 |
| Morphology | Cell roughness | Morphology | Nuclear size | 6.7 | 0.96 | 1.2 | 0.99 | 5.9 | 0.97 | |
| peak | ||||||||||
| Morphology | Cell perimeter | Morphology | Nuclear size | 6.8 | 0.95 | 2.8 | 0.99 | 8.3 | 0.96 | |
| Morphology | Cell roughness | Motility | Anisotropy | 6.9 | 0.97 | 3.7 | 0.99 | 9.5 | 0.94 | |
| mode | ||||||||||
| Morphology | Cell curvature | Morphology | Nuclear size | 7.0 | 0.95 | 2.8 | 0.99 | 8.3 | 0.95 | |
| peak | ||||||||||
| Biomolecular– biomolecular |
Nuclear organization | Nuclear skewness | DDR | yH2AX c.v. | 12.5 | 0.87 | 5.6 | 0.97 | 17.8 | 0.78 |
| DDR | yH2AX c.v. | F-actin | F-actin content | 12.8 | 0.87 | 6.3 | 0.97 | 13.7 | 0.85 | |
| DDR | yH2AX c.v. | Nuclear organization | Nuclear | 15.3 | 0.84 | 6.2 | 0.98 | 16.8 | 0.80 | |
| skewness | ||||||||||
| Nuclear organization | Nuclear kurtosis | DDR | yH2AX c.v. | 17.4 | 0.69 | 5.5 | 0.98 | 19.1 | 0.69 | |
| DDR | yH2AX c.v. | F-actin | F-actin | 17.4 | 0.67 | 3.5 | 0.99 | 19.3 | 0.70 | |
| skewness | ||||||||||
| Biophysical– biomolecular |
DDR | yH2AX entropy | Morphology | Nuclear size | 5.9 | 0.97 | 3.4 | 0.99 | 7.0 | 0.96 |
| DDR | yH2AX content | Motility | Anisotropy | 6.1 | 0.97 | 9.7 | 0.93 | 11.5 | 0.91 | |
| DDR | yH2AX content | Morphology | Nuclear size | 6.7 | 0.97 | 3.4 | 0.99 | 8.6 | 0.94 | |
| DDR | yH2AX entropy | Morphology | Nuclear size | 7.2 | 0.95 | 4.1 | 0.99 | 7.0 | 0.95 | |
| DDR | yH2AX content | Morphology | Nuclear size | 8.5 | 0.95 | 4.0 | 0.99 | 7.8 | 0.94 | |
Bold parameters represent single-cell diversity/heterogeneity parameters.
Having demonstrated that we can robustly determine the cellular age of donors, we next assessed which measurements would be the simplest and most time- and cost-effective to conduct, while maintaining a high degree of predictive power (Supplementary Table 2). We determined that morphology-based HTCP measurements provide an inexpensive and time-efficient method that can easily be extended to both preclinical and clinical settings, as they require neither live specimens nor sophisticated measurements and equipment. Furthermore, the use of bivariate morphology-based features alone predicted the cellular age robustly, with high accuracy, with the best prediction pair having a mean unbiased prediction error from leave-one-out analysis of 5.9 yr (Table 2).
Table 2 |.
Correlations and errors for the top-ten pair predictors based solely on morphological features, for the training, cross-sectional ageing validation and longitudinal validation datasets.
| Training | Validation | Leave one out | Longitudinal | |||||||
|---|---|---|---|---|---|---|---|---|---|---|
| Parameter 1 | Parameter 2 | Error | ρ | Error | ρ | Error | ρ | Error | ρ | |
| Cell roughness peak | Nuclear size | 6.7 | 0.96 | 1.2 | 0.99 | 5.9 | 0.97 | 2.0 | 0.95 | |
| Cell perimeter | Nuclear size | 6.8 | 0.95 | 2.8 | 0.99 | 8.3 | 0.96 | 2.5 | 0.93 | |
| Cell curvature peak | Nuclear size | 7.0 | 0.95 | 2.8 | 0.99 | 8.3 | 0.96 | 2.5 | 0.93 | |
| Cell short axis length | Nuclear size | 8.1 | 0.92 | 2.8 | 0.99 | 7.6 | 0.94 | 2.2 | 0.94 | |
| Cell curvature c.v. | Nuclear size | 8.1 | 0.94 | 3.4 | 0.99 | 8.8 | 0.93 | 2.1 | 0.94 | |
| Nuclear long axis length | Nuclear size | 8.2 | 0.94 | 2.3 | 0.99 | 8.1 | 0.94 | 2.2 | 0.94 | |
| Cell short axis length | Nuclear size | 8.2 | 0.94 | 3.6 | 0.99 | 8.9 | 0.93 | 1.8 | 0.97 | |
| Cell equivalent diameter | Nuclear size | 8.3 | 0.93 | 2.6 | 0.99 | 7.0 | 0.95 | 1.9 | 0.96 | |
| Nuclear perimeter | Nuclear size | 8.6 | 0.93 | 1.2 | 0.99 | 6.9 | 0.95 | 2.4 | 0.93 | |
| Nuclear curvature kurtosis | Nuclear size | 8.7 | 0.93 | 1.8 | 0.99 | 7.5 | 0.95 | 2.2 | 0.95 | |
Bold parameters represent single-cell diversity/heterogeneity parameters
Remarkably, this prediction using only cell-morphology-based parameters, requires ~300 cells, which can easily be attained from a 3 mm skin punch biopsy, and the optimized processing time from sample preparation to results is on the order of 24 h.
Age prediction reveals distinct cellular ageing states.
Using cellular and nuclear morphological features, we next evaluated whether the observed trends in cross-sectional ageing in the training set remained consistent for additional cross-sectional validation samples, longitudinal ageing samples and samples from disease models, often referred to as ‘accelerated/premature ageing’. Using the top morphological pair predictors, the results indicated that analysis of 32 samples not only displayed consistency in the computed trends (Fig. 5a), but also revealed outliers. Moreover, evaluating the age differential (difference between the predicted cellular age and the chronological age) versus the chronological age (Fig. 5b), revealed that the samples fell into three distinct groups, which we refer to as ‘expected ageing’, ‘accelerated/premature ageing’ and ‘delayed ageing. To maintain the consistency and statistical validity of the analysis, samples were considered to be in different groups if their age differential was more than twice the magnitude of the average error (an error of 6 yr implies a 12 yr threshold), from the weighted group centroid, delineated by coloured boundary shadings in Fig. 5b. Although the accelerated/premature ageing category was primarily comprised of the samples from individuals with Hutchinson-Gilford progeria syndrome (HGPS) and Werner syndrome, it also included a sample from an apparently healthy individual. In addition, two out of the three Werner syndrome samples were located outside the proximity of the accelerated/premature ageing group.
Figure 5 |. Cellular biological age prediction on the basis of morphological features.
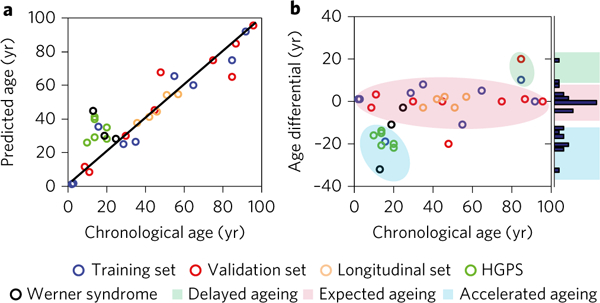
a, Scatter plot showing the chronological age versus the predicted cellular biological age for 32 donors divided into five categories: training dataset, cross-sectional validation datasets, longitudinal validation dataset, and Werner syndrome and Hutchinson-Gilford progeria syndrome (HGPS) datasets. b, Scatter plot showing the chronological age versus the age differential; age differential is defined as the difference in years between the chronological age (Ac) and the predicted biological age (Abp). The results reveal that samples cluster into three primary groups: expected ageing (Ac ≈Abp), accelerated/premature ageing (Ac <Abp) and delayed ageing (Ac >AbP).
Discussion
Previous studies have demonstrated the close association between changes in cellular phenotypes and functional deterioration with age1,2,5,6. To better understand the nature and responses of complex living systems, the development of integrated cell-based approaches to study health and disease, as they relate to age, is essential4,54. To the best of our knowledge, this is the first study of its kind where both biophysical and biomolecular cell properties were comprehensively assessed within the same sample cohort, thus allowing for head-to-head comparison between these two types of assessment. Here, we utilize a robust approach to identify key age-associated phenotypic changes in an effort to improve our understanding on how cellular biophysical and biomolecular features define the emergent patterns of cellular physiology observed in human ageing. Using 208 cellular features, we determined the cellular age of individuals, measured and interpreted here as the ensemble functional outlook based on biophysical features of an individual’s cells. Several univariate and multivariate methodologies can determine the ‘biological age’ of individuals, mainly at the clinical and molecular levels, such as the United States National Health and Nutrition Survey method2, and the Horvath method to compute the methylation-age, based on the methylation status at various pre-determined loci6.
Measuring and predicting biological age is controversial2, partly because a definitive ‘ground truth’ does not exist, and there is no absolute metric for what an individual’s cellular physiology and their phenotypic outlook should be as a function of their chronological age. A solution to help define the phenotypic spectrum of healthy ageing is by using either (1) cross-sectional donor samples spanning an age range of interest or (2) prospective longitudinal sampling of many individuals as they age within a defined age range. Subsequently, the samples can be interrogated to define the global relationship between their chronological age and their predicted cellular age, resulting in an age trajectory that is based on population statistics.
In addition, one can ask if the ageing process harbours some semblance of ergodic behaviour, and whether sampling 20 individuals between the ages of 2 and 90 yields a similar result to sampling one individual 20 times between ages 2 and 90. In our study we compared longitudinal ageing and cross-sectional ageing samples, and the results suggested that there are similarities between sampling an individual over a defined age range, and population sampling of many individuals across similar age ranges, both using predictions based on overall cellular biophysical properties and morphology-based properties. The rates of ageing—calculated based on the slopes—exhibit different progressions per individual (Fig. 5a and Supplementary Fig. 7a–d), which may result from differences stemming from the cyclic feedback interactions among specific individual traits such as genetics, diet and lifestyle55. Comparing the ensemble cross-sectional rate of ageing within the same age range using the longitudinal ageing samples revealed a similar slope, suggesting that while there may be ergodic-like behaviour at the ensemble level, this same relation does not seem apparent at the individual level; however, further studies using a larger comprehensive cohort would better elucidate this point.
The notion that fundamental properties of human biological ageing (regardless of their chronological age) can be slowed or reversed has fascinated humankind for millennia. The development of these integrated technologies to study ageing and probe bio-physical decline may enable progressive strides towards uncovering precursors to chronic disease states and differential effectual demographic inputs such as gender, and its effects on the ageing process. It was recently postulated that inherent differences exist between males and females during the ageing process56,57. Using our ageing cohort, we investigated whether these male-female differences were apparent as a function of our cellular age. The results suggest a slight deviation in the ageing patterns observed when using the top pair predictors for both biophysical (Supplementary Fig. 7e) and morphology-based (Supplementary Fig. 7f) parameters. Interestingly, the differential age relative to their chronological age initially presented as low for both males and females, with a biphasic deviation trend observed for female donors between late adolescence and early adulthood, followed by a decrease at post-menopausal age (~70 years old) to levels comparable to that of males. Interestingly, the majority of female samples assessed show a reduced cellular age relative to their chronological age, suggesting that on average females exhibit slower cellular ageing. Although the rational design of more in depth studies is needed, this result supports the notion of inherent male-female differences as a function of age, which is supported by population data demonstrating consistent earlier mortality for men compared with women, even after adjustment for potential confounders58–61.
This study presents the utility of a technology that could potentially address (1) the proximal causes of cellular ageing, (2) the mechanisms and common components relating to how ageing enables disease progression, and vice versa, and (3) the testing of a broad set of interventional strategies both in humans and model organisms. To hone in on these implications, we used the top morphological bivariate prediction pair to determine the cellular/functional age of individuals as a function of both healthy ageing and disease. With a cohort of 32 samples—17 samples from 17 apparently healthy individuals spanning ages 2 to 96 years, 5 longitudinal ageing samples from two apparently healthy individuals, 6 HGPS samples and 3 Werner syndrome samples—the results demonstrated a clear delineation into three subgroups: (1) expected ageing (chronological age ≈ cellular age), (2) accelerated/premature ageing (cellular age > chronological age) and (3) delayed ageing (cellular age < chronological age) (Fig. 5b). Although implementing a more extensive multivariate approach (three-feature or four-feature prediction, and so on) will most probably yield better prediction accuracies, we reasoned that strong prediction power with minimal input variables—as shown for bivariate analysis—was sufficient.
Further, the development and validation of this robust predictive model to determine the cellular age of donors, which holds consistent for both the training and validation sets, suggest that it is not over fitted. With this, we asked whether we are predicting the chronological age using biological features, or are we predicting a ‘biological age’ on the basis of true cellular functions at the cellular level. Here we present three lines of evidence to suggest that we are probably predicting a biological/functional age at the cellular level: (1) the prediction pair trends that are established in the training set also hold true for the validation set and leave-one-out validation, (2) inherent cellular biological age differences observed between male and female donors (Supplementary Fig. 7e,f), and (3) delineation and stratification of samples into subgroups on the basis of health/ disease states.
These differences in ageing between males and females shown here fit well with emerging studies that have begun to postulate gender-based contributions to the ageing process8,56,57. Overall, the delineation of the 32 samples into the three subgroups indicates that we are probably predicting more than just the chronological age. The observation of the delayed and accelerated/premature ageing categories supports this point. Defining disorders such as Werner syndrome and HGPS as accelerated/premature ageing is controversial because they result from a known mutation in the gene encoding lamin A/C (LMNA) and in DNA repair pathways, rather than ageing per se. However, these so-called accelerated/premature ageing samples display certain properties close to those seen in the older individuals in this study.
Cellular properties change markedly with increasing age, some of which probably impact age-associated dysfunction and the emergence of chronic disease states. Here, our study points out another interesting notion, that cells taken out of their normal biological context (within tissue) can retain key attributes that can be used to assess age-related perturbation. Although it has been established that the number of senescent cells within tissues and organs increases with age, and that the presence of these cells does in fact influence the age phenotype, whether through secretions, mechanics or other means10,62,63, we postulate that we are not just identifying a signature of senescent cells with age. Our rationale being that other studies of cellular senescence have reported key changes in properties such as morphology, cell-cycle fractions, motility patterns and secretory patterns9,64–71. Since we have taken such a comprehensive approach, we have assessed the morphologies, motility and secretory patterns of these ageing cells. In addition, the versatility of HTCP allows the robust determination of in silico fractional cell-cycle compositions on the basis of the cellular DNA content (see Methods), and thereby the ability to determine cell-cycle- dependent morphological features31,32,34,44.
Here, we present four key lines of evidence to suggest that although the senescence process and its resultant cells do influences the ageing phenotype, and while they cannot be considered mutually exclusive, we are probably not measuring a signature of senescence, but a complex interdependent age-related phenotype. The reasons are as follows. (1) We do not observe the synchronization of cells or growth arrest in the G0/G1 phase and decrease in the S-phase fraction, as is characteristic of many senescent cells. However, we do observe a consistent S-phase fractional composition of ~20% in all samples, based on our HTCP analysis (Supplementary Fig. 5a). (2) Quantification of dominant cell morphology modes across all samples using HTCP and visual aided morpho-phenotyping image recognition analyses do not identify a dominant eigen shape mode32 characterized by a flattened, rounded morphology when evaluating the pooled boundary contours of all the assessed cells spanning the entire age range (Supplementary Fig. 2f). (3) Use of HTCP’s in silico fractionation and quantification of cellular morphology as a function of cell-cycle state (Supplementary Fig. 5c) showed that the correlative trends seen for the 52 base morphological parameters were conserved, independent of the cell-cycle state (Supplementary Fig. 5c). This further implies that the similar age-dependent correlative trends regarding morphological features are indeed conserved in actively cycling cells.
Although studies have shown a characteristic increase in cell and nuclear size with age (~1.8 times across a 90 yr age range), this feature is also characteristic of cells transitioning from a pre-senescent to a senescent phenotype—however, at a greatly amplified degree (on average three times greater cell size based on induction of senescence in WI-38 cells; see Methods and Supplementary Fig. 5d,e). (4) As cells progress through the cell cycle from G0/G1 to G2/M, there is an increase in both their cell and nuclear sizes31,32,72, meaning that on average G0/G1 cells tend to be smaller than those that are further along the cycle. Here, we have observed, that across all ageing samples as a function of increasing age, there is also an increase in cell and nuclear sizes as a function of cell-cycle progression, and that cells in the G0/G1 phase do not, on average, exhibit larger cell and nuclear sizes. To further confirm this, we artificially induced senescence in WI-38 fibroblast cells via DNA damage caused by bleomycin (see Methods), and assessed cell size as a function of cell- cycle state in both the pre- and post-senescence samples, eight days after induction. We demonstrate that senescent cells in the G0/G1 phase (and all other phases) are indeed larger when compared with pre-senescent cells in more advanced cell-cycle states (S and G2/M) (Supplementary Fig. 5e).
We have presented a robust and well-validated study providing evidence for the cellular age determination with potential implications for stratification based on age-related disease risk and progression; however, the size of our cohort may present a limitation. As a result, studies using a larger cohort of both cross-sectional and longitudinal samples would supplement our claims and enable further extrapolations of the results. Furthermore, studies to completely validate the connections between our cellular-level assessments and the biological ages assessed at the clinical level will help decipher how these cellular changes are directly associated with ageing disorders. With a more comprehensive understanding of ageing at all three levels—biomolecular, biophysical and clinical—we will be able to more effectively map the mechanistic interactions that drive biological ageing. This could result in better predictors of healths-pan and longevity as opposed to chronological age, thereby boosting the chances of successful stratification-based interventions, and helping to address the question of whether therapeutics and lifestyle interventions will lead to significant improvements in healthspan and survival. Moreover, such a strategy may potentially mitigate defective traits that may delay the onset of dysfunctional age-related phenotypes such as frailty.
We postulate that with the collection of additional data points and further analysis in a larger cohort, there are a variety of potential applications for this approach and technology. Examples include the following: (1) potential uses in enhancing the efficacy of skin graft matching by ‘phenomapping’ (phenotype mapping)—selecting regions that also match in terms of cellular functional traits (deformability and motility), which could improve wound healing and cellular/tissue resilience in those areas; (2) preclinical and progressive testing of the effects of various biological agents and therapeutics on a patient-specific basis; (3) cellular toxicology and biological efficacy screening for cosmetics and topical bioagents; (4) predicting a patient’s propensity for optimal wound healing after surgery, and the effect of age and exposure to various biological agents (that is, it could help clinicians determine whether a patient is a candidate for surgery based on sub-optimal wound healing as a result of age, exposure to chemicals such as chemotherapeutics, and other factors that have been shown to affect how patients heal); and (5) a method to evaluate various age-related diseases such as frailty and the potential to predict the rate and trajectory of progression.
Methods
We subjected primary dermal fibroblasts, collected from individuals between 2 and 96 years old, to a panel of biomolecular and biophysical assays, including cell migration, force generation, cellular mechanics, cell and nuclear morphology, secretion profile, ATP content, cytoskeletal organization, DDR and nuclear organization.
Cell lines and culture.
Human dermal fibroblasts, which were derived from ‘apparently healthy individuals’ as part of the Baltimore longitudinal study of ageing, were purchased from the Coriell Biobank Cell Repository (Camden, New Jersey, USA); and were cultured in high-glucose (4.5 mg ml–1) DMEM medium supplemented with 15% (vol/vol) fetal bovine serum (Hyclone) and 1% (vol/vol) penicillin-streptomycin (Sigma). All cell lines were maintained at 37 °C in a humidified, 5% CO2, 95% air incubator. The cells were passaged every three to four days at 80% confluence for a maximum of five passages for use in experiments. They had an average overall population doubling level of ~9.5, and an average overall passage number of ~7.7 (Supplementary Fig. 4b,c and Supplementary Dataset 1, Replicative history). The cells were authenticated by the supplier, Coriell, and we tested them for mycoplasma contamination using PCR.
Cell motility.
Cells were seeded at low density (2,000 cells ml–1) onto 24-well tissue-culture treated plates (Corning) and allowed to adhere overnight. After cell attachment, the plate was mounted on a Nikon TE2000 microscope (Nikon) equipped with a motorized stage (Prior Scientific) and an environment control—to maintain physiological temperature, CO2 and humidity (Pathology Devices). Phase contrast images were recorded every 3 min for 20 h using a Cascade 1K CCD camera (Roper Scientific) with a low magnification 10× Plan Fluor objective (numerical aperture, 0.3; Nikon). Cell motility parameters were determined via the tracking of single cells (n = 2, ~50–80 cells per sample per trial) using image recognition software (MetaMorph/Metavue) as previously specified1–3. Cells that divided, went out of the frame or had long contact with other cells were omitted, while those that went ten continuous hours without meeting these exclusion criteria were used for the final analysis. Cellular displacements were calculated using the corresponding x and y coordinates, and the final motility parameters (that is, mean squared displacement, anisotropic index and so on) were calculated using the anisotropic persistent random walk model (Supplementary Fig. 1b–j) as previously specified4.
Scratch wound measurements.
Cells were seeded to confluence in six-well tissue-culture treated dishes (Corning) and allowed to adhere for 24 h. Three vertical and horizontal scratches were made in the confluent monolayer of cells using a 0.1–10 μl pipet tip, to reduce any variations that may arise due to orientation and boundary effects5. Subsequently, cells were washed once with PBS buffer to remove cellular debris and then immediately mounted on a Nikon TE2000 microscope (Nikon), where images were acquired. Briefly, images were recorded every 3 min for a total duration of 20 h, and were analysed using NIS Elements software (Nikon). The cell-free areas were traced every hour for the total duration of the movie, with n = 2 and ten technical replicate positions per sample, and with each position normalized to its initial cell-free area. The wound half-life was calculated using a two-point interpolation method per position, and the wound closure rates were calculated on the basis of the corresponding exponential decay kinetics (Supplementary Fig. 1a).
Immunofluorescence and high-throughput cell phenotyping.
Dermal fibroblast samples were seeded at low confluence onto glass-bottom eight-chambered tissue-culture dishes (EMD Millipore) and allowed to adhere for 24 h. The cells were fixed with 4% paraformaldehyde (Electron Microscopy Sciences) for 12 min, permeabilized with 0.1% Triton X-100 (Fisher) for 10 min, and blocked with PBS supplemented with 1% (w/v) bovine serum albumin (Gemini). For the morphology, cytoskeleton, and nuclear organization experiments, as well as cell-cycle determination, F-actin filaments were stained with Alexa-Fluor-488-conjugated phalloidin (Invitrogen) and the nuclei (DNA) were stained with Hoechst 33342 (Sigma). For the DDR experiments, the cells were treated with 10 μg ml–1 of bleomycin (EMD Millipore) for 1 h, then washed and allowed to recover for 1 h, and then immediately fixed with 4% paraformaldehyde. γH2AX foci were stained using anti-γH2AX mouse monoclonal antibodies (EMD Millipore), and subsequently counterstained with Alexa Fluor 568 anti-mouse secondary antibodies (Invitrogen), in addition to stains for F-actin and nuclei. Using custom image processing software, cellular and nuclear morphology, as well as protein content, were quantified (mean and c.v.) via information generated using the boundaries extracted from the F-actin and nuclear channels. The protein content parameters (F-actin content, γH2AX content and so on) were calculated using the intensity-based measurements per region of interest (after correction of non-uniformities in the intensity fields) within the delineated cellular and nuclear regions of interest per single cell; the procedure has been previously described6–11. Single cells (300–700) were analysed across two technical replicate wells for each of two trials (n =2). The size and shape description (Supplementary Fig. 2) of single cells was quantified as previously described7.
Cellular stress exertion.
Collagen-coated, bead-embedded polyacrylamide gels (stiffness, 8,000 Pa) were fabricated on 35 mm glass-bottom dishes (Mattek). Briefly, cells were seeded at low density and allowed to incubate and adhere for ~24 h, after which, the dishes were mounted on a Nikon T300 microscope equipped with a motorized stage and automated fluorescence capabilities, controlled by NIS Elements software. For each single cell imaged per sample (15–25 single cells per sample per trial, n = 2), an in-focus phase contrast image and a fluorescent image—at the corresponding bead excitation wavelength—were acquired (fluorescence images of the bead array were captured with the beads located at the top of the polyacrylamide gel in focus to achieve the most accurate deformation of the gel surface by the cells). After image acquisition of the cells and positions of interest, the sample was washed once with PBS and the cells were detached using 0.25% trypsin-EDTA (Invitrogen), and incubated for ~20 min. Subsequently, detached cells were washed off with a PBS rinse, and positions that harboured the cells of interest were checked to ensure that all the cells had detached. Then a second fluorescent image of the bead array was acquired, and each set of three images per position, per sample was analysed to assess the cellular stresses. Using a custom MATLAB (MathWorks) script, the two fluorescence images were aligned using an image cross correlation algorithm, and the local bead displacement vectors within the traced cell region of interest were quantified. The quantified bead displacements (difference in a bead’s position between the relaxed and stressed states of the substrate) delineated the stresses exerted by the single cells on the substrate, and as such was used to estimate the traction stresses12.
Intracellular microrheology.
Intracellular microrheology experiments were conducted as previously outlined13. Briefly, cells were seeded in 35 mm plastic dishes and allowed to adhere for 24 h. Next, adhered cells were ballistically injected with fluorescent 100 nm polystyrene beads (Invitrogen). Cells were washed with PBS and allowed to recover under physiological conditions for 4 h and then re-seeded at low densities in 35 mm glass-bottom dishes and allowed to attach for an additional 24 h. Subsequently, dishes were mounted on a TE2000 microscope, equipped with a motorized stage and an environmental control unit and the cells were imaged (50–100 cells per sample per trial, n = 3). The displacements of the beads (on average 4–10 particles tracked per cell) were tracked for 30 s at high temporal and spatial resolution with a 60× oil objective and analysed using custom MATLAB software.
High-throughput cellular secretion analysis.
Cells (~50,000) were seeded in 24-well tissue-culture dishes (Corning) and allowed to adhere for 16 h. Once the cells had attached, fresh media was added per single well, and left for 24 h under physiological conditions, after which, the conditioned media, containing the cellular secretions were collected and analysed for 23 secreted proteins of interests as previously described using a microfluidics-based high-throughput cell secretion device14 (n = 2). The results were compared with another previously reported ageing study to determine whether there was agreement with other studies seeking to establish secretion correlation with age (Supplementary Fig. 4a).
Cellular ATP production.
Cells (50,000) were seeded into 96-well cell-culture treated dishes and allowed to adhere for 24 h. Using a commercially available ATP assay kit (Invitrogen), the cells were assayed as described in the manufacturer’s instructions and luminescence measurements were used to determine the intracellular ATP content (four technical replicates per sample, n = 2).
Inducing senescence.
Wi-38 fibroblasts were induced into senescence by treatment with 50 μM bleomycin sulfate (Enzo Life Sciences) for 4 h and allowed to recover for 8 d. The cells were verified as senescent via Ki-67 immunostaining and a count of population doublings over a period of 4 d, as previously described22.
Univariate age prediction.
The cellular age based on univariate parameters was determined using a two-point interpolation based on the slope of the trend line generated by plotting age versus parameter x. Briefly, the best fit line was generated per parameter with age, and the equation defining that best fit line was determined. Using the slope and intercept, the predicted age was determined by solving the equation for age on the basis of the magnitude of the parameter per sample.
GLM and cellular age prediction.
Using the comprehensive data collected from experiments for both biomolecular and biophysical features we conducted a bivariate analysis making use of a GLM. Briefly, this model is a form of ordinary linear regression that allows the response of a variable to be related to the expected value via a data-driven link function15,16. In MATLAB, using the built-in function ‘glmfit, we computed pairwise predictions for the 208 parameters resulting in 21,736 combinations (Supplementary Fig. 5c and Supplementary Dataset 1, Pair predictions), each having a correlation coefficient and a fit error. Using this approach, we were able to relate pairs of parameters and assess the correlation and prediction errors as a function of sample age. The top pair predictors were generated using the training set, and further validated using the validation set (cross-sectional ageing), longitudinal ageing and accelerated/premature ageing disease models. Both the univariate and bivariate prediction errors are defined as the average difference between the predicted cellular biological age and the chronological age for all samples within the set.
The general form of the GLM equation is:
| (2) |
where E(a) represents the expected value of a (here, the cellular age), Xβ is the linear predictor of parameter β (the biophysical and biomolecular features), and y is the data-dependent link function delineating a weighted association among features.
Statistics.
All experiments were conducted using in-plate technical replicates with biological replicates specified by ‘n’ in each section. Correlations were assessed using Pearson correlation coefficients and the statistical significance was assessed using one-way analysis of variance. For 2 × 2 parameter correlation, the cross correlation matrix was computed in MATLAB and the correlation topography map was generated using the positive and negative values of the magnitude. Cellular heterogeneity was computed as the coefficient of variance for single-cell parameters across conditions7. Hierarchical clustering was calculated among parameters using the average linkage of the correlation distances to determine the natural groupings within the parameter space. Validation of the prediction results was performed using two statistically sound methodologies. (1) Prediction results for parameters identified in the training set (n = 9) were cross-validated using another independent validation set (n = 5), and finalized prediction pairs were further validated using another independent sample set (n = 9) comprising of cross-sectional and longitudinal ageing samples. (2) Because of the size of our sample sets, we combined the training and validation sets for the top pair predictors in tables 1 and 2, and we employed leave-one-out validation analysis, where we iteratively computed the average correlation and fit errors.
Supplementary Material
Acknowledgements
We acknowledge the financial support for this work by the National Institutes of Health; grant numbers U54CA143868 (D.W.), R01CA174388 (D.W) and P30AG021334 Johns Hopkins Older Americans Independence Center (J.W.). Special thanks to M. Maggioni, and Q-L. Xue for feedback and discussion with regards to the statistical methodologies employed in this study.
Footnotes
Code availability. The processing code for HTCP and visual aided morpho-phenotyping image recognition is part of a patented, proprietary software package.
Data availability. The authors declare that all data supporting the findings of this study are available within the paper and its Supplementary Information.
Additional information
Supplementary information is available for this paper.
Publisher’s note: Springer Nature remains neutral with regard to jurisdictional claims in published maps and institutional affiliations.
Competing interests
The authors declare no competing financial interests.
References
- 1.Lopez-Otin C, Blasco MA, Partridge L, Serrano M & Kroemer G The hallmarks of aging. Cell 153, 1194–1217 (2013). [DOI] [PMC free article] [PubMed] [Google Scholar]
- 2.Belsky DW et al. Quantification of biological aging in young adults. Proc. Natl Acad. Sci. USA 112, E4104–E4110 (2015). [DOI] [PMC free article] [PubMed] [Google Scholar]
- 3.Smith BD, Smith GL, Hurria A, Hortobagyi GN & Buchholz TA Future of cancer incidence in the United States: burdens upon an aging, changing nation. J. Clin. Oncol. 27, 2758–2765 (2009). [DOI] [PubMed] [Google Scholar]
- 4.Kennedy BK et al. Geroscience: linking aging to chronic disease. Cell 159, 708–712, (2014). [DOI] [PMC free article] [PubMed] [Google Scholar]
- 5.Bocklandt S et al. Epigenetic predictor of age. PLoS ONE 6, e14821 (2011). [DOI] [PMC free article] [PubMed] [Google Scholar]
- 6.Horvath S DNA methylation age of human tissues and cell types. Genome Biol. 14, R115 (2013). [DOI] [PMC free article] [PubMed] [Google Scholar]
- 7.Wirtz D, Konstantopoulos K & Searson PC The physics of cancer: the role of physical interactions and mechanical forces in metastasis. Nat. Rev. Cancer 11, 512–522 (2011). [DOI] [PMC free article] [PubMed] [Google Scholar]
- 8.Phillip JM, Aifuwa I, Walston J & Wirtz D The mechanobiology of aging. Annu. Rev. Biomed. Eng. 17, 113–141 (2015). [DOI] [PMC free article] [PubMed] [Google Scholar]
- 9.Rodier F & Campisi J Four faces of cellular senescence. J. Cell Biol. 192, 547–556 (2011). [DOI] [PMC free article] [PubMed] [Google Scholar]
- 10.Baker DJ et al. Clearance of p16Ink4a-positive senescent cells delays ageing-associated disorders. Nature 479, 232–236 (2011). [DOI] [PMC free article] [PubMed] [Google Scholar]
- 11.Wirtz D Particle-tracking microrheology of living cells: principles and applications. Annu. Rev. Biophys. 38, 301–326 (2009). [DOI] [PubMed] [Google Scholar]
- 12.Ingber DE Mechanobiology and diseases of mechanotransduction. Ann. Med. 35, 564–577 (2003). [DOI] [PubMed] [Google Scholar]
- 13.Makale M Cellular mechanobiology and cancer metastasis. Birth Defects Res. C Embryo Today 81, 329–343 (2007). [DOI] [PubMed] [Google Scholar]
- 14.Altschuler SJ & Wu LF Cellular heterogeneity: do differences make a difference? Cell 141, 559–563 (2010). [DOI] [PMC free article] [PubMed] [Google Scholar]
- 15.Darling EM & Di Carlo D High-throughput assessment of cellular mechanical properties. Annu. Rev. Biomed. Eng. 17, 35–62 (2015). [DOI] [PMC free article] [PubMed] [Google Scholar]
- 16.Starodubtseva MN Mechanical properties of cells and ageing. Ageing Res. Rev. 10, 16–25 (2011). [DOI] [PubMed] [Google Scholar]
- 17.Martin P Wound healing—aiming for perfect skin regeneration. Science 276, 75–81 (1997). [DOI] [PubMed] [Google Scholar]
- 18.Fraley SI et al. A distinctive role for focal adhesion proteins in three-dimensional cell motility. Nat. Cell Biol. 12, 598–604 (2010). [DOI] [PMC free article] [PubMed] [Google Scholar]
- 19.Wu PH, Giri A & Wirtz D Statistical analysis of cell migration in 3D using the anisotropic persistent random walk model. Nat. Protoc. 10,517–527 (2015). [DOI] [PMC free article] [PubMed] [Google Scholar]
- 20.Wu PH, Giri A, Sun SX & Wirtz D Three-dimensional cell migration does not follow a random walk. Proc. Natl Acad. Sci. USA 111, 3949–3954 (2014). [DOI] [PMC free article] [PubMed] [Google Scholar]
- 21.Munevar S, Wang Y & Dembo M Traction force microscopy of migrating normal and H-ras transformed 3T3 fibroblasts. Biophys. J. 80, 1744–1757 (2001). [DOI] [PMC free article] [PubMed] [Google Scholar]
- 22.Aifuwa I et al. Senescent stromal cells induce cancer cell migration via inhibition of RhoA/ROCK/myosin-based cell contractility. Oncotarget 6, 30516–30531 (2015). [DOI] [PMC free article] [PubMed] [Google Scholar]
- 23.Aratyn-Schaus Y, Oakes PW, Stricker J, Winter SP & Gardel ML Preparation of complaint matrices for quantifying cellular contraction. J. Vis. Exp. e2173 (2010). [DOI] [PMC free article] [PubMed] [Google Scholar]
- 24.Stroka KM et al. Loss of giant obscurins alters breast epithelial cell mechanosensing of matrix stiffness. Oncotarget. 10.18632/oncotarget.10997 (2016). [DOI] [PMC free article] [PubMed] [Google Scholar]
- 25.Kim DH & Wirtz D Cytoskeletal tension induces the polarized architecture of the nucleus. Biomaterials 48, 161–172 (2015). [DOI] [PMC free article] [PubMed] [Google Scholar]
- 26.Hale CM et al. SMRT analysis of MTOC and nuclear positioning reveals the role of EB1 and LIC1 in single-cell polarization. J. Cell Sci. 124, 4267–4285 (2011). [DOI] [PMC free article] [PubMed] [Google Scholar]
- 27.Wu PH et al. High-throughput ballistic injection nanorheology to measure cell mechanics. Nat. Protoc. 7, 155–170 (2012). [DOI] [PMC free article] [PubMed] [Google Scholar]
- 28.Lee JS et al. Nuclear lamin A/C deficiency induces defects in cell mechanics, polarization, and migration. Biophys. J. 93, 2542–2552 (2007). [DOI] [PMC free article] [PubMed] [Google Scholar]
- 29.Lee JS et al. Ballistic intracellular nanorheology reveals ROCK-hard cytoplasmic stiffening response to fluid flow. J. Cell Sci. 119, 1760–1768 (2006). [DOI] [PubMed] [Google Scholar]
- 30.Tseng Y et al. How actin crosslinking and bundling proteins cooperate to generate an enhanced cell mechanical response. Biochem. Biophys. Res. Commun. 334, 183–192 (2005). [DOI] [PubMed] [Google Scholar]
- 31.Chen WC et al. Functional interplay between the cell cycle and cell phenotypes. Integr. Biol. (Camb.) 5, 523–534 (2013). [DOI] [PMC free article] [PubMed] [Google Scholar]
- 32.Wu PH et al. Evolution of cellular morpho-phenotypes in cancer metastasis. Sci. Rep. 5, 18437 (2015). [DOI] [PMC free article] [PubMed] [Google Scholar]
- 33.Guo QY et al. Modulation of keratocyte phenotype by collagen fibril nanoarchitecture in membranes for corneal repair. Biomaterials 34, 9365–9372 (2013). [DOI] [PMC free article] [PubMed] [Google Scholar]
- 34.Shah MY et al. MMSET/WHSC1 enhances DNA damage repair leading to an increase in resistance to chemotherapeutic agents. Oncogene 35, 5905–5915 (2016). [DOI] [PMC free article] [PubMed] [Google Scholar]
- 35.Yong KMA et al. Morphological effects on expression of growth differentiation factor 15 (GDF15), a marker of metastasis. J. Cell Physiol. 229, 362–373 (2014). [DOI] [PMC free article] [PubMed] [Google Scholar]
- 36.Hecht VC et al. Biophysical changes reduce energetic demand in growth factor-deprived lymphocytes. J. Cell Biol. 212, 439–447 (2016). [DOI] [PMC free article] [PubMed] [Google Scholar]
- 37.Hayflick L Recent advances in the cell biology of aging. Mech. Ageing Dev. 59–79 (1980). [DOI] [PubMed] [Google Scholar]
- 38.Bratic A & Larsson NG The role of mitochondria in aging. J. Clin. Invest. 123, 951–957 (2013). [DOI] [PMC free article] [PubMed] [Google Scholar]
- 39.Green DR, Galluzzi L & Kroemer G Mitochondria and the autophagy-inflammation-cell death axis in organismal aging. Science 333, 1109–1112 (2011). [DOI] [PMC free article] [PubMed] [Google Scholar]
- 40.Miyoshi N, Oubrahim H, Chock PB & Stadtman ER Age-dependent cell death and the role of ATP in hydrogen peroxide-induced apoptosis and necrosis. Proc. Natl Acad. Sci. USA 103, 1727–1731 (2006). [DOI] [PMC free article] [PubMed] [Google Scholar]
- 41.Smart N et al. IL-6 induces PI 3-kinase and nitric oxide-dependent protection and preserves mitochondrial function in cardiomyocytes. Cardiovasc. Res. 69, 164–177 (2006). [DOI] [PubMed] [Google Scholar]
- 42.Lu Y et al. High-throughput secretomic analysis of single cells to assess functional cellular heterogeneity. Anal. Chem. 85, 2548–2556 (2013). [DOI] [PMC free article] [PubMed] [Google Scholar]
- 43.Waldera Lupa DM et al. Characterization of skin aging-associated secreted proteins (SAASP) produced by dermal fibroblasts isolated from intrinsically aged human skin. J. Invest. Dermatol. 135, 1954–1968 (2015). [DOI] [PubMed] [Google Scholar]
- 44.Chambliss AB, Wu PH, Chen WC, Sun SX & Wirtz D Simultaneously defining cell phenotypes, cell cycle, and chromatin modifications at single-cell resolution. FASEB J. 27, 2667–2676 (2013). [DOI] [PMC free article] [PubMed] [Google Scholar]
- 45.Wu PH et al. Evolution of cellular morpho-phenotypes in cancer metastasis. Sci. Rep. 5, 18437 (2015). [DOI] [PMC free article] [PubMed] [Google Scholar]
- 46.Sedelnikova OA et al. Delayed kinetics of DNA double-strand break processing in normal and pathological aging. Aging Cell 7, 89–100 (2008). [DOI] [PubMed] [Google Scholar]
- 47.Kreiling JA et al. Age-associated increase in heterochromatic marks in murine and primate tissues. Aging Cell 10, 292–304 (2011). [DOI] [PMC free article] [PubMed] [Google Scholar]
- 48.Isermann P & Lammerding J Nuclear mechanics and mechanotransduction in health and disease. Curr. Biol. 23, R1113–R1121 (2013). [DOI] [PMC free article] [PubMed] [Google Scholar]
- 49.Kim DH, Chambliss AB & Wirtz D The multi-faceted role of the actin cap in cellular mechanosensation and mechanotransduction. Soft Matter 9, 5516–5523 (2013). [DOI] [PMC free article] [PubMed] [Google Scholar]
- 50.Khatau SB et al. A perinuclear actin cap regulates nuclear shape. Proc. Natl Acad. Sci. USA 106, 19017–19022 (2009). [DOI] [PMC free article] [PubMed] [Google Scholar]
- 51.Schulze C et al. Stiffening of human skin fibroblasts with age. Clin. Plast. Surg. 39, 9–20 (2012). [DOI] [PubMed] [Google Scholar]
- 52.Niepel M, Spencer SL & Sorger PK Non-genetic cell-to-cell variability and the consequences for pharmacology. Curr. Opin. Chem. Biol. 13, 556–561 (2009). [DOI] [PMC free article] [PubMed] [Google Scholar]
- 53.Bahar R et al. Increased cell-to-cell variation in gene expression in ageing mouse heart. Nature 441, 1011–1014 (2006). [DOI] [PubMed] [Google Scholar]
- 54.Burch JB et al. Advances in geroscience: impact on healthspan and chronic disease. J. Gerontol. A Biol. Sci. Med. Sci. 69, S1–S3 (2014). [DOI] [PMC free article] [PubMed] [Google Scholar]
- 55.Espinoza S & Walston JD Frailty in older adults: insights and interventions. Cleve. Clin. J. Med. 72, 1105–1112 (2005). [DOI] [PubMed] [Google Scholar]
- 56.Blagosklonny MV Why men age faster but reproduce longer than women: mTOR and evolutionary perspectives. Aging 2, 265–273 (2010). [DOI] [PMC free article] [PubMed] [Google Scholar]
- 57.Ortman JM, Velkoff VA & Hogan H An Aging Nation: The Older Population in the United States Current Population Report P25–1140 (US Census Bureau, 2014). [Google Scholar]
- 58.Waldron I Why do women live longer than men? Soc. Sci. Med. 10, 349–362 (1979). [DOI] [PubMed] [Google Scholar]
- 59.Waldron I What do we know about causes of sex differences in mortality? A review of the literature. Popul. Bull. UN 18, 59–76 (1985). [PubMed] [Google Scholar]
- 60.Nakamura E & Miyao K Sex differences in human biological aging. J. Gerontol. A Biol. Sci. Med. Sci. 63, 936–944 (2008). [DOI] [PubMed] [Google Scholar]
- 61.Voitenko VP & Tokar AV The assessment of biological age and sex differences of human aging. Exp. Aging Res. 9, 239–244 (1983). [DOI] [PubMed] [Google Scholar]
- 62.Childs BG, Durik M, Baker DJ & van Deursen JM Cellular senescence in aging and age-related disease: from mechanisms to therapy. Nat. Med. 21, 1424–1435 (2015). [DOI] [PMC free article] [PubMed] [Google Scholar]
- 63.van Deursen JM The role of senescent cells in ageing. Nature 509, 439–446 (2014). [DOI] [PMC free article] [PubMed] [Google Scholar]
- 64.Campisi J Aging, cellular senescence, and cancer. Annu. Rev. Physiol. 75, 685–705 (2013). [DOI] [PMC free article] [PubMed] [Google Scholar]
- 65.Campisi J Cellular senescence, cancer and aging. Mol. Biol. Cell. 15, 354a (2004). [Google Scholar]
- 66.Campisi J Cancer, aging and cellular senescence. In Vivo 14, 183–188 (2000). [PubMed] [Google Scholar]
- 67.Campisi J, Andersen JK, Kapahi P & Melov S Cellular senescence: a link between cancer and age-related degenerative disease? Semin. Cancer Biol. 21, 354–359 (2011). [DOI] [PMC free article] [PubMed] [Google Scholar]
- 68.Campisi J & di Fagagna FD Cellular senescence: when bad things happen to good cells. Nat. Rev. Mol. Cell Bio. 8, 729–740 (2007). [DOI] [PubMed] [Google Scholar]
- 69.Campisi J, Kim SH, Lim CS & Rubio M Cellular senescence, cancer and aging: the telomere connection. Exp. Gerontol. 36, 1619–1637 (2001). [DOI] [PubMed] [Google Scholar]
- 70.Coppe JP, Desprez PY, Krtolica A & Campisi J The senescence- associated secretory phenotype: the dark side of tumor suppression. Annu. Rev. Pathol. Mech. 5, 99–118 (2010). [DOI] [PMC free article] [PubMed] [Google Scholar]
- 71.Kafri R et al. Dynamics extracted from fixed cells reveal feedback linking cell growth to cell cycle. Nature 494, 480–483 (2013). [DOI] [PMC free article] [PubMed] [Google Scholar]
Associated Data
This section collects any data citations, data availability statements, or supplementary materials included in this article.