

Abstract
In the calyx of Held, fast and slow components of neurotransmitter release can be distinguished during a step depolarization. The two components show different sensitivity to molecular/pharmacological manipulations. Here, their roles during a high-frequency train of action potential (AP)-like stimuli were examined by using both deconvolution of EPSCs and presynaptic capacitance measurements. During a 100 Hz train of AP-like stimuli, synchronous release showed a pronounced depression within the 20 stimuli. Asynchronous release persisted during the train, was variable in its amount, and was more prominent during a 300 Hz train. We have shown previously that slowly releasing vesicles were recruited faster than fast-releasing vesicles after depletion. By further slowing recovery of the fast-releasing vesicles by inhibiting calmodulin-dependent processes (Sakaba and Neher, 2001b), the slowly releasing vesicles were isolated during recovery from vesicle depletion. When a high-frequency train was applied, the isolated slowly releasing vesicles were released predominantly asynchronously. In contrast, synchronous release was mediated mainly by the fast-releasing vesicles. The results suggest that fast-releasing vesicles contribute mainly to synchronous release and that depletion of fast-releasing vesicles shape the synaptic depression of the synchronous phase of EPSCs, whereas slowly releasing vesicles are released mainly asynchronously during high-frequency stimulation. The latter is less subject to depression presumably because of a rapid vesicular recruitment process, which is a characteristic of this component.
Keywords: synaptic transmission, synaptic vesicle release, synaptic plasticity, exocytosis, presynaptic, synaptic
Introduction
In neuroendocrine cells and some synapses, distinct kinetic components of release were observed when intracellular Ca2+ was elevated in a step-like manner by a step depolarization or Ca2+ uncaging (Neher and Zucker, 1993; Thomas et al., 1993; von Gersdorff and Matthews, 1994; Moser and Beutner, 2000; Thoreson et al., 2004). This led to the hypothesis that several distinct pools of vesicles exist in these preparations. Some kinetic components have been selectively eliminated by knockout of presynaptic proteins, disruption of protein–protein interaction, and pharmacological tools, indicating differences in the release processes and locations with respect to presynaptic Ca2+ channels (Martin, 2003). Although vesicle pools can be separated most easily when the presynaptic Ca2+ concentration is elevated continuously and in a step-like manner, it is unclear how these distinct pools of vesicles are released under more physiological conditions, especially during bursts of action potentials (APs) in spiking neurons. APs create only brief millisecond-long Ca2+ transients that may contribute to the release from vesicle pools in complex ways. Nevertheless, several physiological studies have indicated different release kinetics among synaptic vesicles during APs. Quantal analysis as well as the use of MK-801 [(+)-5-methyl-10,11-dihydro-5H-dibenzo [a,d] cyclohepten-5,10-imine maleate] has suggested that release probability of synaptic vesicles is not uniform (Walmsely et al., 1988; Hessler et al., 1993; Rosenmund et al., 1993; Dobrunz and Stevens, 1997). It has also been suggested that a simple vesicle pool depletion model cannot explain the time course of synaptic depression during repetitive stimulation (Betz, 1970; Christensen and Martin, 1970; Kusano and Landau, 1975; Dittman and Regehr, 1998; Wu and Borst, 1999; Rosenmund et al., 2002). Moulder and Mennerick (2004) showed that repetitive stimulation of synapses did not deplete all of the releasable vesicles, suggesting that some synaptic vesicles were reluctant for release. Other studies suggested that different sets of vesicles mediate synchronous/asynchronous release evoked by APs. For example, synchronous and asynchronous releases are affected differently by deletion of synaptotagmin (Littleton et al., 1993; Geppert et al., 1994; Nishiki and Augustine, 2004) and disruption of SNARE proteins (Gansel et al., 1987; Molgo et al., 1989; Schoch et al., 2001).
The calyx of Held is a large presynaptic terminal in the auditory brainstem with many active zones, and simultaneous presynaptic and postsynaptic patch clamp allows detailed analysis of transmitter release kinetics (Forsythe, 1994; Borst et al., 1995; von Gersdorff and Borst, 2002). Two sets of readily releasable vesicles (termed fast-releasing and slowly releasing vesicles here) can be distinguished that are distinct with respect to their release probability and speed of recruitment (Wu and Borst, 1999; Sakaba and Neher, 2001b). This study addresses how fast-releasing and slowly releasing vesicles are used during a high-frequency train of AP-like stimuli. Only frequencies as high as 300 Hz depleted both types of vesicles in the steady state. The results also show that the fast-releasing vesicles are released synchronously early during the train, whereas the slowly releasing vesicles are released asynchronously during the stimulation.
Materials and Methods
Transverse brainstem slices (150–200 μm thick) were prepared from 8- to 11- d-old Wistar rats (Forsythe, 1994; Borst et al., 1995) according to institute guidelines. The standard extracellular solution contained (in mm) 125 NaCl, 2.5 KCl, 2 CaCl2, 1 MgCl2, 25 glucose, 25 NaHCO3, 1.25 NaH2PO4, 0.4 ascorbic acid, 3 myo-inositol, and 2 Na-pyruvate (pH 7.4, gassed with 95% O2/5% CO2). Experiments were performed at room temperature. During recordings, 1 μm TTX, 10 mm TEA-Cl, and 50 μm d-AP-5 were added to isolate presynaptic Ca2+ currents and postsynaptic AMPA receptor-mediated EPSCs. Cyclothiazide (100 μm) and kynurenic acid (1 mm) were added to block desensitization and possible saturation of AMPA receptors and also to avoid voltage-clamp errors. A calyx of Held and the postsynaptic medial nucleus of the trapezoid body principal neuron were simultaneously whole-cell clamped at −80 mV with an EPC9/2 amplifier (HEKA Elektronik, Lambrecht/Pfalz, Germany). The presynaptic patch pipette (3–5 MΩ) solution contained (in mm) 135 Cs-gluconate, 20 TEA-Cl, 10 HEPES, 5 Na2-phosphocreatine, 4 MgATP, 0.3 GTP, and 0.05 EGTA, pH 7.2. In some experiments, the calmodulin binding domain (CaM kinase II 290-309; 20 μm) was added to the presynaptic pipette solution. The presynaptic series resistance (5–20 MΩ) was compensated by 30–90%. The postsynaptic pipette (2–3.5 MΩ) contained the same solution as the presynaptic pipette, except that the EGTA concentration was increased to 5 mm. The postsynaptic series resistance (3–8 MΩ) was electrically compensated by the amplifier such that the uncompensated resistance was <3 MΩ. The remaining resistance was further compensated off-line.
Presynaptic capacitance measurements were performed using an EPC/9 amplifier and the Sine+DC technique (Lindau and Neher, 1988; Sun and Wu, 2001; Yamashita et al., 2005). A sine wave (30 mV in amplitude, 1000 Hz) was superimposed onto a holding potential of −80 mV. Measurements were accepted when the presynaptic series resistance was <20 MΩ.
TTX was obtained from Alomone Laboratories (Jerusalem, Israel). Cyclothiazide, kynurenic acid, and d-AP-5 were obtained from Tocris (Biotrend, Köln, Germany). The calmodulin binding domain peptide was from Calbiochem (Schwalbach, Germany). Cyclothiazide was dissolved in DMSO, and the final concentration in the extracellular solution was 0.1%.
Quantal release rates were estimated by the deconvolution method, adapted for the calyx of Held (Neher and Sakaba, 2001a). This method assumes that the total EPSC can be separated into a residual current component because of delayed clearance of glutamate in the synaptic cleft and a current component evoked by quantal release events. By combining deconvolution with fluctuation analysis, we have shown previously that this method is valid in the presence of cyclothiazide and kynurenic acid, which block desensitization and possible saturation of the postsynaptic AMPA receptors (Neher and Sakaba, 2001a). Quantal release rates, as determined by deconvolution, were integrated to obtain cumulative release, as displayed in the figures.
Variance analysis was performed to estimate quantal amplitudes and release rates as has been described previously (Neher and Sakaba, 2001a). Trains (300 Hz) of AP-like stimuli were applied with intertrain intervals of >30 s. More than five trains were applied to each presynaptic terminal. For the variance calculation, the differences between two subsequent traces were used. These differences were further filtered to extract fluctuation associated with quantal events. All values are expressed as mean ± SEM.
Results
Synchronous and asynchronous release during a 100 Hz train of the AP-like train
In this study, the roles of kinetically distinct vesicle pools during a high-frequency train of AP-like stimuli were examined. The presynaptic patch pipette contained a low Ca2+ buffer (0.05 mm EGTA), and the extracellular solution contained cyclothiazide and kynurenic acid to prevent postsynaptic AMPA receptor desensitization and saturation (Neher and Sakaba, 2001a; Joshi and Wang, 2002; Scheuss et al., 2002; Taschenberger et al., 2002). In Figure 1A, the presynaptic terminal was depolarized to +40 mV for 1 ms to mimic an AP. Such an AP-like stimulus elicited a presynaptic Ca2+ tail current (Fig. 1A, Ipre) and induced a Ca2+ influx of 1.09 ± 0.13 pC (n = 6 cells; range, 1–1.5 pC). This was only slightly larger than that induced by a single AP in a previous study [1 pC (Borst and Sakmann, 1998)]. EPSCs were evoked in response to the presynaptic Ca2+ influx and had an amplitude of 2.82 ± 1.06 nA (n = 6). Considering that kynurenic acid blocks EPSC amplitudes by ∼50% (Neher and Sakaba, 2001a; Scheuss et al., 2002), the (corrected) amplitude is comparable to that evoked by a single AP in an unclamped terminal (3–10 nA) (Borst et al., 1995; Schneggenburger et al., 1999; Scheuss et al., 2002; Taschenberger et al., 2002). The deconvolution method was used to estimate quantal release rates (Neher and Sakaba, 2001a). The peak amplitude of the release rate was estimated to be 342 ± 138 vesicles ms−1, and the decline in the release rate after the peak could be fitted by a single exponential with a time constant of 347 ± 28 μs. The dotted gray line in Figure 1A shows the time point of 1.05 ms after the peak release rate (three times the decay constant) in which synchronous release declined completely. To quantify the amounts of synchronous and asynchronous release, the period between the two pulses (from immediately after the end of one voltage pulse to the next one) was separated into two segments (separated by dotted line in Fig. 1A), and the mean asynchronous release rate was determined from the number of release events that occurred during the second segment (after the dotted line). Then synchronous release was estimated from the first segment, by subtracting the mean asynchronous release rate observed during the second segment from the release rate during the first segment.
Figure 1.

Synaptic response to a 100 Hz train of AP-like stimuli at the calyx of Held. A, A single 1 ms depolarizing pulse to +40 mV was applied to the presynaptic terminal (AP-like stimulus) to elicit a Ca2+ current (Ipre). An EPSC was evoked in response to Ca2+ influx. Quantal release rates (rel. rate) were estimated using the deconvolution method. The amount of release before and after the dotted line was termed as synchronous and asynchronous release, respectively. B, The same cell pair as in A. A 100 Hz train of AP-like stimuli was applied, which was followed by a step-depolarizing pulse (prepulse to +70 mV for 2 ms, followed by repolarization to 0 mV for 50 ms). The dotted line in the EPSC trace indicates the residual current component attributable to delayed clearance of glutamate as modeled by the deconvolution method (residual current) (Neher and Sakaba, 2001a). The cumulative amount of release was obtained by integrating release rates from the deconvolution method. Filled circles in the cumulative release plot indicate cumulative amount of synchronous release during the train. C, The same cell pair as in A, and a single step-depolarizing pulse (prepulse to +70 mV, followed by repolarization to 0 mV for 50 ms) was applied to the presynaptic terminal. In cumulative release traces, the black trace indicates an original cumulative release. The gray trace indicates the cumulative release that is corrected by the recruitment of new vesicles after depletion (Sakaba and Neher, 2001a). D, Cumulative release traces during a step-depolarizing pulse with (B) and without (C) a preceding 100 Hz train (black traces). The difference between the two traces is shown as a gray trace and was used to estimate how many fast-releasing and slowly releasing vesicles had been released during a 100 Hz train by fitting the time course.
It has been shown that inactivation of presynaptic Ca2+ channels might contribute to synaptic depression during low-frequency stimulation by APs (Xu and Wu, 2005) (but see Takahashi et al., 2000). In this study, analysis was restricted to synaptic responses during high-frequency stimulation (≥100 Hz), in which presynaptic Ca2+ currents show little inactivation and depletion of releasable vesicles is the determining factor for synaptic depression (Wu and Borst, 1999). Figure 1B shows the response to a 100 Hz train of AP-like stimuli. The presynaptic Ca2+ currents (Fig. 1B, Ipre) showed an initial facilitation (the second pulse elicited 106.5 ± 2.0% of the first one; n = 6) with subsequent stimuli maintaining the slight enhancement (the last pulse elicited 108.3 ± 2.1%). EPSCs showed initial facilitation, followed by a strong depression (Fig. 1B, EPSC). The cumulative amount of release was estimated by integrating the quantal release rates obtained by the deconvolution method (Fig. 1B, bottom). During the train, 3297 ± 634 vesicles were released, on average (n = 6), with 2208 ± 468 vesicles released synchronously according to the above criterion. The amount of synchronous release was comparable to AP-evoked release in previous studies (Scheuss et al., 2002; Taschenberger et al., 2002). The fraction of synchronous release to total release varied among different cell pairs (50–80% of total) (compare Figs. 1B, 3C). When fitted by a single exponential, cumulative synchronous release had a time constant of 8.7 ± 1.3 AP-like stimuli. At the end of the train, a step depolarization (a prepulse to +70 mV for 2 ms, followed by a repolarization to 0 mV for 50 ms) was applied to deplete all releasable vesicles. In total (train plus depleting pulse), 4631 ± 810 vesicles were released, indicating that 50–80% of the total releasable vesicles were released during the train.
Figure 3.

Release of the fast-releasing and the slowly releasing vesicles during a 100 Hz train of AP-like stimuli. A, Similar to Figure 1, but a 100 Hz train (for 200 ms) was applied twice with an interval of 500 ms in the presence of the calmodulin inhibitor peptide (calmodulin binding domain, 20 μm). The duration of the AP-like stimulus was 1 and 1.5 ms, in the first (left) and the second (right) stimulation protocol, respectively. After a train, a step-depolarizing pulse (prepulse to +70 mV for 2 ms, followed by repolarization to 0 mV for 50 ms) was applied to deplete the remaining pool of releasable vesicles. Dotted lines in the EPSC traces indicate the current component mediated by delayed clearance of glutamate. The left and right panels use the same scale bars (right), except in the insets. The inset in the left panel shows release rates evoked by the first AP-like stimulus (gray) and the average release rates of the last five AP-like stimuli (black) during the first train. Bi, Superimposed traces of presynaptic calcium currents during the first (gray) and the second (black) trains. Only the responses to the first AP-like stimulus are shown. Bii, Average amount of presynaptic Ca2+ influx in response to a single AP-like stimulus during the first and the second trains. Biii, Total amount of presynaptic Ca2+ influx during the first and the second trains. C, Cumulative amounts of release during the first and the second trains (solid traces). By subtracting the cumulative release during the second train (slowly releasing vesicles only) from that during the first train, the release time course of the fast-releasing vesicles was estimated (open circles). The amount of synchronous release (synch. rel.) during the first train is shown as filled circles. The amount of synchronous release during the second train is shown as filled triangles.
Figure 1C shows the responses obtained when a step depolarization was applied to the presynaptic terminal (prepulse to +70 mV for 2 ms, followed by repolarization to 0 mV for 50 ms). Cumulative release during the depolarizing pulse (Fig. 1C, solid trace) shows a bi-exponential time course. The sustained phase of release late during the presynaptic depolarization was presumably attributable to the recruitment of synaptic vesicles. It has been shown that the recruitment of synaptic vesicles has a time constant of 100–300 ms (Wu and Borst, 1999; Sakaba and Neher, 2001b). When the effect of recruitment was corrected (Sakaba and Neher, 2001b), the slow component saturated earlier during the depolarizing pulse (Fig. 1C, gray trace). In the example trace, the cumulative release could be fitted by a double exponential with time constants of 1.02 ms (53% of the total fit, 1525 vesicles) and 9.17 ms (932 vesicles). On average, the cumulative release was fitted by a double exponential with time constants of 2.1 ± 0.48 ms (61 ± 9% of the total fit, ranging from 45 to 100%) and 18.2 ± 4.9 ms. The time constant of the slow component of release was variable with 0.05 mm EGTA in the presynaptic pipette, and cumulative release was best fitted by a single exponential in some cases. This is because of overlapping facilitation of the slow component of release, which was caused by accumulation of residual Ca2+ concentration during a prolonged depolarization (Wu and Borst, 1999; Sakaba and Neher, 2001a). Separation of the two components is much easier when a higher concentration of EGTA is added to the presynaptic pipette, with two components having time constants of 2–3 ms (50% of the total fit, fast-releasing vesicles) and 20–30 ms (slowly releasing vesicles), respectively (Sakaba and Neher, 2001a). If a single pool of vesicles is responsible for transmitter release at the calyx of Held, a single exponential release time course with a longer time constant should be observed at higher concentrations of EGTA, but this was not the case.
The amount of release during a step depolarization was reduced to 43 ± 13% (29–63%) when a 100 Hz train preceded a step depolarization (Fig. 1D; also Fig. 1, compare B, C). In four of six cell pairs, the two components of release during the control depolarizing pulse (without a preceding 100 Hz train) were well separated even in a low Ca2+-buffering condition (Fig. 1D, control). In these cases, cumulative release during the control depolarization (a total of 3071 ± 624 vesicles) was fitted by a double exponential with time constants of 1.45 ± 0.31 ms (55 ± 8% of the total fit, ≈1700 vesicles) and 14.8 ± 4.4 ms (≈1400 vesicles). To learn how many fast-releasing and slowly releasing vesicles contributed to the synaptic response during a 100 Hz train, the cumulative release during a step depolarization both with (Fig. 1D, with train) and without (Fig. 1D, control) a preceding 100 Hz train was compared. By subtracting the cumulative release after a 100 Hz train from that during the control depolarization (Fig. 1D, gray trace, difference), a 100 Hz train was estimated to have consumed 2107 ± 460 vesicles, and the difference (Fig. 1D, gray trace) could be fitted by a double exponential with time constants of 1.0 ± 0.20 ms (63 ± 7.3% of the total fit, ≈1300 vesicles) and 15.8 ± 3.8 ms (≈800 vesicles) (Fig. 1D, gray trace). Thus, ∼80% (1300 of 1700) of the fast-releasing and 60% (800 of 1400) of the slowly releasing vesicles must have released during a train. However, this approach does have a limitation, because a preceding 100 Hz train may have accumulated presynaptic residual Ca2+ concentration and accelerated the time course of release in the following pulse by facilitation (Wu and Borst, 1999; Sakaba and Neher, 2001a). Therefore, an alternative method was developed to estimate the contributions of fast-releasing and slowly releasing vesicles during a high-frequency train (see Fig. 3).
Correlation between presynaptic capacitance jumps and cumulative release estimated by the deconvolution method
The deconvolution method is based on the accurate estimation of the current component because of delayed clearance of glutamate (Neher and Sakaba, 2001a) (Fig. 1B, dotted trace). Thus, it is possible that the estimate of release (especially asynchronous release) might be inaccurate. Although fluctuation analysis has confirmed release rates estimated from the deconvolution method (Neher and Sakaba, 2001a, b), another independent estimate of release is important. To this end, the deconvolution method was combined with presynaptic capacitance measurements, which should reflect the amount of exocytosis (Fig. 2) (Neher and Marty, 1982; Lindau and Neher, 1988; Sun and Wu, 2001). The time course of exocytosis during the depolarizing pulse cannot be measured by the capacitance measurement because of large conductance changes. So, the number of stimuli (1–20) was varied to estimate the amount of release during an AP train (Fig. 2A–D). Figure 2A shows traces of presynaptic and postsynaptic currents during a 100 Hz train of 20 AP-like stimuli. Figure 2B shows the capacitance changes associated with this stimulation. After the train, presynaptic membrane capacitance was increased (Fig. 2B, Cm). The rapid capacitance decay (time course of 0.5 s after the stimulus train) associated with conductance changes (Fig. 2B, Gm) does not reflect the release of neurotransmitter, because botulinum toxins, which blocked EPSCs effectively (Sakaba et al., 2005; Yamashita et al., 2005), did not block this component (Yamashita et al., 2005). Indeed, the rapid decay remained after infusion of botulinum toxins that blocked postsynaptic currents (n = 3 cell pairs). After this initial decay, capacitance decayed within 10–30 s (depending on the stimulation strength) and presumably reflects endocytosis (data not shown) (Sun et al., 2002; Yamashita et al., 2005). Thus, the plateau after the rapid decay was used to obtain the amplitude of the capacitance jump because of the presynaptic stimulation (Fig. 2B, gray line). Figure 2, C and D, shows cumulative release and capacitance traces, respectively, which were obtained by a different number of AP-like stimuli. When comparing the amount of cumulative release estimated by the deconvolution method to the amplitude of capacitance jump, the relationship between the two was linear (Fig. 2E) (correlation coefficient of 0.97 ± 0.01 from n = 7 cell pairs), suggesting that the deconvolution method is consistent with capacitance measurements. The slope of the relationship in Figure 2E suggests that release of a single vesicle adds a capacitance of 80 ± 12 aF. The values were variable (42–110 aF) but overlapped with the previous estimate (55 aF) (Sun et al., 2002). The results from presynaptic capacitance measurements support the idea that the deconvolution method gives a valid estimate of release during presynaptic stimulation.
Figure 2.
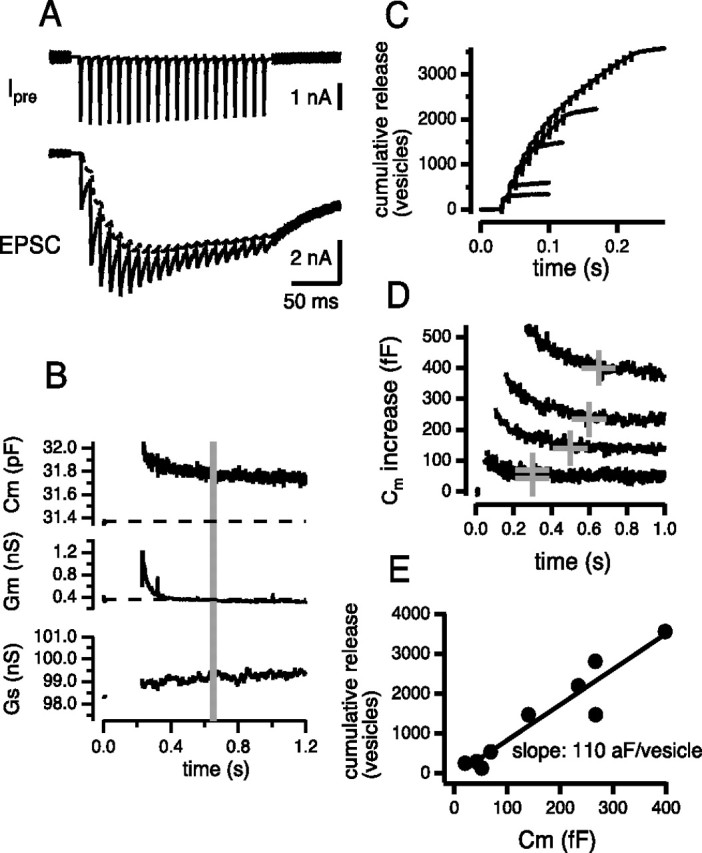
Correlation between the amounts of cumulative release and presynaptic capacitance responses. A, A 100 Hz train of AP-like stimuli was applied, and presynaptic calcium currents and EPSCs are shown. The dotted line in the EPSC trace indicates the current component attributable to delayed clearance of glutamate. B, Presynaptic capacitance (Cm), conductance (Gm), and series conductance (Gs) values before and after a 100 Hz train of AP-like stimuli as shown in A. C, Cumulative amounts of release estimated by the deconvolution method. The number of AP-like stimuli was varied from 1 to 20. The same cell pair as in A and B is shown. D, The same cell pair, but presynaptic capacitance changes in response to the trains are shown. The cross symbol indicates where the amplitude of capacitance increase relative to baseline was measured. E, Correlation between the amount of cumulative release and the capacitance jump elicited by a train, obtained from C and D.
Roles of the fast-releasing and the slowly releasing synaptic vesicles during a 100 Hz train of AP-like stimuli
It has been shown previously that 0.5 mm EGTA clearly separates the release of fast-releasing and the slowly releasing synaptic vesicles during a step depolarization (Sakaba and Neher, 2001a,b). On the other hand, this concentration of EGTA may slow down not only the slow component but also, to some extent, the fast component of release. In addition, the concentration of endogenous Ca2+ buffer is supposed to be much lower than 0.5 mm EGTA at postnatal days 8–10 (Borst et al., 1995; Borst and Sakmann, 1996). Furthermore, APs create only brief millisecond-long Ca2+ transients that may contribute to the release from both vesicle pools in quite complex ways, particularly when trains of APs are applied. To separate the two components of release during the AP-like stimulus train with low Ca2+ buffering, and under more physiological conditions, known differences between the time courses of recovery associated with the two components were used (Wu and Borst, 1999; Sakaba and Neher, 2001b). When Ca2+/calmodulin-dependent recovery of the fast-releasing vesicles (fast component of release) is blocked (Sakaba and Neher, 2001b), the slowly releasing vesicles (slow component of release) recover much faster (within 200 ms) than the fast-releasing vesicles (several seconds). In this condition, only slowly releasing vesicles should be available for release 500 ms after depletion of both the fast-releasing and the slowly releasing vesicles. At the same time, the interstimulus interval of 500 ms is long enough, such that the slowly releasing vesicles recover completely, whereas the fast-releasing vesicles remain depleted. Based on this idea, two trains of AP-like stimuli (100 Hz for 200 ms) were applied with an interval of 500 ms, and the responses between the two trains were compared (Fig. 3A). At the end of each train, a step depolarization (a prepulse to +70 mV for 2 ms, followed by a repolarization to 0 mV for 50 ms) was applied to deplete all releasable vesicles. Ca2+-dependent recruitment of the fast-releasing vesicles was blocked by 20 μm calmodulin binding domain peptide (CaM kinase II 290-309) in the presynaptic patch pipette. Consistent with a previous study (Sakaba and Neher, 2001b), recovery of the fast-releasing vesicles, measured with a pair of step depolarizations separated by an interval of 500 ms, was only 6 ± 6% (n = 3 cell pairs) when 0.5 mm EGTA and 20 μm calmodulin binding domain peptide were included in the presynaptic patch pipette.
Presynaptic Ca2+ currents showed initial facilitation (105.7 ± 0.9% on the second pulse) and little inactivation during a 100 Hz train (Fig. 3A, left) (99.5 ± 1.1% at the last stimulation; n = 6 cell pairs). With an interval of 500 ms, the same stimulation protocol was applied again (Fig. 3A, right). Because presynaptic Ca2+ currents inactivate slightly during the second train (Forsythe et al., 1998), the duration of each AP-like stimulus was prolonged to 1.5 ms to adjust the amount of presynaptic Ca 2+ influx between the two trains (Fig. 3B). As has been shown in Figure 1, the first pulse train evoked phasic EPSCs that usually showed evidence of depression around the 10th stimulation. The inset in Figure 3A shows release rates evoked by the first AP-like stimulus (gray) and the average release rates of the last five stimuli (black), showing more asynchronous release later during the train. The first train released 3372 ± 713 vesicles, of which 1619 ± 362 vesicles were released synchronously (n = 6 cell pairs) (Figs. 3C, filled circles, 4). A subsequent step depolarization released additional synaptic vesicles, with 4523 ± 838 vesicles being released in total (Fig. 4, train+pulse). Thus, a pool of releasable vesicles was not emptied during the train.
Figure 4.

The amount of fast-releasing vesicles during a 100 Hz train of AP-like stimuli. From the left, the amount of synchronous release, the amount contributed by fast-releasing vesicles, the total amount of release during the first 100 Hz train, and the total amounts of release including those during a depleting pulse are shown. Data were obtained by using the stimulation protocol shown in Figure 3. The average data are from n = 6 cell pairs. Error bars indicate SEM.
The second train (Fig. 3A, right) produced much less synchronous release. On average, 1632 ± 310 vesicles were released during the second train, of which only 252 ± 38 vesicles were released synchronously (Fig. 3C, filled triangles). In total, 2309 ± 431 vesicles were released during the second stimulation protocol (train plus depleting pulse). Assuming that all vesicles released during the second stimulation protocol are the slowly releasing ones, 69 ± 3% of the total slowly releasing vesicles (train plus depleting pulse) were released during the second train. This fraction was comparable to that estimated using the method of Figure 1C (∼60%).
By comparing cumulative release obtained during the first and the second trains (Fig. 3C), the number of fast-releasing vesicles released during a 100 Hz train was estimated. Specifically, the cumulative release during the second stimulation protocol was subtracted from that during the first stimulation protocol to estimate the release time course of fast-releasing vesicles (Fig. 3C, open circles). This assumes that the second train releases only slowly releasing vesicles and that these are equal in number to those slow ones released during the first train. With this approach, 1770 ± 400 fast-releasing vesicles were estimated to be released during a 100 Hz train (Figs. 3C, open circles, 4). This number was similar to that of synchronous release during the first train (1619 ± 362 vesicles) (Figs. 3C, filled circles, 4). By also comparing responses obtained with the first and the second depleting step depolarizations, 2313 ± 453 fast-releasing vesicles were released in total (train plus depleting pulse), indicating that 75 ± 3% of the total fast-releasing vesicles were released during a train. This fraction was comparable to that estimated using the method of Figure 1C (80%). Release time courses of synchronous release and fast-releasing vesicles during a 100 Hz train were best described by single exponentials with time constants of 7.5 ± 0.9 and 8.5 ± 1.1 AP-like stimuli, respectively. Similar time courses and amounts of release (Fig. 4) suggest that fast-releasing vesicles are mainly responsible for synchronous release. At the same time, these data also suggest that most of the asynchronous release during application of a high-frequency train is mediated by the slowly releasing vesicles.
Roles of the fast-releasing and the slowly releasing vesicles during a 300 Hz train of AP-like stimuli
A 100 Hz stimulation caused variable amounts of asynchronous release (Figs. 1–4). Higher-frequency stimulation (300 Hz) would lead to elevated Ca2+ concentrations and elicit more asynchronous release. In Figure 5, a 300 Hz train of AP-like stimuli (1 ms depolarization to +40 mV) was applied for 100 ms (Fig. 5). A 300 Hz train was strong enough to deplete most of the releasable vesicles, which was confirmed by a subsequent depleting pulse (prepulse to +70 mV for 2 ms, followed by repolarization to 0 mV for 20 ms) (Fig. 5). Specifically, the 300 Hz train and the depleting pulse released 3169 ± 519 and 295 ± 43 vesicles, respectively (n = 8). Therefore, both fast-releasing and slowly releasing vesicles were mostly depleted during a train, as has been shown previously for the case of APs by Wu and Borst (1999).
Figure 5.

Synaptic response to a 300 Hz train of AP-like stimuli. AP-like stimuli were applied 30 times to the presynaptic terminal at a frequency of 300 Hz. After the train, a single step-depolarizing pulse (prepulse to +70 mV for 2 ms, followed by repolarization to 0 mV for 20 ms) was applied to release remaining releasable vesicles.
The same stimulation protocol as shown in Figure 3 was used in the presence of a calmodulin blocker to examine roles of the two sets of vesicles during a 300 Hz train of AP-like stimuli. Figure 6A shows an example of two 300 Hz trains. On average, the first 300 Hz train released 2204 ± 215 vesicles in total (n = 7 cell pairs) (Fig. 7). In the case of Figure 6A, synchronous EPSCs showed strong depression within the 10th stimulation, whereas asynchronous release persisted later during the train (Fig. 6A, left, inset). Correspondingly, cumulative release did not increase in a step-like manner in response to individual pulses later during the train. Rather, a continuous almost linearly increasing cumulative release was observed (Fig. 6C, uppermost trace and inset), suggesting copious asynchronous release.
Figure 6.

Release of the fast-releasing and the slow releasing vesicles during a 300 Hz train of AP-like stimuli. A, The same as Figure 3, but a 300 Hz train (for 100 ms) was applied twice with an interval of 500 ms in the presence of the calmodulin inhibitor peptide. From the top, presynaptic calcium currents (ICa), EPSCs, and release rates are shown. The left and right panels use the same scale bars. The expanded EPSC trace (left) and release rates (right) later during the train (time period indicated by a bar in the EPSC trace) are shown as an inset. The dotted line in the expanded release trace indicates a release rate of 0. Bi, Superimposed traces of presynaptic calcium currents during the first and the second trains. Only the responses to the first AP-like stimulus were shown. Bii, Average amount of presynaptic Ca2+ influx in response to a single AP-like stimulus during the first and the second trains. Biii, Total amount of presynaptic Ca2+ influx during the first and the second trains. C, Cumulative amounts of release during the first and the second trains (solid traces). By subtracting the cumulative release during the second train from that during the first train, the release time course of the fast-releasing vesicles was estimated (open circles), assuming that only the slowly releasing vesicles were isolated during the second train. The amount of synchronous release during the first train is shown as filled circles. The expanded cumulative release time course during the first train is shown as an inset.
Figure 7.

The amount of fast-releasing vesicles during a 300 Hz train of AP-like stimuli. From the left, the amount of synchronous release, the amount contributed by the fast-releasing vesicles, and the total amount of release during a train are shown. Data were obtained by using the stimulation protocol shown in Figure 6. The average data are from n = 9 cell pairs. Error bars indicate SEM.
The amount of synchronous and asynchronous release was determined by using the same method shown in Figures 1–4. The amount of synchronous release during the train was 835 ± 85 vesicles (Figs. 6C, filled circles, 7), which was similar to that of fast-releasing vesicles (976 ± 119 vesicles) (Figs. 6C, open circles, 7). Furthermore, synchronous release has a time course (time constant of 10.7 ± 1.7 AP-like stimuli when fitted by a single exponential) similar to the release of fast-releasing vesicles (time constant of 9.3 ± 0.9 AP-like stimuli).
To obtain an independent estimation of the release rates late during the train (50–100 ms), an ensemble variance analysis was combined (Neher and Sakaba, 2001a). In seven cell pairs, a 300 Hz train was repeated more than five times, and quantal size was estimated to be 18.6 ± 1.8 pA; this is similar to the value reported in the presence of cyclothiazide and kynurenic acid (15 pA) (Neher and Sakaba, 2001a; Scheuss et al., 2002). The release rate from the variance analysis was estimated to be 6.1 ± 1.1 vesicles/ms, similar to the value estimated from the deconvolution method (6.3 ± 1.1 vesicles/ms).
From the experiment shown in Figure 6, it is concluded that synchronous release at 300 Hz is primarily carried by fast-releasing vesicles. In addition, asynchronous release is mediated by the slowly releasing vesicles. These conclusions are the same as those obtained using a 100 Hz train (Figs. 1–4). Although a 300 Hz train depletes most of the rapid-releasing and the slowly releasing vesicles (Fig. 5), a 100 Hz train depletes 75–80% and 50–70% of the fast-releasing and the slowly releasing vesicles, respectively (Figs. 1C, 3)
Discussion
In this study, the roles of two kinetically distinct pools of vesicles in synaptic transmission at the calyx of Held were examined, and it was shown that the fast-releasing vesicles mainly contributed to synchronous release, whereas the slowly releasing vesicles mainly contributed to asynchronous release occurring during a high-frequency train of AP-like stimuli (Figs. 3–7). Synchronous release underwent rapid depression, whereas asynchronous release persisted throughout the train (Figs. 3, 6).
The estimation of transmitter release is based on the deconvolution method (Neher and Sakaba, 2001a), which involves a model of delayed glutamate clearance from the synaptic cleft. An accurate estimation of release rates was especially difficult when release rates were low and a significant current component attributable to delayed clearance of glutamate was seen. Nevertheless, other observations supported the notion that asynchronous release occurred during a high-frequency train of AP-like stimuli. The amplitude of the presynaptic capacitance response observed after an AP train had a linear relationship to the cumulative amount of release obtained by the deconvolution method (Fig. 2). Different types of fluctuation analysis confirmed the release rates estimated from the deconvolution method (Neher and Sakaba, 2001a,b; Scheuss et al., 2002). Furthermore, variance analysis of the late phase of EPSCs attained during a 300 Hz train of AP-like stimuli gave estimates of release rates similar to those obtained from the deconvolution method (this study). Variance analysis also showed that quantal amplitudes stayed constant during a high-frequency train. It is interesting to note that short-term synaptic depression accompanies decrease in quantal sizes, which is not attributable to postsynaptic mechanisms at hippocampal synapses (Chen et al., 2004).
Asynchronous release during high-frequency stimulation was mainly mediated by the slowly releasing synaptic vesicles (the slow component of release) observed with a step depolarization (Figs. 3–7). Asynchronous release termed here is vesicle release that takes place after synchronous release decays fully and before the next stimulation. It is therefore different from delayed release, which was elicited for a prolonged period after (high-frequency) stimulation (in the order of hundreds of milliseconds to seconds) (Midlei and Thies, 1971; Rahamimoff and Yaari, 1973; Zengel and Magleby, 1981; Zucker and Lara-Estralla, 1983; Atluri and Regehr, 1998). It is possible that the slowly releasing vesicles contribute to synchronous release, although the contribution must be relatively small. In the experiment shown in Figure 3C, 20% of the total release during the second stimulation (≈200 vesicles) occurred synchronously. Recovery of the fast-releasing vesicles has a time constant of 5 s in the presence of a calmodulin blocker (Sakaba and Neher, 2001b), so a 500 ms interval should have allowed recovery of 10% of the fast-releasing component (≈100–150 vesicles), which can be released synchronously. The remaining 50–100 vesicles may then originate from the slowly releasing pool. Thus, any claim that synchronous release is mediated solely by the fast-releasing vesicles would be an over-simplification. Furthermore, given that replenishment rates of slowly releasing vesicles are quite high and release probability is low, slowly releasing vesicles may especially contribute to the steady-state postsynaptic responses during repetitive stimulation. Synaptic responses under a long-lasting train of APs are difficult to study, because other factors such as presynaptic Ca2+ channel inactivation may contribute to synaptic depression (Forsythe et al., 1998; Xu and Wu, 2005) (but see Takahashi et al., 2000). Furthermore, when the intervals between stimulations are increased, calmodulin-independent recovery of the fast-releasing vesicles (time constant of 4–6 s) contributes more significantly to the synaptic responses. Then the analysis used in Figures 3–7 cannot be adopted because I will violate the underlying assumption that recovery of the fast-releasing vesicles is minor. Selective block of the fast-releasing and the slowly releasing components of release at resting conditions will be helpful.
We have shown before that recruitment of slowly releasing vesicles is much faster than that of fast-releasing vesicles (Wu and Borst, 1999; Sakaba and Neher, 2001b). Moreover, recovery of the fast-releasing vesicles was retarded, when recovery of the slowly releasing vesicles was slowed by disruption of actin polymerization or depletion of ATP in the presynaptic terminal (Sakaba and Neher, 2003). These observations led to the working hypothesis that the fast-releasing vesicles are derived from maturation from the slowly releasing synaptic vesicles (Wu and Borst, 1999; Sakaba and Neher, 2003). At the calyx of Held, the recruitment rate of the slowly releasing vesicles is 10 vesicles ms−1 (Neher and Sakaba, 2001b), which persists even during a 500 ms step depolarization (our unpublished observation). Consistent with this, optical measurements at the calyx of Held synapse using FM1-43 have demonstrated a large reserve pool of vesicles, which is 10 times larger than the releasable pool of vesicles (the fast-releasing and the slowly releasing vesicles combined). This pool recycles with a time course of minutes (de Lange et al., 2003). An asynchronous release rate of six vesicles ms−1 was observed during a 300 Hz train (Fig. 6), which was similar or below the recruitment rate of slowly releasing vesicles. This means that newly recruited synaptic vesicles are released as asynchronous release during a high-frequency train of AP-like stimuli once most of the releasable vesicles have been depleted. Under the working hypothesis of vesicle maturation, it is also expected that synchronous release remains depressed as long as the slowly releasing vesicle pool is not refilled. In this respect, it is possible that ongoing asynchronous release causes further depression of the synchronous release component, as has been shown by Otsu et al. (2004). It is also possible that asynchronous release can access both immediately and readily releasable pools of synaptic vesicles, depending on the stimulation patterns, regulation of Ca2+ buffering, and extrusion in the presynaptic terminal as proposed by Hagler and Goda (2001). Possible cross talk of the two vesicle pools needs future systematic study under a wider range of physiological conditions.
The present study has demonstrated that different release kinetics arises from physically distinct pools of synaptic vesicles. The importance of the work is that we can predict changes in synchronous/asynchronous release from effects that neuromodulators, deletion/mutation of synaptic proteins, or various stimulus patterns have on one of the two pools. However, inference in the reverse sequence, from a change in synchronous/asynchronous release to change in vesicle pools is more difficult, although this might be more relevant for the study of most synapses. Other factors, such as changes in AP waveforms, inactivation and facilitation of Ca2+ channels, and regulation of presynaptic Ca2+ concentration in the presynaptic terminal, may also contribute to observed changes and confound their interpretation. Furthermore, because of such factors, it is not necessarily the easiest task to determine physically distinct vesicle pools based on the time course of synaptic depression (Elmqvist and Quastel, 1965; Schneggenburger et al., 1999). The approach shown here is limited to a few preparations, in which vesicle pools can be directly measured, but it may be helpful for the formulation of reasonable models in small synapses, which are not accessible by conventional methods. Specifically, the observation here may have an implication for the synapses where asynchronous release is copious and increases during a high-frequency stimulation (Vincient and Marty, 1996; Lu and Trussell, 2000; Hefft and Jonas, 2005). Although this may be explained by differences in regulation of presynaptic Ca2+ concentration and Ca2+ sensitivity of transmitter release (Millar et al., 2005), an alternative explanation could be that the ratio of the fast-releasing and the slowly releasing vesicles differs among synapses.
Footnotes
This work was supported by the Deutsche Forschungsgemeinschaft Center for Molecular Physiology of Brain (Göttingen, Germany). I am grateful to Dr. Erwin Neher for most valuable discussion and comments throughout this work. I also thank Ruth Heidelberger, Matthew Holt, Nobutake Hosoi, Ralf Schneggenburger, Holger Taschenberger, and two anonymous reviewers for helpful comments on this manuscript.
References
- Atluri PP, Regehr WG (1998). Delayed release of neurotransmitter release from cerebellar granule cells. J Neurosci 18:8214–8227. [DOI] [PMC free article] [PubMed] [Google Scholar]
- Betz WJ (1970). Depression of transmitter release at neuromuscular junction of frog. J Physiol (Lond) 206:629–644. [DOI] [PMC free article] [PubMed] [Google Scholar]
- Borst JGG, Sakmann B (1996). Calcium influx and transmitter release in a fast CNS synapse. Nature 383:431–434. [DOI] [PubMed] [Google Scholar]
- Borst JGG, Sakmann B (1998). Calcium current during a single action potential in a large presynaptic terminal of the rat brainstem. J Physiol (Lond) 506:143–157. [DOI] [PMC free article] [PubMed] [Google Scholar]
- Borst JGG, Helmchen F, Sakmann B (1995). Pre- and postsynaptic whole-cell recordings in the medial nucleus of the trapezoid body of the rat. J Physiol (Lond) 489:825–840. [DOI] [PMC free article] [PubMed] [Google Scholar]
- Chen G, Harata NC, Tsien RW (2004). Paired-pulse depression of unitary quantal amplitudes at single hippocampal cultures. Proc Natl Acad Sci USA 101:1063–1068. [DOI] [PMC free article] [PubMed] [Google Scholar]
- Christensen BN, Martin AR (1970). Estimates of probability of transmitter release at the mammalian neuromuscular junction. J Physiol (Lond) 210:933–945. [DOI] [PMC free article] [PubMed] [Google Scholar]
- de Lange RPJ, de Roos ADG, Borst JGG (2003). Two modes of vesicle recycling in the rat calyx of Held. J Neurosci 23:10164–10173. [DOI] [PMC free article] [PubMed] [Google Scholar]
- Dittman JS, Regehr WG (1998). Calcium dependence and recovery kinetics of presynaptic depression at the climbing fiber to purkinje cell synapse. J Neurosci 18:6147–6162. [DOI] [PMC free article] [PubMed] [Google Scholar]
- Dobrunz LE, Stevens CF (1997). Heterogeneity of release probability, facilitation, and depletion at central synapses. Neuron 18:995–1008. [DOI] [PubMed] [Google Scholar]
- Elmqvist D, Quastel DM (1965). A quantitative study of end-plate potentials in isolated human muscle. J Physiol (Lond) 178:505–529. [DOI] [PMC free article] [PubMed] [Google Scholar]
- Forsythe ID (1994). Direct patch recording from identified presynaptic terminals mediating glutamatergic EPSCs in the rat CNS, in vitro. J Physiol (Lond) 479:381–387. [DOI] [PMC free article] [PubMed] [Google Scholar]
- Forsythe ID, Tsujimoto T, Barnes-Davies M, Cuttle MF, Takahashi T (1998). Inactivation of presynaptic calcium current contributes to synaptic depression at a fast central synapse. Neuron 20:797–807. [DOI] [PubMed] [Google Scholar]
- Gansel M, Penner R, Dreyer F (1987). Distinct sites of action of clostridial neurotoxins revealed by double-poisoning of mouse motor nerve terminals. Pflügers Arch 409:533–539. [DOI] [PubMed] [Google Scholar]
- Geppert M, Goda Y, Hammer RE, Li C, Rosahl TW, Stevens CF, Südhof TC (1994). Synaptotagmin I: a major Ca2+ sensor for transmitter release at a central synapse. Cell 79:717–727. [DOI] [PubMed] [Google Scholar]
- Hagler DJ, Goda Y (2001). Properties of synchronous and asynchronous release during pulse train depression in cultured hippocampal neurons. J Neurophysiol 85:2324–2334. [DOI] [PubMed] [Google Scholar]
- Hefft S, Jonas P (2005). Asynchronous GABA release generates long-lasting inhibition at a principal interneuron-principal neuron synapse. Nat Neurosci 8:1319–1328. [DOI] [PubMed] [Google Scholar]
- Hessler NA, Shirke AM, Malinow R (1993). The probability of transmitter release at a mammalian central synapse. Nature 366:569–572. [DOI] [PubMed] [Google Scholar]
- Joshi I, Wang L-Y (2002). Developmental profiles of glutamate receptors and synaptic transmission at a single synapse in the mouse auditory brainstem. J Physiol (Lond) 540:861–873. [DOI] [PMC free article] [PubMed] [Google Scholar]
- Kusano K, Landau EM (1975). Depression and recovery of transmission at the squid giant synapse. J Physiol (Lond) 245:13–32. [DOI] [PMC free article] [PubMed] [Google Scholar]
- Lindau M, Neher E (1988). Patch-clamp techniques for time-resolved capacitance measurements in single cells. Pflügers Arch 411:137–146. [DOI] [PubMed] [Google Scholar]
- Littleton JT, Stern M, Schulze K, Perin M, Bellen HJ (1993). Mutational analysis of Drosophila synaptotagmin demonstrates its essential role in Ca2+-activated neurotransmitter release. Cell 74:1125–1134. [DOI] [PubMed] [Google Scholar]
- Lu T, Trussell LO (2000). Inhibitory transmission mediated by asynchronous release. Neuron 26:683–694. [DOI] [PubMed] [Google Scholar]
- Martin TFJ (2003). Tuning exocytosis for speed: fast and slow modes. Biochim Biophys Acta 1641:157–165. [DOI] [PubMed] [Google Scholar]
- Midlei R, Thies R (1971). Tetanic and post-tetanic rise in frequency of miniature end-plate potentials in low-calcium solutions. J Physiol (Lond) 212:245–257. [DOI] [PMC free article] [PubMed] [Google Scholar]
- Millar AG, Zucker RS, Ellis-Davies GCR, Charlton MP, Atwood HL (2005). Calcium sensitivity of neurotransmitter release differs at phasic and tonic synapses. J Neurosci 25:3113–3125. [DOI] [PMC free article] [PubMed] [Google Scholar]
- Molgo J, Siegel LS, Tabti N, Thesleff S (1989). A study of synchronization of quantal transmitter release from mammalian motor endings by the use of botulinal toxin A and D. J Physiol (Lond) 411:195–205. [DOI] [PMC free article] [PubMed] [Google Scholar]
- Moser T, Beutner D (2000). Kinetics of exocytosis and endocytosis at the cochlear inner hair cell afferent synapse of the mouse. Proc Natl Acad Sci USA 97:883–888. [DOI] [PMC free article] [PubMed] [Google Scholar]
- Moulder KL, Mennerick S (2005). Reluctant vesicles contribute to the total readily releasable pool in glutamatergic hippocampal neurons. J Neurosci 25:842–3850. [DOI] [PMC free article] [PubMed] [Google Scholar]
- Neher E, Marty (1982). A Discrete changes of cell-membrane capacitance observed under conditions of enhanced secretion in bovine adrenal chromaffin cells. Proc Natl Acad Sci USA 79:6712–6716. [DOI] [PMC free article] [PubMed] [Google Scholar]
- Neher E, Sakaba T (2001a). Combining deconvolution and noise analysis for the estimation of transmitter release rates at the calyx of Held. J Neurosci 21:444–461. [DOI] [PMC free article] [PubMed] [Google Scholar]
- Neher E, Sakaba T (2001b). Estimating transmitter release rates from postsynaptic current fluctuations. J Neurosci 21:9638–9654. [DOI] [PMC free article] [PubMed] [Google Scholar]
- Neher E, Zucker RS (1993). Multiple calcium-dependent processes related to secretion in bovine chromaffin cells. Neuron 10:21–30. [DOI] [PubMed] [Google Scholar]
- Nishiki T, Augustine GJ (2004). Synaptotagmin I synchrononizes transmitter release in mouse hippocampal neurons. J Neurosci 24:6127–6132. [DOI] [PMC free article] [PubMed] [Google Scholar]
- Otsu Y, Shaherzaei V, Raymond LA, Delaney KL, Murphy TH (2004). Competition between phasic and asynchronous release for recovered synaptic vesicles at developing hippocampal autaptic synapses. J Neurosci 24:420–433. [DOI] [PMC free article] [PubMed] [Google Scholar]
- Rahamimoff R, Yaari Y (1973). Delayed release of transmitter at the frog neuromuscular junction. J Physiol (Lond) 228:241–257. [DOI] [PMC free article] [PubMed] [Google Scholar]
- Rosenmund C, Clements JD, Westbrook GL (1993). Nonuniform probability of glutamate release at a hippocampal synapse. Science 262:754–757. [DOI] [PubMed] [Google Scholar]
- Rosenmund C, Sigler A, Augustin I, Reim K, Brose N, Rhee J-S (2002). Differential control of vesicle priming and short-term plasticity by Munc13 isoforms. Neuron 33:411–424. [DOI] [PubMed] [Google Scholar]
- Sakaba T, Neher E (2001a). Quantitative relationship between transmitter release and calcium current at the calyx of Held synapse. J Neurosci 21:462–476. [DOI] [PMC free article] [PubMed] [Google Scholar]
- Sakaba T, Neher E (2001b). Calmodulin mediates rapid recruitment of fast-releasing synaptic vesicles at a calyx-type synapse. Neuron 32:1119–1131. [DOI] [PubMed] [Google Scholar]
- Sakaba T, Neher E (2003). Involvement of actin polymerization in vesicle recruitment at the calyx of Held synapse. J Neurosci 23:837–846. [DOI] [PMC free article] [PubMed] [Google Scholar]
- Sakaba T, Stein A, Jahn R, Neher E (2005). Distinct kinetic changes in neurotransmitter release after SNARE cleavage. Science 309:491–494. [DOI] [PubMed] [Google Scholar]
- Scheuss V, Schneggenburger R, Neher E (2002). Separation of pre- and postsynaptic contributions to depression by covariance analysis of successive EPSCs at the calyx of Held synapse. J Neurosci 22:728–739. [DOI] [PMC free article] [PubMed] [Google Scholar]
- Schneggenburger R, Meyer AC, Neher E (1999). Released fraction and total size of a pool of immediately available transmitter quanta at a calyx synapse. Neuron 23:399–409. [DOI] [PubMed] [Google Scholar]
- Schoch S, Deak F, Königstorfer A, Mozhayeva M, Sara Y, Südhof TC, Kavalali ET (2001). SNARE function analyzed in synaptobrevin/VAMP knockout mice. Science 294:1117–1121. [DOI] [PubMed] [Google Scholar]
- Sun JY, Wu LG (2001). Fast kinetics of exocytosis revealed by simultaneous measurements of presynaptic capacitance and postsynaptic currents at a central synapse. Neuron 30:171–182. [DOI] [PubMed] [Google Scholar]
- Sun JY, Wu XS, Wu LG (2002). Single and multiple vesicle fusion induce different rates of endocytosis at a central synapse. Nature 417:555–559. [DOI] [PubMed] [Google Scholar]
- Takahashi T, Hori T, Kajikawa Y, Tsujimoto T (2000). The role of GTP-binding protein activity in fast central synaptic transmission. Science 289:460–463. [DOI] [PubMed] [Google Scholar]
- Taschenberger H, Leao RM, Rowland KC, Spirou GA, von Gersdorff H (2002). Optimizing synaptic architecture and efficiency for high-frequency transmission. Neuron 36:1127–1143. [DOI] [PubMed] [Google Scholar]
- Thomas P, Wong JG, Lee AK, Almers W (1993). A low affinity Ca2+ receptor controls the final step in peptide secretion from pituitary melanotrophs. Neuron 11:93–104. [DOI] [PubMed] [Google Scholar]
- Thoreson WB, Rabl L, Townes-Anderson E, Heidelberger R (2004). A highly Ca2+-sensitive pool of vesicles contributes to linearity at the rod photoreceptor ribbon synapse. Neuron 42:595–605. [DOI] [PMC free article] [PubMed] [Google Scholar]
- Vincient P, Marty (1996). A fluctuation of inhibitory postsynaptic currents in purkinje cells from rat cerebellar slices. J Physiol (Lond) 494:183–199. [DOI] [PMC free article] [PubMed] [Google Scholar]
- von Gersdoff H, Borst JGG (2002). Short-term plasticity at the calyx of Held. Nat Rev Neurosci 53:56–64. [DOI] [PubMed] [Google Scholar]
- von Gersdorff H, Matthews G (1994). Dynamics of synaptic vesicle fusion and membrane retrieval in synaptic terminals. Nature 367:735–739. [DOI] [PubMed] [Google Scholar]
- Walmsley B, Edwards FR, Tracey DJ (1998). Non-uniform release probabilities underlie quantal synaptic transmission at a mammalian excitatory central synapse. J Neurophysiol 60:889–908. [DOI] [PubMed] [Google Scholar]
- Wu LG, Borst JGG (1999). The reduced release probability of releasable vesicles during recovery from short-term synaptic depression. Neuron 23:821–832. [DOI] [PubMed] [Google Scholar]
- Xu J, Wu LG (2005). The decrease in the presynaptic calcium current is a major cause of short-term depression at a calyx synapse. Neuron 46:633–645. [DOI] [PubMed] [Google Scholar]
- Yamashita T, Hige T, Takahashi T (2005). Vesicle endocytosis requires dynamin-dependent GTP hydrolysis at a fast CNS synapse. Science 307:124–127. [DOI] [PubMed] [Google Scholar]
- Zengel JE, Magleby KL (1981). Changes in miniature endplate potential frequency during repetitive nerve stimulation in the presence of Ca2+, Ba2+, and Sr2+ at the frog neuromuscular junction. J Gen Physiol 77:503–529. [DOI] [PMC free article] [PubMed] [Google Scholar]
- Zucker RS, Lara-Estrella LO (1983). Post-tetanic decay of evoked and spontaneous transmitter release at crayfish neuromuscular junctions. J Gen Physiol 81:355–372. [DOI] [PMC free article] [PubMed] [Google Scholar]