

Abstract
In this report we link candidate genes to complex behavioral phenotypes by using a behavior genetics approach. Gene expression signatures were generated for the prefrontal cortex, ventral striatum, temporal lobe, periaqueductal gray, and cerebellum in eight inbred strains from priority group A of the Mouse Phenome Project. Bioinformatic analysis of regionally enriched genes that were conserved across all strains revealed both functional and structural specialization of particular brain regions. For example, genes encoding proteins with demonstrated anti-apoptotic function were over-represented in the cerebellum, whereas genes coding for proteins associated with learning and memory were enriched in the ventral striatum, as defined by the Expression Analysis Systematic Explorer (EASE) application. Association of regional gene expression with behavioral phenotypes was exploited to identify candidate behavioral genes. Phenotypes that were investigated included anxiety, drug-naive and ethanol-induced distance traveled across a grid floor, and seizure susceptibility. Several genes within the glutamatergic signaling pathway (i.e., NMDA/glutamate receptor subunit 2C, calmodulin, solute carrier family 1 member 2, and glutamine synthetase) were identified in a phenotype-dependent and region-specific manner. In addition to supporting evidence in the literature, many of the genes that were identified could be mapped in silico to surrogate behavior-related quantitative trait loci. The approaches and data set described herein serve as a valuable resource to investigate the genetic underpinning of complex behaviors.
Keywords: mouse, seizure, phenotype, glutamate receptor, transcriptome, neuroanatomy
Introduction
Behavior genetics is a discipline structured, in part, to discover the relationship between the genome and behavior. Although some behaviors can be traced to single gene etiologies, most are highly complex (Plomin et al., 1994; Crabbe, 2002; Kendler, 2005). Traditional neuroscience strategies that focus on candidate transmitter systems and genes have advanced our understanding of brain function. However, even the broadest pharmacological and candidate gene investigation uncovers only a fraction of the protein-encoding genes known to participate in signal transduction (Mouse Genome Sequencing Consortium, 2002). In recent years initiatives have been designed to cast a larger net, using an open system approach that surveys variance in whole genome structure or expression (Sutcliffe, 2001). This large-scale “reverse genetics” approach can be divided mainly into mapping-based and transcriptome-based strategies.
The goal of the experiments described herein illustrates a behavior genetics approach, using multiple inbred strains and large-scale gene expression analysis to link candidate genes to complex behaviors. Inbred strain correlations are a powerful tool to determine the degree of genetic association between two phenotypes, a phenotype and neurochemical endpoint, or a phenotype and gene (Crabbe et al., 1983). Large-scale gene expression profiling has advanced to a stage at which the relative expression of thousands of genes can be characterized in a reliable and replicable manner (Lee and Saeed, 2006). The static and dynamic status of the relative expression pattern of a large number of genes provides a window into the complex state-set of the brain.
So that we could elucidate the genetic basis of behavioral differences across inbred strains, our goal was to develop a gene expression database across five brain regions thought to contribute somewhat distinctly to information processing in eight inbred strains. We chose to study inbred strains from priority group A of the Mouse Phenome Project (Bogue and Grubb, 2004; Grubb et al., 2004). These strains exhibit large genetic and behavioral diversity, making them ideal for relating gene expression differences to behavior. Moreover, a large on-line database of physiological and behavioral measurements is available for them (http://www.jax.org/phenome). Gene expression profiles within five brain regions across the eight inbred strains provide an opportunity to pursue numerous research questions related to neurodevelopment, neuroanatomy, and behavior.
Application of this strategy yielded many interesting findings pertaining to gene expression, neuronal genetic architecture, and behavior. First, significant gene expression differences across brain regions within a strain as well as across strains within a brain region were identified. The presence of region-enriched gene expression was associated with biological themes unique to the region. Second, a feature selection approach to cluster microarray data (Pavlidis and Noble, 2001) identified expression profiles that were highly correlated with several behavioral endpoints. Some of the identified genes have been associated with particular behaviors and/or quantitative trait loci (QTLs), thus validating our approach. Importantly, additional candidate genes were identified for future hypothesis testing. Furthermore, our survey of regional gene expression in standardized mouse genotypes, coupled with phenotyping data, serves as a valuable community resource to understand the genetic basis of complex behaviors.
Materials and Methods
Mouse strains
Eight mouse strains were used in this study: 129S1/SvImJ (129), A/J (AJ), BALB/cByJ (BALB), C3H/HeJ (C3H), C57BL/6J (C57), DBA/2J (DBA), FVB/NJ (FVB), and SJL/J (SJ). All animals were kept in a 12:12 reversed light cycle and were housed two to four per cage under standard conditions of 22°C room temperature and water and food ad libitum. Tissue was harvested from animals 1 week after an assessment of their exploratory behavior (Kafkafi et al., 2005). This test merely placed the subject in a large open field arena for a 30 min period. Tissue was taken from these subjects 2 weeks after the assessment.
Tissue harvest
Five brain regions were harvested: the prefrontal cortex (PF), ventral striatum (VS), temporal lobe (TL), periaqueductal gray (PG), and cerebellum (CR). Each mouse was killed by CO2 asphyxiation, followed by decapitation. The brain was removed and dissected by using a Plexiglas brain mold made for the mouse (David Kopf Instruments, Tujunga, CA). Using the atlas of Franklin and Paxinos as a reference (Paxinos and Franklin, 2001), we took the PF as a block consisting of tissue from 2 mm anterior to bregma to −1 mm posterior to bregma, extending from the dorsal surface of the cortex to 2.5 mm ventral to the skull surface. VS was taken as a block consisting of tissue from 2 mm anterior to bregma to −1 mm posterior to bregma, extending from a dorsal point 2.5 mm from the surface of the skull to the ventralmost portion of the brain. TL was taken as a block consisting of tissue from −1 to −3 mm posterior to bregma, extending from a dorsal point 3.75 mm from the surface of the skull to the ventralmost portion of the brain. PG (and dorsal raphe) was taken as a block consisting of tissue from −3.0 to −5.0 mm posterior to bregma, extending from a dorsal point 2.0 mm from the skull surface to 4 mm below the skull surface. Dissected tissue was stored immediately in RNAlater (Ambion, Austin, TX) per the manufacturer’s instructions.
PCR amplification of clone sets and microarray fabrication
The 27,648 element cDNA microarrays were fabricated by using the National Institute on Aging Ko set of 15,247 mouse cDNA clones (Tanaka et al., 2000), the National Institute of Mental Health Brain Molecular Anatomy Project (BMAP) set of 11,136 mouse cDNA clones, and 1265 quality control elements consisting of DMSO, salmon sperm DNA, Cot-1 DNA, and Arabidopsis thaliana genes (Wang et al., 2003). PCR amplicons were generated by using recombinant TaqDNA polymerase. PCR amplicons were purified by using 96-well-size exclusion vacuum filter plates. Purified products were resuspended in water and combined 1:1 with DMSO for microarray spotting. These products were spotted on Corning (Corning, NY) GAPS II γ amino propyl silane-coated microscope slides. Spotting was accomplished by an Intelligent Automation Systems (Brooks Automation, Chelmsford, MA) arrayer with a 48-tip print head to array the samples from 384-well microtiter plates. Arrayed samples were bound to the glass by UV cross-linking.
Isolation of total RNA from mouse brain tissue
Each brain region sample constituted a pool from four animals, and total RNA was isolated by using Trizol reagent (Invitrogen, Carlsbad, CA) per the manufacturer’s instruction for RNA isolation. Total RNA was prepared by using the RNeasy mini kit (Qiagen, Hilden, Germany) per the manufacturer’s instruction.
cDNA target preparation and hybridization
All hybridizations used a common reference design (Yang et al., 2002) in which experimental brain region RNA samples were compared individually with the Universal Mouse Reference RNA (Stratagene, La Jolla, CA). This reference design facilitates comparisons across strains and brain regions. An experimental sample was comprised in the following manner. Eight subjects from a particular genotype were killed, and the five brain regions were isolated. Each brain region from four subjects was pooled, thus forming two biological replicates. RNA was isolated from these pooled samples. Within each brain region each of the two biological replicates was divided additionally into two samples to enable a technical replication known as dye-swap. Thus expression analysis of a brain region for a particular genotype was derived from four hybridizations consisting of two biological replicates and two corresponding dye-swap samples. Altogether, 64 animals (8 strains × 8 animals per strain) were killed in the performance of 160 hybridizations (8 strains × 5 brain regions × 2 independent pools per brain region × 2 dye-swap experiments).
Labeled cDNA target was prepared as previously described (Malek et al., 2002). Briefly, total RNA (15 μg) from a pooled brain region was used to synthesize fluorescent cDNA target by reverse transcription with random hexamers, aminoallyl deoxyuridine 5′-triphosphate (dUTP), and Superscript II RNase H− reverse transcriptase, followed by chemical coupling with the cyanine 3 (Cy3) ester. Cy3-labeled brain region cDNA was mixed with Cy5-labeled reference cDNA derived from 15 μg of the Universal Mouse Reference RNA and cohybridized onto the array for 18–24 h at 42°C. Then the array was washed in decreasing concentrations of SSC at room temperature and spun dry. In a separate microarray hybridization representing a form of technical replication known as a dye-swap experiment, cDNA derived from the same pooled brain region RNA was labeled with Cy5 and cohybridized with Cy3-labeled reference cDNA. The dye-swap hybridization was performed to account for potential labeling bias (Yang et al., 2002).
Gene expression analysis
Microarrays were scanned on a GenePix 4000B scanner (Molecular Devices, Union City, CA). Acquired images were recorded as paired 16-bit tagged image file format (TIFF) files, and data extraction was performed with the Molecular Devices GenePix Pro 4 software. The following criteria were used to flag bad or extremely weak or poor spots from the array data set: spot area < 70 pixels, percentage of saturated pixels > 50%, and sum of the median signal intensity < 750. Normalization of each array was accomplished by using an intensity-dependent locally weighted scatterplot smoothing regression analysis (LOWESS) of nonflagged spots implemented in The Institute for Genomic Research (TIGR) Microarray Data Analysis System (MIDAS) software package (Saeed et al., 2003). LOWESS minimizes normalization errors by segmenting the entire scatterplot into hybridization intensity intervals and by using regression analysis within each interval (Yang et al., 2002). After normalization, expression ratios were log2 transformed. Hybridization data and parameter information can be accessed from the TIGR server at ftp://ftp.tigr.org/private/normslab/Gene_Pheno_Assoc/.
Quantitative real-time reverse transcriptase-PCR
To validate microarray data, we performed real-time reverse transcriptase-PCR (RT-PCR) on an Applied Biosystems (Foster City, CA) Prizm 7700 Sequence Detection System, using SYBR green as described previously (Malek et al., 2002). Total RNA from mouse TL, PF, and VS in all strains was reverse transcribed by using random primers per the manufacturer’s protocol. The resulting cDNA was diluted and used as template for RT-PCR. PCR primers were selected for specificity by the National Center for Biotechnology Information Basic Local Alignment Search Tool (NCBI BLAST) of the mouse genome, and amplicon specificity was verified by first-derivative melting curve analysis with the use of software provided by PerkinElmer (Emeryville, CA) and Applied Biosystems. Quantitation and normalization of relative gene expression were accomplished by using the comparative threshold cycle method as described previously (Joe et al., 2005). The following genes were identified by microarray analysis as differentially expressed across strains and subjected to RT-PCR validation: NMDA/glutamate receptor subunit 2C (Grin2C; NM_010350), NMDA/glutamate receptor subunit 1ζ (Grin1; NM_008169), nitric oxide synthase (NOS; AW551549), telomeric repeat binding factor 1 (Terf1; NM_009352), calmodulin (Calm; NM_009790), glutamine synthetase (Glns; NM_008131), syntaxin-binding protein 2 (Stxbp2; NM_011503), chemokine (C-X-C motif) ligand 12 (Cxcl12; NM_001012), and solute carrier family 1 member 2 (Slc1a2; NM_011393). The following “housekeeping” genes were used for normalization: tumor suppressor candidate 3 (GenBank accession number NM_030254), Wilms’ tumor 1-associating protein (NM_175394), and Deleted in polyposis 1 (NM_007874) in the TL; and Round spermatid basic protein 1 (NM_172684), dynein light chain LC8-type 2 (NM_026556), and DnaJ homolog, subfamily C member 8 (NM_172400) in the VS. Real-time RT-PCR primer pair sequences for the differentially regulated and housekeeping genes are given in supplemental Table 1 (available at www.jneurosci.org as supplemental material).
Statistical analysis
Replicability and general strategy.
Experimental reproducibility of microarray hybridizations was assessed by comparing VS samples from multiple batches of C57BL/6J mice hybridized against the Universal Mouse Reference RNA (Stratagene). Using significance analysis of microarrays (SAM) analysis (Tusher et al., 2001) at an extremely high false discovery rate (FDR) of ∼33%, we found <10 of 27,648 elements that were surveyed to be significantly different across batches. Thus variance arising from slide and batch differences was negligible.
Identification of regional differences in gene expression.
Differences in gene expression were analyzed by using an ANOVA (per gene) with brain region as a main factor and a 1% FDR to control for type I error resulting from multiple comparisons. This analysis was done separately for each genotype. ANOVA with FDR is available in the ArraySTAT software package (Amersham Biosciences, Arlington Heights, IL) as well as in FDRAME in the Bioconductor project (www.bioconductor.org). Genes identified as significantly differentially expressed across brain regions within a genotype were clustered by using TIGR Multi Experiment Viewer (TMEV; available at www.tigr.org/softlab).
Identifying regional conservation of enriched gene expression.
The set of genes, common to all genotypes, that exhibited significant expression differences by ANOVA at 1% FDR across brain regions was subjected to template matching (Pavlidis and Noble, 2001). Binary values were used to generate expression corresponding to enriched gene expression in one region (value set at 1) relative to the remaining four (value set at 0). A p < 0.05 was used to define the significance of the template match. Biological themes associated with region-enriched genes were identified by using the three gene ontology (GO) categories of molecular function, biological process, and cellular component in the Expression Analysis Systematic Explorer (EASE) application (Hosack et al., 2003), which is executable via TMEV.
Identification of genotype-dependent differences in gene expression.
Differences in gene expression as a function of genotype were analyzed by using an ANOVA (per gene) with inbred strain as a main factor and a 1% FDR to control for type I error rate. This type of analysis was done within each of the brain regions. Genes identified as significantly differentially expressed were clustered by using TMEV.
Association of genetic difference in gene expression profile with behavioral endpoints.
Four well defined behavioral phenotypes from the Mouse Phenome database were chosen to explore the relationship between gene expression profile and behavior: total time spent in open quadrants of an elevated zero maze [a commonly used animal model for anxiety (Cook et al., 2001)], distance traveled in a grid test after saline administration [model for locomotor activity (Crabbe et al., 2003)], distance traveled in the same grid test after 1.5 g/kg ethanol administration [model for ethanol-induced locomotor activity (Crabbe et al., 2003)], and electroconvulsive threshold (ECT) [model for seizure susceptibility (Frankel et al., 2001)]. The gene set used for association analysis was composed of genes that differed significantly across genotypes when analyzed by an ANOVA at 10% FDR. A less stringent FDR was selected to maximize the number of genes used in the analysis while still adequately controlling for type I error. Expression data were filtered to insure a minimum of three of four replicate values for each gene across the eight strains. Expression patterns that were correlated significantly with the behavioral data were derived via pattern matching (Pavlidis and Noble, 2001). Pattern-matching values were set between 0 and 1, in which each value represents a fraction of the difference between the maximum phenotypic strain value and the minimum phenotypic strain value.
The search for enriched regions and for associations of expression and behavior was done with no additional multiplicity adjustment beyond FDR control at the ANOVA stage, as is common in the current literature. Methodologies to adjust such hierarchical searches are not obvious and are currently under development (Y. Benjamini, unpublished observations).
Gene network and pathway analyses were performed on candidate genes via the use of Ingenuity Pathways Analysis, a web-delivered application for exploring gene expression array data sets. A detailed description of Ingenuity Pathways Analysis is available from Ingenuity (Redwood City, CA). A data set consisting of differentially regulated genes, their corresponding expression values, and GenBank accession number identifiers was used. Each gene identifier was mapped to its corresponding gene object in the Ingenuity Pathways Knowledge Base. These genes, called focus genes, were used as the starting point for generating biological networks (and pathways). To start building networks, the application queries the Ingenuity Pathways Knowledge Base for known interactions between focus genes and all other gene objects stored in the knowledge base and generates a set of networks, with a typical network containing ∼20 genes/proteins. Ingenuity Pathways Analysis computes a score for each network according to the fit of the significant genes. The score is derived from a p value and indicates the likelihood of the focus genes in a network being found together by random chance. A score of 2 indicates that there is a 1 in 100 chance that the focus genes are together in a network because of random chance. Therefore, scores of 2 or higher have at least a 99% confidence of not being generated by random chance alone. Then biological functions are calculated and assigned to each network.
Biological functions were assigned to networks on the basis of the literature findings stored in the Ingenuity Pathways Knowledge Base for each of the component genes contained in the network. Fisher’s exact test was used to test (at 0.05 level) whether a biological assignment could be explained by chance alone.
Results
Regional differences in gene expression
Gene expression profiles were measured across five brain regions (CR, PG, TL, PF, and VS) in each of the eight strains of inbred mice (C3H, BALB, DBA, SJ, AJ, C57, 129, and FVB). On average, 3220 genes were differentially expressed across the brain regions in each of the strains when an ANOVA with 1% FDR was used (supplemental Table 2, available at www.jneurosci.org as supplemental material). When stricter data filtration was implemented so that a minimum of three of four replicate expression values had to be present for each gene across all regions, an average of 1489 genes was identified, with each gene exhibiting at least a 1.6-fold or greater expression difference (supplemental Table 2, available at www.jneurosci.org as supplemental material). The more strictly filtered data were used for hierarchical clustering and were clustered in both dimensions (by region and gene) (Fig. 1). In all genotypes the gene expression clustering distance between the CR and the other four regions was the greatest, followed by the PG.
Figure 1.
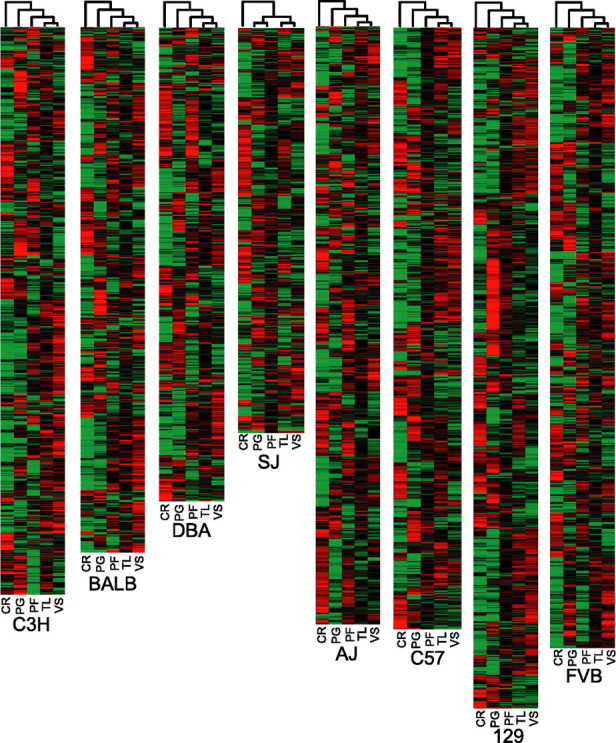
Gene expression differences in the CR, PG, PF, TL, and VS. Brain regions were profiled from mouse strains C3H, BALB, DBA, SJ, AJ, C57, 129, and FVB. Significantly differentially expressed genes across brain regions were defined by ANOVA with 1% FDR, and log2-transformed expression values were subjected to two-dimensional hierarchical clustering. Highly expressed genes are indicated in red, intermediate in black, and weakly expressed genes in green. The data presented are the mean of three to four hybridizations.
Regional conservation of enriched gene expression
The identification of regionally enriched genes, conserved across all eight strains, was accomplished by feature selection (also known as template matching) (Pavlidis and Noble, 2001). Binary values were used to generate expression templates corresponding to enriched gene expression in one region (value set at 1) relative to the remaining four (value set at 0). Using only genes exhibiting significant expression differences by ANOVA at 1% FDR across all five brain regions and a p < 0.05 criteria to define the significance of the template match, we found 1251, 867, 551, 245, and 730 genes to be preferentially enriched in the CR, PG, PF, TL, and VS, respectively (Fig. 2). This corresponds to a fivefold difference in the number of enriched genes in the CR (highest) as compared with the TL (lowest).
Figure 2.
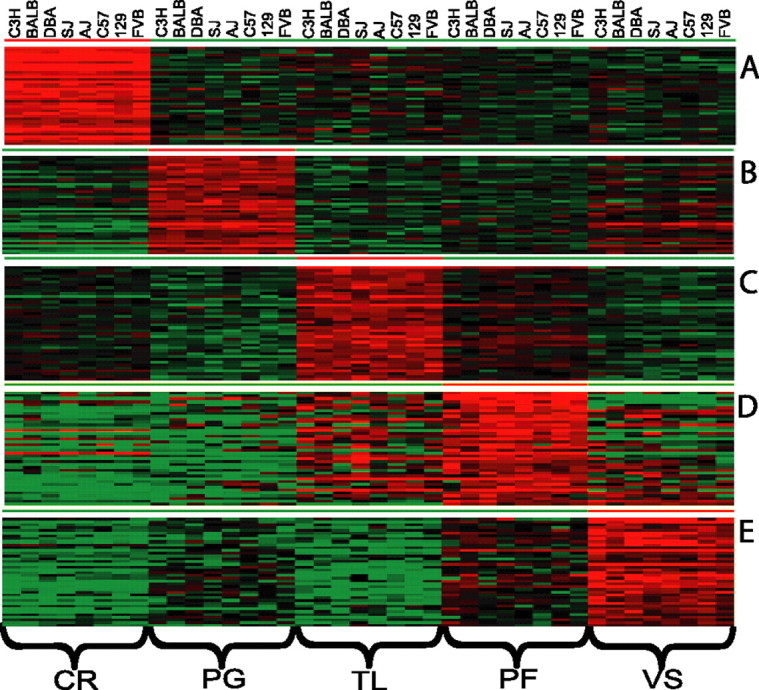
Regional enriched gene expression conserved across mouse strains. Template matching was performed to identify region-specific enrichment of gene expression (Pavlidis and Noble, 2001). Genes selected for template matching were significantly differentially expressed across brain regions by ANOVA with 1% FDR. For each region up to 40 genes with the best matches are shown. Highly enriched genes are indicated in red for each region. A, Template match for CR-enriched genes exhibited p values < 2.33 × 10⁻¹³. B, Template match for PF-enriched genes exhibited p values < 3.74 × 10⁻⁶. C, Template match for PG-enriched genes exhibited p values < 3.72 × 10⁻⁸. D, Template match for TL-enriched genes exhibited p values < 1.54 × 10⁻³. E, Template match for VS-enriched genes exhibited p values < 5.94 × 10⁻⁷. The data presented are the mean of three to four hybridizations.
Regionally enriched genes (exhibiting at least a 1.5-fold difference in expression) were subjected to EASE analysis to identify potential biological themes associated with a particular brain region. Genes were categorized by using GO categories belonging to the ontologies of molecular function, biological process, and cellular component. A total of 47, 92, 66, 54, and 48 gene categories were found with significant EASE scores of p < 0.05 in CR, PG, PF, TL, and VS, respectively (data not shown). An EASE score uses a derivative of the Fisher exact probability, which penalizes the significance of categories supported by few genes. Some major categories that were identified include cell proliferation in the PF and VS, learning and/or memory in the VS, macromolecular biosynthesis in the PG and TL, signal transduction in the VS and PF, cell communication in the VS and PF, G-protein signaling in the VS, TCA cycle in the PG, and cell projection biosynthesis in the CR, PF, and VS (data not shown). For each region the identified GO terms were mapped to their respective GO Slim terms, providing a broader functional overview. GO Slim is a reduced set of 32 higher level non-overlapping GO terms that cover most aspects of the GO-directed acyclic graph. Many regions were assigned both overlapping and unique GO categories (Fig. 3). For example, interesting categories such as learning (GO:0007612), anti-apoptosis (GO:0006916), and morphogenesis (GO:0009653) could be assigned exclusively to specific brain regions on the basis of enriched gene expression (see Discussion). Eight VS-enriched genes belonging to the category of learning were identified as key members of the Ras/mitogen-activated protein kinase (Ras/MAPK) signaling pathway by Ingenuity Pathways Analysis (Fig. 4). This pathway is known to play a critical role in both learning and memory formation (Mazzucchelli and Brambilla, 2000).
Figure 3.

Assignment of regionally enriched genes to gene ontology categories. The relative contribution made by each brain region is depicted. The total number of genes in each category ranged from seven for very specific categories to 1426 for more broadly defined categories.
Figure 4.
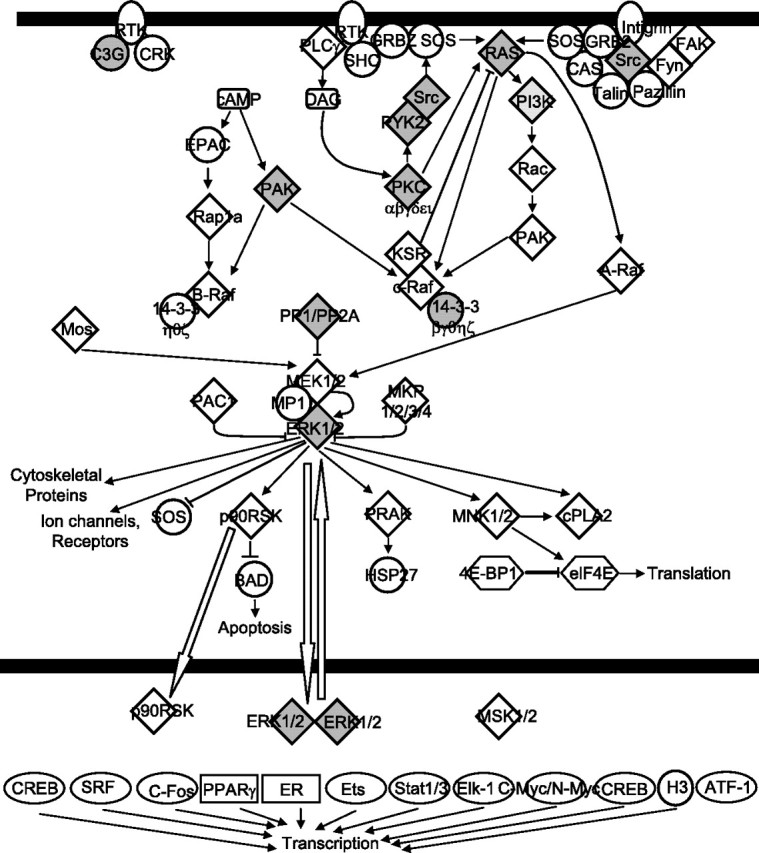
Genes enriched in the VS (shaded) are contained in the canonical pathway for Ras/MAPK signaling.
Genotype-dependent differences in gene expression
We identified gene expression differences that occurred across the eight inbred strains in each brain region. Using a FDR of 1%, we found an average of 1082 genes differentially expressed in each region (supplemental Table 3, available at www.jneurosci.org as supplemental material). Additional filtering of the expression data for genes exhibiting at least a 1.5-fold change across the strains resulted in a slightly lower average of 1080 genes per region (data not shown). When we used even more stringent data filtering requiring a minimum of three replicate expression data points per gene, an average of 188 genes was differentially expressed per region (supplemental Table 3, available at www.jneurosci.org as supplemental material). Hierarchical cluster analysis of these genes clearly illustrated strain specific differences within each of the five regions (Fig. 5).
Figure 5.

Strain-related gene expression differences. Brain regions were profiled from mouse strains C3H, BALB, DBA, SJ, AJ, C57, 129, and FVB. Significantly differentially expressed genes across strains were defined by ANOVA with 1% FDR, and log2-transformed expression values were subjected to two-dimensional hierarchical clustering. Highly expressed genes are indicated in red, intermediate in black, and weakly expressed genes in green. The data presented are means of three to four hybridizations.
Association of genetic difference in gene expression profile with behavioral endpoints
The set of genes that was found to be differentially regulated as a function of genotype (within each brain region) at a 10% FDR level was used for this analysis. Once again, expression data were filtered to insure a minimum of three of four replicate values for each gene across the eight strains. As an additional means to confirm candidate gene associations, it was determined whether the chromosomal location of a correlated gene resided within a published QTL region associated with the phenotype (for full description, see final paragraph in Results). These in silico results are presented within each of the respective supplemental tables (available at www.jneurosci.org as supplemental material).
The phenotypic values for total time spent in open quadrants was binary in nature (Fig. 6A), resulting in biphasic templates in which gene expression was either “on” or “off” (Fig. 6B). The template values used to identify positively correlated genes were 1 (FVB), 1 (C3H), 0 (C57), 0 (DBA), 0 (129), 0 (BALB), and 0 (A/J) (Fig. 6B, top panel), whereas values of 0 (FVB), 0 (C3H), 1 (C57), 1 (DBA), 1 (129), 1 (BALB), and 1 (A/J) were used for negatively correlated genes (Fig. 6B, bottom panel). Pattern matching with these templates resulted in the identification of 14 positively correlated [e.g., Stxbp6 and regulating synaptic membrane exocytosis 3 (Rims3)] and 21 negatively correlated genes [e.g., transcriptional activator early growth response-1 (Egr-1) and cyclin-dependent kinase 2] in the PG (Fig. 6B). Many of the genes could be placed into a gene network or signaling pathway on the basis of Ingenuity Pathways Analysis and assigned biological function categories that are relevant to nervous system development and function, neurological disease, and cell signaling. A listing of the entire set of correlated genes can be found in supplemental Table 4 (available at www.jneurosci.org as supplemental material).
Figure 6.

Gene expression correlation with total time in open quadrants of an elevated zero maze. A, Strain means for time spent in open quadrants derived from measurement 11,805 of the Mouse Phenome database. The data are represented as the mean ± SE. B, Cluster images of biphasic template-matched genes. Top and bottom cluster images depict positively and negatively correlated genes, respectively. The black graph above the cluster image represents template values, whereas the red graph represents the mean expression value of all matched genes within each column.
The remaining three phenotypes exhibited a graded profile in which intermediate levels of behaviors were observed; consequently, template values fell along a linear regression. In the case of grid test distance traveled after saline administration (Fig. 7A), the following template values were used to identify 98 positively correlated genes in VS: 1 (BALB), 0.97 (FVB), 0.56 (DBA), 0.51 (C57), 0.31 (C3H), 0.06 (129), and 0 (A/J) (Fig. 7B, top panel) (supplemental Table 5, available at www.jneurosci.org as supplemental material). The inverse template identified 26 negatively correlated genes in the VS (Fig. 7B, bottom panel) (supplemental Table 5, available at www.jneurosci.org as supplemental material). Example plots of positive correlations are given for the genes Grin2C, Grin1, and NOS, and a negative correlation is shown for gene Terf1 (Fig. 7C).
Figure 7.

Gene expression correlation with grid test distance traveled after saline administration. A, Strain means for distance traveled from measurement 15,406 in the Mouse Phenome database. The data are represented as the mean ± SE. B, Cluster images of template-matched genes with positive (top panel) and negative correlations (bottom panel). The black graph above the cluster image represents template values, whereas the red graph represents the mean expression value of all matched genes within each column. C, Representative correlations of individual matched genes. C1, Grin2C (r = 0.72; p = 0.043). C2, Grin1 (r = 0.72; p = 0.047). C3, NOS (r = 0.78; p = 0.022). C4, Terf1 (r = 0.92; p = 0.0011). The data are represented as the mean ± SE. ▪, C57; ♦, FVB; •, DBA; □, C3H; ▵, A/J; ▴, BALB; ⋄, 129.
For grid test distance traveled after 1.5 g/kg ethanol administration, 41 genes were found to be positively correlated (e.g., Cxcl12, Stxbp2), and 28 genes were found to be negatively correlated (e.g., matrilin 2, Glns) in the VS (Fig. 8) (supplemental Table 6, available at www.jneurosci.org as supplemental material). It should be noted that these correlations make use of gene expression data derived from naive animals, whereas the phenotypic data are from ethanol-treated animals. We propose that the correlated “naive” genes could serve as markers for a predisposition to the divergent effects of ethanol exhibited across these genotypes. Biologic function categories of genes associated with distance traveled after saline or ethanol administration include the NMDA/glutamate signaling pathway and the glutamate metabolism pathway (supplemental Table 6, available at www.jneurosci.org as supplemental material).
Figure 8.

Gene expression correlation with grid test distance traveled after 1.5 g/kg ethanol administration. A, Strain means for distance traveled from measurement 15417 in the Mouse Phenome database. The data are represented as the mean ± SE. B, Cluster images of template-matched genes with positive (top panel) and negative correlations (bottom panel). The black graph above the cluster image represents template values, whereas the red graph represents the mean expression value of all matched genes within each column. C, Representative correlations of individual matched genes. C1, Calm (r = 0.79; p = 0.021). C2, Glns (r = 0.83; p = 0.012). C3, Stxbp2 (r = 0.87; p = 0.0046). C4, Cxcl12 (r = 0.84; p = 0.0088). The data are represented as the mean ± SE. ▪, C57; ♦, FVB; •, DBA; □, C3H; ▵, A/J; ▴, BALB; ⋄, 129.
Last, template matching to ECT resulted in 29 positively correlated and 22 negatively correlated genes in the TL (Fig. 9) (supplemental Table 7, available at www.jneurosci.org as supplemental material). Ingenuity Pathways Analysis once again highlighted the NMDA/glutamate signaling pathway, which contained three correlated genes overexpressed (Glns, Calm, Slc1a2) and one underexpressed (Grin2C) in mouse strains exhibiting resistance to seizures. This pathway is known to play a direct role in seizure susceptibility (Fountain, 2000). In the case of Glns, single nucleotide polymorphism (SNP) information was publicly available for three of the five mouse strains (http://www.jax.org/phenome). Interestingly, a haplotype block containing nine SNPs mainly concentrated in the intronic regions of Glns could be associated with the C57BL/6J and BALB/cByJ strains, which are resistant to electroconvulsion, whereas the electroconvulsion-sensitive DBA/2J strain contained a different set of SNPs (Fig. 10). As more SNP information becomes publicly available, it will be of interest to examine the haplotypes of the remaining three strains.
Figure 9.

Gene expression correlation with ECT. A, Strain means for convulsive current (mA) leading to psychomotor seizure from measurement 5608 in the Mouse Phenome database. The data are represented as the mean ± SE. B, Cluster images of template-matched genes with positive (top panel) and negative correlations (bottom panel). The black graph above the cluster image represents template values, whereas the red graph represents the mean expression value of all matched genes within each column. C, Correlation of individual matched genes. C1, Glns (r = 0.89; p = 0.0023). C2, Slc1a2 (r = 0.71; p = 0.046). C3, Calm (r = 0.85; p = 0.0076). C4, Grin2C (r = 0.72; p = 0.0046). The data are represented as the mean ± SE. ▪, C57; •, DBA; ▵, A/J; ▴, BALB; ⋄, 129.
Figure 10.

Shown are polymorphic markers associated with Glns in mouse strains with high ECT (C57BL/6J and BALB/cByJ) or low ECT (DBA/2J).
We used quantitative real-time RT-PCR to validate our microarray results for 12 genes that were differentially regulated across mouse strains and found to correlate with one of the following behavioral endpoints: grid test distance traveled after saline administration, grid test distance traveled after ethanol administration, or ECT (Fig. 11). In every single case a significant correlation existed between the microarray and RT-PCR results (p < 0.05), thus demonstrating the reliability of our gene expression measurements.
Figure 11.

Real time RT-PCR validation of microarray data. A, Validation of individual matched genes correlating with grid distance traveled after saline administration in the VS. A1, Grin2C (r = 0.84; p = 0.018). A2, Grin1 (r = 0.88; p = 0.0084). A3, NOS (r = 0.86; p = 0.014). A4, Terf1 (r = 0.88; p = 0.0093). B, Validation of individual matched genes correlating with grid distance traveled after 1.5 g/kg ethanol administration in the VS. B1, Calm (r = 0.87; p = 0.0011). B2, Glns (r = 0.89; p = 0.0069). B3, Stxbp2 (r = 0.86; p = 0.0126). B4, Cxcl12 (r = 0.92; p = 0.0036). C, Validation of individual matched genes correlating with grid ECT in the TL. C1, Glns (r = 0.89; p = 0.0023). C2, Slc1a2 (r = 0.97; p 0.0079). C3, Calm (r = 0.87; p = 0.0472). C4, Grin2C (r = 0.91; p = 0.0314). The data are represented as the mean ± SE. ▪, C57; ♦, FVB; •, DBA; □, C3H; ▵, A/J; ▴, BALB; ⋄, 129.
In silico mapping of correlated genes to surrogate phenotypic QTLs
The mapping of correlated genes to phenotypic QTL intervals derived from publicly assessable data provides additional supportive evidence when we attempt to associate a gene to a behavior. We downloaded all available anxiety, locomotor activity, and seizure-related QTLs from The Jackson Laboratory (Bar Harbor, ME) website on phenotypes and alleles (http://www.informatics.jax.org/). Physical map locations of correlated genes were obtained from ENSEMBL (http://www.ensembl.org/Mus_musculus/index.html). By overlaying our expression results onto genetic data, we were able to identify a number of interesting candidate genes (supplemental Tables 4–7, available at www.jneurosci.org as supplemental material). For example, the ECT-correlated genes Glns and regulator of G-protein signaling 7 (Fig. 6) could be mapped to the seizure susceptibility 1 (SZS1) QTL on chromosome 1 for electroshock seizure threshold, whereas Slc1a2 (Fig. 6) was found to reside in the epilepsy 2 (EL2) QTL on chromosome 2 for the epileptic phenotype (supplemental Table 4, available at www.jneurosci.org as supplemental material). Of the genes that were correlated with distance traveled in the grid test after ethanol administration (Fig. 8), Cxcl12 and matrilin 2 were mapped to the EILA2 (chromosome 6) and EILA3 (chromosome 15) QTLs for ethanol-induced locomotor activity, respectively (supplemental Table 6, available at www.jneurosci.org as supplemental material). In addition, a number of novel genes of unknown function (e.g., RIKEN cDNA D430039N05, RIKEN cDNA 1700026N20, zinc finger protein 289) also were found to reside within ethanol-induced locomotor-related QTLs (supplemental Table 6, available at www.jneurosci.org as supplemental material).
Discussion
A number of studies have been initiated to link gene expression to specific brain regions in inbred mouse strains. These important early studies, however, used a limited number of strains and/or brain regions (Sandberg et al., 2000; Carter et al., 2001; Barlow and Lockhart, 2002; Lock and Heller, 2003). We have expression-profiled eight naive inbred strains across five brain regions. Region-enriched gene expression common to all strains was identified and may relate to unique regional characteristics of the brain. In addition, by coupling our expression data to phenotypic data from The Jackson Laboratory Phenome Project Database, we have taken advantage of a rich resource to perform genetic correlations spanning a number of behaviors.
Region-enriched genes
The gene expression clustering distance between the CR (metencephalonic origin) and the other four regions (telencephalonic origin) agrees with previous expression data (Sandberg et al., 2000; Khaitovich et al., 2004a,b) and closely resembles either the known evolutionary divergence times for these regions (Purves et al., 2001) or the divergence time associated with fetal neurodevelopment (Clancy et al., 2001). Many of the region-enriched genes for VS, TL, PF, PG, and CR could be assigned to the GO molecular function categories of cytoskeletal protein binding (GO:0008092), structural protein (GO:0005198), and actin binding (GO:0003779) (Khaitovich et al., 2004a). These assignments likely reflect the central role of cytoskeletal and actin components in the trafficking of secretory vesicles, regulation of endocytic pathways, and control of neuronal processes (Halpain, 2003).
One of our goals was to identify unique categorical assignments that may reflect functional or structural specialization by a particular brain region. Eight genes coding for proteins with anti-apoptotic function (GO:0006916) were prominent in the CR, including peroxiredoxin-2, peroxiredoxin-3, and ornithine decarboxylase antizyme. Regional enrichment of these genes may explain the overall resistance of the CR to damage that is initiated by neurotoxic insult (Struzynska et al., 2001). Moreover, in patients with Creutzfeldt–Jakob disease peroxiredoxin-2 decreases in the PF, a region that suffers severe neuropathology, whereas peroxiredoxin-2 expression remains unchanged in the CR and presumably provides cytoprotection (Krapfenbauer et al., 2002).
The VS, PF, TL, and PG play critical roles in neural plasticity, learning, and memory formation (Mazzucchelli and Brambilla, 2000; Buchanan et al., 2003; Lalonde and Strazielle, 2003; Maren, 2003; Bloedel, 2004; Cardinal and Everitt, 2004; Kelley, 2004; Matsumoto and Tanaka, 2004). It was particularly interesting to find that the enriched genes with GO categories of learning (GO:0007612) and learning and memory (GO:0007611) belonged exclusively to the VS. Twelve of these genes encode proteins that are part of the Ras/MAPK pathway (Fig. 4). In a mouse model of learning and memory, inhibition of the Ras/MAPK pathway results in decreased performance (Finkbeiner and Dalva, 1998). The increased expression of Ras/MAPK pathway genes in the VS is consistent with the known function of this region and poses some intriguing questions. Why are only certain components of the Ras/MAPK pathway enriched in the VS? Are there alternative enriched information-processing pathways in the PF, TL, and PG?
Gene–behavior associations
A major premise of this study is that region-specific variation in gene expression across a panel of inbred mouse strains can be used to discover candidate genes associated with particular behaviors. To this end, genetic variance in gene expression within the PG was found to be associated with genotype-dependent differences in a measure of anxiety. Pharmacological studies have confirmed a role for the PG in anxiety (Russo et al., 1993; Mendes-Gomes and Nunes-de-Souza, 2005), and in the current study 35 genes in the PG were associated with a measure of anxiety, total time spent in open quadrants (Cook et al., 2001). Several of these correlated genes could be mapped to surrogate phenotypic QTLs related to anxiety. Examples include the upregulated gene Rims3 (found in the ANXTY1 QTL) and the downregulated gene transcriptional activator Egr-1 (AXTRB4 QTL) in mouse strains exhibiting lower anxiety. Increased Egr-1 expression has been reported after fear conditioning in the rat, and the anxiolytic diazepam has been shown to block the fear conditioning increase in Egr-1 as well as to reduce anxiety (Malkani and Rosen, 2000).
The VS has been established as a key region for many phenotypes pertaining to locomotion (Takakusaki et al., 2004). Association analysis revealed that a number of genes encoding proteins in the NMDA/glutamate signaling pathway are involved in the ability to traverse a wire grid; however, the particular genes involved are dependent on whether or not the subjects are under the influence of ethanol (Crabbe et al., 2003). NOS, Grin1, and Grin2C mRNA levels are correlated positively with distance traveled by saline-treated animals. Activation of GRIN2 is known to stimulate NOS (Sheng and Pak, 2000), and multiple studies have demonstrated that pharmacological inhibition of neural NOS results in decreased exploratory behavior and locomotion (Dzoljic et al., 1997; Araki et al., 2001; Del Bel et al., 2002). On the other hand, the correlation of drug-naive gene expression with distance traveled by animals dosed with 1.5 g/kg ethanol may reveal important “facilitator” or “susceptibility” genes. The negatively correlated genes Calm and Glns fall into this category. Low levels of Calm and Glns expression in the drug-naive state may be important in the predisposition of inbred strains to increased locomotor activity after ethanol administration. It should be noted that neither Calm nor Glns expression was correlated with distance traveled in saline-dosed animals, and Glns maps to the ACTR1 QTL on chromosome 1 for ethanol-induced locomotion and not to drug-naive locomotor activity (Demarest et al., 2001). Conversely, Grin1 and Grin2C expression was not correlated in ethanol-dosed animals but was correlated in saline-treated animals. Proteins encoded by Calm and Glns have important roles in inhibiting the release and directing the metabolism of glutamate, respectively, and both genes have been shown to be modulated by acute ethanol administration (Roberto et al., 2004). Decreased expression of either or both genes could lead to an increase in glutamate-mediated neurotransmission, which is known to increase locomotor activity (Russo et al., 1993).
The pleiotropic nature of gene networks is exemplified nicely in the genetic correlations for ECT, a commonly used approach for screening anti-epileptic drugs in rodents (Frankel et al., 2001). Many of the NMDA/glutamate signaling pathway genes that were correlated in the VS with distance traveled also were associated with ECT. However, these associations were found in the TL, but not the VS. Calm, Slc1a2, and Glns all were correlated positively, whereas Grin2C was correlated negatively with seizure threshold. Moreover, the direction of the associations was inverse; Grin2C was correlated positively with distance traveled in the drug-naive state, whereas Calm and Glns were correlated negatively with distance traveled under the influence of ethanol.
It is well established that glutamate release into the synapse participates in the initiation and spread of seizures (Chapman, 2000). Because the proteins encoded by Grin2C, Calm, Slc1a2, and Glns are all involved in glutamatergic transmission, a significant role for these genes can be hypothesized readily. Hippocampal tissue biopsies from patients with temporal lobe epilepsy reveal a decrease in Calm gene expression (Becker et al., 2002). Mice deficient in the Slc1a2 gene exhibit spontaneous lethal seizures (Tessler et al., 1999). Studies in patients with TL epilepsy show decreased GLNS concentrations in the TL, and pharmacological inhibition of this enzyme causes seizures in rats and mice (Eid et al., 2004). Additionally, Slc1a2 and Glns map to QTLs related to seizure activity (i.e., SZS1 and EL2) (Rise et al., 1991; Ferraro et al., 2001). We believe the remaining 46 correlated TL genes, many mapping to additional seizure-related QTLs, represent candidates for future hypothesis testing. In this regard, animals in which the expression of candidate genes are engineered genetically to be upregulated or downregulated may be useful, especially in models with quantitative rather than qualitative (knock-out) manipulations.
In conclusion, we have described the results of association analyses across a panel of inbred mouse strains for the purpose of linking candidate genes to complex behaviors. The gene expression data generated in this study can serve as a future resource to elucidate the genetic underpinnings of additional behaviors. A different yet equally powerful correlational approach recently has been described in a recombinant inbred (RI) BXD panel derived from C57BL/6J and DBA/2J mice (Chesler et al., 2005; Kerns et al., 2005). Our multi-strain approach should compliment the RI approach. In theory, the discovery of correlated genes may be missed in an RI panel if (1) a gene or genes are not differentially expressed between the two parental strains used to generate the RI panel, and/or (2) a particular behavior is not measurably different between the two parental strains, or (3) if genes of interest are not polymorphic in the parental strains. The identification of correlated genes by our multiple inbred strain approach can be exploited further in the construction of additional RI panels. Hence a combination of the two approaches will likely prove to be useful in discovering genes that significantly influence behavior.
Footnotes
This work is supported by National Institute on Drug Abuse Grant DA-015087 (to G.I.E., N.H.L., and Y.B.).
References
- Araki T, Mizutani H, Matsubara M, Imai Y, Mizugaki M, Itoyama Y (2001). Nitric oxide synthase inhibitors cause motor deficits in mice. Eur Neuropsychopharmacol 11:125–133. [DOI] [PubMed] [Google Scholar]
- Barlow C, Lockhart DJ (2002). DNA arrays and neurobiology—what’s new and what’s next? Curr Opin Neurobiol 12:554–561. [DOI] [PubMed] [Google Scholar]
- Becker AJ, Chen J, Paus S, Normann S, Beck H, Elger CE, Wiestler OD, Blumcke I (2002). Transcriptional profiling in human epilepsy: expression array and single cell real-time qRT-PCR analysis reveal distinct cellular gene regulation. NeuroReport 13:1327–1333. [DOI] [PubMed] [Google Scholar]
- Bloedel JR (2004). Task-dependent role of the cerebellum in motor learning. Prog Brain Res 143:319–329. [DOI] [PubMed] [Google Scholar]
- Bogue MA, Grubb SC (2004). The Mouse Phenome Project. Genetica 122:71–74. [DOI] [PubMed] [Google Scholar]
- Buchanan TW, Tranel D, Adolphs R (2003). A specific role for the human amygdala in olfactory memory. Learn Mem 10:319–325. [DOI] [PMC free article] [PubMed] [Google Scholar]
- Cardinal RN, Everitt BJ (2004). Neural and psychological mechanisms underlying appetitive learning: links to drug addiction. Curr Opin Neurobiol 14:156–162. [DOI] [PubMed] [Google Scholar]
- Carter TA, Del Rio JA, Greenhall JA, Latronica ML, Lockhart DJ, Barlow C (2001). Chipping away at complex behavior: transcriptome/phenotype correlations in the mouse brain. Physiol Behav 73:849–857. [DOI] [PubMed] [Google Scholar]
- Chapman AG (2000). Glutamate and epilepsy. J Nutr 130:1043S–1045S. [DOI] [PubMed] [Google Scholar]
- Chesler EJ, Lu L, Shou S, Qu Y, Gu J, Wang J, Hsu HC, Mountz JD, Baldwin NE, Langston MA, Threadgill DW, Manly KF, Williams RW (2005). Complex trait analysis of gene expression uncovers polygenic and pleiotropic networks that modulate nervous system function. Nat Genet 37:233–242. [DOI] [PubMed] [Google Scholar]
- Clancy B, Darlington RB, Finlay BL (2001). Translating developmental time across mammalian species. Neuroscience 105:7–17. [DOI] [PubMed] [Google Scholar]
- Cook MN, Williams RW, Flaherty L (2001). Anxiety-related behaviors in the elevated zero-maze are affected by genetic factors and retinal degeneration. Behav Neurosci 115:468–476. [PubMed] [Google Scholar]
- Crabbe JC (2002). Genetic contributions to addiction. Annu Rev Psychol 53:435–462. [DOI] [PubMed] [Google Scholar]
- Crabbe JC, Metten P, Yu CH, Schlumbohm JP, Cameron AJ, Wahlsten D (2003). Genotypic differences in ethanol sensitivity in two tests of motor incoordination. J Appl Physiol 95:1338–1351. [DOI] [PubMed] [Google Scholar]
- Crabbe Jr JC, Young ER, Kosobud A (1983). Genetic correlations with ethanol withdrawal severity. Pharmacol Biochem Behav 18:[Suppl 1], 541–547. [DOI] [PubMed] [Google Scholar]
- Del Bel EA, Souza AS, Guimaraes FS, da-Silva CA, Nucci-da-Silva LP (2002). Motor effects of acute and chronic inhibition of nitric oxide synthesis in mice. Psychopharmacology (Berl) 161:32–37. [DOI] [PubMed] [Google Scholar]
- Demarest K, Koyner J, McCaughran J Jr, Cipp L, Hitzemann R (2001). Further characterization and high-resolution mapping of quantitative trait loci for ethanol-induced locomotor activity. Behav Genet 31:79–91. [DOI] [PubMed] [Google Scholar]
- Dzoljic E, De Vries R, Dzoljic MR (1997). New and potent inhibitors of nitric oxide synthase reduce motor activity in mice. Behav Brain Res 87:209–212. [DOI] [PubMed] [Google Scholar]
- Eid T, Thomas MJ, Spencer DD, Runden-Pran E, Lai JC, Malthankar GV, Kim JH, Danbolt NC, Ottersen OP, de Lanerolle NC (2004). Loss of glutamine synthetase in the human epileptogenic hippocampus: possible mechanism for raised extracellular glutamate in mesial temporal lobe epilepsy. Lancet 363:28–37. [DOI] [PubMed] [Google Scholar]
- Ferraro TN, Golden GT, Smith GG, Longman RL, Snyder RL, DeMuth D, Szpilzak I, Mulholland N, Eng E, Lohoff FW, Buono RJ, Berrettini WH (2001). Quantitative genetic study of maximal electroshock seizure threshold in mice: evidence for a major seizure susceptibility locus on distal chromosome 1. Genomics 75:35–42. [DOI] [PubMed] [Google Scholar]
- Finkbeiner S, Dalva MB (1998). To fear or not to fear: what was the question? A potential role for Ras-GRF in memory. BioEssays 20:691–695. [DOI] [PubMed] [Google Scholar]
- Fountain NB (2000). Status epilepticus: risk factors and complications. Epilepsia 41:[Suppl 2], S23–S30. [DOI] [PubMed] [Google Scholar]
- Frankel WN, Taylor L, Beyer B, Tempel BL, White HS (2001). Electroconvulsive thresholds of inbred mouse strains. Genomics 74:306–312. [DOI] [PubMed] [Google Scholar]
- Grubb SC, Churchill GA, Bogue MA (2004). A collaborative database of inbred mouse strain characteristics. Bioinformatics 20:2857–2859. [DOI] [PubMed] [Google Scholar]
- Halpain S (2003). Actin in a supporting role. Nat Neurosci 6:101–102. [DOI] [PubMed] [Google Scholar]
- Hosack DA, Dennis G Jr, Sherman BT, Lane HC, Lempicki RA (2003). Identifying biological themes within lists of genes with EASE. Genome Biol 4:R70. [DOI] [PMC free article] [PubMed] [Google Scholar]
- Joe B, Letwin NE, Garrett MR, Dhindaw S, Frank B, Sultana R, Verratti K, Rapp JP, Lee NH (2005). Transcriptional profiling with a blood pressure QTL interval-specific oligonucleotide array. Physiol Genomics 23:318–326. [DOI] [PubMed] [Google Scholar]
- Kafkafi N, Benjamini Y, Sakov A, Elmer GI, Golani I (2005). Genotype–environment interactions in mouse behavior: a way out of the problem. Proc Natl Acad Sci USA 102:4619–4624. [DOI] [PMC free article] [PubMed] [Google Scholar]
- Kelley AE (2004). Ventral striatal control of appetitive motivation: role in ingestive behavior and reward-related learning. Neurosci Biobehav Rev 27:765–776. [DOI] [PubMed] [Google Scholar]
- Kendler KS (2005). “A gene for… ”: the nature of gene action in psychiatric disorders. Am J Psychiatry 162:1243–1252. [DOI] [PubMed] [Google Scholar]
- Kerns RT, Ravindranathan A, Hassan S, Cage MP, York T, Sikela JM, Williams RW, Miles MF (2005). Ethanol-responsive brain region expression networks: implications for behavioral responses to acute ethanol in DBA/2J versus C57BL/6J mice. J Neurosci 25:2255–2266. [DOI] [PMC free article] [PubMed] [Google Scholar]
- Khaitovich P, Weiss G, Lachmann M, Hellmann I, Enard W, Muetzel B, Wirkner U, Ansorge W, Paabo S (2004a). A neutral model of transcriptome evolution. PLoS Biol 2:E132. [DOI] [PMC free article] [PubMed] [Google Scholar]
- Khaitovich P, Muetzel B, She X, Lachmann M, Hellmann I, Dietzsch J, Steigele S, Do HH, Weiss G, Enard W, Heissig F, Arendt T, Nieselt-Struwe K, Eichler EE, Paabo S (2004b). Regional patterns of gene expression in human and chimpanzee brains. Genome Res 14:1462–1473. [DOI] [PMC free article] [PubMed] [Google Scholar]
- Krapfenbauer K, Yoo BC, Fountoulakis M, Mitrova E, Lubec G (2002). Expression patterns of antioxidant proteins in brains of patients with sporadic Creutzfeldt–Jacob disease. Electrophoresis 23:2541–2547. [DOI] [PubMed] [Google Scholar]
- Lalonde R, Strazielle C (2003). The effects of cerebellar damage on maze learning in animals. Cerebellum 2:300–309. [DOI] [PubMed] [Google Scholar]
- Lee NH, Saeed AI (2006). In: Microarrays: an overview In: Methods in molecular biology: DNA analysis by nonradioactive methods (Hilario EM, JF, eds). Totowa, NY: Humana.
- Lock CB, Heller RA (2003). Gene microarray analysis of multiple sclerosis lesions. Trends Mol Med 9:535–541. [DOI] [PubMed] [Google Scholar]
- Malek RL, Irby RB, Guo QM, Lee K, Wong S, He M, Tsai J, Frank B, Liu ET, Quackenbush J, Jove R, Yeatman TJ, Lee NH (2002). Identification of Src transformation fingerprint in human colon cancer. Oncogene 21:7256–7265. [DOI] [PubMed] [Google Scholar]
- Malkani S, Rosen JB (2000). Differential expression of EGR-1 mRNA in the amygdala following diazepam in contextual fear conditioning. Brain Res 860:53–63. [DOI] [PubMed] [Google Scholar]
- Maren S (2003). What the amygdala does and doesn’t do in aversive learning. Learn Mem 10:306–308. [DOI] [PubMed] [Google Scholar]
- Matsumoto K, Tanaka K (2004). The role of the medial prefrontal cortex in achieving goals. Curr Opin Neurobiol 14:178–185. [DOI] [PubMed] [Google Scholar]
- Mazzucchelli C, Brambilla R (2000). Ras-related and MAPK signaling in neuronal plasticity and memory formation. Cell Mol Life Sci 57:604–611. [DOI] [PMC free article] [PubMed] [Google Scholar]
- Mendes-Gomes J, Nunes-de-Souza RL (2005). Concurrent nociceptive stimulation impairs the anxiolytic effect of midazolam injected into the periaqueductal gray in mice. Brain Res 1047:97–104. [DOI] [PubMed] [Google Scholar]
- Mouse Genome Sequencing Consortium. (2002). Initial sequencing and comparative analysis of the mouse genome. Nature 420:520–562. [DOI] [PubMed] [Google Scholar]
- Pavlidis P, Noble WS (2001). Analysis of strain and regional variation in gene expression in mouse brain. Genome Biol 2:research0042.1–0042.15. [DOI] [PMC free article] [PubMed] [Google Scholar]
- Paxinos G, Franklin KBJ (2001). In: The mouse brain in stereotaxic coordinates, Ed 2 San Diego: Academic.
- Plomin R, Owen MJ, McGuffin P (1994). The genetic basis of complex human behaviors. Science 264:1733–1739. [DOI] [PubMed] [Google Scholar]
- Purves D, Augustine GJ, Fitzpatrick D, Katz LC, LaMantia A-S, McNamara JO, Williams SM (2001). In: Neuroscience Ed 2 editors Sunderland, MA: Sinauer.
- Rise ML, Frankel WN, Coffin JM, Seyfried TN (1991). Genes for epilepsy mapped in the mouse. Science 253:669–673. [DOI] [PubMed] [Google Scholar]
- Roberto M, Schweitzer P, Madamba SG, Stouffer DG, Parsons LH, Siggins GR (2004). Acute and chronic ethanol alter glutamatergic transmission in rat central amygdala: an in vitro and in vivo analysis. J Neurosci 24:1594–1603. [DOI] [PMC free article] [PubMed] [Google Scholar]
- Russo AS, Guimaraes FS, De Aguiar JC, Graeff FG (1993). Role of benzodiazepine receptors located in the dorsal periaqueductal grey of rats in anxiety. Psychopharmacology (Berl) 110:198–202. [DOI] [PubMed] [Google Scholar]
- Saeed AI, Sharov V, White J, Li J, Liang W, Bhagabati N, Braisted J, Klapa M, Currier T, Thiagarajan M, Sturn A, Snuffin M, Rezantsev A, Popov D, Ryltsov A, Kostukovich E, Borisovsky I, Liu Z, Vinsavich A, Trush V, Quackenbush J (2003). TM4: a free, open-source system for microarray data management and analysis. Biotechniques 34:374–378. [DOI] [PubMed] [Google Scholar]
- Sandberg R, Yasuda R, Pankratz DG, Carter TA, Del Rio JA, Wodicka L, Mayford M, Lockhart DJ, Barlow C (2000). Regional and strain-specific gene expression mapping in the adult mouse brain. Proc Natl Acad Sci USA 97:11038–11043. [DOI] [PMC free article] [PubMed] [Google Scholar]
- Sheng M, Pak DT (2000). Ligand-gated ion channel interactions with cytoskeletal and signaling proteins. Annu Rev Physiol 62:755–778. [DOI] [PubMed] [Google Scholar]
- Struzynska L, Bubko I, Walski M, Rafalowska U (2001). Astroglial reaction during the early phase of acute lead toxicity in the adult rat brain. Toxicology 165:121–131. [DOI] [PubMed] [Google Scholar]
- Sutcliffe JG (2001). Open-system approaches to gene expression in the CNS. J Neurosci 21:8306–8309. [DOI] [PMC free article] [PubMed] [Google Scholar]
- Takakusaki K, Saitoh K, Harada H, Kashiwayanagi M (2004). Role of basal ganglia–brainstem pathways in the control of motor behaviors. Neurosci Res 50:137–151. [DOI] [PubMed] [Google Scholar]
- Tanaka TS, Jaradat SA, Lim MK, Kargul GJ, Wang X, Grahovac MJ, Pantano S, Sano Y, Piao Y, Nagaraja R, Doi H, Wood 3rd WH, Becker KG, Ko MS (2000). Genome-wide expression profiling of mid-gestation placenta and embryo using a 15,000 mouse developmental cDNA microarray. Proc Natl Acad Sci USA 97:9127–9132. [DOI] [PMC free article] [PubMed] [Google Scholar]
- Tessler S, Danbolt NC, Faull RL, Storm-Mathisen J, Emson PC (1999). Expression of the glutamate transporters in human temporal lobe epilepsy. Neuroscience 88:1083–1091. [DOI] [PubMed] [Google Scholar]
- Tusher VG, Tibshirani R, Chu G (2001). Significance analysis of microarrays applied to the ionizing radiation response. Proc Natl Acad Sci USA 98:5116–5121. [DOI] [PMC free article] [PubMed] [Google Scholar]
- Wang HY, Malek RL, Kwitek AE, Greene AS, Luu TV, Behbahani B, Frank B, Quackenbush J, Lee NH (2003). Assessing unmodified 70-mer oligonucleotide probe performance on glass-slide microarrays. Genome Biol 4:R5. [DOI] [PMC free article] [PubMed] [Google Scholar]
- Yang IV, Chen E, Hasseman JP, Liang W, Frank BC, Wang S, Sharov V, Saeed AI, White J, Li J, Lee NH, Yeatman TJ, Quackenbush J (2002). Within the fold: assessing differential expression measures and reproducibility in microarray assays. Genome Biol 3:research0062.1–0062.12. [DOI] [PMC free article] [PubMed] [Google Scholar]