

Abstract
Tetanus-induced heterosynaptic depression in the hippocampus is a key cellular mechanism in neural networks implicated in learning and memory. A growing body of evidence indicates that glial cells are important modulators of synaptic functions, but very little is known about their role in heterosynaptic plasticity. We examined the role of glial cells in heterosynaptic depression, knowing that tetanization and NMDA application caused depression of synaptic field responses (fEPSPs) and induced Ca2+ rise in glial cells. Here we report that chelating Ca2+ in a glial syncytium interfered with heterosynaptic depression and NMDA-induced fEPSP depression, suggesting that Ca2+ activation of glial cells is necessary for heterosynaptic depression. The NMDA-induced Ca2+ rise in glial cells was sensitive to tetrodotoxin and reduced by the GABAB antagonist CGP55845. Both heterosynaptic depression and simultaneous Ca2+ activation of glial cells were prevented by CGP55845, suggesting an involvement of the GABAergic network in glial activation and heterosynaptic depression. Also, the GABAB agonist baclofen caused both a Ca2+ rise in glial cells and fEPSP depression. Heterosynaptic depression, as well as NMDA- and baclofen-induced depression, were attenuated by an A1 antagonist, cyclopentyl-theophylline, whereas glial cell activation was not, indicating a role of adenosine downstream of glial activation. Finally, heterosynaptic depression requires ATP degradation because ectonucleotidase inhibitors reduced this plasticity. Our work indicates that Ca2+ activation of glial cells is necessary for heterosynaptic depression, which involves the sequential interaction of Schaffer collaterals, the GABAergic network, and glia. Thus, glial and neuronal networks are functionally associated during the genesis of heterosynaptic plasticity at mammalian central excitatory synapses.
Keywords: neuron–glia interactions, heterosynaptic depression, GABA, GABAB receptors, NMDA, adenosine
Introduction
Multiple lines of evidence indicate that glial cells are active partners modulating neuronal activity (Auld and Robitaille, 2003a). In hippocampus, glial cells are known to sense synaptic activity at Schaffer collaterals (Dani et al., 1992; Pasti et al., 1997) and respond to such activity with rises in intracellular calcium levels (Porter and McCarthy, 1996; Carmignoto et al., 1998; Latour et al., 2001). After their Ca2+-mediated activation, hippocampal glial cells communicate with neurons to modulate both excitatory (Araque et al., 1998a,b, 2001; Pasti et al., 2001; Koizumi et al., 2003) and inhibitory synaptic transmission (Kang et al., 1998). Moreover, at the neuromuscular junction, activation of perisynaptic glial cells by synaptic activity is accompanied by feedback modulation of synaptic efficacy and short-term plasticity (Robitaille, 1998; Auld and Robitaille, 2003a,b). Although a synapse–glial–synapse regulatory loop has been identified in the periphery (Auld and Robitaille, 2003a), the involvement of glial cells in such a role at CNS synapses has only recently begun to be explored (Zhang et al., 2003; Pascual et al., 2005).
Interestingly, properties of glial cell activity and modulation are in register with the neuronal properties required to induce heterosynaptic plasticity in the CNS. For instance, frequency-dependent synaptic transmission that activates glial cells is known to induce synaptic plasticity. In addition, the neurotransmitter and receptor systems that mediate synaptic plasticity are also implicated in the activation of glial cells (Haydon, 2001; Auld and Robitaille, 2003a). These characteristics are particularly striking when considering the production of hippocampal heterosynaptic depression. Heterosynaptic depression is a correlate of long-term potentiation (LTP) at Schaffer collateral synapses of the hippocampus (Lynch et al., 1977) and is believed to increase the contrast between potentiated and other nontetanized inputs on pyramidal neurons. Similar to LTP, heterosynaptic depression is dependent on NMDA receptor activation (Manzoni et al., 1994) in a frequency-dependent manner (Lynch et al., 1977). Additionally, heterosynaptic depression has been proposed to be mediated by local interneuron networks producing presynaptic inhibition of neurotransmitter release by adenosine (Manzoni et al., 1994). Interestingly, Ca2+-mediated activation of glial cells by hippocampal synaptic activity has been found to exhibit properties similar to those of heterosynaptic depression, such as dependence on NMDA receptor activation and stimulus frequency, and to involve adenosine release (Auld and Robitaille, 2003a). Finally, an elegant recent study has shown that integrity of the glial vesicular release machinery is necessary for complete induction of heterosynaptic depression (Pascual et al., 2005).
Hence, the present study was undertaken to determine the involvement of glial cells in heterosynaptic depression at Schaffer collateral synapses in hippocampal networks in situ. Our data show that glial cells in rat CA1 hippocampal slices are activated by Ca2+-mediated processes during heterosynaptic depression. Moreover, their activation involves local network interactions among afferent fibers, the GABAergic system, and glial cells and is necessary for heterosynaptic depression. These findings underscore a novel physiological interactive role for the GABAergic network and glial cells in synaptic plasticity at CNS synapses.
Parts of this paper have been published previously in abstract form (Serrano et al., 2003).
Materials and Methods
Hippocampal slices.
Transverse hippocampal slices were obtained from young (14–21 d) male Sprague Dawley rats (Charles River, Montreal, Quebec, Canada) as described previously (Latour et al., 2001). Rats were anesthetized with halothane and decapitated with a guillotine. The brain was rapidly excised and placed in cold (4–5°C), oxygenated (95% O2/5% CO2) artificial CSF (ACSF) containing (in mm): 124 NaCl, 5 KCl (except for baclofen experiments, in which 2 mm KCl was used), 1.25 NaH2PO4, 2 MgSO4, 2 CaCl2, 26 NaHCO3, 10 glucose, and 50 μm Trolox. A block of tissue containing the hippocampus was prepared, and transverse hippocampal slices (300 μm thickness) were obtained in ACSF at 4°C with a Vibratome (Leica, Nussloch, Germany). Slices were transferred to a container filled with oxygenated ACSF at room temperature and allowed to recover for 1 h.
Confocal microscopy and Ca2+ imaging.
Cells were loaded with the fluorescent Ca2+ indicator fluo3-AM (Invitrogen, Eugene, OR), as described previously (Latour et al., 2001). Slices were incubated for 1 h at 37°C in oxygenated ACSF containing 30 μm fluo3-AM, 0.5% dimethyl sulfoxide, and 0.02% pluronic acid (Invitrogen). After the incubation period, slices were returned to oxygenated ACSF at room temperature for 1 h. Individual slices were then placed in a chamber mounted on the stage of an MRC-600 upright laser scanning confocal microscope (Bio-Rad, Hercules, CA) installed on an Olympus BH5 microscope (Tokyo, Japan) equipped with a 40× water-immersion objective (0.75 numerical aperture). The slice was submerged and perfused continuously with oxygenated ACSF (2 ml/min). Fluorescent glial cells were visually identified in stratum radiatum of the CA1 region, on the basis of their small soma diameter (<10 μm) and their dispersed distribution [for detailed glial cell identification parameters, see below, Electrophysiology; also see Latour et al. (2001)]. The 488 nm excitation line of the laser was attenuated to 1% of maximum power, and emission was detected through a barrier filter with cutoff at 515 nm. Similar ranges of gain (9–10) and black level (4.7–5.3) were used throughout the experiments to standardize Ca2+ responses. For Ca2+ imaging, time-lapse fluorescent images were collected every 2 s and recorded with MPL software (Bio-Rad). The images were further analyzed off-line with ImageJ (NIH) and Cfocal software (kindly provided by Dr. M. P. Charlton, University of Toronto, Toronto, Ontario, Canada). For each time-lapse image, the fluorescence intensity (F) was averaged over the soma area. Before drug application, 100–300 control images were taken. Changes in fluorescence (ΔF) were measured as relative changes from baseline fluorescence and expressed as %ΔF/F = [(Fpost − Frest)/Frest] × 100. For each Ca2+ response, the peak amplitude, the time-to-peak, the half-maximal recovery, and the area under the response, calculated with a trapezoidal rule-based algorithm (SigmaPlot, SPSS, Chicago, IL), were determined. Ca2+ responses were elicited by bath application (3 min) of drugs or stimulation of the Schaffer collateral pathway (three trains at 100 Hz for 1 s at 30 s intervals). Cells in which the Ca2+ response did not recover to baseline were discarded from analysis.
The experimental procedure was as follows. Control Ca2+ responses and field EPSP (fEPSP) depression (see below, Electrophysiology) were recorded simultaneously from a slice and induced by bath application of drugs (NMDA and baclofen) or Schaffer collateral stimulation. Fifty minutes after the first agonist application or stimulation, Ca2+ responses and fEPSP recordings were again measured simultaneously in the same slice in the presence of blockers. The following blockers were applied to the whole slice via bath perfusion: d-2-amino-5-phosphonopentanoic acid (d-AP5; 50 μm), tetrodotoxin (TTX; 1 μm), (RS)-α-ethyl-4-carboxyphenylglycine (E4CPG; 400 μm), (2S)-3-[[(1S)-1-(3,4-dichlorophenyl)ethyl]amino-2-hydroxypropyl] (phenylmethyl) phosphinic acid (CGP55845; 2 μm), 3-aminopropyl (diethoxymethyl) phosphinic acid (CGP35348; 500 μm), [S-(R*,R*)]-[3-[[1-(3,4-dichlorophenyl) ethyl] amino]–2-hydroxypropyl] (cyclohexylmethyl) phosphinic acid (CGP54626; 0.1 μm), dipyridamole (DPM; 10 μm), 6-N,N-diethyl-{β}-dibromomethylene-d-adenosine-5′-triphosphate (ARL67156; 100 μm), and cyclopentyl-theophylline (CPT; 2 μm). Ca2+ responses were reproducible, and responses in control and in the presence of blockers were compared as paired experiments. The Ca2+ chelator 1,2-bis(2-aminophenoxy)ethane-N,N,N′,N′-tetra-acetic acid tetrapotassium salt (BAPTA) was dialyzed specifically in glial cells by using whole-cell recordings.
Electrophysiology.
A micropipette filled with ACSF was positioned in stratum radiatum of the CA1 area to record fEPSPs, with an Axoclamp-2B amplifier (Molecular Devices, Union City, CA) in bridge mode. For tetanization-induced heterosynaptic depression, two ultra-small concentric bipolar electrodes (Frederick Haer Co., Brunswick, ME) were placed in stratum radiatum for electrical stimulation of two independent Schaffer collateral pathways (test pathway: single pulse at 0.05 Hz, 100–900 μA, 50–65 μs duration; tetanized pathway: three trains at 100 Hz for 1 s at 30 s intervals; same intensity as test pathway). For synaptic depression induced by NMDA (25 μm) and baclofen (20 μm), a single test pathway was used, and the agonist was bath applied for 3 min. Electrophysiological signals were filtered at 1 kHz, digitized at 2 kHz (TL-1; Molecular Devices), acquired, and analyzed on a PC with pClamp software.
For whole-cell recordings and BAPTA dialysis, pipettes were pulled from borosilicate glass (1 mm outer diameter; A-M Systems, Carlsborg, WA) and filled with the following (in mm): 150 K-methylsulfate, 1 MgCl2, 8 NaCl, 2 ATP, 0.4 GTP, 10 HEPES, 0.15% biocytin, and 0.1 BAPTA (with 40 mm BAPTA, K-methylsulfate was omitted), titrated with KOH to pH 7.2–7.25 and adjusted to 275–285 mOsm (electrode resistance, 4–8 MΩ). Whole-cell recordings were obtained from glial cells in stratum radiatum under visual guidance where fluorescent glial cells were previously identified with confocal microscopy. Whole-cell current-clamp recordings were made with an Axoclamp-2B amplifier (Molecular Devices) in bridge mode. The bridge balance was monitored regularly and adjusted with the bridge circuit.
Glial cells were identified based on the size (<10 μm) and shape of the cells as observed under the fluorescent microscope, according to criteria in Latour et al. (2001). In addition, recorded cells showed no electrical excitability (no action potential produced) and had a low membrane potential (approximately −80 mV) and a low membrane resistance (<15 MΩ). Most importantly, the recording of one glial cell usually resulted in the staining of a large number of glial cells by the biocytin included in the patch pipette. To our knowledge, only a certain category of astrocytes are electrically coupled to such an extent (Wallraff et al., 2004).
Histology.
After whole-cell recordings, slices containing biocytin-filled cells were transferred to a freshly prepared solution of 4% paraformaldehyde in 0.1 m phosphate buffer and fixed for 4–12 h at 4°C. Slices were washed and stored in 0.1 m phosphate buffer and then embedded in agarose and resectioned at 50–80 μm thickness with a Vibratome. Sections were then processed with the Vectastain ABC kit (Vector Laboratories, Burlingame, CA), followed by nickel intensification as described previously (Woodhall et al., 1999). Sections were then mounted in D. P. X. medium (distyrene, plasticizer, and xylene mixture) and examined under a light microscope to count the number of labeled cells.
Statistical analysis.
Experiments were performed on the same slices in control and drug conditions. Thus, statistical significance of differences between groups was assessed with Student’s paired t test. The level of significance was set at p < 0.05. SigmaStat statistical software (SPSS) was used for statistical analysis. All measures are expressed as mean ± SEM.
Results
Ca2+-mediated activation of glial cells during heterosynaptic depression
We induced heterosynaptic depression in rat hippocampal slices by high-frequency stimulation of a subset of Schaffer collaterals (tetanized pathway: three trains at 100 Hz for 1 s at 30 s intervals) (Fig. 1A). Depression of synaptic transmission was measured in a different and independent set of Schaffer collateral–pyramidal cell synapses with field potential recordings (test pathway: single pulse stimulation at 0.05 Hz) (Fig. 1A). High-frequency stimulation of the tetanized pathway induced a transient reduction of fEPSPs in the test pathway (Fig. 1B,C, top panels).
Figure 1.
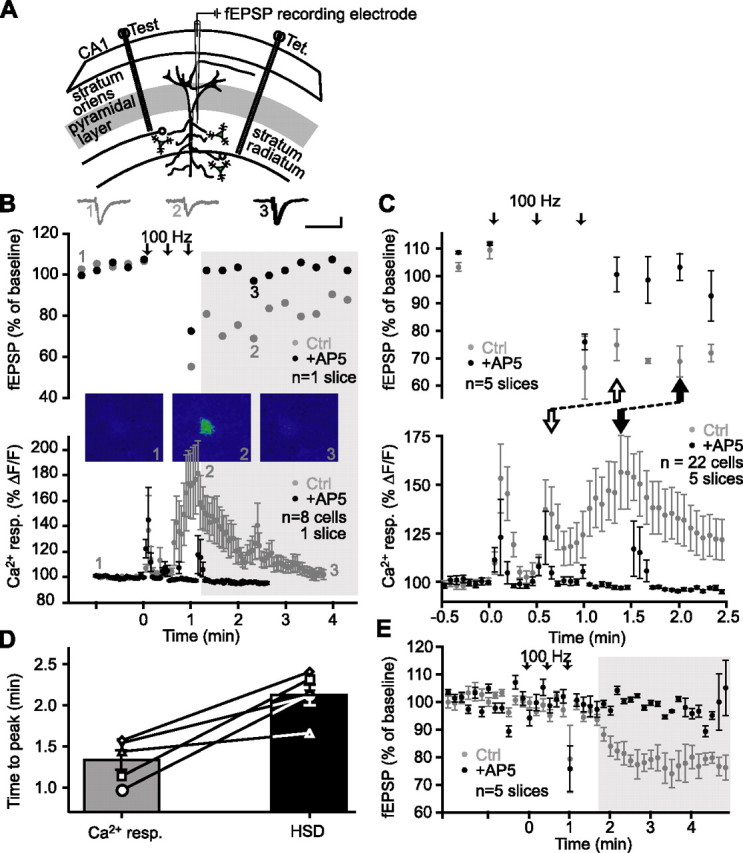
The Ca2+ rise in glial cells precedes heterosynaptic depression of fEPSPs. A, Schematic representation of area CA1 in a rat hippocampus slice, showing positions of two stimulating electrodes [Test; Tet. (tetanus)] and a single fEPSP recording electrode placed in the stratum radiatum. B, Top panel, Representative example of changes in fEPSP amplitude in the test pathway of a single slice experiment, expressed as percentage of baseline, before and after tetanic stimulation of a separate pathway (arrows) (3 trains at 100 Hz for 1 s; 30 s intervals), showing heterosynaptic depression in control (gray) and its block by the NMDA receptor antagonist d-AP5 (50 μm; black). In these and the following experiments, control and antagonist applications were paired, and effects were measured in the same slices. The shaded area represents the period during which NMDA receptor-dependent heterosynaptic depression occurs. Insets show examples of fEPSPs before (1) and during (2) heterosynaptic depression in control, and in d-AP5 (3). Bottom panel, Relative increase in fluorescence for glial cells from the same slice as in the top panel before, during, and after tetanic stimulation (as indicated in the top panel) in control (gray) and in the presence of d-AP5 (black). Stimulation elicited glial Ca2+ responses that were blocked by 50 μm d-AP5 (n = 8 glial cells). Insets show pseudocolor (blue = low level of Ca2+; red = high level) confocal images of a fluo-3-loaded glial cell before (1), during (2), and after (3) tetanus-induced elevation of Ca2+. C, Top panel, changes in average fEPSP amplitude (n = 5 slices) in the test pathway expressed as percentage of baseline, before and after tetanic stimulation of a separate pathway (arrows) (3 trains at 100 Hz for 1 s; 30 s intervals), showing heterosynaptic depression in control (gray) and its block by the NMDA receptor antagonist d-AP5 (50 μm; black). Bottom panel, Average relative increase in fluorescence (n = 5 slices, 22 glial cells) for glial cells from the same experiments as in the top panel before, during, and after tetanic stimulation (as indicated in the top panel) in control (gray) and in the presence of d-AP5 (black). Stimulation elicited glial Ca2+ responses that were blocked by 50 μm d-AP5. Note that only a period of 3 min (30 s before induction and 2.5 min after) is shown to illustrate the timing of the induction of the glial Ca2+ response and of NMDA-dependent heterosynaptic depression. The onset (open arrows) of the sustained glial Ca2+ response precedes the onset of NMDA-dependent heterosynaptic depression. Likewise, the peak of the Ca2+ response (filled arrow) also precedes the peak of the NMDA-dependent heterosynaptic depression. D, Time-to-peak of the Ca2+ rises in glial cells simultaneously recorded with heterosynaptic depression of fEPSPs for each individual slice (open symbols, full lines). The bar graph represents the mean time-to-peak of Ca2+ responses and depression of fEPSPs for all slices. The mean time-to-peak of Ca2+ rises in glial cells is significantly shorter than the mean time-to-peak of heterosynaptic depression (n = 5 slices; Student’s paired t test; p < 0.01). E, Average changes in fEPSP amplitude expressed as percentage of baseline for five experiments before, during, and after tetanic stimulation of Schaffer collaterals (arrows) (3 trains at 100 Hz for 1 s; 30 s intervals). Heterosynaptic depression (control; gray) was blocked by the NMDA receptor antagonist d-AP5 (50 μm; black). Note that NMDA-dependent heterosynaptic depression (shaded area) is induced after the third train of stimulation at 100 Hz. Ctrl, Control; HSD, heterosynaptic depression; resp., response.
Heterosynaptic depression is known to be NMDA receptor dependent (Manzoni et al., 1994). In the presence of the NMDA receptor antagonist d-AP5 (50 μm), two phases of fEPSP depression could be distinguished. A first short-lasting phase took place only seconds after tetanization and was independent of NMDA receptors (Fig. 1B,E). A second slower phase lasting >5 min was significantly reduced by d-AP5 and was considered heterosynaptic depression (Fig. 1B, shaded area). For the group of slices tested, maximal heterosynaptic depression occurred at 2.2 ± 0.1 min after the onset of high-frequency stimulation (Fig. 1C, top panel, D), and fEPSPs were depressed to 68.2 ± 7.9% of baseline (n = 5 slices). In the presence of d-AP5, heterosynaptic depression was significantly reduced, and fEPSP amplitude remained at 87.9 ± 8.1% of baseline (n = 5 slices; Student’s paired t test; p < 0.05), reaching a peak at 1.6 ± 0.5 min after tetanization.
A prerequisite for the involvement of glial cells in heterosynaptic depression is that they are activated by the stimulation protocol for heterosynaptic depression and this activation precedes the induction of the depression. We used simultaneous calcium imaging and fEPSP recordings to monitor variations of intracellular calcium levels (Ca2+) in glial cells in close proximity (≤100 μm) to the fEPSP recording electrode during heterosynaptic depression. The same stimulation protocol used to induce heterosynaptic depression also caused a Ca2+ elevation in glial cells (Fig. 1B, bottom panel; mean response from eight glial cells in the single field recording experiment is shown in the top panel). Stimulation-induced Ca2+ elevations in glial cells were also blocked by the NMDA receptor antagonist d-AP5 (Fig. 1B,C, bottom panel). Importantly, in every slice examined in control conditions, Ca2+ responses were elicited in glial cells during the three trains of stimuli, as well as after the trains, and these glial Ca2+ responses preceded the occurrence of heterosynaptic depression (Fig. 1C,D). For the five slices examined, the mean time-to-peak of Ca2+ responses of all glial cells in a given slice (1.34 ± 0.12 min) was significantly less than the mean time-to-peak of fEPSP heterosynaptic depression (2.14 ± 0.13 min; Student’s paired t test; p < 0.01) (Fig. 1C,D). These results indicate that the peak latency of Ca2+ rises in glial cells evoked by Schaffer collateral stimulation preceded that of heterosynaptic depression. Hence, the requirement that activation of glial cells takes place before the occurrence of the synaptic depression is fulfilled.
We recorded fEPSPs in the test pathway between tetani to test whether the EPSP amplitude was depressed during the stimulation period. In these slices, fEPSP amplitude between trains of stimulation was not significantly different from baseline amplitude (n = 5 slices; Student’s paired t test; p > 0.7) (Fig. 1E). These observations suggest that heterosynaptic depression develops after the third train of stimulation and, hence, that glial cells are activated before the development of tetanus-induced heterosynaptic depression. Because others, in contrast, have reported heterosynaptic depression after a single train of stimulation (Pascual et al., 2005, Manzoni et al., 1994), the variability in the induction of heterosynaptic depression indicates that it is important to examine the temporal relationship between glial Ca2+ responses and depression of synaptic responses in the same experiments, as was done in the present study.
Can heterosynaptic depression be mimicked pharmacologically?
Given the role of NMDA receptors in tetanus-induced heterosynaptic depression and Ca2+ activation of glial cells, we examined the effects of NMDA on fEPSPs and glial cell Ca2+ levels. Bath application of NMDA (25 μm) depressed fEPSPs to 4.2 ± 5.1% of baseline with a maximal reduction occurring at 16.8 ± 1.4 min after the onset of drug application (Fig. 2A). NMDA-induced depression was prevented by the NMDA receptor antagonist d-AP5 (50 μm; Student’s paired t test; p < 0.001) (Fig. 2A). Interestingly, the same NMDA application also caused a transient elevation of Ca2+ in glial cells (Fig. 2B). The relative increase of Ca2+ in glial cells reached a peak of 64.4 ± 4.3% ΔF/F, with a latency of 11.5 ± 0.5 min after the onset of NMDA application, and recovered to half-maximal effect at 14.4 ± 0.8 min after the onset of drug application. The slow kinetics of the Ca2+ responses may be the result of the bath application of the agonist (see also Porter and McCarthy, 1995; Kang et al., 1998). The NMDA-induced rise of Ca2+ in glial cells was blocked by the NMDA receptor antagonist d-AP5 (50 μm; n = 54 cells from seven slices; Student’s paired t test; p < 0.001) (Fig. 2B). Hence, the depression induced by NMDA application and tetanus stimulation are NMDA dependent, suggesting that NMDA application can be used as a pharmacological tool to study the mechanisms of heterosynaptic depression.
Figure 2.

Intracellular Ca2+ rise in glial cells and fEPSP depression induced by NMDA application. A, Representative single experiment (top panel; n = 1 slice) and group data (bottom panel; n = 7 slices) showing changes in fEPSP amplitude expressed as percentage of baseline before, during, and after NMDA bath application (25 μm; 3 min) (bar) in paired control experiments and in the presence of d-AP5 (50 μm). Bath application of NMDA induced a reduction of fEPSP that was prevented by 50 μm d-AP5 (n = 7 slices; Student’s paired t test; p < 0.001). Top insets show examples of fEPSPs before (1) and during (2) synaptic depression in control and in the presence of d-AP5 (3) (calibration: 0.5 mV, 40 ms). B, Relative increase (mean ± SEM) in fluorescence for glial cells in the individual slice shown in A (top panel; n = 6 cells) and for all slices (bottom panel; n = 54 cells, 7 slices) before, during, and after NMDA bath application in control (gray) and in the presence of d-AP5 (black). NMDA elicited glial Ca2+ responses that were prevented by 50 μm d-AP5 (Student’s paired t test; p < 0.001). Responses obtained in control and in the presence of d-AP5 were obtained from the same slices as in A. Top insets show pseudocolor (blue-red scale) confocal images of a glial cell loaded with fluo3-AM before (1) and during (2) NMDA-induced elevation of Ca2+ in control, and in the presence of d-AP5 (3). Scale bar, 10 μm. Ctrl, Control; resp., response.
Is Ca2+-mediated activation of glial cells necessary for heterosynaptic depression?
To test whether Ca2+-mediated glial cell activation was necessary for the induction of heterosynaptic depression, we blocked glial Ca2+ responses by intracellular dialysis of the Ca2+ chelator BAPTA in glial cells with whole-cell recordings. BAPTA was dialyzed during recordings from a single glial cell via a patch pipette that also contained biocytin to visualize a syncytium of glial cells that was labeled after NMDA application (∼20–200 biocytin-labeled glial cells covering an area ∼300 μm in diameter) (Fig. 3A) (see also Latour et al., 2001). Intracellular labeling with Oregon-green BAPTA, a Ca2+ indicator of the BAPTA family (with a higher molecular weight than BAPTA alone), revealed a similar spread into the glial syncytium after NMDA application, thus indicating that dialyzed BAPTA had spread into the syncytium (Fig. 3B, green cells). Identification of glial cells was confirmed by electrophysiological criteria (low resting membrane potential and absence of action potential); they were clearly different from interneurons in the same layer (Fig. 3B, red).
Figure 3.
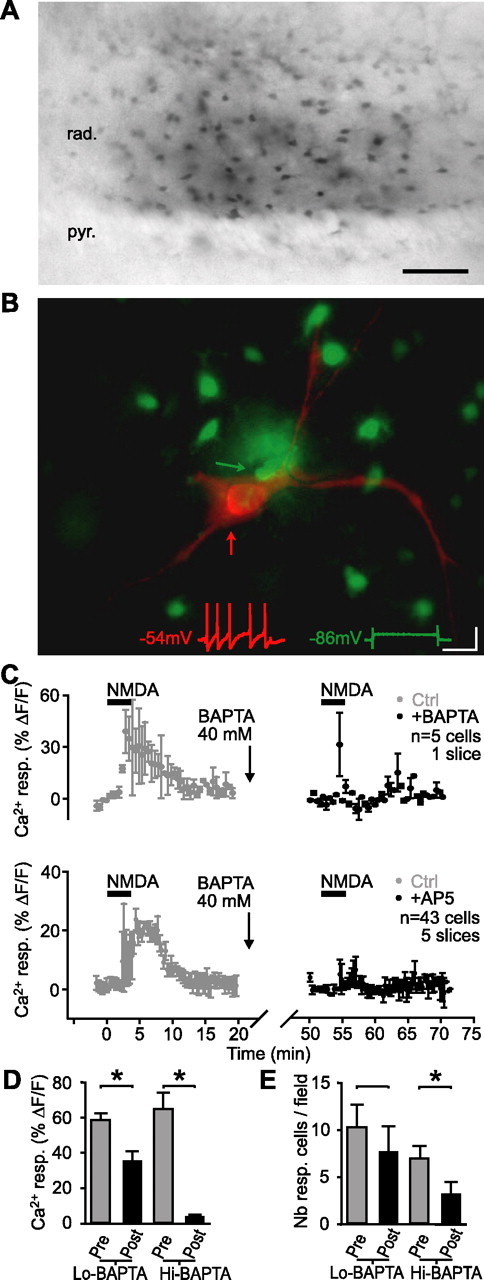
Dialysis of BAPTA in glial cells blocked the Ca2+ rise induced by NMDA. A, Syncytium of glial cells in CA1 stratum radiatum labeled with biocytin after whole-cell recording of a single glial cell with a patch pipette containing BAPTA (40 mm) after NMDA application. Scale bar, 50 μm. B, Syncytium of glial cells (green) in CA1 stratum radiatum labeled with Oregon-green BAPTA after whole-cell recording from a single glial cell (green arrow) after NMDA application. An adjacent interneuron (red) was subsequently recorded in whole-cell mode with Alexa594 in the patch pipette solution (red arrow). Insets show current-clamp recordings from the glial cell (green trace) and the interneuron (red trace) in response to the same depolarizing current step. Calibration: 200 ms, 20 mV. C, Relative increase (mean ± SEM) in fluorescence for glial cells in a single slice (top panel; n = 5 cells) and for all slices (bottom panel; n = 43 cells, 5 slices) before, during, and after NMDA bath application (bars) in control (t = 0–20 min; gray) and after intracellular dialysis of 40 mm BAPTA into glial cells (t = 50–70 min; black; paired experiments). BAPTA was dialyzed during whole-cell patch recording from a single glial cell for the period indicated by the break in the time axis. This period was necessary to allow BAPTA diffusion in the glial syncytium. After BAPTA dialysis (t = 50–70 min), the glial Ca2+ rise induced by NMDA was significantly reduced (Student’s paired t test; p < 0.01). D, Bar graphs showing the amplitude of NMDA-induced glial Ca2+ responses in control (pre-BAPTA dialysis in glial cells; shown as Pre in gray) and after BAPTA dialysis in glial cells (with either 0.1 mm BAPTA (Lo-BAPTA) or 40 mm BAPTA (Hi-BAPTA) in pipette; shown as Post in black). E, Bar graphs showing the number of glial cells responding (Nb resp. cells/field) to NMDA in control (Pre) and after dialysis of 0.1 mm BAPTA (Lo-BAPTA) or 40 mm BAPTA (Hi-BAPTA). Error bars indicate SEM. pyr., Pyramidal; rad., stratum radiatum; resp., response. *p < 0.05.
We next tested the effect of dialyzed BAPTA on NMDA-induced Ca2+ responses. In control conditions, with a low concentration of BAPTA (0.1 mm) dialyzed into glial cells, the NMDA-induced Ca2+ rise was reduced to 60.7 ± 4.6% of control (Student’s paired t test; p < 0.02) (Fig. 3D) because of the normal rundown of fluorescence (see also Latour et al., 2001) (see Fig. 5A); however, after a high concentration of BAPTA (40 mm) was dialyzed in glial cells, the NMDA-induced rise of Ca2+ after BAPTA was significantly reduced to 6.3 ± 5.1% of control (n = 43 cells in five slices; Student’s paired t test; p < 0.01) (Fig. 3C,D). Hence, dialysis of a high concentration of BAPTA caused a 93.7% reduction of an NMDA-induced rise of Ca2+ in glial cells that was significantly larger than the 39.3% reduction caused in control with a low concentration of BAPTA (Student’s t test; p = 0.01). Additionally, in control conditions, dialysis of a low concentration of BAPTA (0.1 mm) did not reduce significantly the number of responsive glial cells (74.8 ± 23.3% of control; Student’s paired t test; p > 0.2) (Fig. 3E). Conversely, the number of responsive glial cells after the dialysis of a high concentration of BAPTA (40 mm) was significantly reduced to 45.7 ± 18.6% of control (Student’s paired t test; p = 0.01) (Fig. 3E). Importantly, the basic properties of glial cells were not affected during these experiments. Indeed, in 40 mm BAPTA, membrane potential (EM = approximately −80 mV) and membrane resistance (RM = ∼15 MΩ) were similar to control values. Moreover, in another series of experiments, the depolarization of glial cells induced by NMDA was unaffected by 40 mm BAPTA (A. Serrano, R. Robitaille, and J.-C. Lacaille, unpublished observations). Hence, glial cells appeared intact and functional. As a whole, these results indicate that the dialysis of 40 mm BAPTA via whole-cell recordings impaired Ca2+ activation induced by NMDA in a significant number of glial cells.
Figure 5.
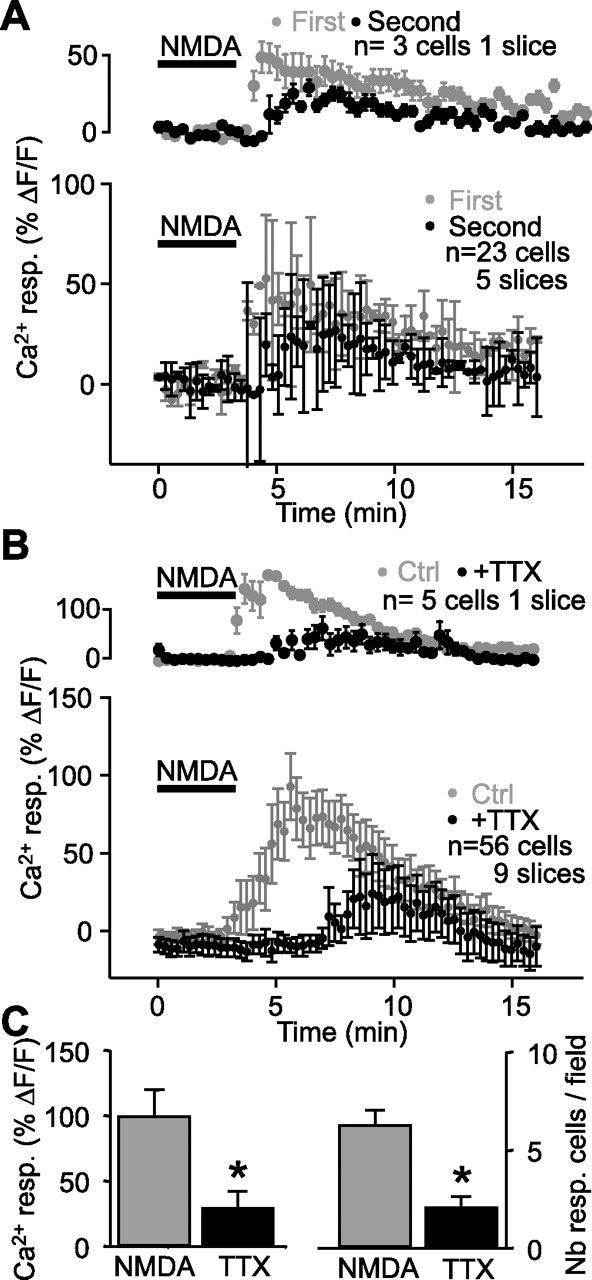
Indirect Ca2+ activation of glial cells during NMDA-induced depression. A, Relative increase (mean ± SEM) in fluorescence for glial cells in a representative single slice (top panel; n = 3 cells) and for all slices (bottom panel; n = 23 cells, 5 slices) before, during, and after two consecutive NMDA bath applications (bar), showing a small rundown in Ca2+ response to the second NMDA application (first, gray; second, black; paired experiments). B, Relative increase (mean ± SEM) in fluorescence for glial cells in a representative slice (top panel; n = 5 cells) and for all slices (bottom panel; n = 56 cells, 9 slices) before, during, and after NMDA bath application (bar) in control (gray) and in the presence of TTX (1 μm; black; paired experiments). The rise of Ca2+ in glial cells elicited by NMDA (25 μm) was significantly reduced and delayed in the presence of TTX. C, Bar graphs depicting the peak amplitude of glial Ca2+ responses and the number of responsive glial cells induced by NMDA in control (gray) and in TTX (black). Note the significant reduction in the amplitude of the responses and in the percentage of responsive cells (Student’s paired t test; *p < 0.001). Error bars indicate SEM. Ctrl., Control; resp., response.
We next evaluated the effect of preventing Ca2+-mediated activation of glial cells on heterosynaptic depression (Fig. 4A). In control conditions, with a low concentration of BAPTA (0.1 mm), there was no significant change in heterosynaptic depression in the same slices before and after BAPTA dialysis in glial cells (n = 7 slices) (Fig. 4B). The peak of the initial phase, the time-to-peak, and the amplitude of the sustained phase measured 5 min after induction of heterosynaptic depression were unchanged (Student’s paired t test; p > 0.3). In contrast, in separate experiments with 40 mm BAPTA dialyzed in glial cells, heterosynaptic depression was significantly reduced and recovered faster (Fig. 4C,D). In these experiments, before BAPTA dialysis, tetanization depressed fEPSP amplitude to 13.2 ± 4.6% of baseline at the peak of the initial phase and to 53.3 ± 5.2% of baseline during the sustained phase (5 min after tetanization), with half-maximal recovery occurring at 3.5 ± 1.2 min after tetanization. After 40 mm BAPTA dialysis in glial cells, the NMDA-independent initial phase of depression of fEPSPs induced by tetanization (Fig. 1B), was unchanged (to 11.1 ± 3.9% of baseline; Student’s paired t test; p > 0.4); however, half-maximal recovery from depression occurred significantly faster (1.0 ± 6.8 min; Student’s paired t test; p < 0.03), and the depression of fEPSPs during the sustained phase was prevented. In this phase, the fEPSP amplitude was reduced only to 82.5 ± 2.8% of baseline (n = 7 slices; Student’s paired t test; p < 0.01) (Fig. 4C,D). These results indicate that prevention of Ca2+-mediated activation of glial cells did not affect the initial NMDA-independent phase of depression induced by tetanization, but it inhibited the sustained NMDA-dependent phase of heterosynaptic depression. Hence, Ca2+-mediated activation of glial cells seems necessary for the complete expression of tetanization-induced heterosynaptic depression. This effect was not caused by the leakage of BAPTA in extracellular space and buffering Ca2+, thus reducing transmitter release, because the presence of the BAPTA-containing patch pipette for 30 min in slices did not affect fEPSP amplitude (data not shown).
Figure 4.
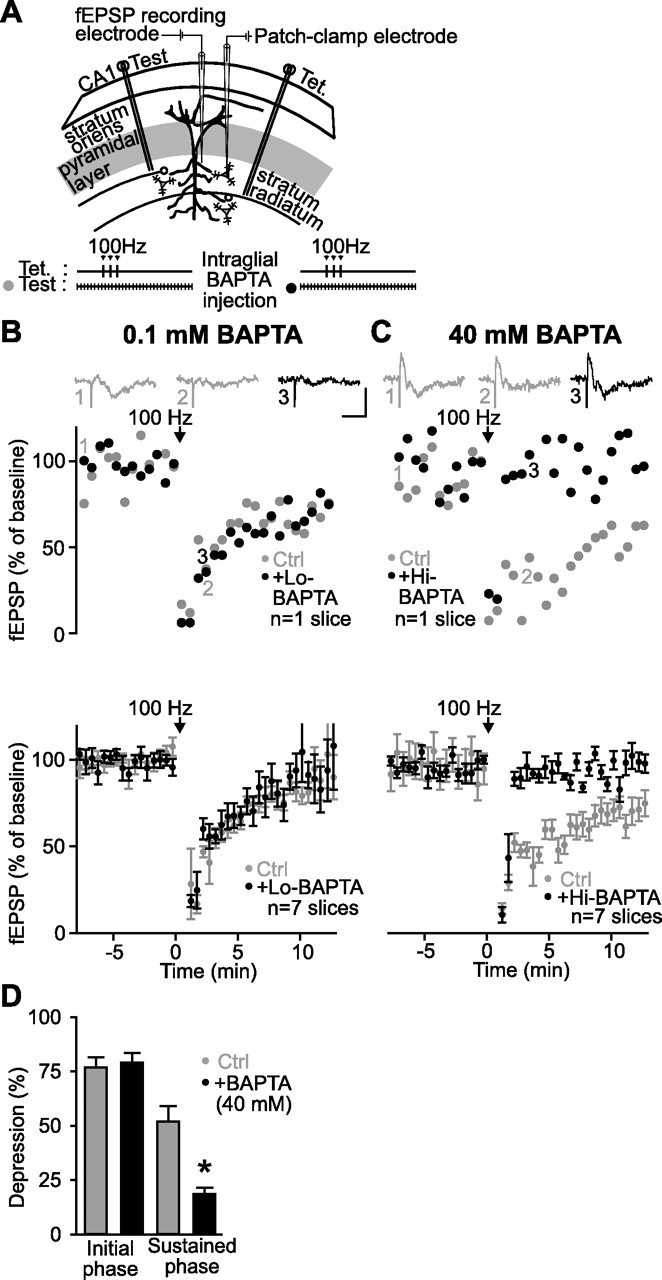
Blockade of heterosynaptic depression by BAPTA dialysis in glial cells. A, Schematic representation of area CA1 in a rat hippocampal slice, showing positions of two stimulating electrodes [Test; Tet. (tetanus)], a single fEPSP recording electrode placed in the stratum radiatum, and a single whole-cell patch-clamp electrode recording from a glial cell. The experimental protocol is illustrated at the bottom. B, Data from a representative slice (top panel) and for all slices (bottom panel; n = 7 slices) showing changes in fEPSP amplitude as percentage of baseline before, during, and after tetanic stimulation of an independent pathway (arrow) (3 trains at 100 Hz for 1 s; 30 s intervals) in paired control experiments (gray) and after whole-cell dialysis of 0.1 mm BAPTA in the glial syncytium (black). Dialysis of 0.1 mm BAPTA in glial cells did not affect tetanization-induced heterosynaptic depression (Student’s paired t test; p > 0.3). Top panel insets show examples of fEPSPs before (1) and during (2) heterosynaptic depression in control and after dialysis of 0.1 mm BAPTA (3). Calibration: 1 mV, 20 ms. C, Data from a single slice (top panel) and for all slices (bottom panel; n = 7 slices) showing changes in fEPSP amplitude as percentage of baseline before, during, and after tetanic stimulation of an independent pathway (arrow) (3 trains at 100 Hz for 1 s; 30 s intervals) in paired control experiments (gray) and after whole-cell dialysis of 40 mm BAPTA in the glial syncytium (black). Note that heterosynaptic depression was obliterated in the presence of a high concentration of the Ca2+ chelator. Dialysis of 40 mm BAPTA in glial cells did not affect the initial phase but reduced significantly the sustained phase of the tetanization-induced heterosynaptic depression (Student’s paired t test; p < 0.01). Top panel insets show examples of fEPSPs before (1) and during (2) heterosynaptic depression in control, and in the presence of a high concentration of intraglial BAPTA (3). D, Bar graphs showing the amplitude of the initial and the sustained phase of heterosynaptic depression induced by tetanic stimulation in control (gray) and after dialysis of 40 mm BAPTA (black). Error bars indicate SEM. Ctrl, Control. *p < 0.05.
Indirect mechanism of glial cell activation during NMDA-induced synaptic depression
We next investigated whether glial cells could be activated directly by NMDA (Schipke et al., 2001) during NMDA-induced synaptic depression. To test this possibility, we applied NMDA in the presence of TTX (1 μm) to block action potential propagation and synaptic transmission. The NMDA-induced rise of Ca2+ in glial cells showed significant rundown with repeated application of NMDA (57.9 ± 12.3% of control; Student’s t test; p < 0.01) (Figs 3D, 5A). In TTX, the NMDA-induced rise of Ca2+ in glial cells was significantly reduced to 30.6 ± 13.0% of control (n = 56 cells in nine slices; Student’s paired t test; p < 0.001) (Fig. 5B,C). Moreover, the time-to-peak of the Ca2+ rise was 12.4 ± 0.6 min in TTX, which was significantly delayed relative to control conditions (9.1 ± 0.5 min in control). Also, in the presence of TTX, the number of responsive glial cells per field of view in a slice was significantly reduced by 69.2 ± 5.4% (Student’s paired t test; p < 0.001) (Fig. 5C). Our results suggest that Ca2+-mediated glial activation during NMDA-induced depression was indirect and involved neuronal elements.
Additionally, we tested whether coupling of glial cells after NMDA application was also affected by TTX. Dialysis of biocytin in a single glial cell resulted in labeling of a reduced number of cells (2.7 ± 1.2 cells; n = 3 slices). After application of NMDA, the number of biocytin-labeled glial cells was 123.3 ± 53.6 cells (n = 10 slices) (Fig. 3A); however, after application of NMDA in the presence of TTX, only 4.3 ± 1.8 glial cells (n = 3 slices) were labeled with biocytin (Student’s paired t test; p < 0.05). These results suggest that NMDA-induced coupling of glial cells is also indirect and involves activation of the neuronal network.
We next wondered whether indirect glial activation involved glutamate release from Schaffer collaterals and activation of metabotropic glutamate receptors (mGluRs) (Porter and McCarthy, 1996; Latour et al., 2001). In the presence of E4CPG (400 μm), a group I/II mGluR antagonist, neither the NMDA-induced synaptic depression nor the Ca2+ rise in glial cells was affected. NMDA depressed fEPSPs to 11.7 ± 3.8% of baseline in control and to 15.4 ± 3.2% of baseline in the presence of E4CPG (n = 4 slices; Student’s paired t test; p > 0.4; data not shown). Also, when glial Ca2+ responses were monitored with fEPSP recordings, NMDA-induced a Ca2+ rise of 51.7 ± 6.1% ΔF/F in glial cells in control conditions and of 51.6 ± 5.7% ΔF/F in the presence of E4CPG (n = 8 cells in two slices; Student’s paired t test; p > 0.6; data not shown). Our results indicate that group I/II mGluR activation is not involved in either the NMDA-induced depression of fEPSP or the Ca2+ responses in glial cells.
Role of GABA in heterosynaptic depression and activation of glial cells
Because hippocampal GABA interneurons express NMDA receptors (Freund and Buzsaki, 1996) and their activation elicits GABAB-mediated Ca2+ rises in glial cells (Kang et al., 1998), we next tested whether the GABAergic system contributes to heterosynaptic depression. Heterosynaptic depression was measured simultaneously with Ca2+ levels in glial cells in control conditions and in the presence of the GABAB antagonist CGP55845. In the presence of CGP55845 (2 μm), both the tetanus-induced rise of Ca2+ in glial cells and the heterosynaptic depression of fEPSPs were significantly reduced (Fig. 6A,B). As shown in Figure 6A, in CGP55845 (2 μm) fEPSPs were only depressed to 81.3 ± 4.6% of baseline, compared with 31.2 ± 5.7% of baseline in control (n = 3 slices; Student’s paired t test; p < 0.001), whereas the glial Ca2+ response induced by the stimulation was blocked (n = 15 cells in three slices; Student’s paired t test; p < 0.01) (Fig. 6B). These findings appear inconsistent with those of Manzoni et al. (1994), who found that the less potent GABAB antagonist CGP35348 did not prevent NMDA- and tetanus-induced heterosynaptic depression. This discrepancy may result from the different efficacy of the GABAB receptor antagonists used (Davies et al., 1993). To examine this possibility, we tested the effect on heterosynaptic depression of CGP35348 and another new generation GABAB antagonist, CGP54626. When tested in the same slices, depression of fEPSPs was not significantly different in control (to 74.2 ± 0.8% of baseline) and in the presence of CGP35348 (to 75.5 ± 2.2% of baseline; n = 3 slices; p > 0.05; ANOVA; Tukey’s test) but was significantly reduced in the presence of CGP54626 (to 91.4 ± 0.7% of baseline; p < 0.001; ANOVA; Tukey’s test). These data suggest that neuronal and glial GABAB receptors may differ in terms of pharmacological profile, but, moreover, clearly indicate that Ca2+-mediated glial activation during heterosynaptic depression requires GABAB receptors. Hence, these data suggest that the inhibition of NMDA-induced glial activation by TTX (Fig. 5B) is caused by the block of action potential propagation in GABAergic cells and reduction of GABA release. These results further suggest that the indirect Ca2+-mediated activation of glial cells during the NMDA-induced depression involves the GABAergic system.
Figure 6.

GABAB receptor activation is necessary for heterosynaptic depression. A, Data from a single slice (top panel) and for all slices (bottom panel; n = 3 slices) showing changes in fEPSP amplitude as percentage of baseline before, during, and after tetanic stimulation of an independent pathway (arrows) (3 trains at 100 Hz for 1 s; 30 s intervals) in paired control experiments (gray) and in the presence of the GABAB receptor antagonist CGP55845 (2 μm; black). Summary bar graph (inset) shows that heterosynaptic depression was reduced significantly by the GABAB receptor antagonist (Student’s paired t test; *p < 0.001). Top panel insets show examples of fEPSPs before (1) and during (2) heterosynaptic depression in control and in the presence of CGP55845 (3). Calibration: 1 mV, 25 ms. B, Relative increase (mean ± SEM) in fluorescence for glial cells in a single slice (top panel; n = 3 cells; same slice as in A) and for all slices (bottom panel; n = 15 cells, 3 slices) before, during, and after tetanic stimulation in control and in the presence of CGP55845 (2 μm; same experiments as in A). Summary bar graph (inset) shows the rise of Ca2+ in glial cells elicited by tetani that was blocked by CGP55845 (Student’s paired t test; *p < 0.01). Error bars indicate SEM. Ctrl., Control; resp., response.
We next asked whether GABAB receptors were involved in NMDA-induced heterosynaptic depression. In control, NMDA depressed fEPSP amplitude to 1.6 ± 4.2% of baseline with a peak at 12.9 ± 2.3 min after drug onset, whereas fEPSPs were only reduced to 41.1 ± 9.3% of baseline at 11.5 ± 0.8 min after drug onset in the presence of CGP55845 (2 μm; n = 6 slices; Student’s paired t test; p < 0.01) (Fig. 7A). In CGP55845, the glial Ca2+ response induced by NMDA was completely abolished (n = 47 cells in six slices; Student’s paired t test; p < 0.001) (Fig. 7B). Thus, NMDA-induced depression and heterosynaptic depression share another common step: the activation of GABAB receptors.
Figure 7.

GABAB receptor activation is involved in NMDA- and baclofen-induced depression. A, Data from a single slice (top panel) and for all slices (bottom panel; n = 6 slices) showing changes in fEPSP amplitude as percentage of baseline before, during, and after NMDA bath application (25 μm; 3 min) (bar) in paired control experiments (gray) and in the presence of the GABAB receptor antagonist CGP55845 (2 μm, black). Summary bar graph (inset) shows the significant reduction of NMDA-induced depression by CGP55845 (Student’s paired t test; *p < 0.01). Top panel insets show examples of fEPSPs before (1) and during (2) synaptic depression in control, and in the presence of CGP55845 (3). Calibration: 0.5 mV, 20 ms. B, Relative increase (mean ± SEM) in fluorescence for glial cells in a single slice (top panel; n = 7 cells) and for all slices (bottom panel; n = 47 cells, 7 slices) before, during, and after NMDA bath application (25 μm) in control (gray) and in the presence of CGP55845 (2 μm; black). Summary bar graph (inset) shows the blockade of NMDA-induced glial Ca2+ responses by CGP55845 (Student’s paired t test; *p < 0.001; same experiments as in A). C, Data from single slice (top panel) and for all slices (bottom panel; n = 6 slices) showing changes in fEPSP amplitude as percentage of baseline before, during, and after bath application of the GABAB receptor agonist baclofen (20 μm; 3 min) (bar) in paired control experiments (gray) and in the presence of CGP55845 (2 μm; black). Bar graph (inset) depicting the baclofen-induced reduction in fEPSP amplitude (gray) blocked by the GABAB receptor antagonist CGP55845 (black; Student’s paired t test; *p < 0.01). Top panel insets show examples of fEPSPs before (1) and during (2) synaptic depression in control, and in the presence of CGP55845 (3). Calibration: 0.2 mV, 20 ms. D, Relative increase (mean ± SEM) in fluorescence for glial cells in a single slice (top panel; n = 5 cells) and for all slices (bottom panel; n = 33 cells, 6 slices) before, during, and after baclofen bath application (20 μm) in control (gray) and in the presence of 2 μm CGP55845 (black; paired experiments; same experiments as in C). Bar graph (inset) shows the average baclofen-induced Ca2+ responses in control and in the presence of CGP55845. Glial Ca2+ responses were prevented by the GABAB receptor antagonist (Student’s paired t test; *p < 0.01). Error bars indicate SEM. BAC, Baclofen; Ctrl, control; resp., response.
We next tested whether bypassing local GABA release and directly activating GABAB receptors with an agonist would induce fEPSP depression and Ca2+ responses in glial cells. As shown in Figure 7C, bath application of the GABAB agonist baclofen (20 μm) depressed fEPSPs to 5.6 ± 5.0% of baseline, with the maximal effect at 10.7 ± 2.3 min after onset of drug application (n = 6 slices), which was blocked by CGP55845 (2 μm). Moreover, the same bath application of baclofen induced a glial Ca2+ response of 57.0 ± 19.5% ΔF/F that peaked at 8.3 ± 3.6 min after the onset of drug application (n = 33 cells in six slices) (Fig. 7D). The baclofen-induced rise of Ca2+ in glial cells was blocked also by CGP55845 (Student’s paired t test; p < 0.01). The glial Ca2+ responses induced by baclofen are unlikely to be indirect, because they were unaffected by TTX (1 μm) (n = 12 cells; Student’s paired t test; p > 0.5). Thus, the results of these series of experiments indicate that GABAB receptor activation is necessary and sufficient for Ca2+-mediated glial activation and fEPSP depression, suggesting a critical interaction between the GABAergic network and glial cells in heterosynaptic depression. Moreover, these data suggest that activation of glial GABAB receptors occurs downstream from GABA release in the induction cascade of heterosynaptic depression, because the GABAB agonist directly activated glial cells.
Is Ca2+-mediated activation of glial cells necessary for NMDA- or baclofen-induced depression?
Given the role of Ca2+ activation of glial cells in heterosynaptic depression, we next examined whether glial Ca2+ activation is also necessary for NMDA-induced synaptic depression. Because bath application of NMDA will activate a number of cellular elements, such as inhibitory interneurons, and consequently affect a larger number of glial cells than those dialyzed with BAPTA, one would predict that BAPTA dialysis in glial cells would reduce, but not completely block, the NMDA-induced depression. In control experiments (i.e., 0.1 mm BAPTA in patch electrode), 25 μm NMDA similarly depressed fEPSP amplitude before (to 5.4 ± 2.7% of baseline) and after (to 8.7 ± 4.5% of baseline) BAPTA dialysis in glial cells (n = 7 slices; Student’s paired t test; p > 0.3) (Fig. 8A). After dialysis of 40 mm BAPTA, however, NMDA depressed fEPSPs only to 30.8 ± 7.6% of baseline in comparison with 0.1 ± 8.4% of baseline in control (n = 9 slices; Student’s paired t test; p < 0.02) (Fig. 8B,C). Recovery from depression was also significantly faster (half-maximal recovery, 10.5 ± 0.8 min before and 8.0 ± 1.2 min after BAPTA dialysis; Student’s paired t test; p < 0.03). Additionally, none of these changes could be explained by baseline variations in fEPSP because control experiments with vehicle (ACSF) application and whole-cell recording with BAPTA-free patch solution remained stable throughout the entire test period (Fig. 8B). These results indicate that preventing Ca2+ activation in glial cells significantly reduced NMDA-induced synaptic depression.
Figure 8.

Effects of glial BAPTA dialysis on NMDA- and baclofen-induced depression. A, Data from a single slice (top panel) and for all slices (bottom panel; n = 7 slices) showing changes in fEPSP amplitude as percentage of baseline before, during, and after NMDA bath application (25 μm) in paired control experiments (gray) and after 0.1 mm BAPTA dialysis into glial cells (black). Top panel insets show examples of fEPSPs before (1) and during (2) synaptic depression in control, and in the presence 0.1 mm BAPTA in the glial syncytium (3). Calibration: 0.5 mV, 20 ms. The presence of 0.1 mm BAPTA in glial cells did not affect NMDA-induced depression (Student’s paired t test; p > 0.3). B, Data from a single slice (top panel) and for all slices (bottom panel; n = 9 slices) showing changes in fEPSP amplitude as percentage of baseline before, during, and after NMDA bath application (25 μm) in paired control experiments (gray) and after 40 mm BAPTA dialysis into glial cells (black). Insets show examples of fEPSPs before (1) and during (2) synaptic depression in control and in the presence 40 mm intraglial BAPTA (3). Calibration: 0.5 mV, 20 ms. Dialysis of 40 mm BAPTA in glial cells reduced the NMDA-induced depression. fEPSP amplitudes expressed as percentage of baseline were unchanged before, during, and after vehicle application and during whole-cell recording from a glial cell with a solution without BAPTA (gray triangles). C, Bar graphs showing percentage of NMDA-induced depression in control (gray) and in the presence of BAPTA (40 mm) in the glial syncytium (black). Note the significant reduction of the peak of NMDA-induced depression by the glial BAPTA (Student’s paired t test; *p < 0.02). D, Data from a single slice (top panel) and for all slices (bottom panel; n = 5 slices) showing changes in fEPSP amplitude as percentage of baseline before, during, and after baclofen bath application (20 μm) in paired control experiments (gray) and after 40 mm BAPTA dialysis into the glial syncytium (black). Insets show examples of fEPSPs before (1) and during (2) synaptic depression in control, and in the presence 40 mm intraglial BAPTA (3). Calibration: 0.5 mV, 20 ms. E, Bar graphs showing percentage of baclofen-induced depression in control (gray) and in the presence of BAPTA (40 mm) in the glial syncytium (black). Note the reduction in the baclofen-induced depression (Student’s paired t test; *p < 0.001). F, Data from a single slice (top panel) and for all slices (bottom panel; n = 3 slices) showing changes in fEPSP amplitude as percentage of baseline before, during, and after two consecutive baclofen bath applications (paired experiments; 20 μm) (bar). Insets show corresponding fEPSPs before (1) and during (2, 3) synaptic depression. Calibration: 0.5 mV, 20 ms. Error bars indicate SEM. BAC, Baclofen; Ctrl., control; resp., response.
We tested next whether baclofen-induced depression was reduced by chelating Ca2+ in glial cells. Given the importance of presynaptic GABAB inhibition of glutamatergic synapses (Isaacson et al., 1993), one can predict that only a fraction of the baclofen-induced depression should be blocked by BAPTA dialysis in glial cells. Indeed, after BAPTA (40 mm) was dialyzed into glial cells, baclofen depressed fEPSPs only to 30.7 ± 2.0% of baseline in comparison with 18.2 ± 1.5% of baseline in control (n = 5 slices; Student’s paired t test; p < 0.001) (Fig. 8D,E). Note that in these experiments, NMDA application was needed between the pre- and post-BAPTA baclofen applications to allow BAPTA–biocytin to spread into the syncytium. In control experiments, without BAPTA dialysis in glial cells, repeated applications of baclofen produced similar fEPSP depression (Fig. 8F). These results indicate that inhibition of Ca2+ activation in glial cells reduced a small but significant portion of baclofen-induced depression.
Adenosine A1 receptor involvement in heterosynaptic depression but not in glial cell activation
To confirm that heterosynaptic depression is caused by adenosine activating A1 receptors at Schaffer collateral synapses (Manzoni et al., 1994), we induced heterosynaptic depression in the presence of CPT, an antagonist of A1 adenosine receptors. Bath perfusion of CPT (2 μm) significantly reduced heterosynaptic depression of fEPSP amplitude from 46.1 ± 3.2% of baseline in control to only 76.4 ± 6.3% of baseline in the presence of CPT (n = 5 slices; Student’s paired t test; p < 0.05) (Fig. 9A). Thus, consistent with previous reports (Manzoni et al., 1994), heterosynaptic depression depends on adenosine release and activation of A1 receptors. Because adenosine elicits Ca2+ elevations in glial cells (Porter and McCarthy, 1995) and glial cells release adenosine and ATP (Cotrina et al., 1998, 2000; Guthrie et al., 1999; Wang et al., 2000; Newman, 2003), we tested the sensitivity of tetanus-induced Ca2+ rises in glial cells to CPT (2 μm). As shown in Figure 9B, the peak of the tetanus-induced Ca2+ rises in glial cells was not affected significantly by CPT (n = 16 cells in 3 slices; Student’s paired t test; p > 0.3). In control, the peak Ca2+ rise was 64.7 ± 39.1% ΔF/F, whereas in CPT, the peak Ca2+ response was 80.1 ± 53.7% ΔF/F. These results confirm that tetanus-induced glial cell activation is not mediated via A1 receptors and extracellular release of adenosine. Thus, because adenosine is necessary for the induction of heterosynaptic depression and because glial cell activation is not dependent on adenosine release, these results suggest that adenosine release occurs downstream from glial cell activation.
Figure 9.
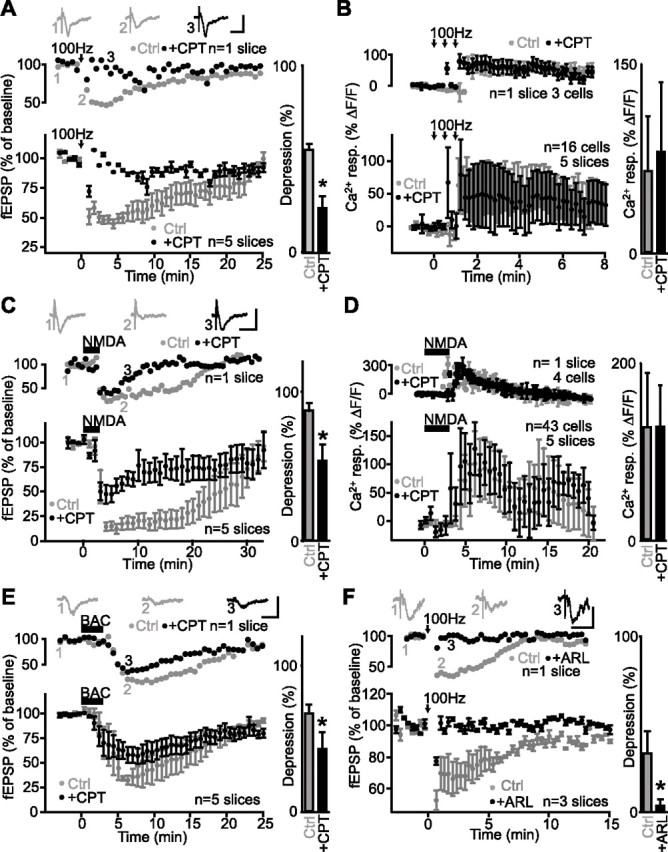
Adenosine A1 receptors mediate heterosynaptic depression but are not involved in glial activation. A, Data from a single slice (top panel) and for all slices (bottom panel; n = 5 slices) showing changes in fEPSP amplitude as percentage of baseline before and after tetanic stimulation of an independent pathway (arrows) (3 trains at 100 Hz for 1 s; 30 s intervals) in paired control experiments (gray) and in the presence of the A1 receptor antagonist CPT (2 μm; black). Insets show examples of fEPSPs before (1) and during (2) heterosynaptic depression in control and in the presence of CPT (3). Calibration: 0.5 mV, 20 ms. Bar graph (right) shows that heterosynaptic depression was significantly reduced by the A1 receptor antagonist (Student’s paired t test; *p < 0.05). B, Relative increase (mean ± SEM) in fluorescence for glial cells in a single slice (top panel; n = 3 cells) and for all slices (bottom panel; n = 16 cells, 5 slices) before, during, and after tetanic stimulation (arrows) (3 trains at 100 Hz for 1 s; 30 s interval) showing a calcium rise in control (gray) and in the presence of 2 μm CPT (black; paired experiments). Bar graph (right) shows that the A1 receptor antagonist had no effect on glial Ca2+ responses evoked by tetanic stimulation (Student’s paired t test; p > 0.3). C, Data from a single slice (top panel) and for all slices (n = 5 slices) showing changes in fEPSP amplitude as percentage of baseline before, during, and after NMDA bath application (25 μm) in paired control experiments (gray) and in the presence of CPT (2 μm; black). Insets show corresponding fEPSPs before (1) and during (2) synaptic depression in control and in the presence of CPT (3). Calibration: 0.5 mV, 20 ms. Bar graph (right) indicates that NMDA-induced depression was reduced significantly by the A1 receptor antagonist (Student’s paired t test; *p < 0.05). D, Relative increase (mean ± SEM) in fluorescence for glial cells in a single slice (top panel; n = 4 cells) and for all slices (bottom panel; n = 43 cells, 5 slices) before, during, and after NMDA bath application (25 μm) showing a calcium rise in control (gray) and in the presence of 2 μm CPT (black; paired experiments). Bar graph (right) shows that the A1 receptor antagonist had no effect on the NMDA-evoked glial Ca2+ responses (Student’s paired t test; p > 0.2). E, Data from a single slice (top panel) and for all slices (bottom panel; n = 5 slices) showing changes in fEPSP amplitude as percentage of baseline before, during, and after baclofen bath application (20 μm) in control (gray) and in the presence of CPT (2 μm; paired experiments). Insets show fEPSPs before (1) and during (2) synaptic depression in control, and in the presence of CPT (3). Calibration: 0.5 mV, 20 ms. Bar graph (right) shows that baclofen-induced depression was significantly reduced by the A1 receptor antagonist (Student’s paired t test; *p < 0.05). F, Data from single slice (top panel) and for all slices (bottom panel; n = 3 slices) displaying changes in fEPSP amplitude as percentage of baseline before, during, and after tetanic stimulation of an independent pathway (arrows) (3 trains at 100 Hz for 1 s; 30 s intervals) in control (gray) and in the presence of the ectonucleotidase inhibitor ARL67156 (100 μm; black; paired experiments). Insets show fEPSPs before (1) and during (2) heterosynaptic depression in control and in the presence of ARL67156 (3). Calibration: 0.5 mV, 20 ms. Bar graph (right) shows the significant reduction of heterosynaptic depression by ARL67156 (Student’s paired t test; *p < 0.05). Error bars indicate SEM. Ctrl, Control; resp., response.
We next tested whether NMDA-induced depression also depends on A1 receptor activation (Manzoni et al., 1994). We measured NMDA-induced depression in control conditions and in the presence of bath-applied CPT in the same slices. In control, NMDA depressed fEPSPs to 12.8 ± 5.0% of baseline, but only to 46.1 ± 10.7% of baseline in CPT (n = 5 slices; Student’s paired t test; p < 0.05) (Fig. 9C). The remaining depression may be the result of the direct presynaptic GABAB inhibition caused by the NMDA activation of interneurons and GABA release. Thus, NMDA-induced depression and heterosynaptic depression share a dependence on adenosine release and A1 receptor activation. We also tested whether adenosine activation of A1 receptors occurs downstream of NMDA-induced Ca2+ responses in glial cells by examining the sensitivity of NMDA-induced Ca2+ rises in glial cells to CPT (2 μm). Neither the peak nor the time-to-peak of the NMDA-induced Ca2+ rises in glial cells were affected significantly by CPT (n = 43 cells in five slices; Student’s paired t test; p > 0.2) (Fig. 9D). In control, the peak Ca2+ rise was 128.5 ± 60.2% ΔF/F and occurred at 5.8 ± 3.0 min after the onset of drug application, whereas in CPT, the peak Ca2+ response was 128.9 ± 46.5% ΔF/F at 5.9 ± 2.7 min after drug application. These results confirm that NMDA-induced glial cell activation is not mediated via A1 receptors and extracellular release of adenosine.
If GABA release is involved in glial cell activation and heterosynaptic depression, then the fEPSP depression induced by the GABAB agonist baclofen (Fig. 7C,D) should be indirectly mediated, in part, by adenosine. To test this requirement, we measured baclofen-induced depression in control conditions and in the presence of bath-applied CPT (2 μm). In control, baclofen depressed fEPSP amplitude to 32.6 ± 5.9% of baseline but only to 57.0 ± 11.4% of baseline in CPT (n = 5 slices; Student’s paired t test; p < 0.05) (Fig. 9E). These values concord with the proportion of the baclofen-induced depression blocked by BAPTA (Fig. 8E) and with the strong inhibition of glutamate release by presynaptic GABAB receptors at Schaffer collaterals. Hence, as for heterosynaptic depression and NMDA-induced depression, baclofen-induced depression also depends on A1 receptor activation for its complete induction. These results indicate that heterosynaptic depression and NMDA- and baclofen-induced depression share pathways that similarly converge toward the release of adenosine.
We next examined whether adenosine or its metabolic precursor ATP (Cotrina et al., 1998, 2000; Guthrie et al., 1999; Wang et al., 2000; Newman, 2003) was released from glial cells in heterosynaptic depression with ARL67156 (Gallagher and Salter, 2003), a specific ectonucleotidase inhibitor known to block ATP degradation. If adenosine is produced from ATP degradation, one would expect that heterosynaptic depression should be reduced in the presence of the ectonucleotidase inhibitor. Indeed, bath application of ARL67156 (100 μm) significantly reduced heterosynaptic depression. In control, fEPSPs were depressed to 66.7 ± 10.9% of baseline but only to 96.3 ± 1.4% of baseline in ARL67156 (n = 3 slices; Student’s paired t test; p < 0.05) (Fig. 9F). Furthermore, similar results were obtained with another ectonucleotidase inhibitor, DPM (Connolly and Duley, 2000; Zhang et al., 2003). Heterosynaptic depression of fEPSP was to 46.1 ± 3.2% of baseline in control and only to 76.4 ± 6.3% of baseline in DPM (10 μm; n = 5 slices; Student’s paired t test; p < 0.05). Thus, these results suggest that adenosine mediating heterosynaptic depression is a product of ATP degradation.
Discussion
We established that heterosynaptic depression at hippocampal Schaffer collateral synapses depends on interactions between both neuronal and glial elements. These results indicate that tetanized Schaffer collaterals release glutamate, stimulating the GABAergic network that in turn activates glial cells, which will feed back onto nontetanized Schaffer collateral synapses to induce heterosynaptic depression (supplemental Fig. 1, available at www.jneurosci.org as supplemental material). These findings reveal a novel interactive role between neuronal networks and glial cells in modulating efficacy at central excitatory synapses.
Glial cell activation is necessary for heterosynaptic depression
Heterosynaptic depression was proposed to arise from the release of adenosine by interneurons causing depression of transmitter release (Manzoni et al., 1994). Our data confirm an involvement of these cellular elements but further demonstrate the requirement for glial cell activation in heterosynaptic depression.
We found that Ca2+ activation of glial cells precedes heterosynaptic depression and that glial activation appears indirectly mediated by GABA. Indeed, not only was glial activation significantly reduced in TTX, but both heterosynaptic depression and glial cell Ca2+ responses were significantly reduced by GABAB receptor antagonists. Heterosynaptic depression was reported previously as GABAB independent (Manzoni et al., 1994); however, this discrepancy appears to be because of the different antagonists used. The newer generation and more potent GABAB antagonists (CGP55845 and CGP54626) prevent heterosynaptic depression, whereas the less potent antagonist, CGP35348, does not.
Furthermore, the GABAB agonist baclofen directly activated glial cells and induced depression, in part independent of presynaptic GABAB inhibition. Hence, our data suggest that activation of glial cells during heterosynaptic depression and NMDA- and baclofen-induced depression is indirect via local release of GABA. Interestingly, GABAB receptors are expressed in glia (Fraser et al., 1994), and interneuron activation produces GABAB-mediated Ca2+ activation of glial cells (Kang et al., 1998). This is an intriguing observation, because GABAB receptors were not known to be positively linked to Ca2+ homeostasis. Finally, we observed that activation of the GABAergic system is essential for both heterosynaptic depression and glial cell activation. Therefore, activation of the GABAergic network by Schaffer collateral stimulation appears not only necessary but also sufficient for heterosynaptic depression and glial cell activation. Direct recording and selective stimulation of GABA interneurons will be necessary to identify which cells are implicated in heterosynaptic depression. Furthermore, one could have expected that not only NMDA but also AMPA–KA receptors may contribute to GABAergic network activation and induction of heterosynaptic depression. The reasons for such different functional importance of NMDA receptors remain to be elucidated.
Glial activation during heterosynaptic depression does not simply occur in parallel during plasticity, because introduction of a calcium chelator in glial cells blocked heterosynaptic depression. Thus, Ca2+-mediated activation of glial cells is necessary for the induction of heterosynaptic depression; however, whether the glial Ca2+ rise is sufficient to induce heterosynaptic depression remains to be established. Our data also confirmed an NMDA-independent plasticity, described previously as heterosynaptic suppression (Zhang et al., 2003), that precedes heterosynaptic depression. This early phase of depression was not blocked by d-AP5, CPT, and BAPTA, suggesting that it is distinct from heterosynaptic depression. This early phase may also involve presynaptic GABAB-mediated depression (Isaacson et al., 1993).
On the basis of our data, a sequence of network interactions underlying heterosynaptic depression can be proposed (supplemental Fig. 1, available at www.jneurosci.org as supplemental material). (1) Glutamate released from tetanized Schaffer collaterals activates GABAergic cells via NMDA receptors; (2) GABA release activates GABAB receptors on glial cells, (3) leading to a Ca2+ rise in glial cells, (4) producing ATP release from glial cells, degradation into adenosine, and activation of A1 receptors on Schaffer collaterals, and, finally, (5) causing presynaptic inhibition of transmitter release. Hence, our main conclusion is that glial cell activation is necessary for heterosynaptic depression.
It is important to place this model in perspective with other known regulatory mechanisms, such as presynaptic GABAB inhibition (supplemental Fig. 1, available at www.jneurosci.org as supplemental material) (Isaacson et al., 1993), to which glial cell-mediated heterosynaptic depression will act in complement. Indeed, the lower efficacy of intraglial dialysis of BAPTA on NMDA- and baclofen-induced depression reflects the coexistence of glial-mediated modulation and other neuronal regulatory mechanisms; however, an important functional difference between these regulatory systems is their temporal feature, with presynaptic GABAB inhibition occurring in seconds (Isaacson et al., 1993) and heterosynaptic depression occurring in minutes (Manzoni et al., 1994).
Heterosynaptic depression emerges from the cooperation between neuronal and glial networks
In addition to glial cell activation being necessary for heterosynaptic depression, our data indicate a glial network involvement. Dialysis of a calcium chelator in a single glial cell reduced the responses of numerous glial cells to NMDA, baclofen, or tetanization. Biocytin and Oregon-green BAPTA labeling revealed a network reaching as many as 200 cells over a large area (∼300 μm diameter). In contrast, previous studies reported significant dye coupling in hippocampal astrocytes in “unstimulated” slices (D’Ambrosio et al., 1998; Latour et al., 2001; Wallraff et al., 2004). The reasons for these differences in level of dye coupling in basal conditions are unclear, but because synaptic activity was found to regulate glial dye coupling, differences in experimental protocols affecting levels of spontaneous activity may be involved. In any case, reduction of both NMDA- and baclofen-induced depression by calcium buffering in glia suggests a sufficiently extended glial network to modulate synaptic activity over the large area affected by bath-applied agonists. Hence, our data imply that a network of glial cells is involved in heterosynaptic depression and provide the first evidence that interacting neuronal and glial networks are essential in hippocampal heterosynaptic depression.
The involvement of a glial network has several important consequences. First, although single glial cell homosynaptic interactions are sufficient for regulatory feedback (Robitaille, 1998; Auld and Robitaille, 2003a; Zhang et al., 2003), a complex glial network seems necessary for heterosynaptic phenomena. Second, ATP released by glial cells appears pluripotent, mediating A1 receptor presynaptic depression and propagation of glial activation (Guthrie et al., 1999; Newman, 2003). Third, a glial network involvement implies an extended spatial regulation of synaptic activity in the form of a “center-surround” effect. A center region of tetanized glutamatergic synapses strongly activates pyramidal neurons and the GABAergic network. The latter transfers neuronal information to the glial network, extending beyond the area of activated synapses and depressing surrounding synapses. This center-surround phenomenon increases the contrast between tetanized pyramidal cell synapses and surrounding depressed synapses. Thus, a glial network role is important in spreading neuronal information beyond synapses activated directly by pyramidal cell–GABAergic network interactions. Other previously described glutamatergic neuron–glia interactions (Porter and McCarthy, 1996; Carmignoto et al., 1998; Zhang et al., 2003) likely underlie the small residual Ca2+ elevations in glial cells in the presence of AP5 and may occur in the center region. Obviously, this center-surround phenomenon is lost during agonist-induced depression.
Roles of glial cells in plasticity
Bidirectional glia–synapse interactions have been described in the CNS (Kang et al., 1998, Araque et al., 1998a, Zhang et al., 2003, Fellin et al., 2004, Pascual et al., 2005) and the PNS (Robitaille, 1998). Interestingly, glial cell vesicular release machinery appears essential for heterosynaptic depression (Pascual et al., 2005). With transgenic mice expressing a dominant-negative soluble N-ethylmaleimide-sensitive factor attachment protein receptor domain in astrocytes to block exocytosis, hippocampal heterosynaptic depression was found to be impaired, suggesting that ATP may be released from astrocytes via vesicular exocytosis during heterosynaptic depression.
Our data represent the first direct evidence that interference with Ca2+ activation of glial cells hampers functional plasticity in neuronal networks. Previous reports of glial cell modulation involved one type of synaptic elements interacting with glial cells (Auld and Robitaille, 2003a), whereas in heterosynaptic depression, three network elements are involved: glutamate synapses activating GABAergic cells; GABA release linking neuronal and glial networks; and glial ATP/adenosine modulating nontetanized synapses.
Perspectives
Heterosynaptic depression may serve two functions: preventing synaptic saturation by reducing efficacy (Lynch et al., 1977) and increasing contrast between activated and nontetanized synapses (Dunwiddie and Lynch, 1978). It may play a role in hippocampal memory functions because of its relationship with LTP and its effect on synaptic efficacy (Pockett and Lippold, 1986). By showing a glial cell involvement in heterosynaptic depression, we uncovered a novel contribution of glial cells in cognitively relevant synaptic plasticity in the CNS. At present, this role is most relevant to short-term plasticity, and its implication in long-term plasticity remains to be elucidated, although it appears distinct from A1 receptor-independent long-term heterosynaptic depression accompanying LTP (Scanziani et al., 1996).
Our data unveil a novel role of glial cells in a particular form of synaptic plasticity; however, the diversity of glial cell functions, their ability to adapt to synaptic activity (Carmignoto, 2000; Auld and Robitaille, 2003a), and their ubiquitous presence around synaptic elements, are suggestive of glial involvement in other types of plasticity. Thus, we propose that synaptic plasticity is not solely the domain of neurons but also involves glial cells in a complex, “integrated system,” with cooperative interactions between neuronal and glial networks.
Footnotes
N. Haddjeri’s present address: Laboratory of Neuropharmacology and Neurochemistry, Faculty of Pharmacy, University of Claude Bernard Lyon I, EA-512, 8 Avenue Rockefeller, 69373 Lyon Cedex 08, France.
This work was supported by a grant from the Natural Sciences and Engineering Research Council to R.R. and J.C.L. A.S. was supported by a fellowship from the Groupe de Recherche sur le Système Nerveux Central of the Fonds de la Recherche en Santé du Québec. N.H. was supported by a postdoctoral fellowship of the Canadian Institutes of Health Research (CIHR). J.-C.L. is the recipient of a Canada Research Chair in Cellular and Molecular Neurophysiology. R.R. is the recipient of a CIHR investigator award. We thank Carola Schipke for stimulating discussions and for comments on previous versions of this manuscript.
References
- Araque A, Parpura V, Sanzgiri RP, Haydon PG (1998a). Glutamate-dependent astrocyte modulation of synaptic transmission between cultured hippocampal neurons. Eur J Neurosci 10:2129–2142. [DOI] [PubMed] [Google Scholar]
- Araque A, Sanzgiri RP, Parpura V, Haydon PG (1998b). Calcium elevation in astrocytes causes an NMDA receptor-dependent increase in the frequency of miniature synaptic currents in cultured hippocampal neurons. J Neurosci 18:6822–6829. [DOI] [PMC free article] [PubMed] [Google Scholar]
- Araque A, Carmignoto G, Haydon PG (2001). Dynamic signaling between astrocytes and neurons. Annu Rev Physiol 63:795–813. [DOI] [PubMed] [Google Scholar]
- Auld DS, Robitaille R (2003a). Glial cells and neurotransmission: an inclusive view of synaptic function. Neuron 40:389–400. [DOI] [PubMed] [Google Scholar]
- Auld DS, Robitaille R (2003b). Perisynaptic Schwann cells at the neuromuscular junction: nerve- and activity-dependent contributions to synaptic efficacy, plasticity, and reinnervation. Neuroscientist 9:144–157. [DOI] [PubMed] [Google Scholar]
- Carmignoto G (2000). Reciprocal communication systems between astrocytes and neurons. Prog Neurobiol 62:561–581. [DOI] [PubMed] [Google Scholar]
- Carmignoto G, Pasti L, Pozzan T (1998). On the role of voltage-dependent calcium channels in calcium signaling of astrocytes in situ. J Neurosci 18:4637–4645. [DOI] [PMC free article] [PubMed] [Google Scholar]
- Connolly GP, Duley JA (2000). Ecto-nucleotidase of cultured rat superior cervical ganglia: dipyridamole is a novel inhibitor. Eur J Pharmacol 397:271–277. [DOI] [PubMed] [Google Scholar]
- Cotrina ML, Lin JH, Alves-Rodrigues A, Liu S, Li J, Azmi-Ghadimi H, Kang J, Naus CC, Nedergaard M (1998). Connexins regulate calcium signaling by controlling ATP release. Proc Natl Acad Sci USA 95:15735–15740. [DOI] [PMC free article] [PubMed] [Google Scholar]
- Cotrina ML, Lin JH, Lopez-Garcia JC, Naus CC, Nedergaard M (2000). ATP-mediated glia signaling. J Neurosci 20:2835–2844. [DOI] [PMC free article] [PubMed] [Google Scholar]
- D’Ambrosio R, Wenzel J, Schwartzkroin PA, McKhann GM II, Janigro D (1998). Functional specialization and topographic segregation of hippocampal astrocytes. J Neurosci 18:4425–4438. [DOI] [PMC free article] [PubMed] [Google Scholar]
- Dani JW, Chernjavsky A, Smith SJ (1992). Neuronal activity triggers calcium waves in hippocampal astrocyte networks. Neuron 8:429–440. [DOI] [PubMed] [Google Scholar]
- Davies CH, Pozza MF, Collingridge GL (1993). CGP 55845A: a potent antagonist of GABAB receptors in the CA1 region of rat hippocampus. Neuropharmacology 32:1071–1073. [DOI] [PubMed] [Google Scholar]
- Dunwiddie T, Lynch G (1978). Long-term potentiation and depression of synaptic responses in the rat hippocampus: localization and frequency dependency. J Physiol (Lond) 276:353–367. [DOI] [PMC free article] [PubMed] [Google Scholar]
- Fellin T, Pascual O, Gobbo S, Pozzan T, Haydon PG, Carmignoto G (2004). Neuronal synchrony mediated by astrocytic glutamate through activation of extrasynaptic NMDA receptors. Neuron 43:729–743. [DOI] [PubMed] [Google Scholar]
- Fraser DD, Mudrick-Donnon LA, MacVicar BA (1994). Astrocytic GABA receptors. Glia 11:83–93. [DOI] [PubMed] [Google Scholar]
- Freund TF, Buzsaki G (1996). Interneurons of the hippocampus. Hippocampus 6:347–470. [DOI] [PubMed] [Google Scholar]
- Gallagher CJ, Salter MW (2003). Differential properties of astrocyte calcium waves mediated by P2Y1 and P2Y2 receptors. J Neurosci 23:6728–6739. [DOI] [PMC free article] [PubMed] [Google Scholar]
- Guthrie PB, Knappenberger J, Segal M, Bennett MV, Charles AC, Kater SB (1999). ATP released from astrocytes mediates glial calcium waves. J Neurosci 19:520–528. [DOI] [PMC free article] [PubMed] [Google Scholar]
- Haydon PG (2001). GLIA: listening and talking to the synapse. Nat Rev Neurosci 2:185–193. [DOI] [PubMed] [Google Scholar]
- Isaacson JS, Solis JM, Nicoll RA (1993). Local and diffuse synaptic actions of GABA in the hippocampus. Neuron 10:165–175. [DOI] [PubMed] [Google Scholar]
- Kang J, Jiang L, Goldman SA, Nedergaard M (1998). Astrocyte-mediated potentiation of inhibitory synaptic transmission. Nat Neurosci 1:683–692. [DOI] [PubMed] [Google Scholar]
- Koizumi S, Fujishita K, Tsuda M, Shigemoto-Mogami Y, Inoue K (2003). Dynamic inhibition of excitatory synaptic transmission by astrocyte-derived ATP in hippocampal cultures. Proc Natl Acad Sci USA 100:11023–11028. [DOI] [PMC free article] [PubMed] [Google Scholar]
- Latour I, Gee CE, Robitaille R, Lacaille J-C (2001). Differential mechanisms of Ca2+ responses in glial cells evoked by exogenous and endogenous glutamate in rat hippocampus. Hippocampus 11:132–145. [DOI] [PubMed] [Google Scholar]
- Lynch GS, Dunwiddie T, Gribkoff V (1977). Heterosynaptic depression: a postsynaptic correlate of long-term potentiation. Nature 266:737–739. [DOI] [PubMed] [Google Scholar]
- Manzoni OJ, Manabe T, Nicoll RA (1994). Release of adenosine by activation of NMDA receptors in the hippocampus. Science 265:2098–2101. [DOI] [PubMed] [Google Scholar]
- Newman EA (2003). Glial cell inhibition of neurons by release of ATP. J Neurosci 23:1659–1666. [DOI] [PMC free article] [PubMed] [Google Scholar]
- Pascual O, Casper KB, Kubera C, Zhang J, Revilla-Sanchez R, Sul JY, Takano H, Moss SJ, McCarthy K, Haydon PG (2005). Astrocytic purinergic signaling coordinates synaptic networks. Science 310:113–116. [DOI] [PubMed] [Google Scholar]
- Pasti L, Volterra A, Pozzan T, Carmignoto G (1997). Intracellular calcium oscillations in astrocytes: a highly plastic, bidirectional form of communication between neurons and astrocytes in situ. J Neurosci 17:7817–7830. [DOI] [PMC free article] [PubMed] [Google Scholar]
- Pasti L, Zonta M, Pozzan T, Vicini S, Carmignoto G (2001). Cytosolic calcium oscillations in astrocytes may regulate exocytotic release of glutamate. J Neurosci 21:477–484. [DOI] [PMC free article] [PubMed] [Google Scholar]
- Pockett S, Lippold OCJ (1986). Long-term potentiation and depression in hippocampal slices. Exp Neurol 91:481–487. [DOI] [PubMed] [Google Scholar]
- Porter JT, McCarthy KD (1995). Adenosine receptors modulate [Ca2+]i in hippocampal astrocytes in situ. J Neurochem 65:1515–1523. [DOI] [PubMed] [Google Scholar]
- Porter JT, McCarthy KD (1996). Hippocampal astrocytes in situ respond to glutamate released from synaptic terminals. J Neurosci 16:5073–5081. [DOI] [PMC free article] [PubMed] [Google Scholar]
- Robitaille R (1998). Modulation of synaptic efficacy and synaptic depression by glial cells at the frog neuromuscular junction. Neuron 21:847–855. [DOI] [PubMed] [Google Scholar]
- Scanziani M, Malenka RC, Nicoll RA (1996). Role of intercellular interactions in heterosynaptic long-term depression. Nature 380:446–450. [DOI] [PubMed] [Google Scholar]
- Schipke CG, Ohlemeyer C, Matyash M, Nolte C, Kettenmann H, Kirchhoff F (2001). Astrocytes of the mouse neocortex express functional N-methyl-d-aspartate receptors. FASEB J 15:1270–1272. [DOI] [PubMed] [Google Scholar]
- Serrano A, Haddjeri N, Lacaille JC, Robitaille R (2003). Involvement of glial cells in heterosynaptic depression at hippocampal Schaffer collateral-pyramidal cell synapses. Soc Neurosci Abstr 29:378.17. [Google Scholar]
- Wallraff A, Odermatt B, Willecke K, Steinhauser C (2004). Distinct types of astroglial cells in the hippocampus differ in gap junction coupling. Glia 48:36–43. [DOI] [PubMed] [Google Scholar]
- Wang Z, Haydon PG, Yeung ES (2000). Direct observation of calcium-independent intercellular ATP signaling in astrocytes. Anal Chem 72:2001–2007. [DOI] [PubMed] [Google Scholar]
- Woodhall G, Gee CE, Robitaille R, Lacaille J-C (1999). Membrane potential and intracellular Ca2+ oscillations activated by mGluRs in hippocampal stratum oriens/alveus interneurons. J Neurophysiol 81:371–382. [DOI] [PubMed] [Google Scholar]
- Zhang J-M, Wang H-K, Ye C-Q, Ge W, Chen Y, Jiang Z-L, Wu C-P, Poo M-M, Duan S (2003). ATP released by astrocytes mediates glutamatergic activity-dependent heterosynaptic suppression. Neuron 40:971–982. [DOI] [PubMed] [Google Scholar]