

Abstract
Dendritic differentiation involves both regressive and growth events. The mechanisms controlling the regressive events are poorly understood. This study is aimed at determining the role of the nuclear receptor retinoid-related orphan receptor α (RORα) in Purkinje cell (PC) dendritic differentiation in organotypic cultures. As observed in vivo, in these cultures, fusiform PCs with embryonic bipolar shape undergo regression before the outgrowth of the ultimate dendritic tree. We show that lentiviral-mediated hRORα1 overexpression in fusiform PCs leads to a cell-autonomous accelerated progression of dendritic differentiation. In addition, RORα is necessary for the PC regressive events: whereas staggerer RORα-deficient PCs remain in the embryonic fusiform stage, replacement of hRORα1 restores normal dendritogenesis. These results demonstrate that RORα expression in fusiform PCs is crucial for the dendritic regression and progression of the following step of extension of dendritic processes. However, it does not seem to participate to the last stage of dendritic growth. This study identifies RORα as a nuclear receptor crucial for the control of dendritic remodeling during development.
Keywords: RORα, Purkinje cells, dendritic regression, differentiation, lentiviral vector, organotypic culture
Introduction
Like most postmitotic neurons, cerebellar Purkinje cells (PCs) have a bipolar shape during their migration. Once they reach their terminal domains, these immature PCs follow a process of dendritic regression, before extending apical dendrites from which the ultimate and characteristic dendritic tree will arise. Dendritic differentiation thus involves both regressive and growth events (Ramón y Cajal, 1911; Armengol and Sotelo, 1991). However, although numerous factors have been implicated in the late phases of dendritic growth (Schilling et al., 1991; Baptista et al., 1994; Mount et al., 1995; Hirai and Launey, 2000; Metzger and Kapfhammer, 2000; Heuer and Mason, 2003; Swinny et al., 2004), to our knowledge, factors involved in the early dendritic differentiation steps, in particular the regressive phase, are unknown.
The retinoid-related orphan receptor α (RORα)-deficient staggerer mutant mouse displays a cerebellar atrophy caused by an early cell-intrinsic death of most of the PCs, along with secondary degeneration of granule cells and inferior olivary neurons (Sotelo and Changeux, 1974; Herrup, 1983; Zanjani et al., 1990; Hamilton et al., 1996; Steinmayr et al., 1998). Interestingly, in the few surviving PCs, the dendritic differentiation is impaired, because these remaining PCs have atrophic dendrites, lacking distal spiny branchlets (Bradley and Berry, 1978; Sotelo, 1978, 1990). PCs in primary mixed cerebellar cultures from homozygous staggerer mutant mice do not progress beyond the early migratory morphology (Shirley and Messer, 2004). Together with the dendritic atrophy, many other immature features remain, such as PC polyinnervation by climbing fibers (Crepel et al., 1980a; Mariani and Changeux, 1980). In addition, expression of many genes has been shown to be altered, such as Pcp-2/L7 (Hamilton et al., 1996), calmodulin (Messer et al., 1990), and sonic hedgehog (Gold et al., 2003). From all of these studies, it was not possible to conclude about the precise role of RORα in the dendritic differentiation process, most likely attributable to the difficulty in studying the differentiation progression in vivo from the early bipolar PCs in the atrophic and disorganized staggerer cerebellum, in which most of the PCs undergo cell death. In the present study, we aimed at determining the involvement of RORα in the progression of dendritic differentiation from the early bipolar PCs, by using both staggerer RORα-deficient PCs and RORα-overexpressing PCs in organotypic cultures.
To address this question, RORα-overexpressing PCs were obtained by infecting mouse cerebellar organotypic cultures with a lentiviral (Lenti)-derived vector encoding hRORα1. PCs in organotypic cultures differentiate with the same sequence as that observed in vivo in the rat. Our results show that RORα controls initial PC dendritic development, particularly the transition phase from the fusiform cell to the PC stellate cell (the regressive stage), and accelerates the following steps of dendritic development. In contrast, RORα does not seem to have a major role in the last phase of PC dendritic growth. Thus, our study identifies for the first time a factor implicated in the early steps of the PC dendritic differentiation and most particularly in the regressive steps.
Materials and Methods
Recombinant lentiviral production, titrations, and transduction efficiency
DNA constructs.
The backbone of the lentiviral construct (pFlap) carries the DNA flap sequence (Zennou et al., 2001) and is deleted for the human immunodeficiency virus-1 (HIV-1) enhancer and promoter sequences in the U3 region of the 3′ long-terminal repeat (Sirven et al., 2001). The human 1.6 kb hRORα1 cDNA fragment was inserted into the pFlapΔU3.PGK-WPRE transfer vector and placed under the control of the phosphoglycerate kinase (PGK) promoter, followed by a 600 bp posttranslational regulatory element WPRE (woodchuck posttranscriptional regulatory element) (Zufferey et al., 1999).
Lentiviral production.
Stocks of lentiviral vector were prepared by transient cotransfection of HEK293T cells with the p8.91 encapsidation plasmid (ΔVprΔVifΔVpuΔNef) (Zufferey et al., 1997), pHCMV-G, and the recombinant gene transferring vector, as described previously (Zennou et al., 2000). Briefly, the supernatants were treated with DNaseI (Roche Products, Welwyn Garden City, UK) before ultracentrifugation and then resuspended in PBS, aliquoted, and stored at −80°C until use. The amount of p24 capsid protein was determined by the HIV-1 p24 ELISA antigen assay (Beckman Coulter, Fullerton, CA). Virus from different virus stock productions averaged 150 ng/μl p24.
The titration of each vector stock was determined by infecting HEK293T cells derived from human embryonic kidney. HEK293T cells were grown at 37°C in DMEM supplemented with 10% heat-inactivated fetal calf serum (Invitrogen, Carlsbad, CA). Cells were plated in 24-well plates, and viral contact was performed for 1 h in a minimal volume (100 μl) in the absence of serum with increasing amounts of each lentiviral suspension, after which fresh complete medium was added. After a 48 or 72 h incubation period, cells were washed with PBS, detached with trypsin, fixed in 4% paraformaldehyde, and analyzed. Titer of the virus production was evaluated by calculating the transducing units (TU) after 48 and 72 h in culture using the TU = fC0V formula, where f is the frequency of green fluorescent protein (GFP)- or RORα-positive cells (as described for slices, see RORα-immunolabeling procedures below), C0 is the total number of target cells, and V is the volume of the viral stock used. Titers from different virus productions averaged 1.7 × 10⁹ TU/ml.
Animals
Animal housing and all procedures were performed in accordance with the guidelines of the French Ministry of Agriculture and the European Community.
The staggerer Rorasg/sg mutant mice were maintained on a C57BL/6J genetic background in our colony. Rorasg/sg and their Rora+/+ littermates were obtained by intercrossing fertile heterozygous Rora+/sg animals and were genotyped by PCR. Genomic DNA was extracted from tail biopsy and amplified in two reactions, one for each allele. The staggerer Rorasg allele primers were as follows: 5′-CGTTTGGCAAACTCCACC-3′ and 5′-GATTGAAAGCTGACTCGTTCC-3′. The Rora+ allele primers were as follows: 5′-TCTCCCTTCTCAGTCCTGACA-3′ and 5′-TATATTCCACCACACGGCAA-3′. The amplified fragments (318 and 450 bp for Rora+ and Rorasg alleles, respectively) were detected by electrophoresis on an agarose gel.
Swiss mice were obtained from Janvier (Le Genest-St-Isle, France).
Slice cultures
Swiss mice at embryonic day 17 (E17), postnatal day 0 (P0), or P7 were used. E0 was the mating day, and P0 was the day of birth. Organotypic cultures of cerebellum were prepared as described previously (Ghoumari et al., 2002). Briefly, after decapitation, brains were dissected out into cold Gey’s balanced salt solution (Sigma, St. Louis, MO) supplemented with 5 mg/ml glucose, and the meninges were removed. Parasagittal cerebellar slices (350 μm thick) were cut on a McIlwain tissue chopper and transferred onto 30 mm Millipore membrane culture inserts with a 0.4 μm pore size (Millicell CM; Millipore, Bedford, MA). The PCs were then infected by adding directly onto the slices the volume of viral stock (Lenti-hRORα1 and Lenti-GFP) corresponding to 1.7 × 10⁶ TU. Slices were maintained in culture in six-well plates containing 1ml/well of medium containing 50% basal medium with Earle’s salts (BME) (Invitrogen), 25% HBSS (Invitrogen), 25% horse serum (Invitrogen), 1 mm l-glutamine, and 5 mg/ml glucose at 37°C in a humidified atmosphere with 5% CO2. The medium was replaced every 2–3 d.
Mice obtained from Rora+/sg intercrosses were also used in this study. In these litters, Rora+/+, Rora+/sg, and Rorasg/sg mice could be generated. In RORα replacement experiments, slices of each cerebellum were divided between two Millicells. For each animal, half of cerebellar slices served as control and were infected with Lenti-GFP and the other half with Lenti-hRORα1 to compare control (Lenti-GFP) versus RORα-overexpressing PCs from the same animals. The genotype was determined a posteriori by PCR on tail biopsy, in blind studies.
Antibodies and staining procedures
Cerebellar slices were fixed in 4% paraformaldehyde in 0.12 m PBS, pH 7.4, for 1 h at room temperature. After washing in PBS, the slices were incubated for 1 h in PBS containing 0.25% Triton X-100, 0.2% gelatin, 0.1% sodium azide (PBSGTA), and 0.1 m lysine. Then rabbit polyclonal anti-28 kDa calbindin calcium-binding protein (CaBP) antibody (1:5000 dilution; Swant, Bellinzona, Switzerland) to visualize PCs and goat polyclonal anti-RORα1 (sc-6062; 1:4000 dilution; Santa Cruz Biotechnology, Santa Cruz, CA) in PBSGTA were applied overnight. At this dilution, in control slices, the intensity of RORα labeling was always weak. Therefore, in Lenti-hRORα1-infected slices, the higher intensity of RORα labeling in RORα-overexpressing PCs could be unambiguously distinguished from the weak intensity of RORα labeling attributable to of endogenous expression. After 2 h incubation with cyanine 3-conjugated donkey anti-rabbit (1:500 dilution; Jackson ImmunoResearch Europe, Soham, Cambridgeshire, UK; Interchim, Montluçon, France) and FITC-conjugated donkey anti-goat (1:2000 dilution; Jackson ImmunoResearch, West Grove, PA), the slices were washed several times in PBS and mounted in mowiol (Calbiochem, La Jolla, CA). The slices were analyzed with an inverted microscope (Eclipse TE 300; Nikon, Tokyo, Japan). Immunofluorescence images were captured at 400× magnification using a Qimaging Retiga 1300 camera (VayTek, Fairfield, IA) and analyzed using Image-Pro Plus 4.1 software (Media Cybernetics, Silver Spring, MD).
Classification of PC differentiation stages
Classification of PCs was assessed after calbindin immunostaining among the transduced PCs (identified by GFP and CaBP expression for Lenti-GFP-infected slices or by the double RORα and CaBP immunolabeling for Lenti-hRORα1-infected slices). Images were taken from all slices, corresponding to at least 100 PCs in each experiment. Quantification was performed on three independent experiments.
With few adaptations, we classified PCs according to the different stages described previously during postnatal rat development (Armengol and Sotelo, 1991). Fusiform PCs with a bipolar shape, reminiscent of embryonic migratory PCs, are defined as stage I (see Fig. 1A). This stage I corresponds to both “simple” and “complex” fusiform stages, observed from E16 to P4 in vivo. Stage II comprised PCs with short processes all around the soma (see Fig. 1B). This “stellate” stage includes both “regressive-atrophic dendrites” and “stellate cell” stages described previously, from P2 to P6 in vivo. PCs with one to three perisomatic protrusions are defined as stage III (see Fig. 1C). They correspond to PCs at approximately P5–P10 in vivo. Finally, PCs with one or more identified dendritic trees (defined as primary dendrites giving rise to additional side branches) are classified as stage IV. Interestingly, dendritic spine-like structures are observed only on PCs in stages III and IV.
Figure 1.

Classification of PC differentiation stages in organotypic cultures. CaBP-immunolabeled PCs from slices cultured at P0 and maintained in culture for 3 d (A), 7 d (B), 10 d (C) or 14 d (D). A, Fusiform PCs with a bipolar shape are defined as stage I. B, PCs with regressive-atrophic dendrites all around the soma are defined as stage II. C, PC with one or more perisomatic protrusions is defined as stage III. D, PC with identified dendritic tree is classified in stage IV. Scale bar, 20 μm.
Quantitative morphological analysis of Purkinje cell dendritic trees
The dendritic morphology of Purkinje cells in stage IV was quantitatively analyzed in cells that had no or little overlap of dendrites with neighboring cells as described previously (Metzger and Kapfhammer, 2000). All quantifications were performed on either Lenti-GFP-transduced PCs (identified by the coexpression of CaBP and GFP for the controls) or on Lenti-hRORα1-transduced PCs for hRORα1-overexpression experiments (identified by the coexpression of RORα and CaBP). Using Image-Pro Plus 4.1 software, two parameters were measured in blind studies from the immunofluorescence images: (1) the dendritic tree area, by connecting the ends of all terminal dendritic tips of a single Purkinje cell, including the soma with straight lines; and (2) the length of the longest dendrite (i.e., distance between the cell body and the most distal dendritic ending). For each experiment, at least 50 PCs from all slices were quantified. Quantification was performed from three independent experiments.
Statistical analysis
Independent experiments were performed with 10–12 cerebellar slices per sample and repeated three times using matched controls. For PC stage quantification, at least 100 PCs were analyzed in each sample. For the quantitative morphological analysis of PC dendritic tree, at least 50 PCs from each slice were quantified from each sample. Results are expressed in figures and in the text as mean ± SD. The statistical significance of differences between PCs transduced with either Lenti-GFP or Lenti-hRORα1 was assessed by a Student’s t test using Statview software (SAS Institute, Cary, NC).
Results
Lentiviral-mediated gene transfer is adapted to the study of PC dendritic development in organotypic culture
At birth, in vivo, most murine PCs are fusiform (bipolar shape; stage I) (data not shown), as described for rats (Armengol and Sotelo, 1991). When cultured at P0, most PCs in organotypic slices were still in stage I after 3 d in vitro (DIV) (P0 plus 3 DIV) (Fig. 1A). They retracted their primitive dendrites (stage II) after 7 DIV (Fig. 1B) and elongated numerous perisomatic protrusions (stage III) after 10 DIV (Fig. 1C). Finally, they developed their ultimate dendritic trees (stage IV) after 14 DIV (Fig. 1D). Thus, in organotypic culture, PC dendritic development undergoes the same pattern of differentiation as that observed in vivo.
To study the role of RORα in PC dendritic development, we used a recombinant nonreplicative lentiviral-derived vector encoding either hRORα1 (Lenti-hRORα1) or GFP (for control, Lenti-GFP) under the control of the PGK promoter to overexpress RORα in PCs in cerebellar organotypic cultures.
A large number of PCs were transduced with both lentiviral vectors. In slices infected with the Lenti-GFP vector, >80% of the calbindin (CaBP)-positive PCs expressed GFP (Fig. 2A–C). The same transduction efficiency was observed with the Lenti-hRORα1 vector (data not shown). Interestingly, the lentiviral vector seems to preferentially transduce PCs, because most of the GFP-expressing or RORα-overexpressing cells were PCs (very few other cellular types were transduced) (Fig. 2D–I). Thus, unlike classical transfection methods, transferring a transgene by the lentiviral vector approach appears to be very efficient in PCs.
Figure 2.

Lentiviral-mediated transduction in organotypic cerebellar cultures. P0 plus 7 DIV cultured cerebellar slices at low (4×) magnification (A–C) or at higher (20×) magnification (D–I) infected with Lenti-GFP (A–F) or with Lenti-hRORα1 (G–I) vectors. A–F, PCs are visualized with PC-specific CaBP immunolabeling in red (A, C and D, F), and Lenti-GFP-transduced PCs are revealed by green GFP expression (B, C and E, F). GFP-expressing PCs appear as yellow cells in merged images (C, F). In C and F, white arrows indicate PCs nontransduced by the Lenti-GFP vector, and open arrows indicate non-PC GFP-expressing cells. G–I, PCs revealed in red (G, I), and RORα-expressing cells are immunolabeled in green (H, I). hRORα1-overexpressing PCs appear as red cells with intense yellow nuclei in the merged image (I). In H, arrowheads indicate Lenti-hRORα1-transduced cells with intense RORα immunolabeling, whereas the double-crossed arrow shows the weak intensity of RORα immunolabeling in a cell with endogenous RORα expression. Scale bars: A–C, 100 μm; D–I, 20 μm.
Using Lenti-GFP, we then analyzed whether lentiviral infection interferes with PC survival and dendritic differentiation. In PCs, transduction with Lenti-GFP was easily detectable by the appearance of GFP fluorescence in CaBP-immunolabeled PCs. No differences in survival (data not shown) or in dendritic differentiation were detected between nontransduced PCs and control Lenti-GFP-transduced PCs (Fig. 2D–F). The lentiviral infection is therefore adapted to the study of dendritic differentiation.
To distinguish PCs with endogenous RORα expression from those with the lentiviral-mediated RORα overexpression in Lenti-hRORα1-infected slices, we revealed RORα using a low antibody concentration (1:4000). At this dilution, the background labeling of endogenous RORα expression (Fig. 2H, double-crossed arrow) could be unambiguously distinguished from the high intensity of RORα-overexpressing PCs (Fig. 2H, arrowheads). RORα immunostaining was always confined to the nucleus, whatever its expression level. Thus, Lenti-hRORα1 is an efficient tool to overexpress RORα in PCs.
hRORα1 overexpression in PCs accelerates dendritic differentiation through stages I to IV
Most PCs from either E17 or P0 slices after 7 DIV displayed regressive-atrophic dendrites and were thus in the stellate stage II (Fig. 3A,D,L,O). In contrast, when RORα was overexpressed by Lenti-hRORα1 transduction, the majority of PCs exhibited dendritic trees stemming from one or more identified primary branches (stage IV) after 7 d in culture in both E17 and P0 slices (Fig. 3B,D,M,O).
Figure 3.

hRORα1 overexpression accelerates dendritic differentiation. Images of PCs in organotypic cultures at E17 plus 7 DIV (A–C), P0 plus 3 DIV PCs (E, F), P0 plus 5 DIV (H–J), and P0 plus 7 DIV PCs (L–N), revealed with CaBP immunolabeling. Slices were infected with either Lenti-GFP (A, E, H, L) or Lenti-hRORα1 (B, C, F, I, J, M, N) vectors. Transduced PCs were identified by GFP expression for Lenti-GFP or by RORα immunolabeling for Lenti-hRORα1 cultures. Note the presence of more mature hRORα1-overexpressing PCs compared with Lenti-GFP-expressing PCs. C, J, N, High-magnification view of dendrites of stage IV PCs at E17 plus 7 DIV, P0 plus 5 DIV, and P0 plus 7 DIV, showing filopodia (arrows) and spine-like structures (arrowheads). D, G, K, O, Quantitative distribution of PCs between stages I to IV (stages are defined in Fig. 1). For all culture times, the PCs undergo an accelerated differentiation when hRORα1 is overexpressed. Scale bars: A, B, E, F, H, I, L, M, 25 μm (magnification, 20×); C, J, N, 5 μm (magnification, 100×).
To determine whether hRORα1-overexpressing PCs undergo the normal differentiation steps, i.e., pass through a regressive phase (stage II) before reaching the stage IV, we analyzed the differentiation stages of P0 PCs at intermediate culture times (after 3 and 5 d in culture). After 3 d in culture (P0 plus 3 DIV), 94.3% of controls PCs were still in stage I (Fig. 3E,G), whereas 58.8% of hRORα1-overexpressing PCs have already reached stage II (Fig. 3F,G). Moreover, hRORα1-overexpressing PCs at P0 plus 5 DIV were mostly in stage III (57.5%) (Fig. 3I,K), when controls PCs have just reached stage II (57.7%) (Fig. 3H,K). Furthermore, we could detect filopodia and dendritic spines (which are characteristics of dendrites in stages III and IV in control PCs) on all stage III and stage IV hRORα1-overexpressing PCs, suggesting a normal differentiation process (Fig. 3C,J,N). From these experiments, we can conclude that hRORα1-overexpressing PCs undergo a normal, but accelerated, progression through stages II and III before reaching stage IV at P0 plus 7 DIV (Fig. 3M,O), whereas control PCs are still in stage II (Fig. 3L,O).
hRORα1 overexpression does not increase late dendritic differentiation
To determine whether RORα is involved in the final dendritic differentiation step, we assessed the effect of hRORα1 overexpression at later stages. Cerebellar slices of P7 mice (stage III at the beginning of the culture) were infected with either Lenti-GFP vector (control) or Lenti-hRORα1 vector (hRORα1-overexpressing PCs). The vast majority of control and hRORα1-overexpressing PCs from P7 slices were in stage IV after 7 d in vitro (Fig. 4A–C). We were therefore in a favorable situation to determine whether RORα plays a role in dendritic growth. We quantified the dendritic arborization as described previously (Metzger and Kapfhammer, 2000) by measuring the length of the longest dendrite (Fig. 4D) and the dendritic tree area (Fig. 4E) of stage IV PCs at P7 plus 7 DIV. The analyzed parameters, the length of the longest dendrite of each PC and the total dendritic area, should provide a clear indication on the effect of the hRORα1 overexpression on dendritic growth in infected cells by comparing them with Lenti-GFP-transduced control PCs.
Figure 4.
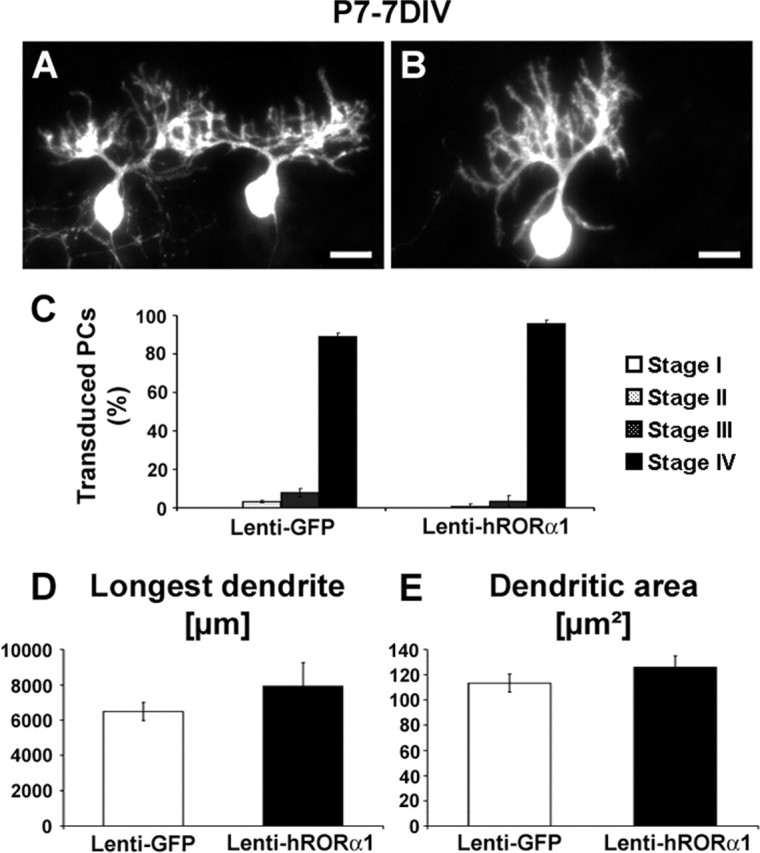
hRORα1 overexpression does not influence late dendritic differentiation. PCs stained by CaBP immunolabeling in organotypic cultures of P7 cerebellar slices kept 7 d in vitro. Transduced PCs were identified by GFP expression for Lenti-GFP-infected slices (A) and by RORα nuclear immunolabeling for Lenti-hRORα1-infected slices (B): these PCs display a similar identified dendritic tree. C, The mean ± SD values of the percentage of PCs in each stage show that both GFP-expressing and hRORα1-overexpressing PCs are almost all in stage IV (stages are defined in Fig. 1). D, E, Quantitative evaluation of the morphological parameters of both GFP-expressing and hRORα1-overexpressing PCs. The longest dendrite (D) and the total dendritic tree area (E) were measured. The mean longest dendrite and the mean dendritic tree area are similar in GFP-expressing PCs and in hRORα1-overexpressing PCs. Data represent mean ± SD of at least 50 transduced PCs investigated in three independent experiments (longest dendrite, p = 0.08; dendritic area, p = 0.12; Student’s t test).
The quantitative evaluation of these parameters at P7 plus 7 DIV, illustrated in the histograms, comprise data obtained from three independent experiments (morphometry of at least 50 single stage IV PCs was assessed in each independent experiment). Control GFP-expressing PCs had a mean longest-dendrite length of 110 ± 7 μm, which is not significantly different (p = 0.08) from hRORα1-overexpressing PCs (126 ± 9 μm). The mean tree areas were also similar (7927 ± 1323 μm2 for hRORα1-overexpressing PCs and 6288 ± 510 μm2 for control PCs; p = 0.12). These results show that hRORα1-overexpressing PCs have a dendritic tree comparable with controls and suggest that RORα does not participate in the late dendritic PC differentiation when overexpressed in PCs that are already in stage III.
RORα-deficient Purkinje cells do not progress beyond the early migratory morphology
From the experiments above, RORα appears to be a crucial factor controlling the early steps of PC differentiation. To test whether the absence of RORα prevents the normal progression of these early steps, we analyzed the differentiation of PCs from staggerer (Rorasg/sg) and corresponding control Rora+/+ cerebellar slices at P0, when PCs are in the early fusiform stage. Similarly to what was described above, we observed that most Rora+/+ PCs in organotypic slices at P0 were in stage II after 7 DIV (Fig. 5A) and in stage IV after 14 DIV (Fig. 5B). In contrast, all PCs from Rorasg/sg cerebellum displayed the embryonic bipolar shape (stage I) after 7 d in culture (Fig. 5D). After 14 d in culture, Rorasg/sg P0 PCs still displayed a bipolar shape (Fig. 5E), with an increased complexity: processes were longer and more branched compared with 7 DIV Rorasg/sg PCs. However, PCs from Rorasg/sg cerebellum in stage II, III, or IV were never observed, whether cultured from E17 or P3 animals (data not shown). Although Rorasg/sg PCs did continue their dendritic extension from stage I, they failed to regress and remodel their shape as wild-type PCs did in organotypic culture. Dendritic spine-like structures began to appear after 14 DIV in wild type (Fig. 5C), although they were absent on dendrites of Rorasg/sg PCs in culture after 14 DIV (Fig. 5F).
Figure 5.
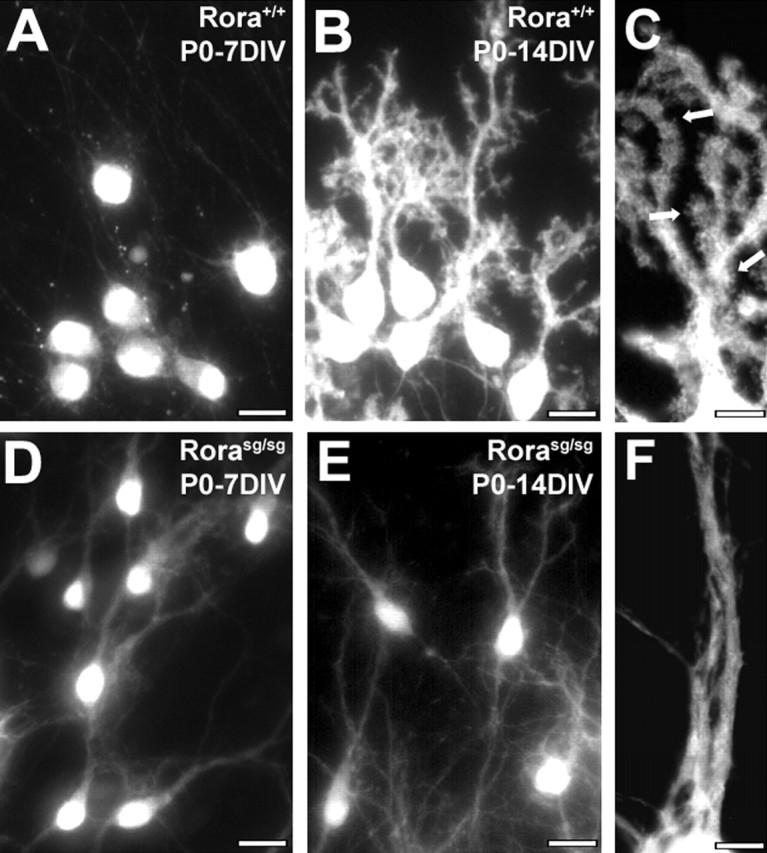
RORα-deficient staggerer PCs fail to regress from their bipolar morphology. PCs in organotypic cultures from wild-type (A–C) or staggerer Rorasg/sg (D–F) P0 mice, revealed by CaBP immunolabeling after 7 DIV (A, D) or 14 DIV (B, C, E, F). Wild-type PCs undergo normal differentiation: they are in stage II (PCs with regressive-atrophic dendrites) after 7 DIV and in stage IV (PCs with identified dendritic tree) after 14 DIV, with the emergence of dendrite spine-like structures (arrows in C). Rorasg/sg PCs remain in the embryonic fusiform shape (stage I) after 7 DIV (D) and 14 DIV (E) and display smooth dendrites devoid of spines (F). Scale bars: A, B, D, E, 20 μm (magnification, 20×); C, F, 5 μm (magnification, 100×).
We conclude that, in organotypic cultures, the absence of RORα impedes dendritic differentiation because RORα-deficient PCs seem to be blocked in the early fusiform stage of PC differentiation and never achieve the PC stellate cell stage.
RORα expression in staggerer Purkinje cells restores the dendritic differentiation progression
As described above, loss of function of RORα in Rorasg/sg PCs in culture leads to an arrest of the differentiation process in stage I (Fig. 5). To understand whether the Rorasg/sg PC dendritic phenotype is a direct consequence of the absence of RORα, we restored RORα expression in Rorasg/sg PCs by infecting them with Lenti-hRORα1.
In Rorasg/sg slices, the occurrence of efficiently transduced PCs is unambiguously revealed with the RORα immunolabeling (Fig. 6C). In addition, because no RORα labeling was detected in nontransduced explants taken from Rorasg/sg cerebellum (data not shown), we can confirm the specificity of the anti-RORα antibody used in this study.
Figure 6.

hRORα1 replacement in staggerer PCs restores a normal dendritic differentiation. Organotypic cultures from Rorasg/sg (A–E) or wild-type (F–J) P0 mice after 7 DIV, infected either with Lenti-GFP (A, B, F, G) or with Lenti-hRORα1 (C–E, H–J). PCs are visualized with CaBP immunolabeling in red (B, D, G, I), whereas Lenti-GFP-transduced PCs are revealed by the green GFP expression (A, F), and hRORα1-overexpressing PCs are identified by the high intensity of the RORα immunolabeling in green (arrows in C, H) compared with the low intensity in nontransduced PCs with the endogenous RORα expression level (double-crossed arrow in H). Control Rorasg/sg PCs remain fusiform (A, B), whereas hRORα1-overexpressing PCs present elaborate dendritic trees (C, D). Similar to Figure 3, control PCs with endogenous RORα expression present a stellate form (F, G, and double-crossed arrow in H, I), whereas hRORα1-overexpressing wild-type PCs have identified dendritic trees (arrow in H, I). Both hRORα1-overexpressing Rora+/+ and Rorasg/sg PCs develop spine-like structures (arrowheads in E, J). Scale bars: A–D, F–I, 20 μm (magnification, 20×); E, J, 5 μm (magnification, 100×).
When cultured and infected at P0 with the Lenti-GFP vector and kept 7 DIV (P0 plus 7 DIV), control GFP-expressing PCs in organotypic cultures of Rorasg/sg cerebellum were in stage I (Fig. 6A,B), like Rorasg/sg nontransduced PCs (Fig. 5D), and control GFP-expressing Rora+/+ PCs were in stage II (Fig. 6F,G), confirming the absence of effect of Lenti-GFP transduction on PC differentiation. In contrast, when RORα was expressed by Lenti-hRORα1 transduction in Rorasg/sg PCs, most PCs displayed perisomatic protrusions (stage III) or dendritic trees stemming from one or more identified primary branches (stage IV) (Fig. 6C,D). Interestingly, in P0 plus 7 DIV hRORα1-overexpressing cultures taken from wild-type or homozygous staggerer cerebella, all stage III and IV PCs displayed dendritic spine-like structures (Fig. 6E,J). This feature is similar to that observed after 14 DIV in wild-type cultures, which express endogenous Rora (Fig. 5C). Therefore, hRORα1 overexpression in Rorasg/sg PCs is sufficient to restore the regressive step and to induce a strong dendritic differentiation and normal spinogenesis.
Moreover, we observed that hRORα1 overexpression in a given PC does not influence neighboring PCs. Indeed, hRORα1-overexpression in PCs did not lead to an accelerated dendritogenesis of adjacent nontransduced PCs (Fig. 6H,I), indicating that the effect of RORα in the early dendritic differentiation does not require secreted factors.
In conclusion, our results show that hRORα1 overexpression in both wild-type and Rorasg/sg PCs leads to a cell-autonomous acceleration of the transition from bipolar form (stage I) to stellate cell stage (stage II), which then ensures an appropriate progression of the subsequent dendritic development.
Discussion
Using cerebellar organotypic cultures, we have shown that PCs recapitulate all of the dendritic differentiation steps observed in vivo (Armengol and Sotelo, 1991), in accordance with previous studies (Hendelman and Aggerwal, 1980). PC dendrites differentiate from a fusiform shape to a regressive form before undergoing their final phase of dendritic differentiation.
In this study, we demonstrate that P0 hRORα1-overexpressing PCs cultured 7 DIV (P0 plus 7 DIV) undergo their dendritogenic program more rapidly than control cells. In contrast, P7 hRORα1-overexpressing PCs after 7 DIV exhibit neither significant qualitative nor quantitative differences in the studied morphological parameters when compared with GFP-expressing PCs. Moreover, we establish that, in organotypic cultures, RORα is required for the dendritic differentiation process from bipolar fusiform PCs (stage I) to stellate stage PCs (stage II). This is in agreement with what has been shown previously by Shirley and Messer (2004) in dissociated PC cultures from Rorasg/sg cerebella. The arrest of the normal differentiation process is unlikely to be attributable to the poor health of Rorasg/sg PCs because, in organotypic cultures, Rorasg/sg PCs survive better than in vivo (our unpublished results) and continue to elongate their processes (Fig. 5D,F). Although Rorasg/sg PCs are blocked in stage I, RORα replacement enabled them to regress their processes to differentiate into stage II and to pursue the formation of their ultimate dendritic trees. Together, these results position RORα as an important transcription factor in the control of dendritic remodeling during the first steps of dendritic differentiation.
PCs in organotypic cultures are well known to be resistant to classical transfection methods, and nonviral vectors such as the gene gun are not efficient enough to allow the transfection of a high proportion of PCs in slices (Lo et al., 1994; Wellmann et al., 1999; Murphy and Messer, 2001; Ghoumari et al., 2002). In contrast, lentiviral vectors are capable of transducing cells that are dividing, growth arrested, or postmitotic (Poeschla et al., 1998) and have been shown previously to efficiently transduce Purkinje cells in vivo (Alisky et al., 2000). In organotypic cultures, we demonstrate that HIV-derived lentiviral vectors transduce PCs with a very high efficiency and that the lentiviral infection itself does not affect PC survival or differentiation. Our results suggest that the use of recombinant lentiviral vectors is a powerful approach to perform gene transfer into PCs to study genetic regulation.
When homozygous, the murine staggerer mutation in the Rora gene leads to cerebellar atrophy attributable to the degeneration of most of the PCs (Sidman et al., 1962; Sotelo and Changeux, 1974; Herrup, 1983; Vogel et al., 2000; Doulazmi et al., 2001). Furthermore, several histological studies of the Rorasg/sg cerebellum show that the remaining PCs are immature and display atrophic dendrites, devoid of spines (Bradley and Berry, 1978; Sotelo, 1978, 1990), which suggests that RORα is involved in the PC differentiation process. However, in which steps of differentiation RORα acts remained unknown.
According to our results, RORα does not appear to play a major role in the last phase of PC dendritic differentiation, because we did not detect an increase in the size of the dendritic tree of PCs in organotypic cultures when hRORα1 is overexpressed in PCs that have already developed dendritic protrusions (stage III PCs). However, when RORα is overexpressed as soon as P0, the late dendritic differentiation seems to be also accelerated. These data suggest that RORα more likely plays a critical role in the earliest transitional stage from immature bipolar form to the stellate cell stage, and that this transition seems to be crucial for the progression of late dendritic development.
The vast majority of the studies on PC dendritic differentiation in organotypic cultures have focused on its last step, i.e., the dendritic growth occurring after the regression of the immature shape. Once PCs display a dendritic tree and have reached stage IV, it has been shown that dendritic growth is controlled by exogenous factors, such as electrical activity (Schilling et al., 1991) and trophic factors (Mount et al., 1995; Hirai and Launey, 2000; Swinny et al., 2004), or by PKC activity (Metzger and Kapfhammer, 2000). Hormones, such as estrogens (Shikimi et al., 2004), CRF (Swinny et al., 2004), or thyroid hormones (Heuer and Mason, 2003), also control dendritic growth. The development of mature dendrites and the dendritic monoplanar disposition depends therefore mainly on exogenous factors, partly provided by the granule cells. That granule cell synaptic inputs are essential for the PC dendritic differentiation has also been demonstrated by analyzing PCs in agranular cerebellum, such as in weaver and reeler mice and in X-irradiated rat cerebellum (Mariani et al., 1977; Sotelo, 1978; Crepel et al., 1980b; Mariani and Changeux, 1980). In these cerebella, PCs display dendritic abnormalities, although dendrites are nevertheless studded with numerous spines.
In contrast, in this study, we identify RORα as a crucial factor controlling the regressive and remodeling step of dendritogenesis, a step that should not necessarily require cell–cell interactions. Previous studies (Sotelo, 1978; Baptista et al., 1994) have suggested that the first two stages of PC development are not dependent on cell–cell interactions. These authors thus proposed that the formation of early primitive dendritic processes, their withdrawal, and subsequent extension of perisomatic processes occur autonomously. Interestingly, unlike other nuclear receptors whose activity depends on binding of an exogenous ligand, RORα is activated by abundant intracellular cholesterol (Kallen et al., 2002) and does not seem to need any exogenous factor to be activated (Atkins et al., 1999). Importantly, we also show that lentiviral-mediated hRORα1 expression in Rorasg/sg PCs enables them to pass through the PC stellate cell stage and thus restores a normal differentiation progression.
Our results obtained from organotypic cultures suggest that, in vivo, Rorasg/sg PCs are unable to reach the stellate cell stage; they are arrested at the stage I but develop many processes that could form the immature and atrophic dendritic tree observed in the adult Rorasg/sg cerebellum. In no case did Rorasg/sg PCs develop tertiary dendritic spines. This is in agreement with what has been shown previously in vivo (Bradley and Berry, 1978; Sotelo, 1978, 1990).
Thus, RORα seems to participate mainly in dendrite regression and remodeling (when PCs shorten their embryonic process to allow the emergence of an elaborated dendritic tree, with dendritic spines) rather than in dendritic growth. Regressive events that refine exuberant or inaccurate dendritic connections are critical in neuronal development and have been studied in insects. In insects, dendritic remodeling seems to be regulated by the steroid hormone 20-hydroxyecdysone (referred as ecdysone) in Manduca sexta or in Drosophila melanogaster (Weeks, 2003). Interestingly, ecdysone induces expression of the Caenorhabditis elegans CHR3 (Kostrouch et al., 1995), Drosophila DHR3 (Koelle et al., 1992), and Manduca sexta MHR3 (Palli et al., 1992) genes, which are homologs of the mammalian Rora gene. RORα plays a role in the regressive and remodeling events of the normal dendritic differentiation of PCs, events that are comparable with those induced by the ecdysone pathway in insects. Ecdysone could thus control dendritic remodeling through the activation of the RORα homologs in insects. Thyroid hormone [l-3,3′,5-triiodothyronine hormone (TH)] is considered to be a functional equivalent of ecdysone in vertebrates. TH is important during embryonic and neonatal development of the CNS, including PC differentiation, and has been shown to regulate microtubule assembly and neuronal differentiation (for review, see Nunez et al., 1991; Oppenheimer and Schwartz, 1997), by controlling accumulation of microtubule-associated protein (MAP) such as MAP2 (Silva and Rudas, 1990; Haas et al., 2004). Evidence for cross-talk between RORα and thyroid receptor pathways have been provided (Hamilton et al., 1996; Koibuchi and Chin, 1998; Kuno-Murata et al., 2000), suggesting that RORα and TH could act on the PC differentiation by similar pathways.
Modifications in the dendritic architecture occur during CNS development but also in the mature nervous system to refine the function of neural circuits (Bottjer and Arnold, 1997; Cameron and Nunez-Abades, 2000; Cline, 2001). Interestingly, during aging, RORα seems to control the maintenance of the elaborated dendritic tree because PC dendrites become atrophic in the cerebellum of aging heterozygous staggerer mice (Hadj-Sahraoui et al., 2001). RORα thus appears to be a critical factor implicated in dendrite remodeling in PCs both during development and in the adult.
In conclusion, our study provides new insights into the genetic mechanisms that govern the control of the dendritic regression and identifies the transcription factor RORα as a crucial nuclear factor controlling dendritic remodeling during development.
Footnotes
This research was supported by grants from Fondation pour la Recherche Médicale (F.B.), Fondation Lejeune (F.B.), and Le Groupement d’Intérêt Scientifique Institut de la Longévité (J.M.). We are grateful to Dr. Constantino Sotelo for helpful discussions and critical review of this manuscript and Dr. Ann Lohof for her critical reading of this manuscript. We thank Rosine Wehrlé for her technical help and also Drs. Bernard Brugg and Yolande Lemaigre-Dubreuil for their support.
References
- Alisky JM, Hughes SM, Sauter SL, Jolly D, Dubensky TW Jr, Staber PD, Chiorini JA, Davidson BL (2000). Transduction of murine cerebellar neurons with recombinant FIV and AAV5 vectors. NeuroReport 11:2669–2673. [DOI] [PubMed] [Google Scholar]
- Armengol JA, Sotelo C (1991). Early dendritic development of Purkinje cells in the rat cerebellum. A light and electron microscopic study using axonal tracing in “in vitro” slices. Brain Res Dev Brain Res 64:95–114. [DOI] [PubMed] [Google Scholar]
- Atkins GB, Hu X, Guenther MG, Rachez C, Freedman LP, Lazar MA (1999). Coactivators for the orphan nuclear receptor RORalpha. Mol Endocrinol 13:1550–1557. [DOI] [PubMed] [Google Scholar]
- Baptista CA, Hatten ME, Blazeski R, Mason CA (1994). Cell-cell interactions influence survival and differentiation of purified Purkinje cells in vitro. Neuron 12:243–260. [DOI] [PubMed] [Google Scholar]
- Bottjer SW, Arnold AP (1997). Developmental plasticity in neural circuits for a learned behavior. Annu Rev Neurosci 20:459–481. [DOI] [PubMed] [Google Scholar]
- Bradley P, Berry M (1978). The Purkinje cell dendritic tree in mutant mouse cerebellum. A quantitative Golgi study of Weaver and Staggerer mice. Brain Res 142:135–141. [DOI] [PubMed] [Google Scholar]
- Cameron WE, Nunez-Abades PA (2000). Physiological changes accompanying anatomical remodeling of mammalian motoneurons during postnatal development. Brain Res Bull 53:523–527. [DOI] [PubMed] [Google Scholar]
- Cline HT (2001). Dendritic arbor development and synaptogenesis. Curr Opin Neurobiol 11:118–126. [DOI] [PubMed] [Google Scholar]
- Crepel F, Delhaye-Bouchaud N, Guastavino JM, Sampaio I (1980a). Multiple innervation of cerebellar Purkinje cells by climbing fibres in staggerer mutant mouse. Nature 283:483–484. [DOI] [PubMed] [Google Scholar]
- Crepel F, Delhaye-Bouchaud N, Dupont JL, Sotelo C (1980b). Dendritic and axonic fields of Purkinje cells in developing and x-irradiated rat cerebellum. A comparative study using intracellular staining with horseradish peroxidase. Neuroscience 5:333–347. [DOI] [PubMed] [Google Scholar]
- Doulazmi M, Frederic F, Capone F, Becker-Andre M, Delhaye-Bouchaud N, Mariani J (2001). A comparative study of Purkinje cells in two RORalpha gene mutant mice: staggerer and RORalpha(−/−). Brain Res Dev Brain Res 127:165–174. [DOI] [PubMed] [Google Scholar]
- Ghoumari AM, Wehrle R, De Zeeuw CI, Sotelo C, Dusart I (2002). Inhibition of protein kinase C prevents Purkinje cell death but does not affect axonal regeneration. J Neurosci 22:3531–3542. [DOI] [PMC free article] [PubMed] [Google Scholar]
- Gold DA, Baek SH, Schork NJ, Rose DW, Larsen DD, Sachs BD, Rosenfeld MG, Hamilton BA (2003). RORalpha coordinates reciprocal signaling in cerebellar development through Sonic hedgehog and calcium-dependent pathways. Neuron 40:1119–1131. [DOI] [PMC free article] [PubMed] [Google Scholar]
- Haas MJ, Mreyoud A, Fishman M, Mooradian AD (2004). Microarray analysis of thyroid hormone-induced changes in mRNA expression in the adult rat brain. Neurosci Lett 365:14–18. [DOI] [PubMed] [Google Scholar]
- Hadj-Sahraoui N, Frederic F, Zanjani H, Delhaye-Bouchaud N, Herrup K, Mariani J (2001). Progressive atrophy of cerebellar Purkinje cell dendrites during aging of the heterozygous staggerer mouse (Rora(+/sg)). Brain Res Dev Brain Res 126:201–209. [DOI] [PubMed] [Google Scholar]
- Hamilton BA, Frankel WN, Kerrebrock AW, Hawkins TL, FitzHugh W, Kusumi K, Russell LB, Mueller KL, van Berkel V, Birren BW, Kruglyak L, Lander ES (1996). Disruption of the nuclear hormone receptor RORalpha in staggerer mice. Nature 379:736–739. [DOI] [PubMed] [Google Scholar]
- Hendelman WJ, Aggerwal AS (1980). The Purkinje neuron. I. A Golgi study of its development in the mouse and in culture. J Comp Neurol 193:1063–1079. [DOI] [PubMed] [Google Scholar]
- Herrup K (1983). Role of staggerer gene in determining cell number in cerebellar cortex. I. Granule cell death is an indirect consequence of staggerer gene action. Brain Res 313:267–274. [DOI] [PubMed] [Google Scholar]
- Heuer H, Mason CA (2003). Thyroid hormone induces cerebellar Purkinje cell dendritic development via the thyroid hormone receptor alpha1. J Neurosci 23:10604–10612. [DOI] [PMC free article] [PubMed] [Google Scholar]
- Hirai H, Launey T (2000). The regulatory connection between the activity of granule cell NMDA receptors and dendritic differentiation of cerebellar Purkinje cells. J Neurosci 20:5217–5224. [DOI] [PMC free article] [PubMed] [Google Scholar]
- Kallen JA, Schlaeppi JM, Bitsch F, Geisse S, Geiser M, Delhon I, Fournier B (2002). X-Ray Structure of the hRORalpha LBD at 1.63 A: structural and functional data that cholesterol or a cholesterol derivative is the natural ligand of RORalpha. Structure 10:1697–1707. [DOI] [PubMed] [Google Scholar]
- Koelle MR, Segraves WA, Hogness DS (1992). DHR3: a Drosophila steroid receptor homolog. Proc Natl Acad Sci USA 89:6167–6171. [DOI] [PMC free article] [PubMed] [Google Scholar]
- Koibuchi N, Chin WW (1998). ROR alpha gene expression in the perinatal rat cerebellum: ontogeny and thyroid hormone regulation. Endocrinology 139:2335–2341. [DOI] [PubMed] [Google Scholar]
- Kostrouch Z, Kostrouchova M, Rall JE (1995). Steroid/thyroid hormone receptor genes in Caenorhabditis elegans. Proc Natl Acad Sci USA 92:156–159. [DOI] [PMC free article] [PubMed] [Google Scholar]
- Kuno-Murata M, Koibuchi N, Fukuda H, Murata M, Chin WW (2000). Augmentation of thyroid hormone receptor-mediated transcription by Ca2+/calmodulin-dependent protein kinase type IV. Endocrinology 141:2275–2278. [DOI] [PubMed] [Google Scholar]
- Lo DC, McAllister AK, Katz LC (1994). Neuronal transfection in brain slices using particle-mediated gene transfer. Neuron 13:1263–1268. [DOI] [PubMed] [Google Scholar]
- Mariani J, Changeux JP (1980). Multiple innervation of Purkinje cells by climbing fibers in the cerebellum of the adult staggerer mutant mouse. J Neurobiol 11:41–50. [DOI] [PubMed] [Google Scholar]
- Mariani J, Crepel F, Mikoshiba K, Changeux JP, Sotelo C (1977). Anatomical, physiological and biochemical studies of the cerebellum from Reeler mutant mouse. Philos Trans R Soc Lond B Biol Sci 281:1–28. [DOI] [PubMed] [Google Scholar]
- Messer A, Plummer-Siegard J, Eisenberg B (1990). Staggerer mutant mouse Purkinje cells do not contain detectable calmodulin mRNA. J Neurochem 55:293–302. [DOI] [PubMed] [Google Scholar]
- Metzger F, Kapfhammer JP (2000). Protein kinase C activity modulates dendritic differentiation of rat Purkinje cells in cerebellar slice cultures. Eur J Neurosci 12:1993–2005. [DOI] [PubMed] [Google Scholar]
- Mount HT, Dean DO, Alberch J, Dreyfus CF, Black IB (1995). Glial cell line-derived neurotrophic factor promotes the survival and morphologic differentiation of Purkinje cells. Proc Natl Acad Sci USA 92:9092–9096. [DOI] [PMC free article] [PubMed] [Google Scholar]
- Murphy RC, Messer A (2001). Gene transfer methods for CNS organotypic cultures: a comparison of three nonviral methods. Mol Ther 3:113–121. [DOI] [PubMed] [Google Scholar]
- Nunez J, Couchie D, Aniello F, Bridoux AM (1991). Regulation by thyroid hormone of microtubule assembly and neuronal differentiation. Neurochem Res 16:975–982. [DOI] [PubMed] [Google Scholar]
- Oppenheimer JH, Schwartz HL (1997). Molecular basis of thyroid hormone-dependent brain development. Endocr Rev 18:462–475. [DOI] [PubMed] [Google Scholar]
- Palli SR, Hiruma K, Riddiford LM (1992). An ecdysteroid-inducible Manduca gene similar to the Drosophila DHR3 gene, a member of the steroid hormone receptor superfamily. Dev Biol 150:306–318. [DOI] [PubMed] [Google Scholar]
- Poeschla EM, Wong-Staal F, Looney DJ (1998). Efficient transduction of nondividing human cells by feline immunodeficiency virus lentiviral vectors. Nat Med 4:354–357. [DOI] [PubMed] [Google Scholar]
- Ramón y Cajal S (1911). In: Histologie du Système Nerveux de l’Homme et des Vertébrés Paris: Maloine Edition.
- Schilling K, Dickinson MH, Connor JA, Morgan JI (1991). Electrical activity in cerebellar cultures determines Purkinje cell dendritic growth patterns. Neuron 7:891–902. [DOI] [PubMed] [Google Scholar]
- Shikimi H, Sakamoto H, Mezaki Y, Ukena K, Tsutsui K (2004). Dendritic growth in response to environmental estrogens in the developing Purkinje cell in rats. Neurosci Lett 364:114–118. [DOI] [PubMed] [Google Scholar]
- Shirley LT, Messer A (2004). Early postnatal Purkinje cells from staggerer mice undergo aberrant development in vitro with characteristic morphologic and gene expression abnormalities. Brain Res Dev Brain Res 152:153–157. [DOI] [PubMed] [Google Scholar]
- Sidman RL, Lane PV, Dickie MM (1962). staggerer, a new mutation in the mouse affecting the cerebellum. Science 136:610–612. [DOI] [PubMed] [Google Scholar]
- Silva JE, Rudas P (1990). Effects of congenital hypothyroidism on microtubule-associated protein-2 expression in the cerebellum of the rat. Endocrinology 126:1276–1282. [DOI] [PubMed] [Google Scholar]
- Sirven A, Ravet E, Charneau P, Zennou V, Coulombel L, Guetard D, Pflumio F, Dubart-Kupperschmitt A (2001). Enhanced transgene expression in cord blood CD34(+)-derived hematopoietic cells, including developing T cells and NOD/SCID mouse repopulating cells, following transduction with modified trip lentiviral vectors. Mol Ther 3:438–448. [DOI] [PubMed] [Google Scholar]
- Sotelo C (1978). Purkinje cell ontogeny: formation and maintenance of spines. Prog Brain Res 48:149–170. [DOI] [PubMed] [Google Scholar]
- Sotelo C (1990). Cerebellar synaptogenesis: what we can learn from mutant mice. J Exp Biol 153:225–249. [DOI] [PubMed] [Google Scholar]
- Sotelo C, Changeux JP (1974). Transsynaptic degeneration “en cascade” in the cerebellar cortex of staggerer mutant mice. Brain Res 67:519–526. [DOI] [PubMed] [Google Scholar]
- Steinmayr M, Andre E, Conquet F, Rondi-Reig L, Delhaye-Bouchaud N, Auclair N, Daniel H, Crepel F, Mariani J, Sotelo C, Becker-Andre M (1998). staggerer phenotype in retinoid-related orphan receptor alpha-deficient mice. Proc Natl Acad Sci USA 95:3960–3965. [DOI] [PMC free article] [PubMed] [Google Scholar]
- Swinny JD, Metzger F, Gounko NV, Gramsbergen A, van der Want JJ (2004). Corticotropin-releasing factor and urocortin differentially modulate rat Purkinje cell dendritic outgrowth and differentiation in vitro. Eur J Neurosci 19:1749–1758. [DOI] [PubMed] [Google Scholar]
- Vogel MW, Sinclair M, Qiu D, Fan H (2000). Purkinje cell fate in staggerer mutants: agenesis versus cell death. J Neurobiol 42:323–337. [DOI] [PubMed] [Google Scholar]
- Weeks JC (2003). Thinking globally, acting locally: steroid hormone regulation of the dendritic architecture, synaptic connectivity and death of an individual neuron. Prog Neurobiol 70:421–442. [DOI] [PubMed] [Google Scholar]
- Wellmann H, Kaltschmidt B, Kaltschmidt C (1999). Optimized protocol for biolistic transfection of brain slices and dissociated cultured neurons with a hand-held gene gun. J Neurosci Methods 92:55–64. [DOI] [PubMed] [Google Scholar]
- Zanjani HS, Mariani J, Herrup K (1990). Cell loss in the inferior olive of the staggerer mutant mouse is an indirect effect of the gene. J Neurogenet 6:229–241. [DOI] [PubMed] [Google Scholar]
- Zennou V, Petit C, Guetard D, Nerhbass U, Montagnier L, Charneau P (2000). HIV-1 genome nuclear import is mediated by a central DNA flap. Cell 101:173–185. [DOI] [PubMed] [Google Scholar]
- Zennou V, Serguera C, Sarkis C, Colin P, Perret E, Mallet J, Charneau P (2001). The HIV-1 DNA flap stimulates HIV vector-mediated cell transduction in the brain. Nat Biotechnol 19:446–450. [DOI] [PubMed] [Google Scholar]
- Zufferey R, Nagy D, Mandel RJ, Naldini L, Trono D (1997). Multiply attenuated lentiviral vector achieves efficient gene delivery in vivo. Nat Biotechnol 15:871–875. [DOI] [PubMed] [Google Scholar]
- Zufferey R, Donello JE, Trono D, Hope TJ (1999). Woodchuck hepatitis virus posttranscriptional regulatory element enhances expression of transgenes delivered by retroviral vectors. J Virol 73:2886–2892. [DOI] [PMC free article] [PubMed] [Google Scholar]