Abstract
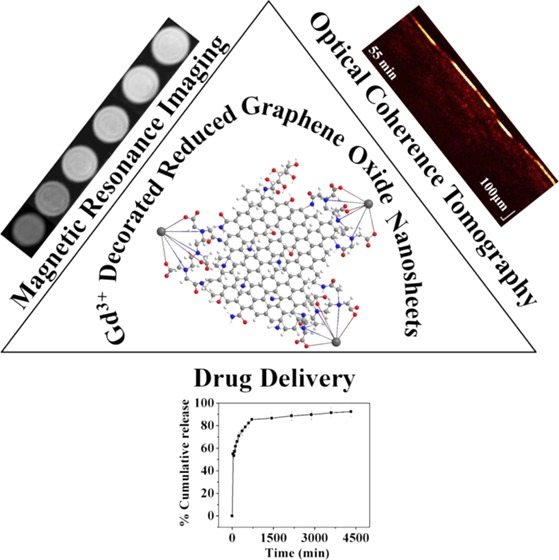
Engineering of water-dispersible Gd3+ ions-decorated reduced graphene oxide (Gd-rGO) nanosheets (NSs) has been performed. The multifunctional capability of the sample was studied as a novel contrast agent for swept source optical coherence tomography and magnetic resonance imaging, and also as an efficient drug-delivery nanovehicle. The synthesized samples were fabricated in a chemically stable condition, and efforts have been put toward improving its biocompatibility by functionalizing with carbohydrates molecules. Gd incorporation in rGO matrix enhanced the fluorouracil (5-FU) drug loading capacity by 34%. The release of the drug was ∼92% within 72 h. Gd-rGO nanosheets showed significant contrast in comparison to optically responsive bare GO for swept source optical coherence tomography. The longitudinal relaxivity rate (r1) of 16.85 mM–1 s–1 for Gd-rGO was recorded, which was 4 times larger than that of the commercially used clinical contrast agent Magnevist (4 mM–1 s–1) at a magnetic field strength of 1.5 T.
1. Introduction
Advanced nanomedicine demands designing of nanomaterials having multimodal functionality involving imaging, detection, and therapeutics.1−3 The pursuit for enhancing nanomaterials’ performances requires tailoring and designing of parameters such as size, morphology, active surface chemistry, composition, etc.4 of the material for multifunctionality.5,6 Engineering could be of single or combination of multicomponent materials enhancing superiority in performances.7,8 The examples include lowering of required drug dosage,9 cutoff in the cost for using multiple techniques, surgical risks,10 damage to normal tissues,11 enhanced blood retention time with tissue or membrane permeation,12 larger imaging contrast density,7 specific and targeted delivery of drugs,13 etc. Nanomaterials of different types, such as fluorescent dyes,14 quantum dots,14 carbon nanotubes,15 and gold nanoparticles,16 have been explored for fluorescence, optical, electrical, and photothermal responses. Gadolinium ion (Gd3+), from lanthanide family, is well known for clinical applications due to its unique physical and chemical properties.17 Being paramagnetic in nature, it is used as a contrast agent for magnetic resonance imaging (MRI).18 Gd–chelator complexes in the form of Gd-DTPA (Magnevist) and Gd-DOTA (Dotarem) are commercially available as T1 contrast agent. On the contrary, Gd–chelator complexes face severe drawbacks due to leaching of Gd3+ ions from complexes, which get accumulated in the body and cannot be metabolized, leading to various detrimental effects to human.19 The toxicity induced by Gd3+ ions can cause nephrogenic system fibrosis in patients with renal dysfunction and also inhibit calcium channels.20 In some of the recent reports, engineered Gd3+ ions with nanocarriers have been proved to be effective in rescinding leaching while enhancing T1-shortening capacity.21 However, much work is still in need for obtaining multiple objectives as single modality cannot fulfill all of the requirements of theranostics. Several works have been already carried out using nanographene oxides, graphene quantum dots, and reduced graphene oxide with combined effect of fluorescence bioimaging, photodynamic therapy, photothermal therapy, and cancer therapy.22−24
Therefore, engineering of Gd3+ ions decorated on two-dimensional structures, which could give large optically responsive surface area well distributed with magnetically responsive nanoparticles, could be of interest. The present manuscript reports the engineering of Gd3+ ions decorated on planar graphene oxide matrix chelated by diethylenetriaminepentaacetic acid (DTPA). The designed material has been tested as a multimodal bioimaging contrast agent for optical coherence tomography (OCT) and magnetic resonance imaging (MRI) along with drug-delivery efficiency.
2. Materials and Method
2.1. Materials
Fine graphite powder (CDH), concentrated sulfuric acid (E Merck), sodium chloride (E Merck), potassium permanganate (E Merck), ∼30% hydrogen peroxide (E Merck), concentrated hydrochloric acid (37%) (Merck), and distilled water (Millipore), ammonia solution (∼25%, S. D. Fine Chemicals Ltd.), gadolinium(III) nitrate hexahydrate (≥99.9%), d-gluconic acid (49–53 wt % in H2O), ethyl(dimethylaminopropyl)carbodiimide (EDC) (>97%), N-hydroxylsuccinimide (NHS) (98%), diethylenetriaminepentaacetic acid (DTPA), and dialysis membrane (Sigma) were used. 2-(N-Morpholino)ethanesulfonic acid (MES) was purchased from Molychem. Dimethylformamide (DMF) was purchased from Rankem Ltd.
2.2. Preparation and Characterization of Gd3+-Decorated Reduced Graphene Oxide Matrix
GO was prepared from pure and ultrafine graphite powder employing modified Hummers’ method. Graphite powder (2.5 g) and sodium chloride (50 g) were thoroughly mixed, followed by slow addition of precooled sulfuric acid (50 mL) after placing the resultant mixture in an ice bath.
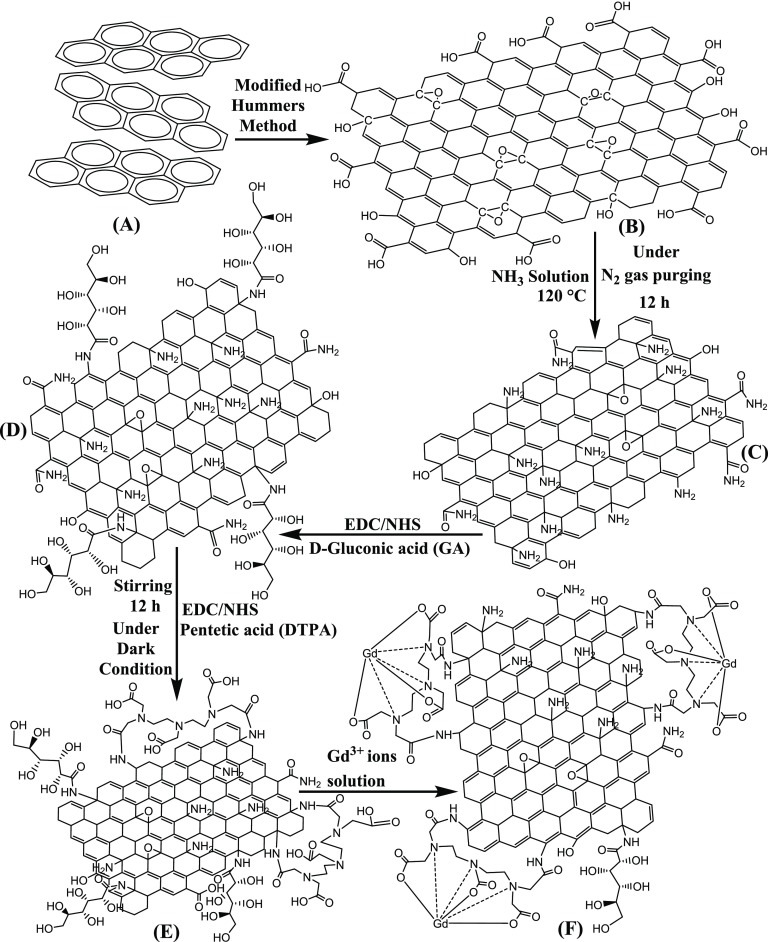
KMnO4 (8 g) was added gradually in portions to the prepared mixture with constant stirring, and the temperature of the reaction mixture was controlled around ca. 10–15 °C. Subsequently, distilled water (250 mL) was slowly mixed to further dilute the system. 30% Hydrogen peroxide solution (30 mL) was successively employed to reduce the excess unreacted KMnO4. The resulting brown suspension was centrifuged, repeatedly washed with dilute HCl (1:1 v/v) followed by distilled water, and then dried in a hot oven at ∼90 °C to obtain a dark brown mass. Preparation of the reduced graphene oxide (rGO) nanosheets (NSs) involved the modifications of base GO, which itself was fabricated using Hummers’ method. GO nanosheets are generally synthesized using combined exfoliation and hydrothermal autoclave method. However, the synthesis process of graphene oxide nanosheets often lacks in even surfaces and edges due to the high-temperature fabrication technique. In the present work, a low-temperature approach with multiple steps has been utilized for the fabrication of graphene structure. This approach also provides hydrophilicity and biocompatibility allowing for better dispersibility, stability in water, and is nontoxic toward biological systems. The surface of GO was modified to rGO-NH2 (Figure 1C) by using ammonia solution to introduce amine functionality. NH3 solution (10 mL) was added to an aqueous dispersant of GO (70 mg) under vigorous stirring for 2 h. The resultant mixture was later heated at 120 °C with continuous stirring for 12 h to ensure complete conversion of carboxyl functionalities (−COOH) to amide (−CONH2) under nitrogen atmosphere (inert condition).
Figure 1.
Schematic illustration of synthesis of Gd-rGONSs; the procedure involves oxidation of graphite (G) (A) to graphene oxide (GO) and (B) via modified Hummers’ method. Graphene oxide (GO) (B) to reduced graphene oxide (r-GO) (C) (reduced and functionalized with amine functional groups). Dispersity of r-GO was enhanced by incorporating d-gluconic acid (GA) (D) and functionalized with pentetic acid (DTPA) (E). Gd3+ ions decorated over reduced graphene oxide nanosheets (Gd-rGONSs) (F) were obtained successfully as Gd3+ ions were chelated by DTPA.
The obtained mixture was purified using a dialysis membrane (12 000 Da molecular weight cutoff (MWCO)) until the solution was neutralized. A mixture of ethyl(dimethylaminopropyl)carbodiimide (EDC) (23 mg) and N-hydroxylsuccinimide (NHS) (20 mg) was added to d-gluconic acid (GA) (0.8 mL) in 2-(N-morpholino)ethanesulfonic acid (MES) (1 mL, 4 mmol) buffer and stirred for 50 min under dark conditions to activate the carboxyl groups of GA. The rGO-NH2 (60 mg) was later added to the activated mixture of GA, EDC, and NHS to form the bonds between the carboxyl groups of GA and the −NH2 functional locations of rGO-NH2 (Figure 1D). The resultant product was purified to remove unreacted molecules through dialysis. Diethylenetriaminepentaacetic acid (DTPA) (6 mg) dissolved in DMF (1 mL) was added to EDC (52 mg) in MES (1 mL) and kept under dark conditions for 30 min to activate the DTPA functional groups. The activated mixture was then added to rGO-GA solution with overnight stirring (Figure 1E). The solution was purified by dialysis against Milli-Q water (pH 7) at room temperature for 24 h. To decorate Gd3+ ions over the surface of rGO-DTPA, a gadolinium(III) nitrate hexahydrate solution (1.38 × 10⁻⁴ mM) was prepared in MES buffer (1 mL) and added dropwise to a solution of rGO-DTPA in MES buffer (1 mL) at the rate of 10 μL s–1 (Figure 1F). The solution was kept for 12 h under gentle stirring and dialyzed against water for removal of undesired molecules. The obtained Gd-rGONSs was dried in a vacuum oven at 60 °C for 12 h and stored for further characterizations. The Milli-Q water (Millipore SAS 67/20 Mosheim) of 10–7 S cm–1 was used throughout the fabrication of the nanostructures. The stepwise reaction is well discussed in detail using UV–visible spectra (Figure S1), Fourier transform infrared (FTIR) spectra (Figure S2), and field-emission scanning electron microscopy (FESEM) images (Figure S3) provided in the Supporting Information.
The morphology and size of GO (Figure 2A) and Gd-rGONSs (Figure 2B) were studied using a field emission scanning electron microscope (QUANTA 200 FEG, FEI, the Netherlands). The morphology of Gd-decorated reduced graphene oxide nanosheets was studied using a JEOL JEM-2100 high-resolution transmission electron microscope (HR-TEM) operated at 180 kV, as shown in Figure 2C,D. Figure 2A illustrates well-separated GO sheets with few layers. GO nanosheets were clearly visible as thin curtains with relatively large surfaces. This indicates considerable exfoliation of graphite during the oxidation process. The multiple layers were also observed with the Gd over the sheet surface with average size of <50 nm (Figure 2B). To verify even distribution of Gd3+, the samples were imaged with HR-TEM device. Figure 2C,D shows the morphology of GO and Gd-rGONS samples. Figure 2C shows that the GO nanosheets are rippled, which is important for functionalization and decoration of Gd3+ ions. The Gd3+ ions decorated over rGO surface showed narrow homogeneous distribution. It can be easily observed that nano-Gd3+ ions are decorated across the surface (Figure 2D). The smaller size is due to conjugation by DTPA chelating agents present over the rGO surfaces.
Figure 2.
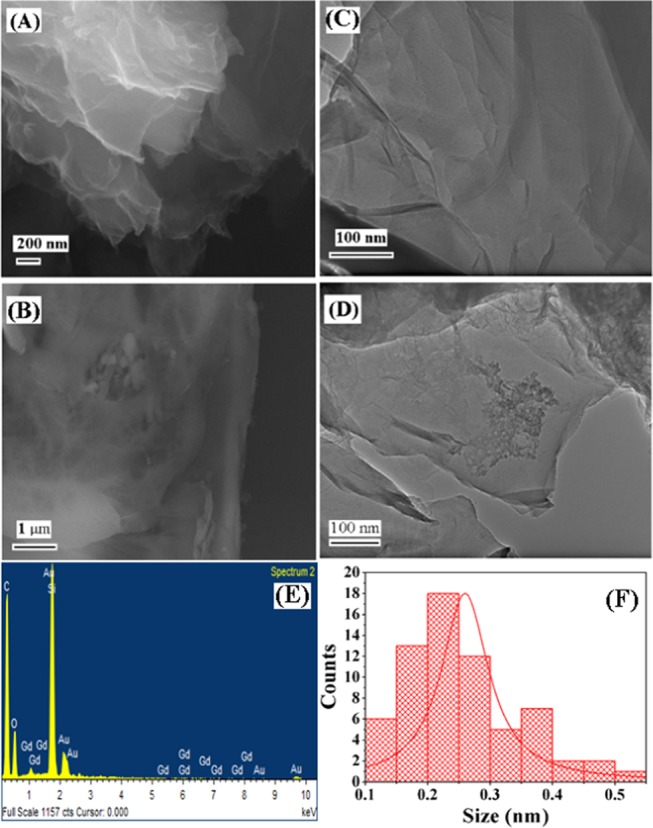
FESEM images of GO (A) and Gd-rGONSs (B) and the corresponding HR-TEM images of GO (C), Gd-rGONSs (D), energy-dispersive X-ray of Gd-rGONSs, (E), and particle size distribution histogram (F).
The Gd3+ ions can be clearly observed with sufficient decoration over the few layers of rGO nanosheets owing to their proper functionalization with multiple steps as mentioned above. The sufficient functionalization was attributed to the efficient ligand coordination extended at the interface between the rGO surface and the DTPA complexes encapsulating the Gd3+ ions. This provided a chemically and physically stable morphology to the multicomponent system. The planner sheet-like regions are prospective of unaltered graphene oxide. This is evident from the regions that are devoid of any Gd3+ ions and agglomeration of any other particles even after an extended period of ultrasonic treatment during the preparation of TEM specimens.25 This could also be one of the reasons where the chelating agent alone for Gd3+ complex formulation anchors them firmly on thin rGO sheets and would prevent leaching of Gd3+ ions. The later experiment with xylenol orange dye and ICP-OES for detection of leached out free Gd3+ supported our observation (Figure 4B1,B2).
Figure 4.
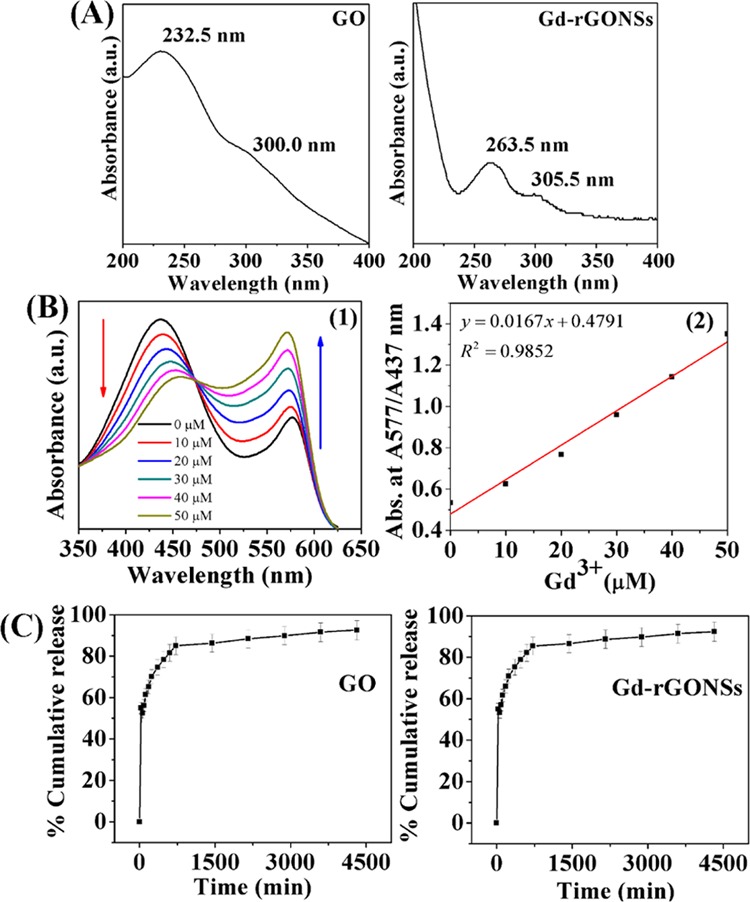
UV–visible absorption spectra of graphene oxide (GO) and Gd-reduced graphene oxide nanosheets (Gd-rGONSs) (A), spectrophotometric detection of Gd3+ ions by complex formation with xylenol orange; calibration curve obtained by increase in Gd3+ concentration from 0 to 50 μM in acetic buffer (pH 5.8) causing decrease in band intensity at 437 nm (indicated by the red arrow heading downward) and increase in band intensity at 577 nm (indicated by the blue arrow heading upward) (B1), and the calibration plot obtained for absorbance ratio A577/A437 versus Gd3+ concentration from 0 to 50 μM (B2), cumulative 5-FU release (%) profile of GO and Gd-rGONSs in phosphate-buffered saline (PBS) (pH 7.4) at 37 °C (C). The line graph data shown in release profile represent mean ± standard deviation of three replicates.
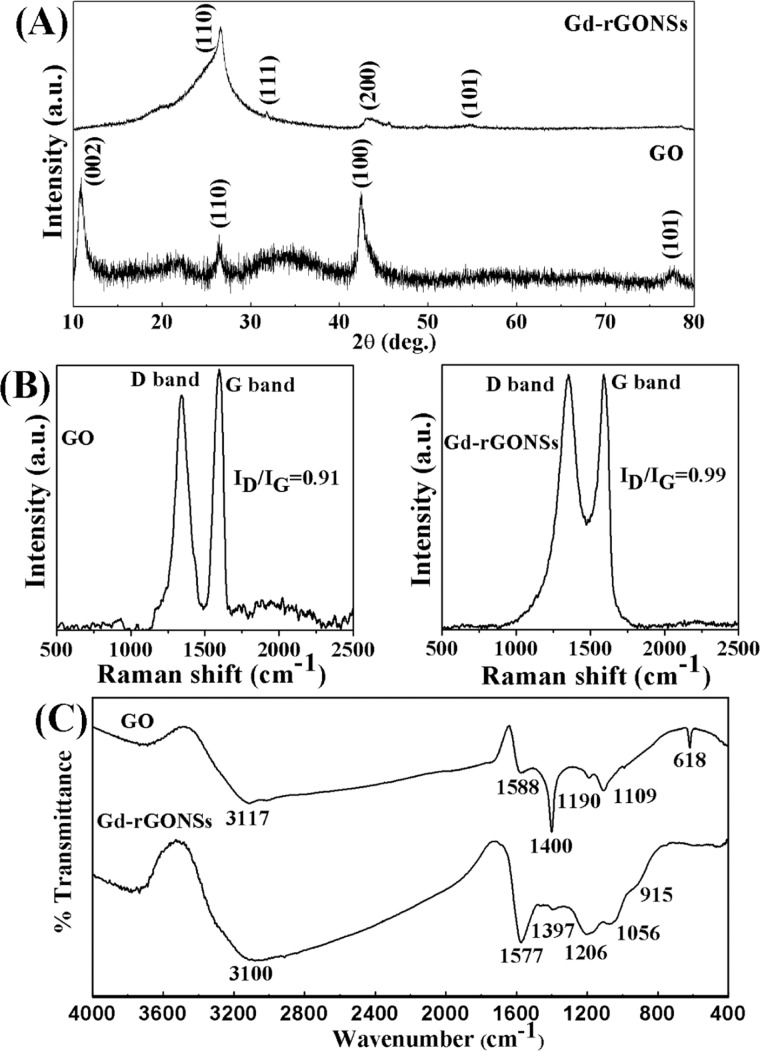
The X-ray diffraction (XRD) pattern of GO and Gd-rGONSs was obtained using a PANalytical X’Pert Pro XRD operating at a Cu Kα wavelength λ = 1.54 Å to verify the crystal structure of the synthesized materials, as shown in Figure 3A. The scans were performed over a 2θ range of 10–80° with a step size of 0.013°. Figure 3A compares the two diffraction patterns of GO and Gd-rGONSs. The XRD patterns for GO show characteristic peaks at 10.8, 26.6, and 42.5° corresponding to the ⟨002⟩, ⟨110⟩, and ⟨100⟩ planes of graphene oxide26 and a small peak at 26.6° corresponds to reduced graphene oxide (rGO).27 The spectra for Gd-rGONSs provide a broad peak at ∼26° due to expected surface modification and decoration of Gd3+ ions (JCPDS pdf #12-0797). The incorporation of Gd3+ ions on the rGONSs reduced the intensities of the peaks positioned at ∼43 and ∼54.7° corresponding to the ⟨200⟩ and ⟨101⟩ planes of graphite.27 The absence of the prominent peak at ∼10.8° and a broad peak at ∼26° for Gd-rGONSs samples confirms the reduction of GO to rGO. In addition to the above observations, interlayer distance values also support the reduction process of GO to rGO. The estimated “d” values of 0.82 for GO sample decreased to 0.34 for Gd-rGONSs.26,28 The crystallite size of GO was calculated by using the Debye–Scherrer formula mentioned in eq 1
| 1 |
The average crystallite size L was estimated from the full width β at half-maximum of the ⟨110⟩ peak, and it was found that the crystallite size increases (due to surface functionalization) from 5.8 nm (GO) to 7.3 nm (Gd-rGONSs).29,30 The XRD spectrum of Gd-rGONS sample shows no characteristic peak of unreacted elemental Gd or Gd2O3. This clearly indicates that Gd is present in the ionic form, chelated with DTPA. The absence of any oxide peak of GO indicates complete reduction of GO to rGO in the second step mentioned in Figure 1C.
Figure 3.
Comparative X-ray diffraction spectra (A), Raman spectra (B), and FTIR spectra (C) of graphene oxide (GO) and Gd-decorated reduced graphene oxide nanosheets (Gd-rGONSs).
The structural changes over GO surfaces after Gd3+ ions decoration is represented by Raman spectra in Figure 3B. In the Raman spectra of GO and Gd-rGONSs, D peak appeared at ∼1344 and ∼1354 cm–1, while G peak appeared at ∼1596 and ∼1589 cm–1, respectively. The shift in the D and G peak positions after surface modifications and reduction process ensures the lattice distortions. The G vibration mode owing to the first-order scattering of E2g phonons by sp2 carbon corresponds to the Brillouin zone of crystalline sp2 lattices in graphite.31 The D vibration bands are obtained from the breathing mode of k-point photons of A1g symmetry and originate from the zone boundary phonons.32 The ID/IG peak intensity ratios are about 0.91 and 0.99 for GO and Gd-rGONSs, respectively, confirming the reduction in average size of sp2 domains and edge defects.33 The C=C bonds reduction in graphene oxide infers the introduction of sp3 defects after functionalization with higher I(D)/I(G) ratio attributed to larger density of structural defects.34 The minor shift of G band (∼8 cm–1) to lower energy confirms the covalent grafting of organic molecules, which isolates sp2 carbon atoms.35
The chemical bond formation was verified using FTIR spectroscopy (PerkinElmer Spectrum 65 series FTIR spectrophotometer). Approximately 1.4–2.0 mg of the sample was mixed with ∼200 mg of KBr (AR, Sigma) for making pellets (Model Mp-15) at 8–9 kg cm–2 for 1–3 min. After a background scan with KBr pellet, the samples were analyzed using FTIR spectroscopy within the range of 4000–400 cm–1. The FTIR spectra for GO and Gd-rGONSs are provided in Figure 3C. The adsorbed moisture in the sample presents peaks at ∼3117 and ∼3100 cm–1, which are attributed to the O–H stretching vibration. The peaks at ∼1588, ∼1400, and ∼618 cm–1 are due to ionized carboxyl stretching νas(COO–) signifying the presence of oxygen-containing groups in graphene.36 The red shift observed at ∼1577 and ∼1397 cm–1 for Gd-rGONSs signifies interaction of rGO surface for modification, demonstrating N–H bending and C–O stretching, respectively.37 The peaks at ∼1109 and ∼1190 cm–1 are due to C–O–C and C–O stretching vibrations for graphene oxide, which can also be seen for Gd-rGONSs at ∼1056 and ∼1206 cm–1 due to C–O epoxide and C–O alkoxy stretchings, respectively.38
Elemental analysis of Gd3+ ions in Gd-rGONSs sample was done using an inductively coupled plasma optical emission spectrometer (ICP-OES; model 7300 DV, PerkinElmer). The estimated composition complies with precursor ion molar ratio used in synthesis, which could be used to control surface area and energy by utilizing Gd3+ ions chelated by DTPA with seven coordination numbers (ionic radius, 0.99 Å). There is enhancement in Gd-rGONSs effective surface area and energy. The amount of Gd3+ estimated by ICP-OES was 1.3 × 10⁻² g L–1 mg–1, which gave efficiency of chelation by DTPA present over rGONSs surface as ∼6%, estimated using eq 2
| 2 |
The UV–visible spectra obtained using a UV-1800 Shimadzu spectrophotometer are shown in Figure 4A for GO and Gd-rGONSs. The spectra for GO depict an absorbance peak at ∼232 nm due to π → π* transition of aromatic C–C ring with a shoulder peak at ∼300 nm due to n → π* transitions of C=O bond. For Gd-rGONSs, the absorption spectrum undergoes a red shift of the absorbance peak to ∼263.5 nm due to reduction of GO to rGO. The spectrum also shows the absorbance at ∼305.0 nm restoring conjugated C=C bonds even after reduction.39−41 The UV–visible results may be considered in agreement with the XRD results showing successful reduction of GO samples. Figure S1 could be refereed for each steps of change in the absorbance. The multifunctional activity of the designed materials in terms of drug delivery has been calculated using a UV–visible spectrophotometer. The contrast enhancements in optical coherence tomography (OCT) have been studied using the custom-made swept source optical coherence tomography (SSOCT) setup, and the magnetic resonance (MR) images were acquired using an MRI human scanner.
The bioimaging efficiency of the samples was performed using a custom-built SSOCT. The OCT setup utilizes an AXSUN scanning laser (1064 nm) with a scanning rate of 100 kHz. The imaging protocol was set to capture 100 B-frames of the same 5 mm location of the sample. Each B-frame consists of 1900 forward scanning A-scans and 100 in fly back. Each A-scan is composed of 2048 pts. of the acquired signal (corresponding to ∼1.8 mm in depth), which is appropriately postprocessed to generate the structural image. The control and data acquisition of the OCT system has been performed via LabVIEW and the postprocessing performed via MATLAB.
T1 relaxivity measurements of water protons in the presence of Gd-rGONSs sample were performed by Siemens Magnetom Essenza 1.5 T MRI human scanner. An in vitro phantom image was collected for the samples of different concentrations, and the values were fitted for obtaining a linear plot for 1/T1 versus Gd concentration to obtain r1 value from its slope. R1 mapping used a spin echo pulse sequence to obtain image with the following parameters: slice thickness, 3 mm; matrix size, 686 × 686; number of slices, 5; echo time (TE), 9 ms; repetition time (TR) values, 200, 400, 800, 1600, and 3200 ms. R1 was obtained using saturation recovery eq 3(42)
| 3 |
where S0 stands for the magnetization at equilibrium and c stands for a compensation term of the noise in measurement of data.
Relaxivity of the samples is determined by the rate of relaxation R as a function of concentration C according to eq 4(43)
| 4 |
3. Results and Discussion
3.1. Toxicity Studies of Gd-rGONSs
The percentage of Gd3+ ions leaching was accessed through conventional spectroscopic quantification method using xylenol orange in acetate buffer. The determination of leached Gd3+ ions was performed using 2 mL of 0.001 M xylenol orange solution in acetate buffer (pH 5.81) and 60 μL of supernatant of Gd-rGONSs (21.78 μg) dispersed in water. The mixture was analyzed by a UV–visible spectrometer.
The ratio of two absorbance maximum characteristic peaks of xylenol orange solution in the 350–625 nm region provides the amount of leached Gd3+ ions. The experiment showed no considerable leached ions from the Gd-rGONSs samples when dispersed in water (Figure S4). This was a direct method of toxicity test, and the Gd-based rGO sample was found to be nontoxic. The calculation was based on the calibration curve obtained and the value of linear fit equation (y = mx + c), as shown in Figure 4B.44 The light yellow color of xylenol orange in acetate buffer (pH 5.81) turns purple in the presence of Gd3+ ions chelated by xylenol orange. This is the visual confirmation of leaching from the samples. Further, the cytotoxicity of GO and Gd-rGONSs was obtained by using standard protocol of 3-(4,5-dimethyl-2-yl)-2,5-diphenyltetrazoliumbromide (MTT) assay. The H1299 cells were seeded in 96-well microplates (Corning) at a density of 5 × 10³ cells per well and kept in a CO2 incubator at 37 °C for 24 h. After 24 h, different concentrations of GO and Gd-rGONSs (10, 20, 40, and 80 μg mL–1) were applied to the cells and incubated for 24 h to evaluate the cytotoxic effect. After completion of incubation period, 100 μL of MTT reagent was added to each well followed by incubation for 3 h. After 3 h, MTT reagent was replaced by 150 μL of dimethyl sulfoxide for the formation of formazan crystals and incubated at room temperature for 30 min. The plates were read in a microplate reader (BIO-RAD microplate reader-550) at 570 nm. Figure S5 shows calculated results with improved cell viability of Gd-rGONSs compared to GO; ∼85% (from ∼65%, respectively, due to the obvious reason of functionalization with biocompatible ligands.
Therefore, the as-prepared samples were stable and problems associated with the Gd3+ ions accumulation would be minimized through chelating the Gd3+ ions by DTPA and anchored over the rGO surface (Figure 1). This step of synthesis provided stability, reduced toxicity, and increased effective surface area.
3.2. Drug Loading and Release Behavior
The drug loading efficiency and release profile were determined using Fluorouracil (5-FU) as model drug. 5-FU is widely used as a fluoropyrimidine drug and has various other applications for treatment of colon cancer, cervical cancer, esophageal cancer, pancreatic cancer, stomach cancer, and breast cancer. Apart from this, it is used as eye drops for treatment of ocular surface squamous neoplasia and as ocular injection for trabeculectomy bleb to lower intraocular pressure.10
For determination of drug loading on the surface of GO and Gd-rGONSs, the calibration curve was validated and obtained as rectilinear in the concentration range of 1–19 μg mL–1 (r2 = 0.9991). The drug was dissolved in water at 4 mg mL–1 concentration (30.75 mM) and added to ∼2 mg of GO and Gd-rGONSs, respectively. The dispersant was kept in a shaker incubator for 12 h at a shaking speed of 200 rpm for sufficient loading. The mixture was further centrifuged and the supernatant was taken from the mixture. The concentration of the supernatant was estimated from UV–visible absorbance at its characteristic peak of 266 nm. The absorbance values were used by fitted equation of calibration for calculating the amount of drug loading. The calculated amounts of drug loading were ∼0.19 mg mg–1 (19 ± 14.2%) and ∼0.26 mg mg–1 (26 ± 14.0%) for GO and Gd-rGONSs, respectively. The loading efficiency was calculated by theoretical loading using eq 5
| 5 |
The data showed a loading efficiency for GO to be 9.2 ± 0.34%, which increased to 11 ± 2.57% for Gd-rGONSs using eq 6
| 6 |
The Gd3+ ions incorporation within rGO nanosheets compared to GO slightly changes the drug loading due to the increase in effective surface area and the surface functionalization associated with chelated Gd3+ ions with DTPA. The π–π stacking at the interface of nanoscale reduced graphene oxide and the anticancer drug decides loading and release of the drug. The 5-FU anticancer drug being an aromatic, “benzenoid” resonance contributor and “diamide” contributor that obeys all preference rules and has a loop of conjugated π bonds with two sp2 nitrogen45 helps in loading over nanoscale graphene oxide derivatives. In addition to this, 5-FU is relatively hydrophilic drug and therefore π–π interactions with GO surface would be less in comparison to specially engineered Gd-rGONSs leading toward lower drug loading capacity without surface modification of GO. Therefore, functionalization of GO surface could enhance drug loading by increasing π–π staking and plausibly hydrogen bonds between the 5-FU and Gd-rGONSs surface.
The loading on both sides of functionalized rGO surfaces and immobilization of drug and voids over rGO surface further enhance drug loading content. The drug release profile for 5-FU-loaded GO and Gd-rGONSs is illustrated in Figure 4C. The drugs-loaded GO and Gd-rGONSs were redispersed in 1 mL of water and filled in membrane dialysis tubing bag (12 000 Dalton molecular weight cutoff (MWCO)). Each dialysis tube was placed individually into 12 mL of phosphate-buffered saline (PBS, pH 7.4) release media and kept for stirring at 100 rpm with a temperature of 37 °C. The concentration of the drug released was measured at different time intervals by withdrawing an aliquot of 2 mL from release medium and replacing with same volume of fresh medium. The withdrawn aliquot was measured by UV–visible spectroscopy for the amount of drug released. The initial release was burst release probably due to drug molecules close to both sides of nanosheets surface getting rapidly released out into the buffer solution. The % cumulative release achieved was around 92% in 72 h with both the nanocarriers of GO and Gd-rGONSs. Interestingly, although drug loading efficiency got enhanced due to Gd incorporation in rGO matrix, no significant change in release profile was observed. This might be attributed to no further change in the nature of drug loaded over nanosheets. A comparative report mentioning the loading and release of 5-FU drug using graphene-based nanocarriers is presented in Table S1. The sample used for drug loading and release in the present work showed higher efficiency having comparatively higher values than the reported ones (Table S1). Moreover, the reported samples involved complicated functionalization to enhanced drug delivery efficiency (Figure 1D–F). Therefore, usage of Gd-rGONSs might act as potential drug carrier of 5-FU.
3.3. Swept Source Optical Coherence Tomography for in Vitro Tissue Imaging
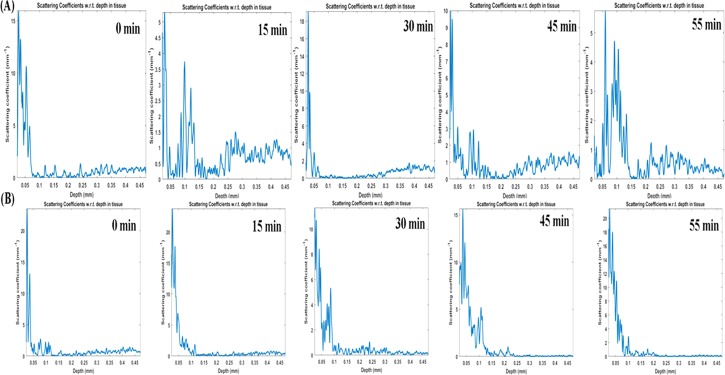
The usability of GO and Gd-rGONSs as a potential contrast agent for imaging of biological tissue has been studied using OCT. Different imaging techniques have been explored to study various diseases, including cancer, due to their mortality burden on developed biomedical arena. In the present experimental setup, chicken breast tissue was used to study the efficiency of imaging for Gd-based graphene samples as a viable contrast agent. In the presence of GO and Gd-rGONS molecules, there is an enhanced scattering of the penetrating light, thereby helping in the visualization of the inner structure of the tissue sample. The penetration of GO and Gd-rGONSs was studied over a period of 55 min, with the appropriate images acquired every 15 min. Figure 5A shows cross-sectional OCT image of the tissue samples with the application of GO and Gd-rGONSs as contrast agent with time. A qualitative estimation may lead to the conclusion that the rate of penetration of the Gd-rGONSs is lower than that of GO. The quantitative analysis of the intensity profile (A scan) with respect to penetration depth at different time intervals is presented in Figure 6a,b. The A-scan profiles for the OCT image with GO does not show a sharp peak until 55 min of time, while for Gd-rGONSs, the same is visible within 30 min of the application mark. Both molecules demonstrate sufficient penetration into the tissue with efficient backscattering, for visualization purposes. However, Gd-rGONSs show superior contrast ability, with a higher scattering factor than GO. This property may be attributed to its various surface modifications, which in turn increase the effective surface area for active optical backscattering of the incident light. The enhancement in brightness of the surface layer for Gd-rGONSs progressively increases with time compared to GO. This is significantly beneficial to enhance the contrast between the surface and the inner layers.
Figure 5.
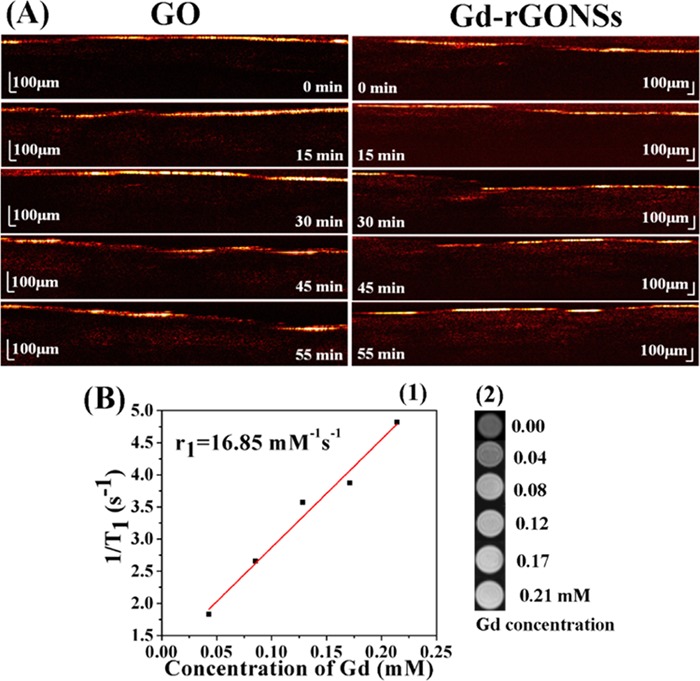
SSOCT images of chicken breast tissue segments with GO NSs at different exposure time intervals and with Gd-rGONSs at different exposure time intervals (A), linear fitting plot of 1/T1 versus Gd concentration in mM and the slope of which gave the value of r1 for Gd-rGONSs (B1) and T1-weighted phantom MR images of pure water and Gd-rGONSs dispersant at various concentrations: 0.00, 0.04, 0.08, 0.12, 0.17, and 0.21 mM (from top to bottom) (B2); Milli-Q water was used as control (0.00 mM).
Figure 6.
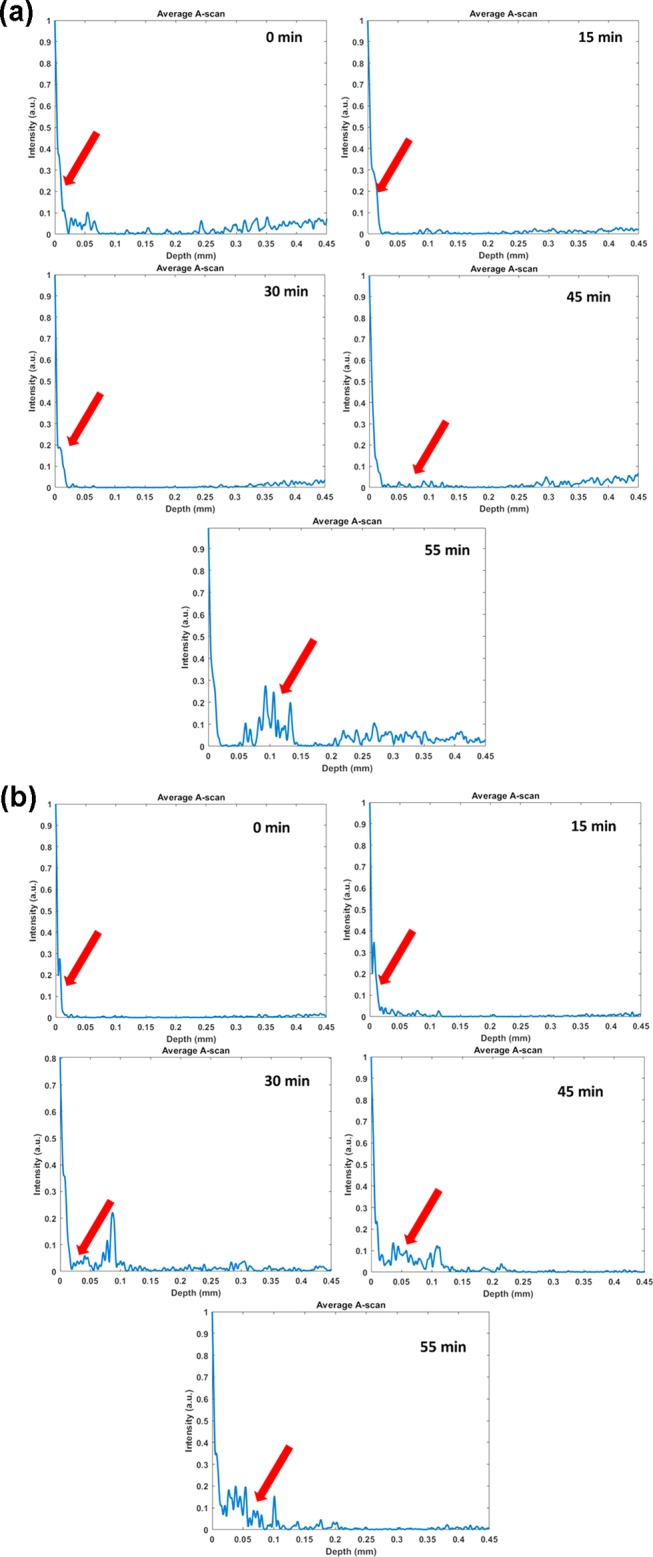
(a) Single average A-scan profiles indicating signal obtained from deeper layer of the tissue (epimysium) for GO. (b) Single average A-scan profiles indicating signal obtained from deeper layer of the tissue (epimysium) for Gd-rGONSs.
After obtaining tissue morphologies due to intrinsic scattering differences using OCT, the scattering coefficient was estimated for the samples, as shown in the scattering A-scan profiles in Figure 6a,b. The estimated value of scattering coefficient for GO was found to be ∼4.5 mm–1 at 55 min, compared to ∼18 mm–1 for Gd-rGONSs during the same time period. This difference is attributed to the surface functionalization of GO, which induces a greater number of locations for interaction with the surrounding tissue and thereby reducing the rate of penetration. It is observed that the penetration of GO and Gd-rGONSs inside the tissue is nearly similar. However, penetration rate of Gd is higher due to its smaller structure. It must be noted that the A-scans taken at different times are also the same of different regions of the sample. To alleviate this concern, the solution was evenly applied to the sample. But due to the different densities in the sample at different locations, the rate of penetration is shown to be different. It must however be noted that from Figures 6 and 7, it can be estimated that the Gd-rGONSs have a lower rate of penetration than GO. This may be attributed to the higher interaction between the sample tissue and the Gd-rGONSs because of the latter’s greater surface area and hence greater interaction. But from Figure 7A,B, it can also be estimated that due to the lower penetration rate, Gd-rGONS samples also provide a greater contrast, but are suited for applications where shallow depth imaging is recommended. Figure 8 shows average change in scattering coefficients of tissue for GO and Gd-rGONSs as exogeneous contrast agent. Gd-rGONSs shows better scattering coefficient with respect to time in comparison to GO, and hence acts as a better contrast agent. Due to the higher optical backscattering afforded by the Gd-rGONS samples and the use of Gd-based compounds for MRI contrast enhancements, a study of the contrast and depth penetration of the proposed novel compound may also be conducted using magneto motive OCT (MMOCT) for diagnostic and therapeutic purposes.
Figure 7.
Scattering coefficient profiles with respect to depth, indicating signal obtained from deeper layer of the tissue (epimysium) for (A) GO and (B) Gd-rGONSs.
Figure 8.
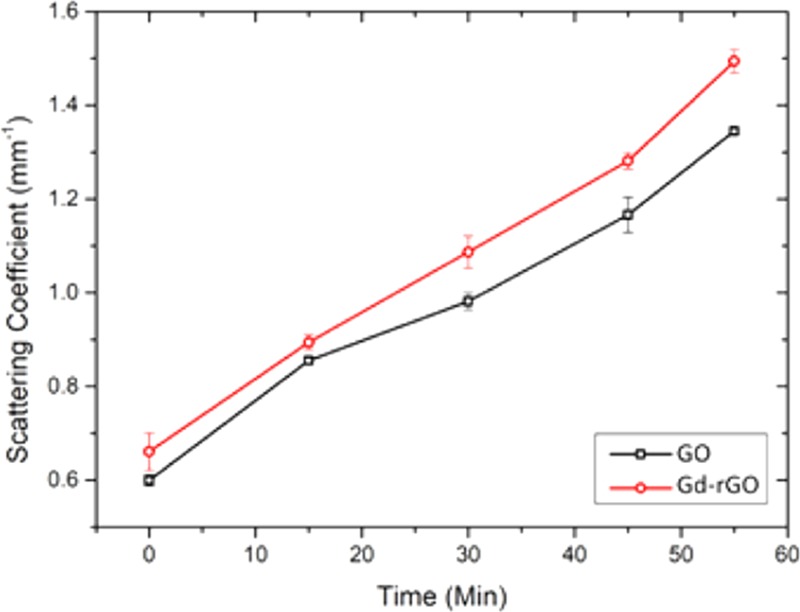
Average change in scattering coefficients of tissue for GO and Gd-rGONSs as exogeneous contrast agents.
3.4. T1 and T2 Relaxivity for in Vitro MR Imaging
The longitudinal relaxivity of Gd-rGONSs as a T1 MRI contrast agent was measured from the linear plot map of 1/T1 versus Gd concentration under the applied magnetic field of 1.5 T. The slope of the plot gives the corresponding relaxivity (r1) value (Figure 5B1). The five different aqueous dispersants of 0.04, 0.08, 0.12, 0.17, and 0.21 mM concentrations were prepared for scanning the samples (Figure 5B2). The r1 value for Gd-rGONSs was calculated to be 16.85 mM–1 s–1, which was 4 times larger than the commercially used clinical contrast agent Magnevist (4 mM–1 s–1) at a magnetic field strength of 1.5 T.46 In this work, the obtained value of r1 for Gd-rGONSs was significantly higher than the relaxivity values achieved by available commercial and reported contrast agents in the literature (Table S2). One of the reasons for obtaining higher relaxivity value being the effective surface area provided by the graphene nanosheets and the uniform distribution of the contrast moieties over the surface. This effectively enhances the contrast ability by reducing the TR, acquisition time, and required magnetic field strength. The other major implication of this sample would be for reduced dosage as even at the lower concentration and magnetic field strength, the obtained relaxivities are higher than the previously reported study, which used a magnetic field strength of 11.7 T (Table S2).
4. Conclusions
Gd3+ ions-decorated rGO samples having multifunctional efficiency were engineered. The synthesized Gd-rGONSs were found to enhance loading of 5-FU than its GO counterpart. The release was sustained and found to be ∼92% in 72 h. The contrast was enhanced for Gd-rGONSs than GO for OCT imaging studies. The synthesized Gd-rGONSs could also be used for future studies with magneto motive OCT bioimaging and simultaneously as drug delivery nanovehicle for ocular surface squamous neoplasia and other ocular diseases. The suitability of Gd-rGONSs as promising T1 contrast agent for MRI adds to its applicability for magnet-induced imaging. The designed Gd3+ ions-decorated rGONSs showed 4 times enhanced relaxivity value (r1) at 1.5 T magnetic field. The larger value was dependent on the effective surface area provided by the nanosheets of rGO matrix and the uniform distribution of the Gd3+ ions on both sides of the surface inducing contrast density enhancement. Further, the Gd-rGONS designed samples showed no leaching of Gd3+ ions estimated spectroscopically and through elemental detection. The Gd3+ ions in their free form are mainly responsible for various organ and specifically renal dysfunction, whose toxicity has been prevented strongly through designing of the appropriate surface functionalization groups of Gd-rGONSs. Overall, engineering such Gd-rGONSs and their synthesis approach combine to provide a comprehensive basis for development of new-generation multimodal nanocarrier as an active candidate for drug delivery via optical and magnetic imaging techniques whose feature make it highly recommendable and relevant for therapy and diagnosis simultaneously making it theranostic nanosystems.
Acknowledgments
The authors acknowledge Central University of Gujarat, Gandhinagar, for providing infrastructure and instrumentation facility for the present work. D.M. acknowledges Department of Chemistry, Chandernagore College, Hooghly, West Bengal, India, and Department of Chemistry, Barasat Govt College, Barasat 700124, West Bengal, India, for research facilities.
Supporting Information Available
The Supporting Information is available free of charge on the ACS Publications website at DOI: 10.1021/acsomega.9b00883.
UV–visible analysis; FTIR analysis; FESEM imaging; UV–vis spectral of leached Gd3+ ions in the presence of xylenol orange; cell viability of H1299 cells incubated with GO and Gd-rGONSs; comparative drug release studies; and comparative r1 relaxivity studies (PDF)
The authors declare no competing financial interest.
Notes
Chicken breast tissue was procured from local supermarket for in vitro study; hence, no ethical clearance is required. Then, thin slices were prepared for imaging at room temperature.
Supplementary Material
References
- Huang C.-L.; Huang C.; Mai F.; Yen C.; Tzing S.; Hsieh H.; Ling Y.; Chang J. Application of Paramagnetic Graphene Quantum Dots as a Platform for Simultaneous Dual-Modality Bioimaging and Tumor-Targeted Drug Delivery. J. Mater. Chem. B 2015, 3, 651–664. 10.1039/C4TB01650E. [DOI] [PubMed] [Google Scholar]
- Zhao H.; Ding R.; Zhao X.; Li Y.; Qu L.; Pei H.; Yildirimer L.; Wu Z.; Zhang W. Graphene-Based Nanomaterials for Drug and/or Gene Delivery, Bioimaging, and Tissue Engineering. Drug Discovery Today 2017, 22, 1302–1317. 10.1016/j.drudis.2017.04.002. [DOI] [PubMed] [Google Scholar]
- Lin J.; Chen X.; Huang P. Graphene-Based Nanomaterials for Bioimaging. Adv. Drug Discovery Rev. 2016, 105, 242–254. 10.1016/j.addr.2016.05.013. [DOI] [PMC free article] [PubMed] [Google Scholar]
- Shang L.; Nienhaus K.; Nienhaus G. U. Engineered Nanoparticles Interacting with Cells: Size Matters. J. Nanobiotechnol. 2014, 12, 5. 10.1186/1477-3155-12-5. [DOI] [PMC free article] [PubMed] [Google Scholar]
- Ma X.; Zhao Y.; Liang X.-J. Theranostic Nanoparticles Engineered for Clinic and Pharmaceutics. Acc. Chem. Res. 2011, 44, 1114–1122. 10.1021/ar2000056. [DOI] [PubMed] [Google Scholar]
- Zhang Y.; Wei W.; Das G. K.; Yang Tan T. T. Engineering Lanthanide-Based Materials for Nanomedicine. J. Photochem. Photobiol., C 2014, 20, 71–96. 10.1016/j.jphotochemrev.2014.06.001. [DOI] [Google Scholar]
- Ni D.; Bu W.; Ehlerding E. B.; Cai W.; Shi J. Engineering of Inorganic Nanoparticles as Magnetic Resonance Imaging Contrast Agents. Chem. Soc. Rev. 2017, 46, 7438–7468. 10.1039/C7CS00316A. [DOI] [PMC free article] [PubMed] [Google Scholar]
- Busquets M. A.; Estelrich J.; Sánchez-Martín M. J. Nanoparticles in Magnetic Resonance Imaging: From Simple to Dual Contrast Agents. Int. J. Nanomed. 2015, 140, 1727. 10.2147/IJN.S76501. [DOI] [PMC free article] [PubMed] [Google Scholar]
- Opoku-Damoah Y.; Wang R.; Zhou J.; Ding Y. Versatile Nanosystem-Based Cancer Theranostics: Design Inspiration and Predetermined Routing. Theranostics 2016, 6, 986–1003. 10.7150/thno.14860. [DOI] [PMC free article] [PubMed] [Google Scholar]
- Joag M. G.; Sise A.; Murillo J. C.; Sayed-Ahmed I. O.; Wong J. R.; Mercado C.; Galor A.; Karp C. L. Topical 5-Fluorouracil 1% as Primary Treatment for Ocular Surface Squamous Neoplasia. Ophthalmology 2016, 123, 1442–1448. 10.1016/j.ophtha.2016.02.034. [DOI] [PMC free article] [PubMed] [Google Scholar]
- Le Duc G.; Miladi I.; Alric C.; Mowat P.; Bräuer-Krisch E.; Bouchet A.; Khalil E.; Billotey C.; Janier M.; Lux F.; et al. Toward an Image-Guided Microbeam Radiation Therapy Using Gadolinium-Based Nanoparticles. ACS Nano 2011, 5, 9566–9574. 10.1021/nn202797h. [DOI] [PubMed] [Google Scholar]
- Xue S.; Qiao J.; Jiang J.; Hubbard K.; White N.; Wei L.; Li S.; Liu Z.-R.; Yang J. J. Design of ProCAs (Protein-Based Gd3+ MRI Contrast Agents) with High Dose Efficiency and Capability for Molecular Imaging of Cancer Biomarkers. Med. Res. Rev. 2014, 34, 1070–1099. 10.1002/med.21313. [DOI] [PubMed] [Google Scholar]
- Hashemi M.; Omidi M.; Muralidharan B.; Tayebi L.; Herpin M. J.; Mohagheghi M. A.; Mohammadi J.; Smyth H. D. C.; Milner T. E. Layer-by-Layer Assembly of Graphene Oxide on Thermosensitive Liposomes for Photo-Chemotherapy. Acta Biomater. 2018, 65, 376–392. 10.1016/j.actbio.2017.10.040. [DOI] [PubMed] [Google Scholar]
- Shen J.-M.; Xu L.; Lu Y.; Cao H.-M.; Xu Z.-G.; Chen T.; Zhang H.-X. Chitosan-Based Luminescent/Magnetic Hybrid Nanogels for Insulin Delivery, Cell Imaging, and Antidiabetic Research of Dietary Supplements. Int. J. Pharm. 2012, 427, 400–409. 10.1016/j.ijpharm.2012.01.059. [DOI] [PubMed] [Google Scholar]
- Sajid M. I.; Jamshaid U.; Jamshaid T.; Zafar N.; Fessi H.; Elaissari A. Carbon Nanotubes from Synthesis to in Vivo Biomedical Applications. Int. J. Pharm. 2016, 501, 278–299. 10.1016/j.ijpharm.2016.01.064. [DOI] [PubMed] [Google Scholar]
- Rathinaraj P.; Lee K.; Park S.; Kang I. Targeted Images of KB Cells Using Folate-Conjugated Gold Nanoparticles. Nanoscale Res. Lett. 2015, 10, 5. 10.1186/s11671-014-0725-y. [DOI] [PMC free article] [PubMed] [Google Scholar]
- Prodi L.; Rampazzo E.; Rastrelli F.; Speghini A.; Zaccheroni N. Imaging Agents Based on Lanthanide Doped Nanoparticles. Chem. Soc. Rev. 2015, 44, 4922–4952. 10.1039/C4CS00394B. [DOI] [PubMed] [Google Scholar]
- Singh G.; McDonagh B. H.; Hak S.; Peddis D.; Bandopadhyay S.; Sandvig I.; Sandvig A.; Glomm W. R. Synthesis of Gadolinium Oxide Nanodisks and Gadolinium Doped Iron Oxide Nanoparticles for MR Contrast Agents. J. Mater. Chem. B 2017, 5, 418–422. 10.1039/C6TB02854C. [DOI] [PubMed] [Google Scholar]
- FDA . FDA Evaluating the Risk of Brain Deposits with Repeated Use of Gadolinium-Based Contrast Agents for Magnetic Resonance Imaging (MRI). https://www.fda.gov/Drugs/DrugSafety/ucm455386.htm,2015; pp 7–10.
- Gulani V.; Calamante F.; Shellock F. G.; Kanal E.; Reeder S. B. International Society for Magnetic Resonance in Medicine. Gadolinium Deposition in the Brain: Summary of Evidence and Recommendations. Lancet Neurol. 2017, 16, 564–570. 10.1016/S1474-4422(17)30158-8. [DOI] [PubMed] [Google Scholar]
- Mekuria S. L.; Debele T. A.; Tsai H. Encapsulation of Gadolinium Oxide Nanoparticle (Gd2O3) Contrasting Agents in PAMAM Dendrimer Templates for Enhanced Magnetic Resonance Imaging in Vivo. ACS Appl. Mater. Interfaces 2017, 9, 6782–6795. 10.1021/acsami.6b14075. [DOI] [PubMed] [Google Scholar]
- Sun X.; Zebibula A.; Dong X.; Zhang G.; Zhang D.; Qian J.; He S. Aggregation-Induced Emission Nanoparticles Encapsulated with PEGylated Nano Graphene Oxide and Their Applications in Two-Photon Fluorescence Bioimaging and Photodynamic Therapy in Vitro and in Vivo. ACS Appl. Mater. Interfaces 2018, 10, 25037–25046. 10.1021/acsami.8b05546. [DOI] [PubMed] [Google Scholar]
- Yan M.; Liu Y.; Zhu X.; Wang X.; Liu L.; Sun H.; Wang C.; Kong D.; Ma G. Nanoscale Reduced Graphene Oxide-Mediated Photothermal Therapy Together with IDO Inhibition and PD-L1 Blockade Synergistically Promote Antitumor Immunity. ACS Appl. Mater. Interfaces 2019, 11, 1876–1885. 10.1021/acsami.8b18751. [DOI] [PubMed] [Google Scholar]
- Yang C.; Chan K. K.; Xu G.; Yin M.; Lin G.; Wang X.; Lin W.-J.; Birowosuto M. D.; Zeng S.; Ogi T.; et al. Biodegradable Polymer-Coated Multifunctional Graphene Quantum Dots for Light-Triggered Synergetic Therapy of Pancreatic Cancer. ACS Appl. Mater. Interfaces 2019, 11, 2768–2781. 10.1021/acsami.8b16168. [DOI] [PubMed] [Google Scholar]
- Wang G.; Chen G.; Wei Z.; Dong X.; Qi M. Multifunctional Fe3O4/Graphene Oxide Nanocomposites for Magnetic Resonance Imaging and Drug Delivery. Mater. Chem. Phys. 2013, 141, 997–1004. 10.1016/j.matchemphys.2013.06.054. [DOI] [Google Scholar]
- Begum H.; Ahmed M. S.; Cho S.; Jeon S. Simultaneous Reduction and Nitrogen Functionalization of Graphene Oxide Using Lemon for Metal-Free Oxygen Reduction Reaction. J. Power Sources 2017, 372, 116–124. 10.1016/j.jpowsour.2017.10.035. [DOI] [Google Scholar]
- Chang G.; Li S.; Huang F.; Zhang X.; Shen Y.; Xie A. Multifunctional Reduced Graphene Oxide Hydrogel as Drug Carrier for Localized and Synergic Photothermal/Photodynamics/Chemo Therapy. J. Mater. Sci. Technol. 2016, 32, 753–762. 10.1016/j.jmst.2016.06.014. [DOI] [Google Scholar]
- Liu C.; He C.; Xie T.; Yang J. Reduction of Graphite Oxide Using Ammonia Solution and Detection Cr(VI) with Graphene-Modified Electrode. Fullerenes, Nanotubes, Carbon Nanostruct. 2015, 23, 125–130. 10.1080/1536383X.2013.833914. [DOI] [Google Scholar]
- Banerjee I.; Mahapatra S.; Pal C.; Sharma A. K.; Ray A. K. Effect of Plasma Power on Reduction of Printable Graphene Oxide Thin Films on Flexible Substrates. Mater. Res. Express 2018, 5, 056405 10.1088/2053-1591/aac04e. [DOI] [Google Scholar]
- Banerjee I.; Faris T.; Stoeva Z.; Harris P. G.; Chen J.; Sharma A. K.; Ray A. K. Graphene Films Printable on Flexible Substrates for Sensor Applications. 2D Mater. 2017, 4, 015036 10.1088/2053-1583/aa50f0. [DOI] [Google Scholar]
- Gupta B.; Kumar N.; Panda K.; Kanan V.; Joshi S.; Visoly-Fisher I. Role of Oxygen Functional Groups in Reduced Graphene Oxide for Lubrication. Sci. Rep. 2017, 7, 45030 10.1038/srep45030. [DOI] [PMC free article] [PubMed] [Google Scholar]
- Gurunathan S.; Han J.; Eppakayala V.; Dayem A.; Kwon D.-N.; Kim J.-H. Biocompatibility Effects of Biologically Synthesized Graphene in Primary Mouse Embryonic Fibroblast Cells. Nanoscale Res. Lett. 2013, 8, 393. 10.1186/1556-276X-8-393. [DOI] [PMC free article] [PubMed] [Google Scholar]
- Verma S.; Dutta R. K. A Facile Method of Synthesizing Ammonia Modified Graphene Oxide for Efficient Removal of Uranyl Ions from Aqueous Medium. RSC Adv. 2015, 5, 77192–77203. 10.1039/C5RA10555B. [DOI] [Google Scholar]
- Yasin G.; Arif M.; Shakeel M.; Dun Y.; Zuo Y.; Khan W. Q.; Tang Y.; Khan A.; Nadeem M. Exploring the Nickel-Graphene Nanocomposite Coatings for Superior Corrosion Resistance: Manipulating the Effect of Deposition Current Density on Its Morphology, Mechanical Properties, and Erosion-Corrosion Performance. Adv. Eng. Mater. 2018, 20, 1701166 10.1002/adem.201701166. [DOI] [Google Scholar]
- Ossonon B. D.; Bélanger D. Synthesis and Characterization of Sulfophenyl-Functionalized Reduced Graphene Oxide Sheets. RSC Adv. 2017, 7, 27224–27234. 10.1039/C6RA28311J. [DOI] [Google Scholar]
- Mohabey H. IR Spectra, Magnetic and Thermal Studies of Copper ( II ) Complex of N-Hydroxy-N-(4-Chloro) Phenyl N′(4-Fluoro) Phenyl Benzamidine Hydrochloride. Mater. Sci. Res. India 2014, 11, 63–65. 10.13005/msri/110108. [DOI] [Google Scholar]
- Lefèvre G.; Preočanin T.; Lützenkirchen J.. Attenuated Total Reflection - Infrared Spectroscopy Applied to the Study of Mineral-Aqueous Electrolyte Solution Interfaces: A General Overview and a Case Study. In Infrared Spectroscopy - Materials Science, Engineering and Technology; InTech, 2012; pp 979-953-307-362–369. [Google Scholar]
- Gao X.; Metge D. W.; Ray C.; Harvey R. W.; Chorover J. Surface Complexation of Carboxylate Adheres Cryptosporidium Parvum Öocysts to the Hematite–Water Interface. Environ. Sci. Technol. 2009, 43, 7423–7429. 10.1021/es901346z. [DOI] [PubMed] [Google Scholar]
- Pham V. H.; Pham H. D.; Dang T. T.; Hur S. H.; Kim E. J.; Kong B. S.; Kim S.; Chung J. S. Chemical Reduction of an Aqueous Suspension of Graphene Oxide by Nascent Hydrogen. J. Mater. Chem. 2012, 22, 10530. 10.1039/c2jm30562c. [DOI] [Google Scholar]
- Omar F. S.; Nay Ming H.; Hafiz S. M.; Ngee L. H. Microwave Synthesis of Zinc Oxide/Reduced Graphene Oxide Hybrid for Adsorption-Photocatalysis Application. Int. J. Photoenergy 2014, 2014, 1–8. 10.1155/2014/176835. [DOI] [Google Scholar]
- Yang J.; Gunasekaran S. Electrochemically Reduced Graphene Oxide Sheets for Use in High Performance Supercapacitors. Carbon 2013, 51, 36–44. 10.1016/j.carbon.2012.08.003. [DOI] [Google Scholar]
- Carneiro A. A. O.; Vilela G. R.; Araujo D. B.; De Baffa O. MRI Relaxometry: Methods and Applications. Braz. J. Phys. 2006, 36, 1–7. 10.1590/S0103-97332006000100005. [DOI] [Google Scholar]
- Koenig S. H.; Kellar K. E. Theory of 1/T1 and 1/T2 NMRD Profiles of Solutions of Magnetic Nanoparticles. Magn. Reson. Med. 1995, 34, 227–233. 10.1002/mrm.1910340214. [DOI] [PubMed] [Google Scholar]
- Barge A.; Cravotto G.; Gianolio E.; Fedeli F. How to Determine Free Gd and Free Ligand in Solution of Gd Chelates. A Technical Note. Contrast Media Mol. Imaging 2006, 1, 184–188. 10.1002/cmmi.110. [DOI] [PubMed] [Google Scholar]
- Rana V. K.; Choi M.; Kong J.; Kim G. Y.; Kim M. J.; Kim S.; Mishra S.; Singh R. P.; Ha C. Synthesis and Drug-Delivery Behavior of Chitosan-Functionalized Graphene Oxide Hybrid Nanosheets. Macromol. Mater. Eng. 2011, 296, 131–140. 10.1002/mame.201000307. [DOI] [Google Scholar]
- Lauffer R. B. Paramagnetic Metal Complexes as Water Proton Relaxation Agents for NMR Imaging: Theory and Design. Chem. Rev. 1987, 87, 901–927. 10.1021/cr00081a003. [DOI] [Google Scholar]
Associated Data
This section collects any data citations, data availability statements, or supplementary materials included in this article.


