

Skouloudaki et al. identify an alternative role of the transcriptional coactivator Yorkie (Yki) in controlling water impermeability and tube size of developing Drosophila airways. Tracheal impermeability is triggered by Yki-mediated transcriptional regulation of δ-aminolevulinate synthase (Alas), whereas tube elongation is controlled by binding of Yki to the actin-severing factor Twinstar.
Abstract
Epithelial organ size and shape depend on cell shape changes, cell–matrix communication, and apical membrane growth. The Drosophila melanogaster embryonic tracheal network is an excellent model to study these processes. Here, we show that the transcriptional coactivator of the Hippo pathway, Yorkie (YAP/TAZ in vertebrates), plays distinct roles in the developing Drosophila airways. Yorkie exerts a cytoplasmic function by binding Drosophila Twinstar, the orthologue of the vertebrate actin-severing protein Cofilin, to regulate F-actin levels and apical cell membrane size, which are required for proper tracheal tube elongation. Second, Yorkie controls water tightness of tracheal tubes by transcriptional regulation of the δ-aminolevulinate synthase gene (Alas). We conclude that Yorkie has a dual role in tracheal development to ensure proper tracheal growth and functionality.
Introduction
Regulation of epithelial tube size and integrity depends on several mechanisms, including cell surface receptors, cytoskeletal and extracellular matrix components, cell polarity, and vesicular transport. These mechanisms control the development and maintenance of tube diameter and length, which are required for proper tube function (Beitel and Krasnow, 2000; Iruela-Arispe and Beitel, 2013). Aberrant regulation of any of these parameters causes human diseases, such as polycystic kidney disease (Steinman, 2012), fibrocystic breast disease (Rinaldi et al., 2010), pancreatic cystic neoplasms (Garud and Willingham, 2012), or thyroid nodules (Popoveniuc and Jonklaas, 2012). To understand the biology of epithelial tube formation and functionality, several models have been used, including the Drosophila melanogaster respiratory system, the tracheae. The tracheal system forms as a branched tubular network during the first half of embryogenesis. At later embryonic stages, tracheal tubes elongate by cell shape changes and cell junction rearrangements, but without increasing their cell number (Samakovlis et al., 1996). So far, it is established that longitudinal growth depends on various cellular components and molecules, including: (i) septate junctions (SJs; Llimargas et al., 2004; Wu et al., 2004; Wang et al., 2006), (ii) the subapical protein Crumbs and the cortical-intercellular matrix interactions (Tonning et al., 2005; Laprise et al., 2006, 2010; Dong et al., 2014), and (iii) chitin deacetylases and Src kinase levels (Luschnig et al., 2006; Wang et al., 2006; Förster and Luschnig, 2012; Nelson et al., 2012).
The transcriptional coactivator Yorkie (Yki) is a major downstream target of the conserved Hippo signaling pathway, which controls organ size by suppressing proliferation and promoting apoptosis (Halder and Johnson, 2011). Yki is required for proper tracheal tube growth (Robbins et al., 2014), but how a gene that is mostly implicated in cell proliferation controls growth in a nonproliferating tissue remains unknown.
Since cell proliferation genes are transcriptional targets of Yki and its vertebrate orthologues YAP (Yes-associated protein) and TAZ (transcriptional coactivator with PDZ-binding motif), Yki/YAP activity has to be tightly regulated, which is largely mediated by the control of its subcellular localization (nuclear or cytoplasmic). Several upstream mechanisms control Yki/YAP localization, including its phosphorylation (Fulford et al., 2018), interaction with tight junction protein complexes (Skouloudaki and Walz, 2012) that regulate Yki/YAP cytoplasm-to-nucleus translocation in proliferating epithelial tissues (Wang et al., 2011; Zhao et al., 2011), and cellular and extracellular forces (Totaro et al., 2018).
Here, we describe a novel mechanism to control Yki subcellular localization in a nonproliferating tissue, the embryonic tracheal system of Drosophila.
Results
Yki controls tracheal tube length and proper gas filling
Drosophila embryos, bearing a deletion of the whole yki locus (Huang et al., 2005; ykiB5, henceforth referred to as yki mutant), and hence representing a loss-of-function allele, die at late embryonic stages. These embryos bear overelongated tracheal tubes (Fig. 1, A and B; Huang et al., 2005; Robbins et al., 2014). Staining for chitin confirmed that the length of the major tracheal tubes, the dorsal trunks (DTs), of late stage 16 yki mutant embryos is significantly increased compared with WT (Fig. 1 B) and similar to embryos mutant for melanotransferrin (mtf), which encodes a SJ component (Fig. 1 B). Besides the extended tracheal tube length of yki mutants, their DTs fail to clear luminal liquid and do not fill with gas (Fig. 1, C and D). Both phenotypes were almost fully reversed upon tracheal expression of a yki-V5 cDNA (Fig. 1, A–D). Therefore, yki is required to limit tracheal tube length and to promote gas filling in Drosophila airways. However, in contrast to published data (Robbins et al., 2014), we observed only partial rescue of the tube length phenotype of yki mutants upon tracheal expression of Diap1 (Death-associated inhibitor of apoptosis 1; also known as thread [thr]), a Yki-target gene (Fig. 1 E), and Diap1 mutants display no defects in gas filling (Fig. S1). Thus, the observed gas-filling and tube-length abnormalities of yki mutants cannot solely be due to impaired regulation of Diap1.
Figure 1.

Yki is required to restrict tracheal tube length without affecting SJs and luminal matrix. (A) WT, ykiB5, and ykiB5;btl>yki late stage 16 embryos, stained with the chitin-binding probe (CBP). Note the convoluted DT tubes in ykiB5 mutant embryos. Tracheae-specific expression of yki rescues this phenotype. Scale bar: 50 µm. (B) DT length is significantly increased in ykiB5 mutants (n = 20) compared with that of WT (n = 9) embryos or ykiB5 mutant embryos expressing yki under the control of the tracheal driver btl-Gal4, ykiB5;btl>yki (n = 15). Tube length is expressed as the ratio of DT length (metamere 6–10) to body length, normalized against WT embryos (ratio taken as 1). Tube length of mtf mutants (n = 20), a gene encoding a bona fide SJ component, is increased. (C) WT, ykiB5, and ykiB5;btl>yki late stage 17 embryos. Gas filling of the DT lumen is observed in WT and ykiB5;btl>yki, but not in ykiB5 mutant embryos. Scale bar: 20 µm. (D) Plot showing the percentage of ykiB5 mutant (n = 99) embryos with gas-filling defects, which is significantly different from WT (n = 86) and ykiB5;btl>yki embryos (n = 106). (E) The relative tube length of ykiB5 mutant embryos is rescued to different extents by expression of either yki or Diap1 by btl-Gal4. WT (n = 20), ykiB5 (n = 11), ykiB5;btl>yki (n = 12), ykiB5;btl>Diap1(n = 12). Error bars represent SEM. (F–H′) Airyscan confocal images showing the DT (tracheal metamere 7) of WT (F and F′), ykiB5 (G and G′) and mtf (H and H′) mutants of late stage 16 stained for the core SJ components Yurt and Cora (green), the luminal matrix protein Serp (magenta), and the nucleus with DAPI (blue). Note that Cora and Yurt are apically restricted in WT and ykiB5 mutant tracheae, but not in mtf mutants. Scale bar: 10 µm. (I–K′) Transmission electron microscopy of stage 16 embryonic tracheae of WT (I and I′), ykiB5 (J and J′), and mtf (K and K′) mutants. Electron-dense septa (arrows) are comparable in WT and ykiB5 but invisible in mtf mutants. Scale bars: 0.5 µm. Error bars represent SEM.
Yki is required for formation of impermeable tubes
We therefore sought to identify additional mechanisms that could explain the tube-length abnormalities and gas-filling defects of yki mutants. Tracheal tube length is controlled by SJs (Wang et al., 2006). Loss of SJ components results in leakiness of the elongated tubes and impaired gas filling. However, in agreement with previous reports (Robbins et al., 2014), several SJ proteins are still found apically and localize correctly to SJs in yki mutant tracheae (Fig. 1, F–H′; and Fig. S2). In agreement, electron microscopy analysis revealed that the structure of the SJs is not affected in yki mutant tracheae and showed proper organization of the ladder-like septa similar to WT embryos, in contrast to mtf (Fig. 1, I–K′). To test for the barrier function of SJs, we injected 10 kD Dextran into the hemocoel of WT and yki mutant embryos. In contrast to recently published data (Robbins et al., 2014), we observed that in ∼80% of yki mutant embryos, the dye diffused into the lumen of the DTs, which never occurred in WT embryos (Fig. 2, A, B, and D). Stage 17 mutant embryos, expressing yki in the tracheae by btl-Gal4, did not exhibit Dextran leakage into the tracheal lumen (Fig. 2, C and D). This indicates a yki-dependent mechanism for sealing the tracheal epithelium. A higher amount of leakage in yki mutants was observed 240 min after injection (Fig. 2, E–F″, H, and I), later than in mtf mutant embryos (Fig. 2, G–G″, H, and I), exhibiting high lumen leakage already at 20 min after injection (Fig. 2, compare F–F″ with G–G″).
Figure 2.

Yki is important for transepithelial barrier function. (A–C) Fluorescent 10-kD Dextran injected into the body cavity does not enter the tracheal lumen (dotted yellow line) of stage 17 WT embryos (A). In contrast, the dye leaks into the tracheal lumen in ykiB5 (B) mutant embryos. In ykiB5 embryos expressing Yki in the tracheae, the dye is excluded from the lumen (C). Scale bar: 50 µm. (D) Plot representing the percentage of embryos with leakage defects. Shown are the results for ykiB5 (n = 115), WT (n = 172), and ykiB5; btl>yki (n = 62) embryos. (E–G″) Time series of Dextran-injected embryos. Dextran accumulates gradually in the tracheal lumen of ykiB5 mutant embryos (F–F′″), as compared with mtf mutant embryos (G–G′″), where the dye accumulates a few minutes after injection and stays unchanged over time. Scale bar: 100 µm. (H) Quantification of the relative luminal Dextran intensity 60 min after injection. WT (n = 75), ykiB5 (n = 72), mtf (n = 70). (I) Quantification of the relative luminal Dextran intensity 240 min after injection. WT (n = 83), ykiB5 (n = 88), mtf (n = 80). Error bars represent SEM.
The water tightness of tracheal tubes depends not only on intact SJs but also on the proper deposition of a chitinous apical ECM (aECM). Since SJs did not appear impaired in yki mutants, we asked whether yki loss affects the secretion of the chitin deacetylases Serpentine (Serp) and Vermiform (Verm; Luschnig et al., 2006). However, the luminal deposition of Serp and Verm is not perturbed in yki mutants (Fig. 1, F–G′; and Fig. S2, C′–D′), pointing to a novel SJ- and luminal matrix deposition–independent function of Yki for tracheae impermeability.
Yki is required for proper cross-linking of tracheal aECM proteins
Beside the proper functionality of the SJs and the secretion of Serp and Verm, the formation of an intact apical protein/chitin lattice is necessary for water impermeability of tracheal tubes (Shaik et al., 2012). Therefore, we examined the aECM in yki mutant tracheae in more detail. The insect cuticle is an apical extracellular waterproof barrier deposited by epithelial organs, such as the epidermis, tracheae, and fore- and hindgut. The aECM protects the organism from dehydration and infection and plays a crucial role in organ morphogenesis (Moussian, 2010; Öztürk-Çolak et al., 2016). Cuticular proteins are cross-linked in order to form a water-impermeable apical layer in the basal region of the cuticle at stage 17. Three lines of evidence suggested that an impaired function of the δ-aminolevulinate synthase (Alas; Shaik et al., 2012) is responsible for the fluid leakage and gas-filling defects in yki mutants. First, chromatin immunoprecipitation followed by deep sequencing data from Nagaraj et al. (2012) showed that Yki binds the regulatory region of Alas in imaginal discs. Second, similarly to yki, Alas is required for air filling of the tracheal tubes and maintenance of tracheal water impermeability in the late embryo (Shaik et al., 2012). Third, barrier defects observed in Alas mutants occur despite functional SJs (Shaik et al., 2012), similar to yki mutants. This evidence prompted us to investigate a possible functional link between yki and Alas. Alas mutant tubes display reduced amount of cuticular oxidative covalent bonds between two tyrosine residues (dityrosine bonds), resulting in loss of cuticular impermeability and defective air filling (Fig. 3, A, A′, and E–G). This effect is rescued upon tracheal expression of Alas cDNA (Fig. 3, B, B′, and E–G). Dityrosine bonds were also reduced in amount in yki mutants (Fig. 3, C, C′, E, and G), suggesting that Alas may act downstream of yki. In fact, gas-filling and trans-epithelial barrier defects were rescued by expression of Alas in tracheal cells of yki mutants (Fig. 3, D, D′, and E–G) to a similar extent as in Alas mutants (Fig. 3, E and F). In contrast, tube-length defects of yki mutants were not restored by Alas expression (data not shown). Furthermore, Alas mRNA is significantly decreased in yki mutants (Fig. 3 H), arguing in favor of Yki being a transcriptional activator of Alas. Interestingly, duox mRNA, which encodes an enzyme that catalyzes the oxidation of two tyrosines to dityrosine (Edens et al., 2001) and is also expressed in the tracheae (Yao et al., 2017), remained unaltered between yki mutants and WT embryos (Fig. 3 H). This suggested that Yki regulates the dityrosine network through Alas. To test whether Yki is a regulator of dityrosine bridges between extracellular proteins in other cuticular organs, we used ptc-Gal4 to express Yki-V5 (Fig. S3, A–A″) or knock it down by yki-RNAi (Fig. S3, B–B″) along the anterior–posterior boundary of wing discs. In Yki-expressing discs, the level of dityrosine was considerably increased (arrows in Fig. S3, A′ and D), whereas dityrosine was reduced upon yki knockdown (arrows in Fig. S3, B′ and D), as compared with the control (Fig. S3, C–C″).
Figure 3.

The apical barrier breaks down in yki mutant embryos. (A–D) Projections of confocal sections of tracheal DTs of stage 17 embryos. The dityrosine network marking the apical barrier (magenta) is reduced in AlasKG10015 (A) and ykiB5 (C) mutant embryos, whereas the signal is markedly increased in mutant embryos expressing Alas by btl-GAL4 (B and D). Arrows indicate dityrosine apical staining. Scale bars: 20 µm. (A′–D′) Whole-mount embryos at early stage 17. The DT of AlasKG10015 (A′) and ykiB5 (C′) mutant embryos are not air filled. In contrast, expression of Alas with the tracheal-specific driver btl-GAL4 rescues the air filling defects of both mutants (B′ and D′). Scale bars: 20 µm. (E) Plot showing the percentage of AlasKG10015 (n = 45) and ykiB5 (n = 50) mutant embryos with gas-filling defects, and significant rescue of this defect in both mutants upon tracheal-specific expression of Alas (ykiB5;btl>Alas, n = 42; AlasKG10015;btl>Alas, n = 50). (F) Plot showing the percentage of embryos with defects in the barrier function of the DT, as measured by 10 kD Rhodamine-dextran leakage into to the lumen. ykiB5 (n = 41), ykiB5;btl>Alas (n = 38), AlasKG10015 (n = 41) AlasKG10015;btl>Alas (n = 30). (G) Quantification of anti-dityrosine intensity as a measure for the apical extracellular barrier. ykiB5 (n = 15), ykiB5;btl>Alas (n = 11), AlasKG10015 (n = 13) AlasKG10015;btl>Alas (n = 11). (H) Quantitative real-time RT-PCR showing a significant difference in pan-embryonic Alas mRNA levels between WT and ykiB5 mutants at stage 17. No significant difference was detected in duox mRNA levels. ykiB5 (n = 200), WT (n = 200). Three biological replicates were performed per genotype per gene. (I) Quantification of δ-ALA concentration in WT (400), ykiB5 (400), and AlasKG10015 (400) stage 17 embryos. Three biological replicates were performed per genotype. Error bars represent SEM.
Alas is an enzyme that initiates the heme biosynthetic pathway by catalyzing the production of δ-aminolevulinic acid (δ-ALA). The δ-ALA concentration was reduced in whole yki and Alas embryos by 90% and 75%, respectively, compared with WT (Fig. 3 I). Our data indicate that Yki controls Alas transcription to regulate extracellular dityrosine-dependent barrier formation in the tracheae, required for forming waterproof tracheal tubes.
Yki controls tracheal tube length by regulating the actin-depolymerizing factor Twinstar (Tsr)/Cofilin
In contrast to yki mutants, Alas mutants do not exhibit overelongated DTs (Fig. 3, A′ and C′; and Fig. S4, A–C), suggesting that Yki-mediated regulation of tube expansion is independent of Alas. Furthermore, the observation that Diap1 only partially rescues tube length defects in yki mutants points to an additional, Diap1-independent function of Yki in determining tube size. Several genes are known to restrict tracheal tube length (Hayashi and Kondo, 2018), including those encoding SJ proteins (Zuo et al., 2013), chitin-modifying enzymes (Luschnig et al., 2006; Wang et al., 2006), polarity proteins regulating apical membrane growth (Laprise et al., 2006; Dong et al., 2014), and cytoskeletal proteins and their regulators (Hayashi and Kondo, 2018). As shown above, yki mutant tracheae bear normal SJs and secrete Verm and Serp normally into the lumen. Localization of the apical determinant Crb and aPKC were not affected in yki mutants (Fig. S4, D–E′). Finally, genetic interaction experiments between yki and Src42a, which encodes a tyrosine kinase, revealed that the two genes act in parallel pathways to regulate tracheal tube length (Robbins et al., 2014). Taken together, our analysis identified a function of Yki in the control of tracheal tube length, independent of SJs, luminal matrix deposition, and apical polarity.
To unveil the molecular mechanism by which Yki regulates tube length expansion, we immunoprecipitated Yki-V5, expressed in the trachea, and performed mass spectrometry analysis. One of the proteins found to associate with Yki was Tsr, the Drosophila orthologue of the vertebrate Cofilin/ADF (Fig. S4 G). Recent studies have implicated Tsr in cell survival, tissue growth, and tissue integrity of Drosophila wing imaginal discs by regulating Yki and JNK signaling (Ko et al., 2016). To further confirm that Yki and Tsr are found in the same complex, we examined their interaction in embryonic tracheae and wing imaginal discs. Yki-V5 precipitated Tsr from protein lysates of embryonic tracheae (Fig. 4 A). Further, an in situ proximity ligation assay (PLA; Söderberg et al., 2006; Fig. 4, B–C″) and bimolecular fluorescence complementation (BiFC; Hu et al., 2002; Fig. 4, D–D″) both confirmed that the two proteins, when expressed in wing imaginal discs, were found in close proximity. From these results, we conclude that Yki and Tsr physically interact (directly or indirectly) to form a protein complex.
Figure 4.

Tsr and Yki interact. (A) Tsr coimmunoprecipitates with Yki from embryo lysates expressing Yki-V5 in tracheal cells. btl-Gal4 alone was used as a negative control. IP, immunoprecipitate; WB, Western blot. (B–C″) PLA of Tsr and Yki in wing imaginal discs. Wing discs from en>GFP,yki-V5 (control) and en>GFP,yki-V5,tsr were labeled with anti-V5 and anti-Tsr to perform PLA assays. The Yki-V5 expression domain is marked by GFP. (D–D″) BiFC of Yki and Tsr complexes in wing imaginal discs. (D) Depicted are the relative BiFC intensity of complexes as compared with control. (D′) GFP fluorescence upon Yki and Tsr complex formation (n = 19). (D″) Negative control (n = 16). Error bars represent SEM. Scale bars: 50 µm.
To find out whether Tsr and Yki function together to regulate tube size, we analyzed the function of Tsr in the tracheae using two different alleles, tsrk05633 and tsrN96A (Wahlström et al., 2001; Ng and Luo, 2004). Strikingly, tsr mutant embryos exhibited overelongated tracheal tubes, similar to yki mutants (Fig. 5, A–C and E; and Fig. S4, H–J). This phenotype is due to a specific function of Tsr in the trachea, since tracheal-specific expression of a tsr cDNA by btl-GAL4 rescued the overelongated tubes of tsr mutants (Fig. 5, F–H). In contrast to yki, however, tsr mutants showed proper tracheal gas filling (Fig. S4, K and L) and a normal paracellular barrier of the tracheal tubes (Fig. S4, M and N). These results indicate that tsr functions in tube size control, but not in gas filling.
Figure 5.

Tsr and Yki act in interconnected pathways to regulate tracheal tube elongation. (A–E) Loss of function of tsr (B) causes convoluted DT, similar to loss of yki (C). (D) This phenotype is enhanced in tsrk05633; ykiB5 double mutants. Scale bar: 50 µm. (E) Quantification of DT length of WT (n = 10), ykiB5 (n = 11), tsrk05633 (n = 9), and tsrk05633; ykiB5 (n = 8) mutants. The DT of tsrk05633; ykiB5 double mutants is significantly longer than that of ykiB5 and tsrk05633 single mutants. (F–M) Tracheal expression of either Tsr (H and L) or Yki (I and M) using btl-Gal4 rescues DT elongation defects of tsrk05633 (H and I) and ykiB5 (L and M) mutants. Scale bar: 20 µm. (N) Relative expression of tsr mRNA in WT, ykiB5 and tsrk05633 mutant embryos at stage 17. tsr mRNA levels are not significantly altered in the absence of yki. 200 embryos were used per genotype. Three biological replicates were performed per genotype. (O) Relative expression of yki mRNA in WT, ykiB5, and tsrk05633 mutant embryos of stage 17. yki mRNA levels are not significantly altered in the absence of Tsr. 200 embryos were used per genotype. Three biological replicates were performed per genotype. (P) Western blot of protein lysates from WT, ykiB5, and tsrk05633 mutant embryos at stage 17. Note that the protein levels of Tsr and Yki are reduced in the respective other mutant. (Q and R) Quantification of the immunoblot in (P) using Fiji, based on the intensity of Yki (Q) and Tsr (R) protein, normalized to the loading control (α-Tubulin; n = 3). (S) Relative expression of diap1 mRNA in WT, ykiB5, and tsrk05633 mutant embryos at stage 17. Results were normalized to an endogenous control (actin-5C). Note that Diap1 is significantly down-regulated in yki mutants but significantly up-regulated in tsr mutants. 200 embryos were used per genotype. Three biological replicates were performed per genotype. Error bars represent SEM.
The similar tracheal phenotypes of tsr and yki mutants raised the possibility that Yki and Tsr act in the same pathway to control DT length. Strikingly, ykiB5,tsrk05633 double mutants had even longer tubes compared with those of yki and tsr single mutants, suggesting that yki and tsr act in parallel pathways to regulate tube size (Fig. 5, D and E). To determine whether there is any connection between the two pathways in regulating tracheal tube length, we expressed yki in the tracheae of tsr mutants. In these embryos, tracheal tube length was restored and comparable to that of control embryos (Fig. 5, F–I). Likewise, expression of tsr reversed the yki tube elongation phenotype (Fig. 5, J–M). These data support the conclusion that tsr and yki act in parallel yet interconnected pathways.
Tsr regulates Yki nuclear activity
Yki-binding sites were identified in the regulatory sequences of tsr (Nagaraj et al., 2012), suggesting a transcriptional regulation of tsr by Yki in imaginal discs. To determine the functional relationship between Tsr and Yki in the developing airways, we asked how they cooperate to control tube length. We found no significant change in tsr mRNA levels between control and stage 17 yki mutants by quantitative real-time PCR (Fig. 5 N), while yki mRNA was undetectable in yki mutants at this stage (Fig. 5 O). Therefore, we asked whether this is owed to maternal Yki protein, which can be detected in unfertilized eggs (Fig. 6 A). We determined the Yki lifetime to be 11–16 h in S2 cells (t1/2 ∼3 h). Assuming a similar lifetime in embryos suggested the absence of Yki protein (maternal and zygotic) in stage 17 yki mutants, at which point tsr transcripts were analyzed (Fig. 6, B and C; and Fig. 5, P–R). From this, we conclude that tsr is not a transcriptional target of yki in the embryo (or the tracheae).
Figure 6.

Yki and Tsr are maternally contributed. (A) Western blot of protein lysates from unfertilized eggs of ykiB5 and tsrk05633 heterozygote females. (B) Western blots from cell lysates of S2 cells expressing Yki and Tsr, treated with cycloheximide (CHX) for 0–6 h. Tubulin is used as a loading control. (C) Degradation kinetics (), derived from B, shows the level of Vn-Yki in S2 cells after protein synthesis inhibition by cycloheximide. 0–18 refer to hours after CHX addition. Data were collected from two independent experiments. (D) Cofilin knockdown in HEK293T cells expressing GFP-Cofilin reduces YAP total protein levels as well as YAP phosphorylation at S381 and S127. Tubulin was used as loading control.
How then is Tsr regulated? Interestingly, unlike tsr transcripts, Tsr protein levels were reduced in stage 17 yki mutant embryos. We also observed a mutual regulation between Yki and Tsr in that Yki protein is also reduced in tsr mutant embryos (Fig. 5, P–R). To determine whether the Tsr-dependent changes in Yki levels go along with changes in Yki transcriptional activity, we analyzed in vivo the transcription of one if its target genes, Diap1. Diap1 mRNA levels were significantly reduced in yki mutant embryos but increased approximately twofold in tsr mutants (Fig. 5 S). To determine whether this increase in diap1 transcription is also observed in the tracheae, we used the yki transcriptional reporter Diap1-lacZ-NLS (Ryoo et al., 2002). In fact, the reporter showed stronger expression in tracheal cells of tsr mutants and yki-overexpressing tracheal tubes (Fig. 7, A, B, and D). In contrast, yki mutants of the same stage showed reduced or absent expression of the reporter (Fig. 7 C). Expression of other yki target genes, such as expanded and Myc, is significantly up-regulated upon tracheal-specific overexpression of yki and is down-regulated in yki mutants (Fig. 7 E). These results indicate that the transcription of several target genes is impaired in yki mutant embryos.
Figure 7.

Tsr regulates Yki nuclear localization and the expression of its target gene, diap1. (A–D) tsr mutant tracheal cells of stage 17 embryos show increased levels of Yki-target gene Diap1-lacZ (A) as compared with the control (B). In contrast, ykiB5 mutant tracheal cells of stage 17 embryos (C) show absent of Diap1-lacZ, whereas tracheal cells overexpressing Yki show increased levels of Diap1-lacZ (D). (E) Relative expression of diap1, expanded (ex), and Myc mRNA in WT, ykiB5, and yki-overexpressing embryos of stage 17. Results were normalized to an endogenous control (actin-5C). 200 embryos were used per genotype. Three biological replicates were performed per genotype per gene. Error bars represent SEM.
Yki activity is mostly controlled by phosphorylation of S168 (in Yki) and S127/S381 (in Yki/YAP). Phosphorylated Yki/YAP is retained in the cytoplasm, while nonphosphorylated Yki/YAP can enter the nucleus and activate target gene transcription (Oh and Irvine, 2011). Using the phosphate-binding tag method (Kinoshita et al., 2006) to capture the phosphorylated form of Yki in embryonic lysates, we could not draw any meaningful conclusion due to low p-Yki levels. However, since this regulation seems to be conserved in vertebrates, we addressed this question in HEK293T cells. In this experiment, we used cofilin siRNA to down-regulate its expression levels. We observed a reduction in total YAP as well as in phosphorylated YAP (indicated by pS127-YAP and pS381-YAP) levels (Fig. 6 D). These results suggest that both the amount and the phosphorylation status of Yki depend on Tsr.
Taken together, our data suggest that Tsr is an inhibitor of Yki nuclear localization and transcriptional activity.
Yki and Tsr cooperate to coordinate apical membrane expansion
Increased tube elongation in yki mutants is not caused by an increase in cell number (Fig. S5, A and B), suggesting a different cellular/molecular mechanism, e.g., changes in cell shape. To quantify cell shape, we examined the apical and basal domains of tracheal cells, marked by Uninflatable (Uif) and Perlecan, respectively. In WT embryos, the two membrane markers are lined approximately parallel along the tube axis (Fig. 8, A–A″ and C–C″). In contrast, the DTs of yki (Fig. 8, B–B″) and tsrk05633 (Fig. 8, D–D″) mutants have increased apical membrane with irregular shape, but do not display an affected basal membrane size, suggesting that only the apical membranes of tracheal cells are overelongated. Quantification of the adherens junction protein Echinoid (Ed) revealed significant increase in the surface of the apical membrane of ∼17.2% in yki and 18.3% in tsr mutants (Fig. 8, F, J, M, and N), compared with WT cells (Fig. 8, E, I, M, and N). In line with the mutual stabilization of Tsr and Yki at the protein level (Fig. 5, P–R), tracheal-specific expression of tsr or yki rescued the yki and tsr expansion defects, respectively (Fig. 8, G, K, M, and N). We conclude that increased apical membrane size is responsible for changes of tracheal epithelial cells that induce changes in tube length through Tsr/Yki.
Figure 8.

Apical membrane expansion contributes to tube over-elongation in yki and tsr mutant embryos. (A–D″) Stage 17 WT (A–A″ and C–C″) and ykiB5 mutant (B–B″ and D–D″) embryos stained with Uif to label the apical membrane (A′–D′ and A″–D″, magenta) and Perlecan to label the basement membrane (A–D and A″–D″, green). Scale bars: 20 µm. (E–L) Stage 17 embryos stained with Ed to outline the apical surface of DT cells. Scale bars: 10 µm. (M) Quantification of the apical surface of ykiB5 and control embryos. A significant increase of the apical surface area is observed in ykiB5 mutants compared with WT. Apical surface area is restored upon tracheal-specific expression of tsr or yki in ykiB5 mutant embryos. ykiB5 (n = 45), ykiB5;btl>Tsr (n = 32), ykiB5;btl>Yki (n = 25), WT (n = 38). Error bars represent SEM. (N) Quantification of the apical surface of tsrk05633 and control embryos. A significant increase of the apical surface area is observed in tsrk05633 mutants compared with WT embryos. Apical surface area is restored upon tracheal-specific expression of tsr or yki in tsrk05633 mutant embryos. WT (n = 31), tsrk05633 (n = 48), tsrk05633;btl>Tsr (n = 25), tsrk05633;btl>Yki (n = 27). Error bars represent SEM.
Loss of Tsr and Yki affects tube length through changes in filamentous actin (F-actin) organization
We next sought to further study the functional link between Yki and Tsr in apical membrane–mediated tube size control. Loss of tsr or yki (this work) and stabilized/increased F-actin both cause cell polarity–independent overgrowth (Sansores-Garcia et al., 2011; Schottenfeld-Roames et al., 2014). In addition, increased F-actin at the apical surface enhances Yki-mediated gene expression in wing imaginal discs (Fernández et al., 2011). Decreased cortical F-actin can lead to increased expansion of the apical cell membrane due to lack of the formation of a contractile network (Haigo et al., 2003; Lee and Harland, 2007; Kinoshita et al., 2008; Spencer et al., 2015; Forest et al., 2018; Tsoumpekos et al., 2018). These observations suggested a link between the loss of yki and F-actin modulation. Tsr is an actin-severing factor that catalyzes F-actin disassembly (Bamburg, 1999). Therefore, we investigated F-actin distribution in yki and tsr mutants. In stage 17 WT embryos, F-actin (marked by Utrophin and Lifeact) is enriched at the apical cortex of WT tracheal cells (Fig. 9, A, A′, C and C′). F-Actin accumulates even more in the apical cortex of DT cells of tsr (Fig. 9, B and B′) and yki (Fig. 9, D and D′) mutants, compared with the WT. To better follow Yki localization, we generated an endogenous CRISPR knock-in line expressing an N-terminal–tagged form of Yki (mKate2-yki). mKate-yki flies are homozygous viable and fertile, indicating that the generated yki allele is nondisruptive, as it rescues a yki null mutation in transheterozygous animals (Fig. S5, C and D).
Figure 9.

Yki is enriched apically in DT cells and mutants of tsr and yki exhibit increased apical F-actin. (A–D′) Maximum intensity projections of stage 17 embryos expressing Utrophin-GFP (A–D) and Lifeact-RFP (btl>Lifeact-RFP; A′–D′) to show the apical F-actin enrichment in WT (A, A′, C, and C′), tsrk05633 (B and B′), and ykiB5 (D and D′) mutants. Scale bars: 20 µm. (F–F″′) Live imaging of mKate2-Yki dynamics during late tracheal development using endogenous mKate2-Yki. Apical Yki intensity increases with time (yellow arrowheads). Scale bar: 100 µm. (G–H′) Confocal images of WT (G and G′) and ykiB5 mutant (H and H′) embryos stained with anti-Yki (G and H) and WGA (green; G′ and H′) to label the lumen (outlined by dashed lines). In WT embryos, Yki is enriched at the apical cortex (marked by red dashed line) of tracheal cells (G), whereas ykiB5 mutants completely lack Yki cortical labeling (H). Scale bar: 10 µm.
At 17 h after egg-laying (AEL), mKate2-Yki starts accumulating at the apical cortex. This apical enrichment of Yki becomes progressively more prominent at 20 h AEL (Fig. 9, F–F′″; and Fig. S5 E). This pattern mirrors the endogenous Yki localization, since WT tracheal tubes of stage 17 embryos, stained with a Yki-specific antibody, showed a similar apical enrichment, which was hardly detectable in yki mutant embryos (Fig. 9 G–H′). To quantify the endogenous amount of Yki in the apical cortex of tracheal cells in comparison to that in other cellular compartments, such as the nucleus and the residual cytoplasm (Fig. 10 A), we performed fluorescence correlation spectroscopy (FCS) experiments (a summary on FCS methodology is outlined in Materials and methods; Vukojević et al., 2005; Vukojevic et al., 2010; Papadopoulos et al., 2019) in confocal sections of the cortical cellular domain and in sections of the noncortical cytoplasm in tracheae of stage 17 embryos (Fig. 10 B). We performed FCS measurements using a rescuing construct of yki, btl>yki-GFP (Oh and Irvine, 2008), the endogenously tagged mKate2-Yki, or a rescuing yki-YFP BAC transgene in yki mutant background (Su et al., 2017). The concentrations of overexpressed Yki-GFP and endogenous mKate2-Yki were significantly higher in the apical cortex of WT tracheal cells and decreased from the cortex to the cytoplasm to the nucleus (Fig. 10, C, E, and G). FCS allowed us to discern the relative fractions of fast-diffusing versus slowly diffusing Yki-GFP molecules in these compartments, which indicate the percentage of total Yki molecules that are presumably docked to larger immobile structures, as compared with freely moving molecules in each of the cellular compartments. A higher fraction of slowly diffusing Yki-GFP and mKate2-Yki molecules was observed in the cortex compared with the cytoplasm and the nucleus (Fig. 10, D, F, and H). In contrast, in tsr mutants, more Yki molecules were found in the nucleus, whereas cortical Yki showed high mobility, indicating decreased binding (Fig. 10, C–H′). In fact, a higher accumulation of apical Yki was observed in WT tracheae cells as compared with tsr mutant cells (Fig. 10, G and compare I with J). We conclude that in tracheal cells, Tsr allows a higher fraction of Yki to be stabilized at the apical cortex.
Figure 10.

Yki shows the highest concentration at the apical membrane of DT cells. (A) Cortical and cytoplasmic sections of the tracheal lumen of stage 17 embryos expressing Yki-GFP by btl-Gal4. Scale bars: 5 µm. (B) Schematic representation of the different tracheal cell areas in which the concentration of Yki-GFP was determined by FCS. (C) Relative Yki-GFP concentrations in WT and tsrk05633 trachea cells, determined by FCS in the cortical and cytoplasmic sections, as well as in the nucleus. (D) Relative fractions of slowly diffusing Yki-GFP molecules in WT and tsrk05633 trachea cells, measured by FCS. A relatively higher amount of slowly diffusing Yki-GFP molecules is found in the cortex as compared with the cytoplasmic area or the nucleus, suggesting more pronounced stabilization in the cortex. (E) Average FCS curves of Yki-GFP in WT and tsrk05633 trachea cells in the cortex, cytoplasm, and nucleus. The concentration increases from nucleus to cytoplasm to cortex, as shown also in C. (F) Normalized average FCS curves to the same amplitude, G(τ) = 1, allow comparison of the diffusion of Yki-GFP in WT and tsrk05633 tracheal cells in the investigated cellular compartments. Yki-GFP displays increasingly slower diffusion from the nucleus to the cytoplasm to the cortex (n = 36 cells). (G) Average FCS curves of mKate2-Yki and Yki-GFP in tsr mutants (tsrk05633,ykiB5; yki-GFP [BAC]) in the cortex, cytoplasm, and nucleus. The concentration increases from nucleus to cytoplasm to cortex in WT cells whereas it decreases in tsrk05633,ykiB5 mutant cells. n = 20–30 counts per sample. Error bars represent SEM. (H) Normalized average FCS curves to the same amplitude, G(τ) = 1, allow comparison of the diffusion of mKate2-Yki and Yki-GFP (expressed from a rescuing BAC transgene) in yki,tsr mutants (tsrk05633,ykiB5; yki-GFP [BAC]) in the investigated cellular compartments. mKate2-Yki displays increasingly slower diffusion from the nucleus to the cytoplasm to the cortex (n = 27 cells), whereas Yki-GFP in the yki,tsr mutants shows the opposite behavior. Error bars represent SEM. (I and J) Tracheal tubes of stage 16 WT yki-GFP (BAC; I) and tsrk05633,ykiB5; yki-GFP (BAC; J), stained with GFP (white) and the luminal marker Gasp (magenta). Yellow arrows indicate the apical accumulation of Yki. Scale bars: 10 µm. (K–M) Model. (K) In WT cells, Yki (green) and Tsr (blue) cooperate in the apical cell cortex to regulate membrane size and subsequently tissue growth. Tsr is a negative regulator of Yki nuclear translocation. Only a small portion of Yki is able to localize to the nucleus and transcribe Yki-target genes (e.g., Diap1) necessary for tissue growth, or genes required for tissue water tightness and gas filling (e.g., Alas). F-Actin is marked in magenta. (L) In the absence of Yki, Tsr protein levels are reduced, resulting in increased apical F-actin (magenta) and membrane growth. Yki target genes for tissue growth and water tightness are no longer transcribed (crossed-out arrows), resulting in elongated tubes with defects in gas filing. (M) In the absence of Tsr, Yki protein levels are reduced and not maintained apically, allowing Yki molecules to translocate to the nucleus, resulting in stronger diap1 transcription (thicker arrows). However, higher Diap1 levels do not account for abnormal tube elongation. Rather, F-actin accumulates apically and apical membrane growth is increased, leading in longer tubes. F-Actin is marked in magenta. Asterisks delineate p-values as follows: *, P < 0.05; **, P < 0.01; ***, P < 0.001.
Taken together, our results indicate a synergy of Tsr and Yki in the regulation of the apical actin cytoskeleton to modulate the size of the apical surface of tracheal cells and thereby restrict tube elongation.
Discussion
The data presented here reveal a dual function of Drosophila Yki in tracheal development. Yki is required both to ensure cuticle water tightness and to restrict tube length.
yki mutant embryos fail to generate functional gas-filled airways due to an improper apical extracellular dityrosine network, a structural constituent of the aECM important for tissue integrity. We attribute this function to Alas, mutations of which phenocopy the gas-filling defects of yki mutants. We show that Alas is a transcriptional target of yki and overexpression of Alas rescues the apical intercellular barrier abnormalities and gas-filling defects of yki mutant embryos, but not the abnormal tube elongation. Therefore, we conclude that yki regulates tube impermeability through Alas.
Second, we unveil a molecular mechanism by which Yki restricts tube length in Drosophila airways. We identified Drosophila Tsr/Cofilin as the most abundant Yki interactor in tracheal tissue. Tsr/Cofilin has been shown to bind and sever F-actin, causing its depolymerization (Moon and Drubin, 1995; Andrianantoandro and Pollard, 2006; Bernstein and Bamburg, 2010). Regulation of Tsr/Cofilin is critical for adjusting actin dynamics during tissue morphogenesis (Kiuchi et al., 2011). Here, our data suggest that Tsr forms a complex with Yki to restrict tracheal tube elongation through regulation of actin polymerization. Depletion of either tsr or yki results in increased cortical F-actin; the apical membrane expands, and thus tubes grow in length. This finding is in line with studies showing that disassembly of F-actin fosters apical constriction in cells of the early fly embryo (Jodoin et al., 2015). The observed Yki–Tsr interplay is consistent with findings in mammary epithelial cells (Aragona et al., 2013) and in cells of the Drosophila wing epithelium (Ko et al., 2016). Cofilin/Tsr depletion in these cells induces up-regulation of YAP/TAZ/Yki target genes, such as mammalian CTGF (connective tissue growth factor) or Diap1 and expanded (Aragona et al., 2013; Ko et al., 2016). Additionally, studies of the role of apical F-actin in seamless tracheal tubes have revealed that, upon depletion of Tsr/Cofilin, abnormal apical cysts form in the tracheal cells. This has been attributed to increased F-actin stability, resulting in apical domain growth (Schottenfeld-Roames et al., 2014). However, in other cases, decreased cortical F-actin leads to increased expansion of the apical cell membrane due to lack of the formation of a contractile network (Haigo et al., 2003; Lee and Harland, 2007; Kinoshita et al., 2008; Spencer et al., 2015; Forest et al., 2018; Tsoumpekos et al., 2018), pointing to cell type–specific consequences of apical actin modulation.
How does accumulation of F-actin control Yki activity and thus contributes to organ growth? Mechanical forces, transmitted through the aECM, junctions, or the cytoskeleton act as upstream regulators of Yki in both Drosophila and human cells during development (Schroeder and Halder, 2012; Dong and Hayashi, 2015; Sun and Irvine, 2016; Elbediwy and Thompson, 2018). However, our results suggest that the relation between Yki activity and the actin cytoskeleton is not unidirectional and that Yki feeds back to the cytoskeleton via the regulation of Tsr (Choi, 2018).
Based on our results, we propose a model in which Yki regulates development of the tracheal tubes by at least two mechanisms (Fig. 10, K–M). First, apical Yki binds to Tsr and facilitates the docking of a pool of Yki molecules to the apical actin cortex, thereby limiting its nuclear accumulation, a requirement for transcription of target genes, such as Diap1 (Fig. 10 K). These findings, together with previous observations in wing imaginal disc (Xu et al., 2018), point to a transcription-independent role of Yki in the apical cell cortex. Second, residual Yki molecules, which do not bind Tsr, are free to translocate to the nucleus and transcribe Alas to regulate cross-linking of cuticular proteins and other genes (Diap1) to control tissue size (Fig. 10 K). Thereby, yki regulates tissue size and contributes to the establishment of an extracellular barrier necessary for tissue tightness and tracheal gas filling.
Absence of Yki lowers Tsr levels and increases apical F-actin accumulation (Fig. 10 L). Also, absence of Yki prevents transcription of Alas, giving rise to water-permeable tubes, and reduces Diap1 transcription. Similarly, in the absence of Tsr, the total amount of Yki is decreased, but more Yki molecules can translocate to the nucleus to transcribe higher levels of Yki-target genes (e.g., Alas and Diap1; Fig. 10 M). At the same time, apical F-actin accumulates. We propose that increased apical F-actin, rather than increased expression of Diap1, leads to overelongation of the tracheal tubes in tsr mutants. Tsr must also be signaling through F-actin to control tube length independently of the Yki/Diap1 pathway. Three lines of evidence favor this: (1) yki,tsr double mutants show more severe tube length defects than single mutants, indicating that Tsr does not only signal through Yki/Diap1 (Fig. 5, D and E); (2) expression of yki in tsr mutants restores normal tube length; and (3) expression of Diap1 partly rescues yki mutants (Fig. 1 E), but not tsr mutants (data not shown).
Taken together, our data uncover a dual role of Yki in tracheal development. Yki is required for proper gas filling and tube growth, two processes that seem to be uncoupled. Our results contribute to further our understanding of the link between cortical actin organization and apical Yki activity in growth regulation, which could be of importance in the emergence and progression of human diseases.
Materials and methods
Fly stocks
The following Drosophila stocks were used: w; ykiB5,FRT42D/CyO (kindly provided by D.J. Pan, University of Texas Southwestern, Dallas, TX), UAS-yki.GFP 4–9-Y (third chromosome, kindly provided by Kenneth Irvine, Waksman Institute, Piscataway, NJ), Yki-YFP (BAC; third chromosome, kindly provided by Richard Fehon, University of Chicago, Chicago, IL), w; Mtfex234/TM6C,dfd-YFP (Tiklová et al., 2010), yw; P{w[+mC]=lacW}Diap1[j5C8]/TM3,Sb (Bloomington Drosophila Stock Center [BDSC] ID 12093), yw; P{w[+mC]=lacW}tsr[k05633]/CyO (BDSC ID 12201), yw; P{w[+mW.hs]=FRT(w[hs])}G13 tsr[N96A]/CyO (BDSC ID 9108), hpo42-48/CyO (kindly provided by D.J. Pan), w*; sp/Cyo; Utr::GFP, Sqh::mCherry/TM3 (kindly provided by Adam Martin, Massachusetts Institute of Technology, Cambridge, MA), w*; snaSco/CyO; P{UASt-Lifeact-RFP} (BDSC ID 58362). For rescue experiments, w; P{w[+mC]=UAS-DIAP1.H} (BDSC ID 6657) w; P{yw[+mC]=UAS-yki.V5.O}attP2 (BDSC ID 28819), yw; P{w[+mC]=UAS-tsr.N}/TM6B,Tb (BDSC ID 9235) were used. Crosses for ectopic expression using btl-GAL4, w; en-Gal4,UAS.GFP (kindly provided by Georg Halder, University of Basel, Basel, Switzerland) were performed at 29°C. In all experiments CyO, TM3, and TM6C balancer strains carrying YFP transgenes were used to identify embryos of the appropriate genotypes.
Generation of transgenic flies
To generate the UAS-Alas transgenic line, the alas cDNA (FI09607; obtained from the Drosophila Genomics Resource Center) was cloned into pJFRC-MUH vector and injected into VK33 fly strain. UAS-Vc.yki (Vc is the C-terminal fragment of GFP) and UAS-Vn.Tsr (Vn is the N-terminal fragment of GFP) were generated by cloning of yki and tsr cDNA (LD21311 and LD06785 obtained from the Drosophila Genomics Resource Center) into the pJFRC-MUH vector and injected into VK33 and attp40 fly strains, respectively.
Cas9 genome engineering of yki
An N-terminal mKate2-Yki knock-in chromosome was generated by CRISPR-Cas9 genomic editing using the Scarless gene editing design (Gratz et al., 2013), introducing and excisable TTAA-3xP3-dsRed-TTAA cassette originally removed by the PiggyBac transposase (Bruckner et al., 2017). The donor vector was modified to be resistant to Cas9 cleavage and bear the mKate2 and dsRed cassettes. The following sequences were used: (a) yki gRNA, 5′-CCTTCTTCACGCCCCCGGCGCCC-3′; (b) yki gRNA modified sequence in the donor vector, 5′-CGTTTTTTACCCCGCCCGCCCCG-3′; (c) donor vector for Yki knock-in with dsRed excisable cassette (see the supplemental data PDF for the complete vector donor sequence).
SJ permeability assay
Stage 16.4 embryos (15.5 h AEL) were injected with 10 kD Rhodamine-Dextran, and dye diffusion across epithelia of the DT was monitored by confocal microscopy 1 h (60 min) to 4 h (240 min) after injection. Images were acquired with Zeiss LSM 510 Meta and Zeiss LSM 880 confocal microscopes and processed with Fiji.
Quantitative Real-Time RT-PCR
Total RNA was extracted from 150 embryos using Ambion RNAqueous kit. cDNA was synthesized using the reverse transcription Master Mix (Applied Biosystems). Real-time PCR was performed using primer sequences of (a) Alas forward primer, 5′-ACGGAACGTCTCCTACCTGA-3′; (b) Alas reverse primer, 5′-TGCAGGTAGTGTCCGAATTG-3′; (c) Duox forward primer, 5′-AGAAAGCAAAAATCGAGTGC-3′; (d) Duox reverse primer, 5′-CGGTCTGACTATACATTTTCTCATAA-3′; (e) tsr forward primer, 5′-TGTGCGAAATAACCGACCAA-3′; (f) tsr reverse primer, 5′-ACACCAGAAGCCATTTTTCCT-3′; (g) yki forward primer, 5′-GCGCCTTGCCGCCGG-3′; (h) yki reverse primer, 5′-GCTGGCGATATTGGA-3′; (i) Diap1 forward primer, 5′-TCGTCAAATCTCAAC-3′; (j) Diap1 reverse primer, 5′-TGAAGTCGAAACTTG-3′. The experiments were performed for each genotype in triplicate and each experiment was repeated at least three times. Actin probe was used to normalize the total mRNA levels.
Immunohistochemistry
The following antibodies were used at the indicated dilutions: mouse anti-Coracle (1:100; Developmental Studies Hybridoma Bank), rabbit anti-Serp (1:300; Luschnig et al., 2006), fluorescein-conjugated ChtB (1:500; New England Biolabs), guinea pig anti-Verm (1:500; Tsarouhas et al., 2007), mouse anti-Crb (Cq4; 1:10; Developmental Studies Hybridoma Bank), mouse anti-Hnt (1:100; Developmental Studies Hybridoma Bank), guinea pig anti-Yurt (1:1,000; gift from Ulrich Tepass, University of Toronto, Toronto, Canada), mouse anti-Mega (1:100; gift from Reinhard Schuh, Max-Planck Institute for Biophysical Chemistry, Göttingen, Germany), guinea pig anti-Contactin (1:1,500; gift from Manzoor Bhat, University of Texas Health Science Center, San Antonio, TX), mouse anti-Fasciclin III (1:10; Developmental Studies Hybridoma Bank), rabbit anti-Varicose (1:500; Bachmann et al., 2008), guinea pig anti-Gasp (1:800; Tsarouhas et al., 2007), rabbit anti-Tsr (1:400; this study), rabbit anti-Ed (1:1,000; gift from Laura Nilson, McGill University, Montreal, Canada), guinea pig anti-Uif (1:20; gift from Robert Ward, University of Kansas, Lawrence, KS), rabbit anti-Perlecan (1:1,000; gift from Stefan Baumgartner, Lund University, Lund, Sweden), mouse anti-dityrosine (1:200; catalog number MDT-020P; Japan Institute for the Control of Aging), rabbit anti-Yki (1:200 for immunofluorescence and 1:1,000 for Western blots; gift from Kenneth Irvine) guinea pig anti-Gasp (1:1,000; Tsarouhas et al., 2007), WGA (1:200; Thermo Fischer Scientific), and chitin binding probe-633 (1:20; gift from Maria Leptin, European Molecular Biology Laboratory, Heidelberg, Germany). Secondary antibodies conjugated to Cy3 (Jackson Immunochemicals) or Alexa Fluor 488, 568, and 633 (Molecular Probes) were used at 1:400 dilution. DAPI nuclear stain (Sigma-Aldrich) was used at a dilution of 1:4,000. Images were obtained with a Zeiss LSM 510 Meta, a Zeiss LSM 800, a Zeiss LSM 880 Airyscan, and a Leica SP5 confocal setups, comprising 355, 405, 458, 477, 488, 496,514, 561, 594, and 633 nm lasers. Images were recorded at a 1,024 × 1,024pixel resolution at room temperature. Plan-Neofluar 40×/1.3 NA oil and LCI Plan-Neofluar 63×/1.4 NA oil objectives were used throughout. Images were processed with Fiji (Schindelin et al., 2012).
PLA
PLA recognizes the potential interaction of endogenous proteins using antibodies to detect proteins in close proximity to one another (<40 nm). Third-instar larva wing discs were dissected and fixed as described above. Primary antibodies against Tsr (rabbit anti-Tsr) and V5 epitope (mouse anti-V5; Invitrogen) were added and incubated overnight at 4°C. The Duolink PLA Kit (Sigma-Aldrich) was used to incubate the tissue with the PLA probes PLUS and MINUS at 37°C for 1 h. Ligation of the PLA oligonucleotides and amplification were performed at 37°C for 30 and 100 min, respectively. Samples were mounted in Duolink mounting media and imaged using Zeiss LSM 880.
Antibody generation
Full-length tsr of GenBank nucleotide sequence RE04257 was cloned into pGEX4T2 (N-terminus GST) vector using the following primers: forward primer (BamHI), 5′-CTCGGATCCGCTTCTGGTGTAACTGTGTCTG-3′, and reverse primer (EcoRI), 5′-CTCGAATTCTTATTGGCGGTCGGTG-3′. The underlined sequences indicate primer overhangs. The protein was expressed in Escherichia coli BL21 cells, solubilized in 50 mM Tris-HCl, pH 8, and purified using GST Sepharose beads. Purified protein was dialyzed against PBS and used for antibody generation in rabbits at the Charles River Laboratories International. The rabbit anti-Tsr serum was purified by affinity purification and stored in 50% glycerol.
Immunoprecipitation
Fly embryos of the following genotypes: w−; btl-Gal4/Cyo,DfdYFP;UAS-yki.V5 and w−; btl-Gal4/Cyo,DfdYFP (as control) were used. Embryos were homogenized on ice using Dounce tissue grinder in 1ml of lysis buffer containing 130 mM NaCl, 50 mM Tris-HCL, pH 8, 0.5% Triton-X and protease inhibitor (Roche). After 30 min at 4°C under rotation the homogenate was centrifuged for 20 min at 14,000 rpm. Supernatant was incubated with the antibody for 2 h. In the meantime, 50 µl of Protein G were washed three times with blocking solution and incubated with the antibody solution overnight at 4°C. Protein G beads were collected by centrifugation for 2 min at 3,000 rpm and washed four times with lysis buffer. Beads were resuspended in 1.5× SDS sample buffer and heated for 5 min at 95°C.
Western blot
Samples were separated by SDS-PAGE and blotted onto nitrocellulose 0.45 membrane (Amersham). After blocking in 5% BSA + PBS + 0.02 % Triton X-100 , the membrane was incubated overnight with rabbit anti-Tsr diluted 1:4,000, anti-Yki diluted 1:1,000 and anti-α-Tubulin diluted 1:5,000 in blocking buffer. Peroxidase antibodies were used for detection.
Cell culture and transfection
Drosophila S2R+ cells were cultured at 25°C in Schneider’s Drosophila medium (Sigma-Aldrich) supplemented with 10% fetal bovine serum. Transfection of pAct5-Gal4 and Vn-Yki into S2R+ cells was performed with FuGENE HD (Promega) according to the manufacturer’s protocol. After 48 h, cells were treated with 100 µg/ml cycloheximide for the indicated times. Human HEK293T were grown in Dulbecco's modified Eagle's medium containing 10% fetal bovine serum and antibiotics. A TransPEI transfection method (Eurogentec) was used for DNA transfections of HEK293T cells. Cells were harvested, washed with ice-cold PBS (120 mM NaCl in phosphate buffer at pH 6.7), resuspended in lysis buffer (containing 10% glycerol, 1% Triton X-100, 1.5 mM MgCl2, 120 mM NaCl, 100 mM Pipes, pH 6.8, 3 mM CaCl2, 1 mM PMSF, and Complete). Cells were lysed on ice for 20 min and lysates were centrifuged at 14,000 rpm for 20 min at 4°C. 3× SDS sample buffer was added to supernatant and boiled for 5 min at 95°C.
shRNA
The pSUPER CFL1 human RNAi designed for the target sequence 5′-GGAGGATCTGGTGTTTATC-3′ (#A) and 5′-AGCATGAATTGCAAGCAAA-3′ (#B). The pSuper Luciferase-RNAi construct (used as control) has been previously described (Zhang and Macara, 2006) and targets the sequence 5′-CGTACGCGGAATACTTCGA-3′.
Mass spectrometry analysis
Lysates of stage 17 embryo expressing a tracheae-specific Yki-V5 construct were immunoprecipitated (described above) using the mouse anti-V5 antibody (Invitrogen). After electrophoretic separation on SDS gel and Coomassie staining, lanes were cut into 10 slices each, digested in-gel with trypsin, and subjected to gel electrophoresis followed by liquid chromatography–tandem mass spectrometry analysis.
Gel electrophoresis followed by liquid chromatography–tandem mass spectrometry analysis was performed on an Ultimate3000 nanoLC system interfaced on-line to a LTQ Orbitrap Velos hybrid tandem mass spectrometer (both Thermo Fisher Scientific). Internal standard (GluFib peptide) was spiked into each sample prior analysis. Proteins were identified by Mascot software v.2.2.04 (Matrix Sciences) by searching against Drosophila protein sequences in the NCBI database (May 2014, 231,613 entries) under the following settings: 5 ppm and 0.5 Da mass accuracy for precursor and fragment ions, respectively; enzyme specificity, trypsin; maximal number of allowed miscleavages, two; variable modifications, methionine oxidation, N-terminal protein acetylation, and cysteine propionamide. The result of the database search was evaluated by Scaffold software v. 4.3.2 (Proteome Software) using 95% and 99% probability threshold for peptides and proteins, respectively; the minimal number of matched peptides was set on two. The calculated false discovery rate (standards Scaffold feature) for peptides and proteins was <0.5%. Relative quantification of proteins was performed using MaxQuant software; absolute values of individual proteins were normalized on total protein intensity and internal standard.
δ-ALA
δ-ALA was determined by a modified method (Olakkaran et al., 2018). 400 stage 17 embryos were homogenized in sodium phosphate buffer (0.1 M, pH 8.0). 20 µl embryo homogenate and 20 µl 20% acetic acid were mixed, to which 120 µl n-butanol was added, and the mixture was vigorously shaken (∼1 min). After phase separation, the bottom layer was pipetted out and transferred to two tubes. 3× vol of a solution of 1 vol ethyl acetoacetate and 20 vol 0.5 M sodium phosphate buffer, pH 6.8, were added to one tube, and 3× vol sodium phosphate buffer was added to other tube, which was prepared as the blank. All tubes were kept in a boiling water bath for 10 min. After cooling to room temperature, 1× vol of Ehrlich reagent was added to each tube, and then the contents were mixed well. After 10 min at room temperature, 2× vol chloroform was added to all tubes and shaken vigorously (∼1 min). Absorbance of the chloroform layer was read at 555 nm. The δ-ALA concentration was calculated from a standard calibration curve of 5-ALA metabolite (A3785; Sigma-Aldrich), and values were expressed as milliMolar embryo homogenate.
Electron microscopy
Embryos and larvae were fixed in 2% Glutaraldehyde in 0.1 M phosphate buffer, pH 7.2, for 20 min at room temperature. Embryos were hand devitellinized. Both embryos and larvae were transferred in microcentrifuge tubes and fixed in 1% OsO4/2% Glutaraldehyde and then 2% OsO4. Specimens were washed and dehydrated in Araldite. Ultrathin sections of 0.1 µm were prepared and analyzed with Tecnai 12 BioTWIN (FEI Company).
Fluorescence microscopy imaging of live imaginal discs and FCS
Fluorescence imaging and FCS measurements were performed on two uniquely modified confocal laser scanning microscopy systems, both composed of the ConfoCor3 system (Zeiss) and consisting of either an inverted microscope for transmitted light and epifluorescence (Axiovert 200 M); a VIS-laser module comprising the Ar/ArKr (458, 477, 488, and 514 nm), HeNe 543-nm and HeNe 633-nm lasers, and the scanning module LSM510 META; or a Zeiss LSM780 inverted setup comprising Diode 405 nm, Ar multiline 458, 488, and 514 nm, 561-nm and HeNe 633-nm lasers (DPSS). Both instruments were modified to enable detection using silicon Avalanche Photo Detectors (SPCM-AQR-1X; PerkinElmer) for imaging and FCS. Images were recorded at a 512 × 512-pixel resolution. C-Apochromat 40×/1.2-W UV-VIS-IR objectives were used throughout. Fluorescence intensity fluctuations were recorded in arrays of 10 consecutive measurements, each measurement lasting 10 s. Averaged curves were analyzed using the software for online data analysis or exported and fitted offline using the OriginPro 8 data analysis software (OriginLab Corporation). In either case, the nonlinear least-square fitting of the autocorrelation curve was performed using the Levenberg–Marquardt algorithm. Quality of the fitting was evaluated by visual inspection and residuals analysis. Control FCS measurements to asses the detection volume were routinely performed before data acquisition using dilute solutions of known concentration of Alexa Fluor 488 dye. The variability between independent measurements reflects variability between cells rather than imprecision of FCS measurements. For more details on fluorescence microscopy imaging and FCS, see below.
Statistical analysis
Unpaired two-tailed Student’s t tests were performed to obtain the indicated P values throughout the work. t tests were used for comparisons between two groups. Values were expressed as mean ± SEM. Significance was considered when P ≤ 0.05.
Cell number counting
Stained embryos were imaged with a laser-scanning confocal microscope (LSM780; Zeiss) using a 63/1.4 NA C-Apochromat oil-immersion objective. Individual Z stacks were taken with a step size of 0.2–0.5 µm and with a total Z sampling distance of 20–30 µm. Cell number counting was based on the nuclei numbers. To separate nuclei closely adjacent to each other (and potentially yielding false negatives), a 3D Watershed segmentation method used. Z-stack binarization, Watershed digital image reconstructions, and nuclei counting were computed using ImageJ/Fiji software.
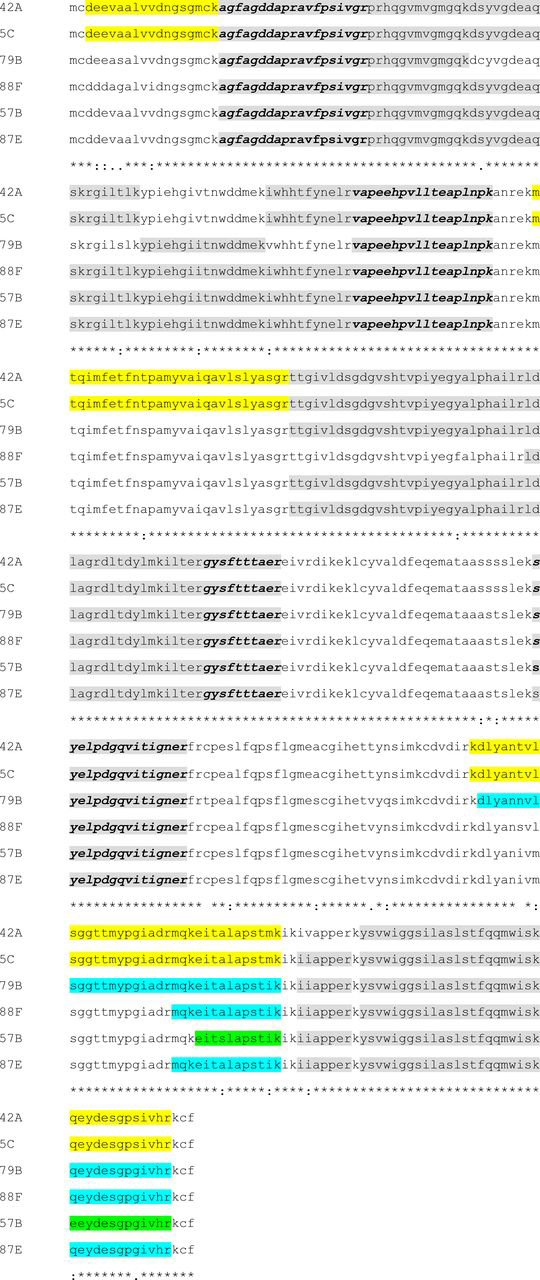
Actin peptides detected by mass spectrometry in immunoprecipitations of V5-tagged Yki and the corresponding controls
Peptides detected with mass spectrometry are highlighted with different colors: gray indicates peptides shared between all actin sequences (peptides in italic were used for relative quantification of total actin); yellow indicates peptides unique for Act5C/Act42A; blue indicates peptides unique for Act79B/Act88F/Act87E; and green indicates peptides unique for Act57B.
Background on fluorescence microscopy imaging and FCS
Two individually modified instruments (LSM 510 and 780, ConfoCor 3; Zeiss) with fully integrated FCS/confocal laser scanning microscopy (CLSM) optical pathways were used for imaging. The detection efficiency of CLSM imaging was significantly improved by the introduction of Avalanche Photo Detectors (APDs). As compared with photomultiplier tubes, which are normally used as detectors in conventional CLSM, the APDs are characterized by higher quantum yield and collection efficiency (∼70% in APDs as compared with 15–25% in photomultiplier tubes), higher gain, negligible dark current, and better efficiency in the red part of the spectrum. Enhanced fluorescence detection efficiency enabled image collection using fast scanning (1–5 µs/pixel). This enhances further the signal-to-noise-ratio by avoiding fluorescence loss due to triplet state formation, enabling fluorescence imaging with single-molecule sensitivity. In addition, low laser intensities (150–750 µW) could be applied for imaging, significantly reducing the phototoxicity (Vukojevic et al., 2008).
FCS measurements are performed by recording fluorescence intensity fluctuations in a very small, approximately ellipsoidal observation volume element (OVE; ∼0.2 µm wide and 1 µm long) that is generated in trachea epithelial cells by focusing the laser light through the microscope objective and collecting the fluorescence light through the same objective using a pinhole in front of the detector to block out-of-focus light. The fluorescence intensity fluctuations, caused by fluorescently labeled molecules passing through the OVE, are analyzed using temporal autocorrelation analysis.
In temporal autocorrelation analysis, we first derive the autocorrelation function :
where is the deviation from the mean intensity at time t and is the deviation from the mean intensity at time t + τ. For further analysis, an autocorrelation curve is derived by plotting G(τ) as a function of the lag time; i.e., the autocorrelation time τ.
To derive information about molecular numbers and their corresponding diffusion time, the experimentally obtained autocorrelation curves are compared with autocorrelation functions derived for different model systems. A model describing free 3D diffusion of two components and triplet formation was used in this study:
In the above equation, N is the average number of molecules in the OVE; y is the fraction of the slowly moving Yki-GFP molecules; is the diffusion time of the free Yki-GFP molecules; is the diffusion time of Yki-GFP molecules undergoing interactions with the DNA; and are radial and axial parameters, respectively, related to spatial properties of the OVE; T is the average equilibrium fraction of molecules in the triplet state; and is the triplet correlation time related to rate constants for intersystem crossing and the triplet decay. Spatial properties of the detection volume, represented by the square of the ratio of the axial and radial parameters,
are determined in calibration measurements performed using a solution of Rhodamine 6G dye for which the diffusion coefficient (D) is known to be (Muller et al., 2008). The diffusion time, , measured by FCS, is related to the translation diffusion coefficient D by
To establish that Yki molecules diffusing through the OVE are the underlying cause of the recorded fluorescence intensity fluctuations, we plotted the characteristic decay times and , obtained by FCS, as a function of the total concentration of Yki molecules. We observed that both characteristic decay times remain stable for increasing total concentration of Yki molecules, signifying that the underlying process triggering the fluorescence intensity fluctuations is diffusion of fluorescent Yki molecules through the OVE (which should be independent of the total concentration of Yki molecules).
Generation of the CRISPR knock-in line expressing an N-terminal-tagged form of Yki (mKate2-Yki)
The following sequences were used: (a) yki gRNA, 5′-CCTTCTTCACGCCCCCGGCGCCC-3′; (b) yki gRNA modified sequence in the donor vector, 5′-CGTTTTTTACCCCGCCCGCCCCG-3′; (c) donor vector for Yki knock-in with dsRed excisable cassette (see the supplemental data PDF for details).
Online supplemental material
Fig. S1 shows representative images and quantification of gas filling in Diap1 mutant embryos. Fig. S2 shows the localization of SJ proteins in yki and WT embryonic trachea; quantification of fluorescence intensity of antibody staining in yki mutants and WT are also shown. Fig. S3 shows that Yki levels influence the dityrosine abundance in wing discs. Fig. S4 shows that loss of Alas does not affect axial tube elongation. Fig. S5 shows that tracheal cell number does not change in ykiB5 mutant embryos. The supplemental data PDF shows the complete donor vector sequence used for generation of the mKate2-yki knock-in allele.
Supplementary Material
Acknowledgments
We are grateful to scientific community for sharing Drosophila strains and antibodies. We are indebted to Max Planck Institute of Molecular Cell Biology and Genetics facilities for the outstanding technical assistance. We also would like to thank Catrin Hälsig, Cornelia Maas, Sven Ssykor, Amelia Aragones-Hernandez, and Michaela Burkon for their technical assistance. K. Skouloudaki and D.K. Papadopoulos thank Kynthia-Athena for being the best-behaved embryo and most adorable baby in the world during the final stages of this study.
K. Skouloudaki was supported by the Wenner-Gren Stiftelserna (Wenner-Gren stipend) and the Max-Planck Society. The work at Max Planck Institute of Molecular Cell Biology and Genetics was supported by the Max-Planck Society. I. Christodoulou and D.K. Papadopoulos would like to thank the Medical Research Council, UK, and a University of Edinburgh Chancellor’s Fellowship for financial support. This work was supported by the Light Microscopy Facility (LMF) of the Center for Molecular and Cellular Bioengineering of the Technical University Dresden. The LMF is supported by a European Fund for Regional Development.
The authors declare no competing financial interests.
Author contributions: K. Skouloudaki, C. Samakovlis, and D.K. Papadopoulos conceived the project. K. Skouloudaki, I. Christodoulou, D. Khalili, V. Tsarouhas, and D.K. Papadopoulos designed and performed the experiments, analyzed the data, and prepared figures. K. Skouloudaki, C. Samakovlis, P. Tomancak, E. Knust, and D.K. Papadopoulos supervised the project. K. Skouloudaki, E. Knust, and D.K. Papadopoulos wrote the manuscript, with critical input from all authors. All authors critically reviewed the manuscript and approved it for submission.
References
- Andrianantoandro E., and Pollard T.D.. 2006. Mechanism of actin filament turnover by severing and nucleation at different concentrations of ADF/cofilin. Mol. Cell. 24:13–23. 10.1016/j.molcel.2006.08.006 [DOI] [PubMed] [Google Scholar]
- Aragona M., Panciera T., Manfrin A., Giulitti S., Michielin F., Elvassore N., Dupont S., and Piccolo S.. 2013. A mechanical checkpoint controls multicellular growth through YAP/TAZ regulation by actin-processing factors. Cell. 154:1047–1059. 10.1016/j.cell.2013.07.042 [DOI] [PubMed] [Google Scholar]
- Bachmann A., Draga M., Grawe F., and Knust E.. 2008. On the role of the MAGUK proteins encoded by Drosophila varicose during embryonic and postembryonic development. BMC Dev. Biol. 8:55 10.1186/1471-213X-8-55 [DOI] [PMC free article] [PubMed] [Google Scholar]
- Bamburg J.R. 1999. Proteins of the ADF/cofilin family: essential regulators of actin dynamics. Annu. Rev. Cell Dev. Biol. 15:185–230. 10.1146/annurev.cellbio.15.1.185 [DOI] [PubMed] [Google Scholar]
- Beitel G.J., and Krasnow M.A.. 2000. Genetic control of epithelial tube size in the Drosophila tracheal system. Development. 127:3271–3282. [DOI] [PubMed] [Google Scholar]
- Bernstein B.W., and Bamburg J.R.. 2010. ADF/cofilin: a functional node in cell biology. Trends Cell Biol. 20:187–195. 10.1016/j.tcb.2010.01.001 [DOI] [PMC free article] [PubMed] [Google Scholar]
- Bruckner J.J., Zhan H., Gratz S.J., Rao M., Ukken F., Zilberg G., and O’Connor-Giles K.M.. 2017. Fife organizes synaptic vesicles and calcium channels for high-probability neurotransmitter release. J. Cell Biol. 216:231–246. 10.1083/jcb.201601098 [DOI] [PMC free article] [PubMed] [Google Scholar]
- Choi K.W. 2018. Upstream paths for Hippo signaling in Drosophila organ development. BMB Rep. 51:134–142. 10.5483/BMBRep.2018.51.3.027 [DOI] [PMC free article] [PubMed] [Google Scholar]
- Dong B., and Hayashi S.. 2015. Shaping of biological tubes by mechanical interaction of cell and extracellular matrix. Curr. Opin. Genet. Dev. 32:129–134. 10.1016/j.gde.2015.02.009 [DOI] [PubMed] [Google Scholar]
- Dong B., Hannezo E., and Hayashi S.. 2014. Balance between apical membrane growth and luminal matrix resistance determines epithelial tubule shape. Cell Reports. 7:941–950. 10.1016/j.celrep.2014.03.066 [DOI] [PubMed] [Google Scholar]
- Edens W.A., Sharling L., Cheng G., Shapira R., Kinkade J.M., Lee T., Edens H.A., Tang X., Sullards C., Flaherty D.B., et al. 2001. Tyrosine cross-linking of extracellular matrix is catalyzed by Duox, a multidomain oxidase/peroxidase with homology to the phagocyte oxidase subunit gp91phox. J. Cell Biol. 154:879–891. 10.1083/jcb.200103132 [DOI] [PMC free article] [PubMed] [Google Scholar]
- Elbediwy A., and Thompson B.J.. 2018. Evolution of mechanotransduction via YAP/TAZ in animal epithelia. Curr. Opin. Cell Biol. 51:117–123. 10.1016/j.ceb.2018.02.003 [DOI] [PubMed] [Google Scholar]
- Fernández B.G., Gaspar P., Brás-Pereira C., Jezowska B., Rebelo S.R., and Janody F.. 2011. Actin-Capping Protein and the Hippo pathway regulate F-actin and tissue growth in Drosophila. Development. 138:2337–2346. 10.1242/dev.063545 [DOI] [PubMed] [Google Scholar]
- Forest E., Logeay R., Géminard C., Kantar D., Frayssinoux F., Heron-Milhavet L., and Djiane A.. 2018. The apical scaffold big bang binds to spectrins and regulates the growth of Drosophila melanogaster wing discs. J. Cell Biol. 217:1047–1062. 10.1083/jcb.201705107 [DOI] [PMC free article] [PubMed] [Google Scholar]
- Förster D., and Luschnig S.. 2012. Src42A-dependent polarized cell shape changes mediate epithelial tube elongation in Drosophila. Nat. Cell Biol. 14:526–534. 10.1038/ncb2456 [DOI] [PubMed] [Google Scholar]
- Fulford A., Tapon N., and Ribeiro P.S.. 2018. Upstairs, downstairs: spatial regulation of Hippo signalling. Curr. Opin. Cell Biol. 51:22–32. 10.1016/j.ceb.2017.10.006 [DOI] [PubMed] [Google Scholar]
- Garud S.S., and Willingham F.F.. 2012. Molecular analysis of cyst fluid aspiration in the diagnosis and risk assessment of cystic lesions of the pancreas. Clin. Transl. Sci. 5:102–107. 10.1111/j.1752-8062.2011.00312.x [DOI] [PMC free article] [PubMed] [Google Scholar]
- Gratz S.J., Cummings A.M., Nguyen J.N., Hamm D.C., Donohue L.K., Harrison M.M., Wildonger J., and O’Connor-Giles K.M.. 2013. Genome engineering of Drosophila with the CRISPR RNA-guided Cas9 nuclease. Genetics. 194:1029–1035. 10.1534/genetics.113.152710 [DOI] [PMC free article] [PubMed] [Google Scholar]
- Haigo S.L., Hildebrand J.D., Harland R.M., and Wallingford J.B.. 2003. Shroom induces apical constriction and is required for hingepoint formation during neural tube closure. Curr. Biol. 13:2125–2137. 10.1016/j.cub.2003.11.054 [DOI] [PubMed] [Google Scholar]
- Halder G., and Johnson R.L.. 2011. Hippo signaling: growth control and beyond. Development. 138:9–22. 10.1242/dev.045500 [DOI] [PMC free article] [PubMed] [Google Scholar]
- Hayashi S., and Kondo T.. 2018. Development and Function of the Drosophila Tracheal System. Genetics. 209:367–380. 10.1534/genetics.117.300167 [DOI] [PMC free article] [PubMed] [Google Scholar]
- Hu C.D., Chinenov Y., and Kerppola T.K.. 2002. Visualization of interactions among bZIP and Rel family proteins in living cells using bimolecular fluorescence complementation. Mol. Cell. 9:789–798. 10.1016/S1097-2765(02)00496-3 [DOI] [PubMed] [Google Scholar]
- Huang J., Wu S., Barrera J., Matthews K., and Pan D.. 2005. The Hippo signaling pathway coordinately regulates cell proliferation and apoptosis by inactivating Yorkie, the Drosophila Homolog of YAP. Cell. 122:421–434. 10.1016/j.cell.2005.06.007 [DOI] [PubMed] [Google Scholar]
- Iruela-Arispe M.L., and Beitel G.J.. 2013. Tubulogenesis. Development. 140:2851–2855. 10.1242/dev.070680 [DOI] [PMC free article] [PubMed] [Google Scholar]
- Jodoin J.N., Coravos J.S., Chanet S., Vasquez C.G., Tworoger M., Kingston E.R., Perkins L.A., Perrimon N., and Martin A.C.. 2015. Stable Force Balance between Epithelial Cells Arises from F-Actin Turnover. Dev. Cell. 35:685–697. 10.1016/j.devcel.2015.11.018 [DOI] [PMC free article] [PubMed] [Google Scholar]
- Kinoshita E., Kinoshita-Kikuta E., Takiyama K., and Koike T.. 2006. Phosphate-binding tag, a new tool to visualize phosphorylated proteins. Mol. Cell. Proteomics. 5:749–757. 10.1074/mcp.T500024-MCP200 [DOI] [PubMed] [Google Scholar]
- Kinoshita N., Sasai N., Misaki K., and Yonemura S.. 2008. Apical accumulation of Rho in the neural plate is important for neural plate cell shape change and neural tube formation. Mol. Biol. Cell. 19:2289–2299. 10.1091/mbc.e07-12-1286 [DOI] [PMC free article] [PubMed] [Google Scholar]
- Kiuchi T., Nagai T., Ohashi K., and Mizuno K.. 2011. Measurements of spatiotemporal changes in G-actin concentration reveal its effect on stimulus-induced actin assembly and lamellipodium extension. J. Cell Biol. 193:365–380. 10.1083/jcb.201101035 [DOI] [PMC free article] [PubMed] [Google Scholar]
- Ko C., Kim Y.G., Le T.P., and Choi K.W.. 2016. Twinstar/cofilin is required for regulation of epithelial integrity and tissue growth in Drosophila. Oncogene. 35:5144–5154. 10.1038/onc.2016.46 [DOI] [PubMed] [Google Scholar]
- Laprise P., Beronja S., Silva-Gagliardi N.F., Pellikka M., Jensen A.M., McGlade C.J., and Tepass U.. 2006. The FERM protein Yurt is a negative regulatory component of the Crumbs complex that controls epithelial polarity and apical membrane size. Dev. Cell. 11:363–374. 10.1016/j.devcel.2006.06.001 [DOI] [PMC free article] [PubMed] [Google Scholar]
- Laprise P., Paul S.M., Boulanger J., Robbins R.M., Beitel G.J., and Tepass U.. 2010. Epithelial polarity proteins regulate Drosophila tracheal tube size in parallel to the luminal matrix pathway. Curr. Biol. 20:55–61. 10.1016/j.cub.2009.11.017 [DOI] [PMC free article] [PubMed] [Google Scholar]
- Lee J.Y., and Harland R.M.. 2007. Actomyosin contractility and microtubules drive apical constriction in Xenopus bottle cells. Dev. Biol. 311:40–52. 10.1016/j.ydbio.2007.08.010 [DOI] [PMC free article] [PubMed] [Google Scholar]
- Llimargas M., Strigini M., Katidou M., Karagogeos D., and Casanova J.. 2004. Lachesin is a component of a septate junction-based mechanism that controls tube size and epithelial integrity in the Drosophila tracheal system. Development. 131:181–190. 10.1242/dev.00917 [DOI] [PubMed] [Google Scholar]
- Luschnig S., Bätz T., Armbruster K., and Krasnow M.A.. 2006. serpentine and vermiform encode matrix proteins with chitin binding and deacetylation domains that limit tracheal tube length in Drosophila. Curr. Biol. 16:186–194. 10.1016/j.cub.2005.11.072 [DOI] [PubMed] [Google Scholar]
- Moon A., and Drubin D.G.. 1995. The ADF/cofilin proteins: stimulus-responsive modulators of actin dynamics. Mol. Biol. Cell. 6:1423–1431. 10.1091/mbc.6.11.1423 [DOI] [PMC free article] [PubMed] [Google Scholar]
- Moussian B. 2010. Recent advances in understanding mechanisms of insect cuticle differentiation. Insect Biochem. Mol. Biol. 40:363–375. 10.1016/j.ibmb.2010.03.003 [DOI] [PubMed] [Google Scholar]
- Muller C.B., Loman A., Pacheco V., Koberling F., Willbold D., Richtering W., and Enderlein J.. 2008. Precise measurement of diffusion by multi-color dual-focus fluorescence correlation spectroscopy. Europhys. Lett. 10.1209/0295-5075/83/46001 [DOI] [Google Scholar]
- Nagaraj R., Gururaja-Rao S., Jones K.T., Slattery M., Negre N., Braas D., Christofk H., White K.P., Mann R., and Banerjee U.. 2012. Control of mitochondrial structure and function by the Yorkie/YAP oncogenic pathway. Genes Dev. 26:2027–2037. 10.1101/gad.183061.111 [DOI] [PMC free article] [PubMed] [Google Scholar]
- Nelson K.S., Khan Z., Molnár I., Mihály J., Kaschube M., and Beitel G.J.. 2012. Drosophila Src regulates anisotropic apical surface growth to control epithelial tube size. Nat. Cell Biol. 14:518–525. 10.1038/ncb2467 [DOI] [PMC free article] [PubMed] [Google Scholar]
- Ng J., and Luo L.. 2004. Rho GTPases regulate axon growth through convergent and divergent signaling pathways. Neuron. 44:779–793. 10.1016/j.neuron.2004.11.014 [DOI] [PubMed] [Google Scholar]
- Oh H., and Irvine K.D.. 2008. In vivo regulation of Yorkie phosphorylation and localization. Development. 135:1081–1088. 10.1242/dev.015255 [DOI] [PMC free article] [PubMed] [Google Scholar]
- Oh H., and Irvine K.D.. 2011. Cooperative regulation of growth by Yorkie and Mad through bantam. Dev. Cell. 20:109–122. 10.1016/j.devcel.2010.12.002 [DOI] [PMC free article] [PubMed] [Google Scholar]
- Olakkaran S., Antony A., Kizhakke Purayil A., Tilagul Kumbar S., and Hunasanahally Puttaswamygowda G.. 2018. Lead modulated Heme synthesis inducing oxidative stress mediated Genotoxicity in Drosophila melanogaster. Sci. Total Environ. 634:628–639. 10.1016/j.scitotenv.2018.04.004 [DOI] [PubMed] [Google Scholar]
- Öztürk-Çolak A., Moussian B., and Araújo S.J.. 2016. Drosophila chitinous aECM and its cellular interactions during tracheal development. Dev. Dyn. 245:259–267. 10.1002/dvdy.24356 [DOI] [PubMed] [Google Scholar]
- Papadopoulos D.K., Skouloudaki K., Engström Y., Terenius L., Rigler R., Zechner C., Vukojević V., and Tomancak P.. 2019. Control of Hox transcription factor concentration and cell-to-cell variability by an auto-regulatory switch. Development. 146:146 10.1242/dev.168179 [DOI] [PMC free article] [PubMed] [Google Scholar]
- Popoveniuc G., and Jonklaas J.. 2012. Thyroid nodules. Med. Clin. North Am. 96:329–349. 10.1016/j.mcna.2012.02.002 [DOI] [PMC free article] [PubMed] [Google Scholar]
- Rinaldi P., Ierardi C., Costantini M., Magno S., Giuliani M., Belli P., and Bonomo L.. 2010. Cystic breast lesions: sonographic findings and clinical management. J. Ultrasound Med. 29:1617–1626. [DOI] [PubMed] [Google Scholar]
- Robbins R.M., Gbur S.C., and Beitel G.J.. 2014. Non-canonical roles for Yorkie and Drosophila Inhibitor of Apoptosis 1 in epithelial tube size control. PLoS One. 9:e101609 10.1371/journal.pone.0101609 [DOI] [PMC free article] [PubMed] [Google Scholar]
- Ryoo H.D., Bergmann A., Gonen H., Ciechanover A., and Steller H.. 2002. Regulation of Drosophila IAP1 degradation and apoptosis by reaper and ubcD1. Nat. Cell Biol. 4:432–438. 10.1038/ncb795 [DOI] [PubMed] [Google Scholar]
- Samakovlis C., Hacohen N., Manning G., Sutherland D.C., Guillemin K., and Krasnow M.A.. 1996. Development of the Drosophila tracheal system occurs by a series of morphologically distinct but genetically coupled branching events. Development. 122:1395–1407. [DOI] [PubMed] [Google Scholar]
- Sansores-Garcia L., Bossuyt W., Wada K., Yonemura S., Tao C., Sasaki H., and Halder G.. 2011. Modulating F-actin organization induces organ growth by affecting the Hippo pathway. EMBO J. 30:2325–2335. 10.1038/emboj.2011.157 [DOI] [PMC free article] [PubMed] [Google Scholar]
- Schindelin J., Arganda-Carreras I., Frise E., Kaynig V., Longair M., Pietzsch T., Preibisch S., Rueden C., Saalfeld S., Schmid B., et al. 2012. Fiji: an open-source platform for biological-image analysis. Nat. Methods. 9:676–682. 10.1038/nmeth.2019 [DOI] [PMC free article] [PubMed] [Google Scholar]
- Schottenfeld-Roames J., Rosa J.B., and Ghabrial A.S.. 2014. Seamless tube shape is constrained by endocytosis-dependent regulation of active Moesin. Curr. Biol. 24:1756–1764. 10.1016/j.cub.2014.06.029 [DOI] [PMC free article] [PubMed] [Google Scholar]
- Schroeder M.C., and Halder G.. 2012. Regulation of the Hippo pathway by cell architecture and mechanical signals. Semin. Cell Dev. Biol. 23:803–811. 10.1016/j.semcdb.2012.06.001 [DOI] [PubMed] [Google Scholar]
- Shaik K.S., Meyer F., Vázquez A.V., Flötenmeyer M., Cerdán M.E., and Moussian B.. 2012. δ-Aminolevulinate synthase is required for apical transcellular barrier formation in the skin of the Drosophila larva. Eur. J. Cell Biol. 91:204–215. 10.1016/j.ejcb.2011.11.005 [DOI] [PubMed] [Google Scholar]
- Skouloudaki K., and Walz G.. 2012. YAP1 recruits c-Abl to protect angiomotin-like 1 from Nedd4-mediated degradation. PLoS One. 7:e35735 10.1371/journal.pone.0035735 [DOI] [PMC free article] [PubMed] [Google Scholar]
- Söderberg O., Gullberg M., Jarvius M., Ridderstråle K., Leuchowius K.J., Jarvius J., Wester K., Hydbring P., Bahram F., Larsson L.G., and Landegren U.. 2006. Direct observation of individual endogenous protein complexes in situ by proximity ligation. Nat. Methods. 3:995–1000. 10.1038/nmeth947 [DOI] [PubMed] [Google Scholar]
- Spencer A.K., Siddiqui B.A., and Thomas J.H.. 2015. Cell shape change and invagination of the cephalic furrow involves reorganization of F-actin. Dev. Biol. 402:192–207. 10.1016/j.ydbio.2015.03.022 [DOI] [PubMed] [Google Scholar]
- Steinman T.I. 2012. Polycystic kidney disease: a 2011 update. Curr. Opin. Nephrol. Hypertens. 21:189–194. 10.1097/MNH.0b013e32835011a7 [DOI] [PubMed] [Google Scholar]
- Su T., Ludwig M.Z., Xu J., and Fehon R.G.. 2017. Kibra and Merlin Activate the Hippo Pathway Spatially Distinct from and Independent of Expanded. Dev. Cell. 40:478–490.e473. [DOI] [PMC free article] [PubMed] [Google Scholar]
- Sun S., and Irvine K.D.. 2016. Cellular Organization and Cytoskeletal Regulation of the Hippo Signaling Network. Trends Cell Biol. 26:694–704. 10.1016/j.tcb.2016.05.003 [DOI] [PMC free article] [PubMed] [Google Scholar]
- Tiklová K., Senti K.A., Wang S., Gräslund A., and Samakovlis C.. 2010. Epithelial septate junction assembly relies on melanotransferrin iron binding and endocytosis in Drosophila. Nat. Cell Biol. 12:1071–1077. 10.1038/ncb2111 [DOI] [PubMed] [Google Scholar]
- Tonning A., Hemphälä J., Tång E., Nannmark U., Samakovlis C., and Uv A.. 2005. A transient luminal chitinous matrix is required to model epithelial tube diameter in the Drosophila trachea. Dev. Cell. 9:423–430. 10.1016/j.devcel.2005.07.012 [DOI] [PubMed] [Google Scholar]
- Totaro A., Panciera T., and Piccolo S.. 2018. YAP/TAZ upstream signals and downstream responses. Nat. Cell Biol. 20:888–899. 10.1038/s41556-018-0142-z [DOI] [PMC free article] [PubMed] [Google Scholar]
- Tsarouhas V., Senti K.A., Jayaram S.A., Tiklová K., Hemphälä J., Adler J., and Samakovlis C.. 2007. Sequential pulses of apical epithelial secretion and endocytosis drive airway maturation in Drosophila. Dev. Cell. 13:214–225. 10.1016/j.devcel.2007.06.008 [DOI] [PubMed] [Google Scholar]
- Tsoumpekos G., Nemetschke L., and Knust E.. 2018. Drosophila Big bang regulates the apical cytocortex and wing growth through junctional tension. J. Cell Biol. 217:1033–1045. 10.1083/jcb.201705104 [DOI] [PMC free article] [PubMed] [Google Scholar]
- Vukojevic V., Heidkamp M., Ming Y., Johansson B., Terenius L., and Rigler R.. 2008. Quantitative single-molecule imaging by confocal laser scanning microscopy. Proc. Natl. Acad. Sci. USA. 105:18176–18181. 10.1073/pnas.0809250105 [DOI] [PMC free article] [PubMed] [Google Scholar]
- Vukojevic V., Papadopoulos D.K., Terenius L., Gehring W.J., and Rigler R.. 2010. Quantitative study of synthetic Hox transcription factor-DNA interactions in live cells. Proc. Natl. Acad. Sci. USA. 107:4093–4098. 10.1073/pnas.0914612107 [DOI] [PMC free article] [PubMed] [Google Scholar]
- Vukojević V., Pramanik A., Yakovleva T., Rigler R., Terenius L., and Bakalkin G.. 2005. Study of molecular events in cells by fluorescence correlation spectroscopy. Cell. Mol. Life Sci. 62:535–550. 10.1007/s00018-004-4305-7 [DOI] [PMC free article] [PubMed] [Google Scholar]
- Wahlström G., Vartiainen M., Yamamoto L., Mattila P.K., Lappalainen P., and Heino T.I.. 2001. Twinfilin is required for actin-dependent developmental processes in Drosophila. J. Cell Biol. 155:787–796. 10.1083/jcb.200108022 [DOI] [PMC free article] [PubMed] [Google Scholar]
- Wang S., Jayaram S.A., Hemphälä J., Senti K.A., Tsarouhas V., Jin H., and Samakovlis C.. 2006. Septate-junction-dependent luminal deposition of chitin deacetylases restricts tube elongation in the Drosophila trachea. Curr. Biol. 16:180–185. 10.1016/j.cub.2005.11.074 [DOI] [PubMed] [Google Scholar]
- Wang W., Huang J., and Chen J.. 2011. Angiomotin-like proteins associate with and negatively regulate YAP1. J. Biol. Chem. 286:4364–4370. 10.1074/jbc.C110.205401 [DOI] [PMC free article] [PubMed] [Google Scholar]
- Wu V.M., Schulte J., Hirschi A., Tepass U., and Beitel G.J.. 2004. Sinuous is a Drosophila claudin required for septate junction organization and epithelial tube size control. J. Cell Biol. 164:313–323. 10.1083/jcb.200309134 [DOI] [PMC free article] [PubMed] [Google Scholar]
- Xu J., Vanderzalm P.J., Ludwig M., Su T., Tokamov S.A., and Fehon R.G.. 2018. Yorkie Functions at the Cell Cortex to Promote Myosin Activation in a Non-transcriptional Manner. Dev. Cell. 46:271–284.e275. [DOI] [PMC free article] [PubMed] [Google Scholar]
- Yao L., Wang S., Westholm J.O., Dai Q., Matsuda R., Hosono C., Bray S., Lai E.C., and Samakovlis C.. 2017. Genome-wide identification of Grainy head targets in Drosophila reveals regulatory interactions with the POU domain transcription factor Vvl. Development. 144:3145–3155. 10.1242/dev.143297 [DOI] [PMC free article] [PubMed] [Google Scholar]
- Zhang H., and Macara I.G.. 2006. The polarity protein PAR-3 and TIAM1 cooperate in dendritic spine morphogenesis. Nat. Cell Biol. 8:227–237. 10.1038/ncb1368 [DOI] [PubMed] [Google Scholar]
- Zhao B., Li L., Lu Q., Wang L.H., Liu C.Y., Lei Q., and Guan K.L.. 2011. Angiomotin is a novel Hippo pathway component that inhibits YAP oncoprotein. Genes Dev. 25:51–63. 10.1101/gad.2000111 [DOI] [PMC free article] [PubMed] [Google Scholar]
- Zuo L., Iordanou E., Chandran R.R., and Jiang L.. 2013. Novel mechanisms of tube-size regulation revealed by the Drosophila trachea. Cell Tissue Res. 354:343–354. 10.1007/s00441-013-1673-z [DOI] [PMC free article] [PubMed] [Google Scholar]
Associated Data
This section collects any data citations, data availability statements, or supplementary materials included in this article.