Abstract
High grade serous carcinoma (HGSC) has a poor prognosis primarily due to its early dissemination throughout the abdominal cavity. Genomic and proteomic approaches have provided snapshots of the proteogenomics of ovarian cancer (OvCa)1,2, but a systematic examination of both the tumor and stromal compartments is critical to understanding OvCa metastasis. We developed a label-free proteomic workflow to analyze as few as 5,000 formalin-fixed, paraffin embedded cells microdissected from each compartment. The tumor proteome was stable during progression from in situ lesions to metastatic disease; however, the metastasis-associated stroma was characterized by a highly conserved proteomic signature, prominently including the methyltransferase nicotinamide N-methyltransferase (NNMT) and several proteins it regulates. Stromal NNMT expression was necessary and sufficient for functional aspects of the cancer associated fibroblast (CAF) phenotype, including the expression of CAF markers and the secretion of cytokines and oncogenic extracellular matrix. Stromal NNMT expression supported OvCa migration, proliferation, and in vivo growth and metastasis. Expression of NNMT in CAFs led to a depletion of S-adenosyl methionine (SAM) and a reduction in histone methylation associated with widespread gene expression changes in the tumor stroma. This work supports the use of ultra-low input proteomics to identify candidate drivers of disease phenotypes. NNMT is a central, metabolic regulator of CAF differentiation and cancer progression in the stroma that may be therapeutically targeted.
All high grade serous OvCa harbor TP53 mutations3 but other recurrent mutations are rare and serous cancers are generally characterized by copy number variants1,4. HGSC has a high proportion of stroma, but little is known about how interactions between the cancer cells and the surrounding extracellular microenvironment affect tumor growth. Several reports describe the proteome of human ovarian cancer2,5,6 but none have differentiated between proteins in the stroma and the epithelial tumor compartment. Given that the stroma has a tumor-supporting role and co-evolves with the epithelial compartment during progression and metastasis7,8, we set out to evaluate the proteome of both compartments in a systematic fashion. We combined developments in ultra-high sensitivity mass spectrometry (MS)-based proteomics9,10 with microdissection technology to obtain an integrated picture of cancer progression.
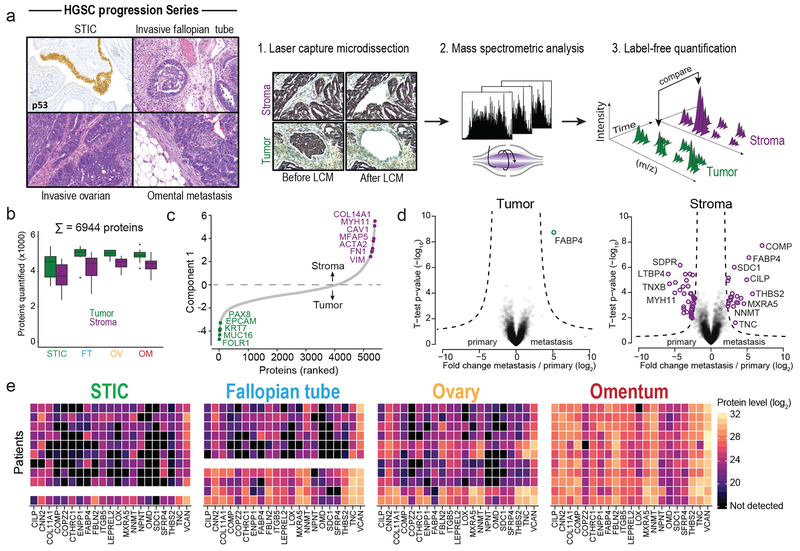
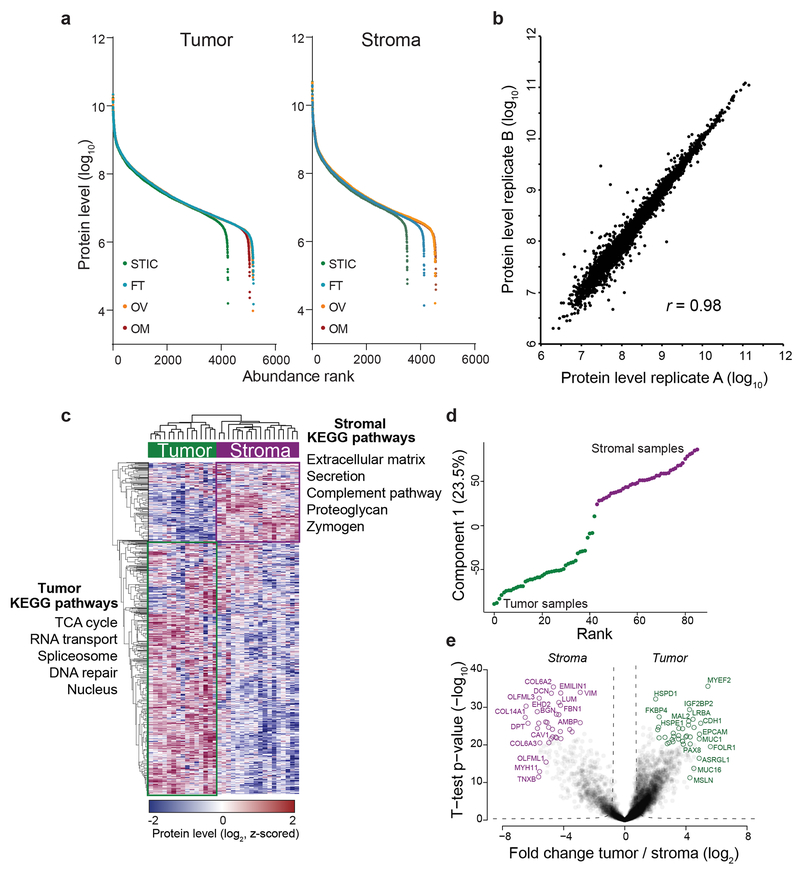
To elucidate the proteomic changes underlying OvCa progression in both the tumor and stroma, we identified a cohort of 11 HGSC patients with tissue from serous tubal in situ carcinoma (STIC), invasive fallopian tube (FT) lesions, invasive ovarian lesions, and omental (Om) metastases (Supplementary Table S1; Fig. 1a). All tissues were collected prospectively during the initial debulking surgery and all patients were chemotherapy naïve. For each patient and every anatomic site, both tumor and stromal compartments were microdissected and proteins extracted using an optimized high sensitivity, label-free proteomic workflow for low-input samples (Methods). In total, we quantified 6,944 unique proteins from 107 analyzed samples, both tumor and benign, at a protein and peptide false-discovery rate (FDR) of less than 1%. A median of 4,942 and 4,428 proteins were quantified per tumor or stromal sample, respectively, at similar dynamic ranges and with excellent reproducibility (Pearson r = 0.98; Fig. 1b, Extended Data Fig. 1a–b, and Supplementary Table S2). Unsupervised hierarchical clustering robustly segregated tumor and stromal proteomes (Extended Data Fig. 1c). Tumor compartments were enriched for known markers of HGSC (PAX8, MSLN, MUC16 (CA-125), EPCAM) and DNA replication and repair pathways, while stromal compartments were characterized by expression of ECM components and pathways that included activated fibroblast markers (e.g., collagens, vimentin, versican, tenascins, and myosins) (Fig. 1c, Extended Data Fig. 1c–e and Supplementary Table S3–4).
Fig. 1: Compartment-resolved proteomics of ovarian cancer progression reveals a stromal signature of HGSC metastasis.
(a) Tumor and stromal compartments were microdissected from different anatomic sites (serous tubal intraepithelial carcinoma, STIC; invasive fallopian tube, FT; ovarian lesions, Ov; and omental metastases, Om) and label-free, quantitative shotgun proteomics performed to identify proteins differentially expressed across all anatomic sites. (b) Number of unique proteins quantified by MaxLFQ in each anatomic compartment (n = 11 patients). (c) Ranking of proteins by expression in tumor compartment (green; n = 43 samples) versus stromal compartment (purple; n = 42 samples) shows known markers. (d) Volcano plots comparing primary sites (FT and Ov) to omental metastases in tumor (left) and stromal (right) compartments. Significantly differentially expressed proteins are highlighted in green (tumor) or purple (stroma). ANOVA FDR < 0.01, n = 11 patients. (e) Heatmap of proteins upregulated in omental stromal signature of metastasis across all patients (rows) and anatomic sites (STIC, FT, Ov, and Om). Undetected values are black; missing samples are white. The box plots in b define the range of the data (whiskers), 25th and 75th percentiles (box), and medians (solid line).
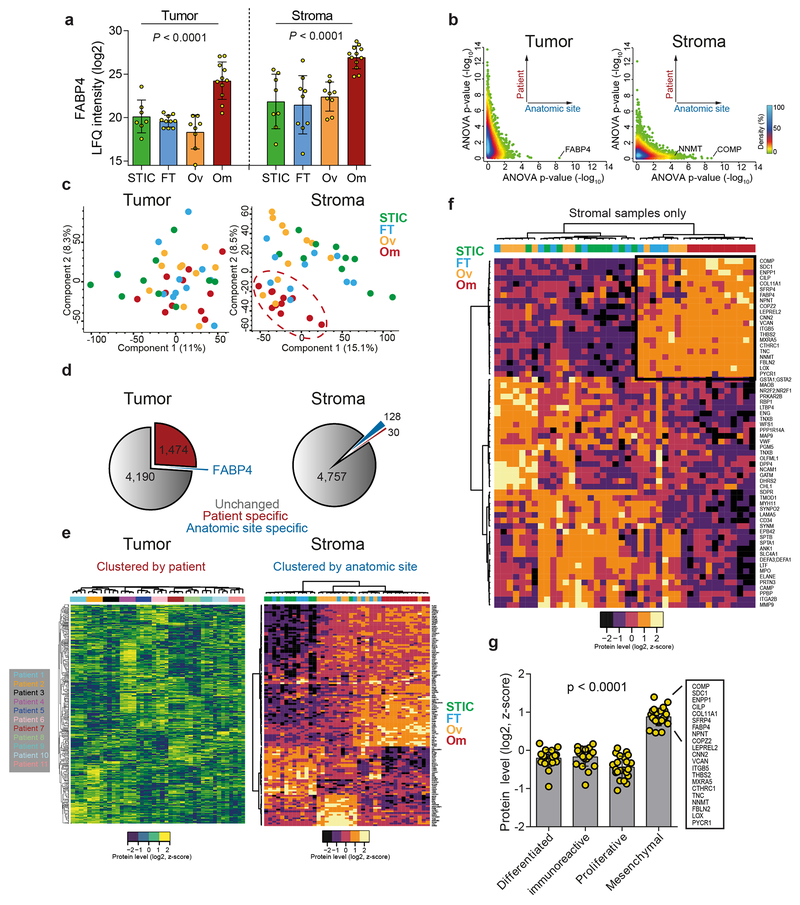
Pairwise proteomic comparison of primary (FT and Ov) and metastatic tumor compartments revealed only one protein, FABP4, previously reported by us to be upregulated in omental metastases and expressed at the tumor-stromal interface, as significantly higher in omental tumor metastases (FDR < 0.01, Fig. 1d and Extended Data Fig. 2a)11. The tumor compartment was instead characterized by patient-specific protein signatures (ANOVA FDR < 0.01, Extended Data Fig. 2b–e) that likely reflect the molecular heterogeneity of HGSC between patients1,2. In contrast, stromal proteomes clearly clustered by anatomic site revealing a conserved stromal response to metastasis shared between patients (Extended Data Fig. 2b–e). Differential expression analysis between the stromal compartments at the four anatomic sites (STIC, FT, Ov, and Om) identified 128 differentially expressed protein groups, with most contributed by the omental metastasis-associated stroma (FDR < 0.05, Extended Data Fig. 2d). Among those, we identified a set of 62 protein groups which were universally up- or downregulated in all omental metastases compared to all primary (FT or Ov) stromal sites (FDR < 0.01, Fig. 1d and Extended Data Fig. 2f).
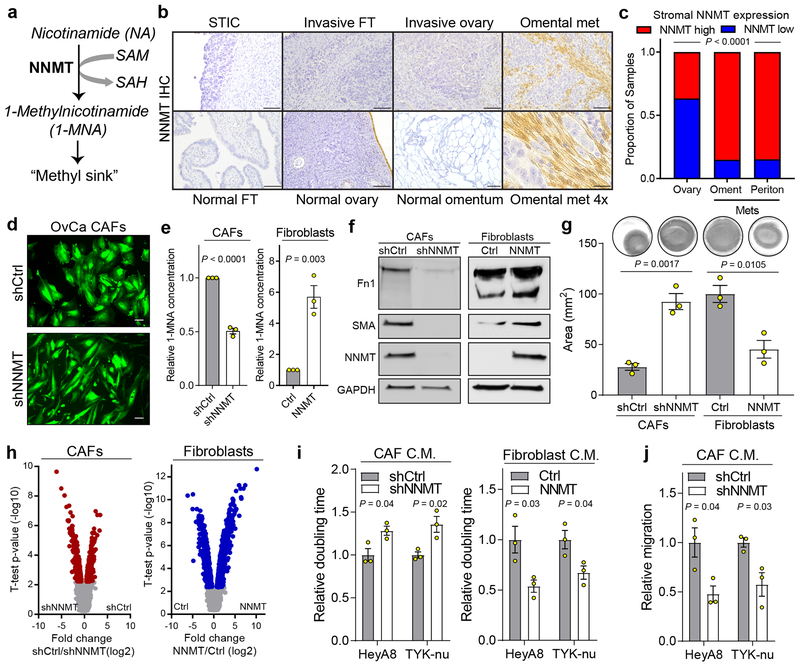
The stromal signature consisted of 21 up- and 41 downregulated proteins, which included proteins known to have tumor-supporting roles in the stroma such as FAP, LOX, TNC, and VCAN and had considerable overlap with the mesenchymal TCGA subtype (Fig. 1e, Extended Data Fig. 2g and Supplementary Table S5). Downregulated proteins included negative regulators of TGFβ signaling such as LTBP4 and SDPR. Other proteins, such as ENPP1 and COPZ2, had no previously described roles in the tumor stroma or the biology of CAFs. Due to its biochemical activity and roles in epigenetic regulation12, upregulation of nicotinamide N-methyltransferase (NNMT) in the omental stroma was an interesting target. NNMT transfers a reactive methyl group from S-adenosyl methionine (SAM) to nicotinamide (NA) to generate S-adenosyl homocysteine (SAH) and the metabolically inert product 1-methyl nicotinamide (1-MNA). SAM is the universal methyl donor for histones, non-histone proteins, DNA, RNA, lipids, and other metabolites. This activity generates a methyl sink in the form of 1-MNA, which leads to depletion of SAM and reduces the global methylation potential of the cell13,14. NNMT-mediated SAM depletion regulates gene expression by attenuating histone methylation in cancer cells, adipocytes, and embryonic stem cells14–17 (Fig. 2a).
Fig. 2: NNMT is upregulated in the stroma of HGSC metastases and regulates the CAF phenotype.
(a) NNMT catalyzes the transfer of a reactive methyl group from S-adenosyl-L-methionine (SAM) to nicotinamide (NA), generating S-adenosyl-L-homocysteine (SAH) and the metabolically inert product 1-methylnicotinamide (1-MNA), thus depleting SAM and reducing global cellular methylation potential. (b) NNMT immunohistochemistry (IHC) finds elevated expression in the stroma of omental metastases. NNMT is not expressed in the stroma of normal fallopian tube, ovary, or omentum. Scale bars = 100 μm (25 μm for omental met 4×). (c) Stromal NNMT expression is elevated in omental and peritoneal metastases compared to ovarian sites (Chi-square test). (d) Knockdown of NNMT in CAFs leads to a more elongated morphology resembling normal omental fibroblasts (GFP). Scale bar = 10 μm. (e) Production of 1-MNA is attenuated upon knockdown and enhanced upon overexpression of NNMT. Two-sided t-test, n = 3 biological replicates. (f) Immunoblot of CAF markers (fibronectin, Fn1; smooth muscle actin, SMA) upon knockdown or overexpression of NNMT. (g) Effect of NNMT overexpression or knockdown on collagen contractility. Two-sided t-test, n = 3 biological replicates. (h) Gene expression analysis identified thousands of genes that were significantly differentially expressed (red or blue) upon knockdown (left) or overexpression (right) of NNMT. FDR ANOVA < 0.01, n = 3 biological replicates. (i) Proliferation (doubling time) of HeyA8 and TYK-nu OvCa cells following treatment with the indicated conditioned media (CM). Proliferation rate increases (doubling time decreases) with NNMT overexpression and decreases (doubling time increases) upon knockdown. Two-sided t-test, n = 3 biological replicates. (j) Quantification of chemotaxis in response to conditioned media from CAFs expressing shCtrl or shNNMT constructs. Two-sided t-test, n = 3 biological replicates. All bar graphs represent mean of data and error bars are SEM.
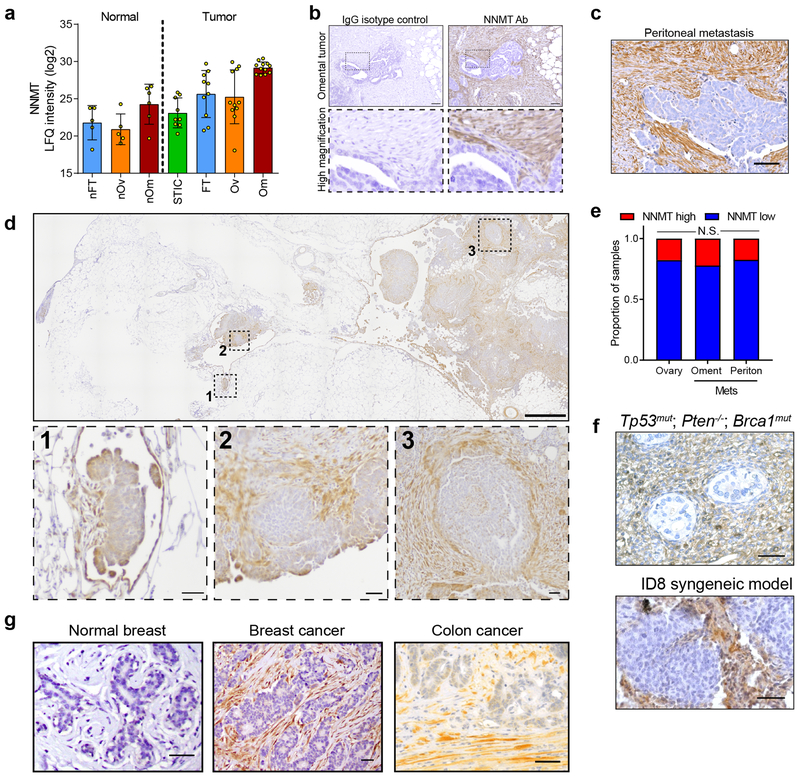
The proteomic analysis revealed that NNMT expression was increased in the stroma of peritoneal and omental metastases compared to the benign omental, fallopian tube, and ovarian stroma, including early micrometastases, which was also confirmed in a tissue microarray containing both primary and metastatic OvCa samples (Fig. 2b–c and Extended Data Fig. 3a–d). Tumor expression of NNMT did not vary significantly by anatomic site (Extended Data Fig. 3e). In both syngeneic and autochthonous18 mouse models of HGSC, NNMT was highly expressed in the stroma of metastases (Extended Data Fig. 3f). High stromal NNMT was also observed in breast and colon cancer stroma, suggesting that NNMT expression is a feature of CAFs in multiple cancer types (Extended Data Fig. 3g).
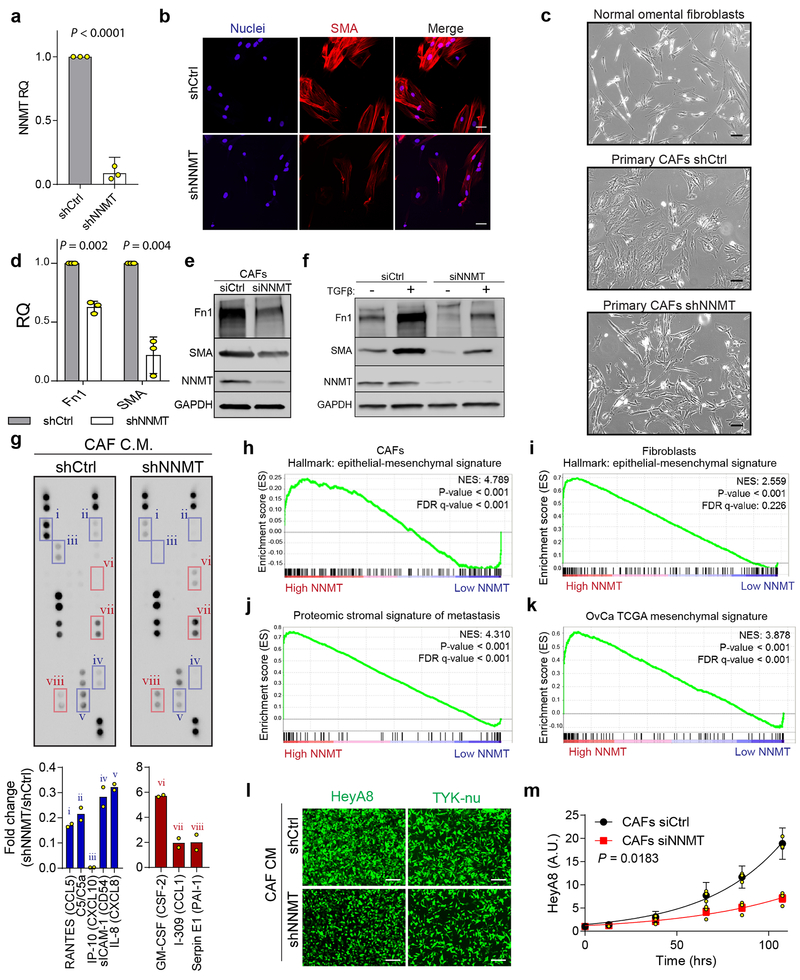
CAFs are differentiated from normal fibroblasts by production of oncogenic ECM components, cytokine secretion, cytoskeletal rearrangements associated with SMA expression, increased ability to contract collagenous matrices, and expression of CAF markers8. Knockdown of NNMT in CAFs led to a reversion of cell morphology to one that more closely resembled normal omental fibroblasts (NOFs) (Fig. 2d and Extended Data Fig. 4a–c). Knockdown or overexpression of NNMT led to a significant perturbation of its enzymatic activity, as assessed by 1-MNA production using mass spectrometry (Fig. 2e). CAF markers, including SMA and fibronectin, were decreased upon NNMT knockdown and increased with overexpression (Fig. 2f and Extended Data Fig. 4d–e).
NNMT was associated with expression of EMT markers and transcriptional regulators of EMT and inhibition of NNMT attenuated the acquisition of CAF markers by normal stromal cells in response to TGF-β (Extended Data Fig. 4f). NNMT was necessary and sufficient to induce collagen contractility (Fig. 2g) and globally regulated expression of thousands of genes, including pro-tumorigenic cytokines (Fig. 2h, Extended Data Fig. 4g, and Supplementary Table S6–7). In further support of NNMT as a central regulator of CAF gene expression, genes differentially expressed by NNMT in fibroblasts or CAFs were significantly enriched for gene signatures associated with the epithelial mesenchymal transition, the TCGA mesenchymal subtype, and proteins that were highly expressed in the stroma of omental metastases compared to primary sites (Extended Data Fig. 4h–k). Functionally, CAFs support and accelerate tumor growth, progression, and metastasis8,19,20. Overexpression of NNMT in normal fibroblasts promoted cancer cell proliferation; conversely knockdown of NNMT in CAFs attenuated cancer cell proliferation and chemotaxis (Fig. 2i–j and Extended Data Fig. 4l–m).
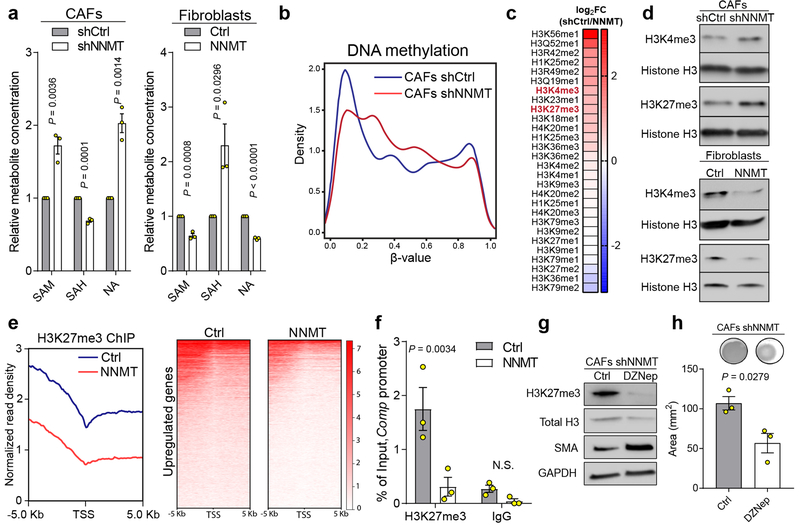
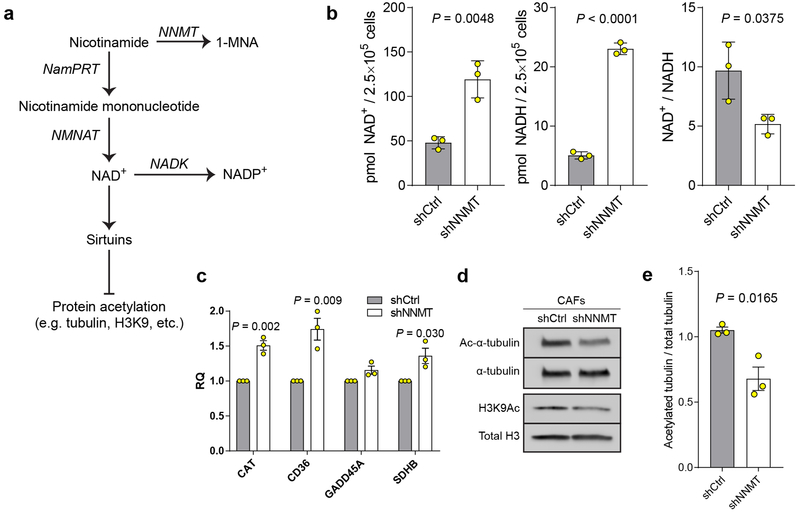
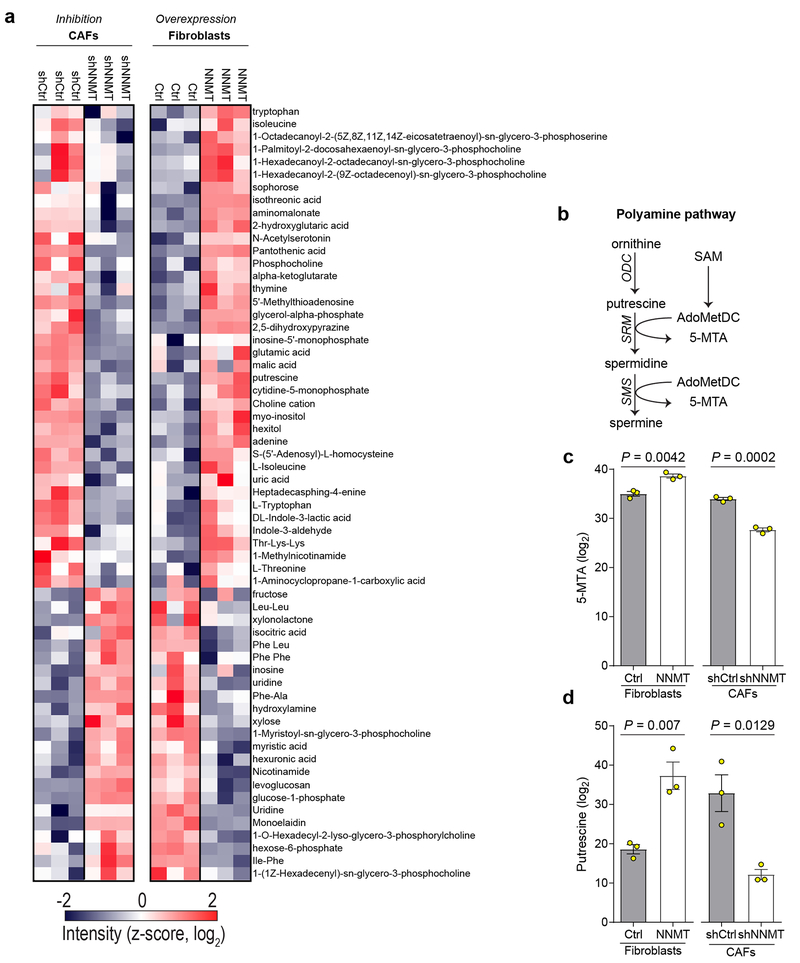
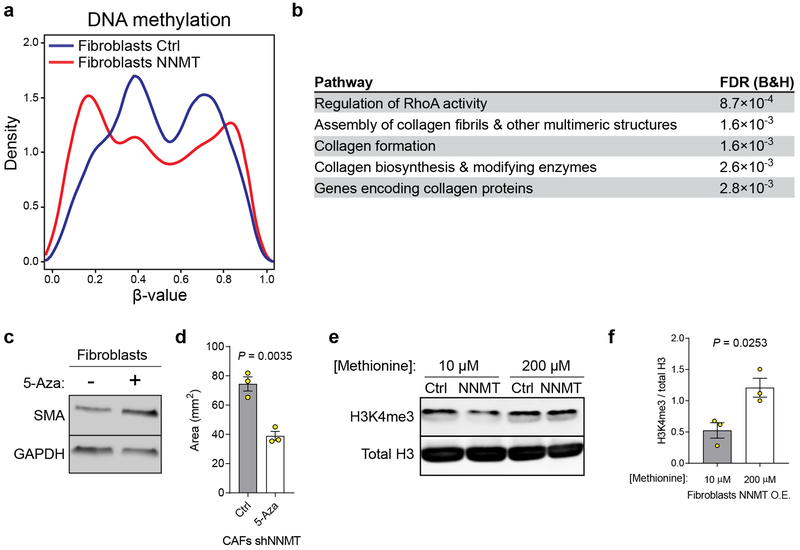
We hypothesized that high stromal NNMT expression drives gene expression changes and acquisition of the CAF phenotype through hypomethylation of DNA, RNA, or histones via attenuation of the SAM/SAH ratio (i.e., methylation potential of the cell)14. Indeed, methylation potential was directly regulated by NNMT expression, as assessed by metabolite profiling with mass spectrometry. NNMT knockdown increased the SAM/SAH ratio, while NNMT overexpression led to a decrease (Fig. 3a). Nicotinamide (NA) levels were negatively associated with NNMT expression (Fig. 3a). Knockdown of NNMT led to increased levels of NAD+(H) and was associated with increased expression of NAD-dependent sirtuin target genes such as catalase and CD36 and decreased acetylation of H3K9 and α-tubulin (Extended Data Fig. 5)15,21. Targeted metabolomics identified conserved metabolic changes upon both knockdown and overexpression of NNMT (Extended Data Fig. 6a and Supplementary Table S8). In particular, NNMT regulated the polyamine pathway and increased levels of 5-methylthioadenosine, an inhibitor of SAH hydrolase that contributes to global hypomethylation22 (Extended Data Fig. 6b–d). NNMT expression induced genome-wide DNA methylation changes that significantly altered methylation status in the promoter regions of genes and was enriched for genes involved in collagen production and myosin-driven contractility (Fig. 3b, Extended Data Fig. 7a–b, and Supplementary Tables S9–10). Inhibition of DNA methylation with 5-azacytidine increased expression of CAF markers and collagen contractility, supporting a direct role for DNA hypomethylation in regulating the CAF phenotype (Extended Data Fig. 7c–d).
Fig. 3: NNMT regulates DNA and histone methylation to drive the CAF phenotype.
(a) Quantification of SAM, SAH, and NA upon knockdown or overexpression of NNMT, n = 3 biological replicates. (b) Distribution of significantly different β-values (Benjamini-Hochberg adjusted p-value < 0.01) corresponding to the degree of DNA methylation within 1500 bp of transcriptional start sites in CAFs as assessed by global DNA methylation arrays. n = 2 biological replicates. (c) Quantitative histone methylation proteomics in CAFs expressing shCtrl or shNNMT constructs following chromatin extraction. me1=mono-methylation; me2=dimethylation; me3=trimethylation. (d) Immunoblotting of H3K4me3 and H3K27me3 in primary human CAFs when NNMT is inhibited (sh) or in primary fibroblasts overexpressing NNMT. (e) H3K27me3 ChIP-sequencing of normal fibroblasts overexpressing NNMT reveals that NNMT expression reduces H3K27me3 occupancy adjacent to transcriptional start sites (TSS) of genes significantly upregulated upon NNMT expression (Benjamini-Hochberg adjusted p-value < 0.05, n = 3 biological replicates) (f) Enrichment of H3K27me3 at the Comp promoter as determined by qPCR in fibroblasts overexpressing NNMT. ANOVA, n = 3 biological replicates. (g) Immunoblot of fibroblast markers and (h) collagen contractility of CAFs expressing shNNMT and treated with the EZH2 histone methyltransferase inhibitor DZNep. Two-sided t-test, n = 3 biological replicates. All bar graphs represent mean of data and error bars are SEM.
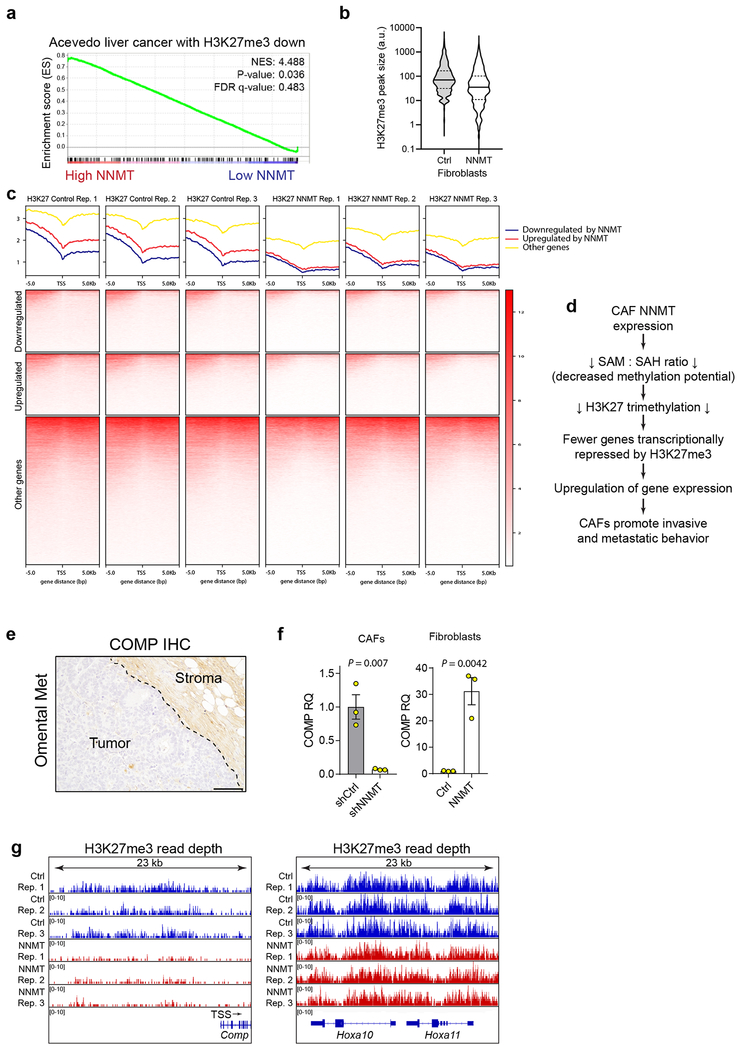
To understand how NNMT affects histone methylation, we performed targeted histone proteomic analyses, using a multi-reaction monitoring approach to quantify relative levels of histone lysine and arginine methylation23. NNMT knockdown increased histone methylation at residues associated with transcriptional regulation, including a significant increase in H3K4 and H3K27 trimethylation (me3; Fig. 3c). Immunoblotting confirmed that H3K27 and H3K4 trimethylation was perturbed upon knockdown or overexpression of NNMT (Fig. 3d). Histone methylation was metabolically sensitive to cellular methylation potential and extracellular methionine concentration (Extended Data Fig. 7e–f). Genes regulated by NNMT overexpression were associated with gene sets regulated by H3K27 demethylation (Extended Data Fig. 8a). Chromatin immunoprecipitation sequencing (ChIP-seq) of cells overexpressing NNMT found that NNMT activity reduced global H3K27 occupancy, including at the promoters of NNMT-regulated genes (Fig. 3e–f and Extended Data Fig. 8b–c and Supplementary Table S11). These data suggest that NNMT mediates genome-wide epigenetic and transcriptional changes through hypomethylation of repressive chromatin marks (Extended Data Fig. 8d). Cartilage oligomeric matrix protein (COMP), an extracellular matrix protein24, which was the most upregulated protein in all metastatic stroma samples (Fig. 1d), is highly expressed in the stroma of omental metastases, and its transcription is tightly regulated by NNMT expression (Extended Data Fig. 8e–g). Histone methylation at the COMP promoter was increased upon knockdown of NNMT, supporting a central role for NNMT in functionally regulating histone methylation of genes that are differentially expressed (Extended Data Fig. 8g). Treatment of CAFs expressing shNNMT with the EZH2 histone methyltransferase inhibitor, DZNep, the general histone methyltransferase inhibitor, 3DZA, or knockdown of EZH2 restored expression of CAF markers and promoted collagen contractility (Fig. 3g–h and Extended Data Fig. 9)8.
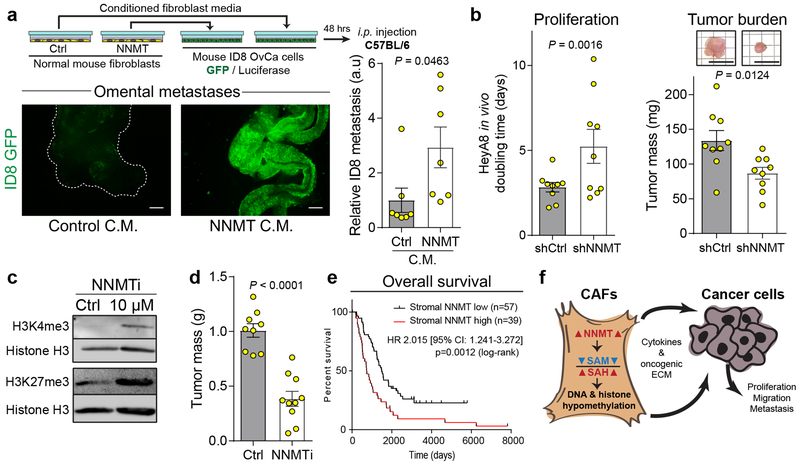
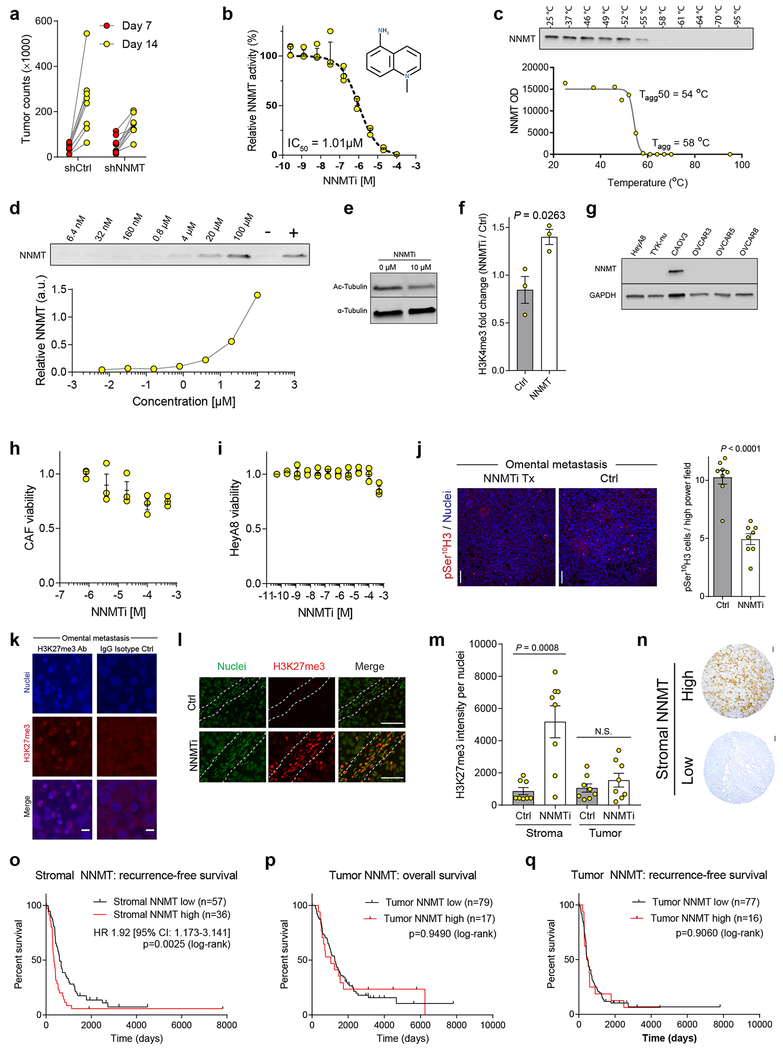
In a syngeneic model of HGSC metastasis, cancer cell metastasis to the omentum was significantly increased when ID8 cells were pre-treated with conditioned media from fibroblasts overexpressing NNMT (Fig. 4a). The co-injection of HGSC cells with CAFs expressing shCtrl or shNNMT constructs found that knockdown of stromal NNMT also reduced in vivo proliferation and overall tumor burden (Fig. 4b and Extended Data Fig. 10a). Recently, a small molecule inhibitor of NNMT was used to treat high fat diet-induced obesity in mouse models21. The inhibitor, 5-amino-1-methylquinolin-1-ium (NNMTi), was effective at inhibiting NNMT at micromolar concentrations and demonstrated target engagement as assessed by the cellular thermal shift assay (CETSA; Extended Data Fig. 10b–d). Treatment of human CAFs with the NNMTi increased histone methylation, decreased tubulin acetylation, and was specific to cells expressing NNMT (Fig. 4c and Extended Data Fig. 10e–f). NNMT inhibition did not affect the viability of CAFs or OvCa cells (Extended Data Fig. 10g–i). In vivo treatment with the NNMTi decreased tumor burden in an orthotopic intraperitoneal model of OvCa metastasis (Fig. 4d), reduced tumor cell proliferation, and increased stromal H3K27 trimethylation (Extended Data Fig. 10j–m).
Fig. 4: Stromal NNMT supports HGSC progression and is associated with a poor prognosis.
(a) Schematic of experimental design (top). Representative images and quantification of omental adhesion following intraperitoneal injection of luciferase/GFP-labeled ID8 mouse OvCa cells treated with conditioned media from fibroblasts expressing the indicated constructs, n = 7 mice per group. Two-sided t-test. Scale bar = 500 μm. (b) In vivo proliferation and total tumor burden of luciferase-labeled OvCa cells co-injected with CAFs expressing shCtrl or shNNMT constructs, n = 9 tumors per group. Scale = 1 cm. (c) Treatment of CAFs with the NNMTi led to increased histone methylation. (d) Tumor burden of nude mice intraperitoneally injected with HeyA8 OvCa cells after 10 days of treatment with vehicle control (Ctrl; PBS; n = 9) or NNMTi (n = 10). Two-sided t-test. (e) Kaplan-Meier survival curves for patients with low (black) or high (red) stromal expression of NNMT in ovarian sites, as assessed by IHC. Two-tailed test. (f) Stromal NNMT drives ovarian cancer progression by metabolic regulation of histone methylation which causes epigenetic and transcriptional changes in stromal cells promoting cancer cell proliferation, migration, and metastasis. All bar graphs represent mean of data and error bars are SEM.
Although NNMT was primarily expressed in the stroma of omental metastases, a subset of patients had high stromal expression of NNMT in primary sites (Fig. 1e and Fig. 2c). The TMA used to validate stromal NNMT expression was also used to evaluate the prognostic role of NNMT in chemo-naïve, HGSC25. We found that high stromal NNMT protein expression in primary sites was associated with a significantly worse recurrence-free and overall survival and platinum resistance (median survival of 349 versus 598 days and 737 versus 1489 days, respectively; Supplementary Table S12, Fig. 4e, and Extended Data Fig. 10n–o). In contrast, expression of NNMT in the tumor compartment was not predictive of survival or recurrence (Extended Data Fig. 10p–q), highlighting the importance of compartment-resolved studies.
By using laser-capture microdissection combined with an optimized high-sensitivity proteomic pipeline we quantified up to 5,000 unique protein groups per sample from as little as 5,000 cancer cells. This approach enabled compartment-resolved proteomic analysis of both tumor and stromal compartments across the HGSC progression series from STIC to metastatic tumors and revealed a metastatic stromal signature. Our results emphasize the molecular heterogeneity of ovarian cancer while also revealing that tumor proteomes within individual patients are relatively stable during progression, as also recently observed in breast cancer26. The absence of a proteomic signature that differentiates STIC from advanced cancers suggests STIC likewise already possess the molecular aberrations at both the genomic and proteomic levels associated with a fully developed cancer, as suggested by recent genomic studies27,28. Despite the marked genetic and proteomic heterogeneity of epithelial OvCa across patients, the metastatic stromal proteome was remarkably uniform and characterized by high NNMT expression and NNMT-regulated gene and protein expression. NNMT metabolically reprograms the epigenome of the stroma to co-opt NNMT-dependent processes that occur during stem cell priming17, metabolic syndrome15, and tumor aggressiveness14 (Fig. 4f). While CAF gene expression can be regulated by chromatin modifiers and DNA methylation29,30, we find that metabolically-defined histone methylation plays a central role in defining the pro-tumorigenic role of the stroma. Inhibition of NNMT activity led to a reversion of the CAF phenotype, suggesting that stromal methyltransferase activities can be targeted to normalize the metastatic stroma and should be further explored as new treatment targets for cancer.
METHODS.
Patient samples
All patients included in the study underwent primary ovarian cancer debulking surgery at the University of Chicago and were diagnosed with metastatic HGSC (Supplementary Table S1). All human tissue samples were collected with informed consent and in compliance with University of Chicago Institutional Review Board-approved protocols (13372 and 13248) and in accordance with the Declaration of Helsinki.
Laser-capture microdissection
Samples were prepared as previously described27. Formalin-fixed, paraffin-embedded (FFPE) specimens were sectioned with a microtome (10 μm sections) and mounted on Leica PEN-membrane Membrane Slides (2 μm). Slides were deparaffinized with xylene and rehydrated through graded alcohols and water. Sections were stained with Mayer’s hematoxylin (Sigma) and dehydrated through graded alcohols and xylene. Tumor and stromal tissues were dissected with a Leica LMD 6500 laser microdissection system and tumor and stromal samples collected in 0.5 ml tubes. Depending on the FFPE specimen, an area of 1-5×106 μm2 was collected (approximately 5-25,000 cells, as derived from dissected area × slide thickness / average mammalian cell volume of 2,000 μm3, BNID 100434).
FFPE tissue preparation for mass spectrometry (MS) analysis
FFPE tissue lysis was adapted and optimized from previously described workflows31,32. Microdissected tissue was collected by pipetting 50 μl of lysis buffer (50% 2,2,2-trifluoroethanol (TFE) and 5 mM dithiothreitol in 25 mM NH4HCO3 buffer) and centrifuged for 5 min at maximum speed to collect all remaining tissue. Samples were boiled at 90 °C for 60 min and briefly centrifuged every 10 min to avoid drying out during lysis. Subsequently, samples were sonicated for 10 min (level 5, Bioruptor Plus, Diagenode). After centrifugation for 10 min at maximum speed, supernatants were transferred to new tubes and alkylated with 20 mM iodoacetamide for 30 min in the dark. Samples were vacuum-concentrated for 30 min at 45°C (until approximately 10 μl buffer remained). 40 μl of fresh digestion buffer (10% TFE and trypsin in 50 mM NH4HCO3) was added in a trypsin (Promega) to total protein ratio of approximately 1:50. Digestion was carried out at 37°C overnight and digestion stopped by addition of 1% TFA. Samples were vacuum-evaporated to a volume of 5-10 μl and resuspended in 100 μl 0.2% TFA and 2% acetonitrile prior to desalting with C18 StageTips. Samples were stored at −20°C until MS analysis.
Liquid chromatography (LC)-mass spectrometry (MS) analysis
Quadrupole Orbitrap mass spectrometers33,34 (Q Exactive and Q Exactive HF, Thermo Fisher Scientific) coupled to an EASY-nLC 1000 HPLC system (Thermo Fisher Scientific) via a nano-electrospray source were operated in data dependent mode for LC-MS analysis of peptides. LC columns (75 μm inner diameter, 50 cm length) were packed in-house with C18 particles (1.9 μm, Dr. Maisch GmbH, Germany). Peptides were separated with a 250 min HPLC gradient from 2% to 60% in buffer B (80% acetonitrile, 0.5% formic acid) at a flow-rate of 200 nl/min. We employed a resolution of 70,000 at m/z 200 (60,000 for Q Exactive HF) for survey scans. The scan range was set to 300 to 1,650 m/z. Up to the 3 most abundant MS1 features (charge ≥ 2) were selected for high-energy collisional dissociation fragmentation at a resolution of 17,500 at m/z 200 (15,000 for Q Exactive HF). Dynamic exclusion of sequenced peptides was set to 45 s. Ion injection times and ion target values were set to 20 ms and 3×10⁶ for the survey scans and 220 ms and 1×10⁵ for the MS/MS scans, respectively. Data was acquired using Xcalibur software (Thermo Scientific).
Data analysis of proteomic raw files
MS raw files were processed with MaxQuant35 (version 1.5.3.15). The Andromeda search engine36 of MaxQuant was used for peptide and protein identification. Andromeda is a probability-based search engine that employs a target-decoy approach to identify peptides and proteins at a false-discovery rate (FDR) of less than 1%. The UniProtKB database release (August 2015) was used as the forward database. MaxQuant automatically generated a reverse decoy database based on the provided forward database. Proteins which could not be distinguished based on the identified peptides were grouped into protein groups35. The MaxLFQ37 algorithm was used for label-free proteome quantification. MaxLFQ is a peptide intensity-based algorithm that makes use of high-resolution 3D peptide features in mass-to-charge, retention time and intensity space.
For each protein, peptide ratios were calculated in a pairwise manner and combined with protein ratios by calculating the median of all peptide ratios. Only the exact same peptide species was considered for each pairwise calculation. A least-squares analysis was then used to reconstruct the relative protein abundance across samples, which preserves the total summed intensity for a protein over all samples. A minimum of one ratio count for each pairwise comparison was required and the final list of protein quantifications was filtered for proteins with a minimum of two razor and unique peptides for each protein. The “Match Between Runs” feature of MaxQuant was enabled to match high-resolution MS1 features between runs. All statistical and bioinformatics analyses were done using Perseus38 (MaxQuant environment) or the R framework. For pairwise proteomic comparisons, we used a 2-sided t-test statistic including a permutation-based FDR of 1% and an s0 value39 of 2. Missing values were imputed based on a normal distribution (width = 0.15; downshift = 1.8). One dimensional annotation enrichment analysis was performed based on protein fold changes between all tumor versus all stroma samples (Benjamini-Hochberg FDR < 0.02)40.
Tissue immunohistochemistry and immunofluorescence
FFPE tissue specimens were cut at 10 μm, deparaffinized in xylene, and rehydrated through graded ethanol solutions. Following heat-mediated, sodium citrate antigen retrieval (10 mM sodium citrate, 0.05% Tween 20, pH 6), slides were stained with anti-NNMT (Santa Cruz G-4; 1:200) or anti-COMP (Thermo Fisher Scientific MA1-20221; 1:100) antibodies and processed with the VECTASTAIN Elite ABC HRP kit and DAB Substrate Kit (Vector Laboratories). Slides were counterstained with hematoxylin and dehydrated through graded alcohols and xylene. For immunofluorescence, slides were stained with fluorescently-labeled secondary antibodies (1:200; Thermo Fisher) and Hoechst 33258 (1:200; Molecular Probes). Confocal microscopy was performed with a Zeiss LSM510 and images processed with Image J 1.50j.
Tissue microarray analysis
Assembly and construction of the ovarian cancer tissue microarray have been previously described41. NNMT immunohistochemical reactivity was scored without knowledge of clinical outcome by two experienced pathologists (S.M. and R.L.). Each sample was scored based on the percentage of positive cells in each compartment (0, no staining; 1, <30%; 2, 30–50%; 3, ≥50%); staining intensity was similar across all samples. Expression was considered “low” if the staining intensity was 0 or 1 and “high” if 2 or 3. Analysis was limited to the ovarian compartment of chemotherapy-naïve patients (upfront debulking) with high grade serous pathology (n=96 patients; Supplementary Table S12). Kaplan-Meier survival curves and statistical analyses of overall and progression-free survival were performed with GraphPad Prism 7 using the Mantel-Cox (log-rank) test.
Isolation of primary cells
CAFs were isolated from tumor-containing omental tissue of patients with HGSOC. Normal omental fibroblasts (NOFs) were isolated from omental tissue from female patients undergoing surgery for benign conditions. CAFs and NOFs were isolated and confirmed as previously described42. Tissues were thoroughly rinsed with PBS before mincing and digestion (12-18 hr) with collagenase (3 mg/ml) and hyaluronidase (0.5 mg/ml) in 10% fetal bovine serum (FBS) in DMEM. Primary NOFs or CAFs adhered to tissue culture plastic within 24 hr.
Cell lines
HeyA8 (Gordon Mills, Oregon Health and Science University, Portland, OR), 3T3 (American Type Culture Collection), 293T (Lucy Godley, University of Chicago, Chicago, IL), WI-38 (American Type Culture Collection), CAOV3 (American Type Culture Collection), and primary and immortalized CAF cells were cultured in DMEM supplemented with 10% FBS, MEM vitamins, MEM non-essential amino acids, penicillin, and streptomycin. TYKnu cells (Gottfried Koneczny, University of California, Los Angeles) were cultured in MEM Alpha supplemented with 10% FBS, MEM vitamins, and MEM non-essential amino acids. ID8 cells were grown in DMEM supplemented with 4% FBS, Insulin-Transferrin-Selenium (5mg/ml; Gibco). All cells were cultured at 37 °C in a humidified incubator at 5% CO2. For experiments, CAFs and fibroblasts (3T3 and 293T cells) were grown in 10 μM methionine media supplemented with dialyzed 10% FBS. For some experiments, cells were treated with 1 μM DZNep or 1 μM 3DZA or vehicle (DMSO) control for 72 hr. All cells lines were regularly tested and found to be Mycoplasma-negative and authenticated (IDEXX Bioresearch short tandem repeat marker profiling).
Plasmids and expression
Short hairpin RNA (shRNA) oligonucleotides were designed using the shRNA Designer from BiOSETTIA (using accession number NM_006169) and cloned into the pLV-hU6-CMV-Green backbone using the manufacturer’s protocol (Supplementary Table S14). CAFs were infected with non-targeting shCtrl (5’-GCAGTTATCTGGAAGATCAGG-3’) or shNNMT (5’-GCTACACAATCGAATGGTT-3’) constructs; 3T3 normal fibroblasts were infected with pLenti6 empty vector control or pLX304-NNMT overexpression vector (HsCD00442343; DNasu.org). CAFs were immortalized with pBABE-neo-hTERT (1774; Addgene). To produce lentivirus, 293T cells were seeded at 1 × 10⁶ cells per 6 cm dish in DMEM supplemented with 10% FBS. After 18 hr, cells were transfected with 1 μg expression vector, 0.9 μg pCMV-dR8.2 packaging vector (8455; Addgene), and 0.1 μg pCMV-VSV-G expression vector (8454; Addgene) using Lipofectamine 2000. Viral supernatant was harvested at 48 and 72 hr post-transfection, filtered through a 0.8 μm filter, and added to recipient cells with 4 μg/ml polybrene for 8-12 hr before selection with puromycin (2 μg/ml) or blasticidin (1 μg/ml). For transient transfections, cells were seeded in a 6-well dish and transfected with 5 nmoles siRNA pools (GE Dharmacon) using Lipofectamine 2000 (Thermo Fisher) in OptiMEM reduced serum media (Thermo Fisher). Each pool contained four siRNA sequences for NNMT (5’-GAAAGAGGCUGGCUACACA-3’, 5’-GAGGUGAUCUCGCAAAGUU-3’, 5’-GAAGGGAGACCUGCUGAUU-3’, and 5’-GCUCCUCUCUGCUUGUGAA-3’), EZH2 (5’-CAAAGAAUCUAGCAUCAUA-3’, 5’-GAGGACGGCUUCCCAAUAA-3’, 5’-GCUGAAGCCUCAAUGUUUA-3’, and 5’-GAAUGGAAACAGCGAAGGA) or non-targeting controls (5’-UAGCGACUAAACACAUCAA-3’, 5’-UAAGGCUAUGAAGAGAUAC-3’, 5’-AUGUAUUGGCCUGUAUUAG-3’, and 5’-AUGAACGUGAAUUGCUCAA-3’).
Targeted LC-MS/MS metabolomics
Cells were scraped into ice-cold PBS and isolated by centrifugation at 1,400 rcf at 4°C. Cell pellets were resuspended in 300 μl of an 80:20 mixture of MeOH/H2O. Internal deuterated standards, 10 nmol d3-serine, were added to the extraction solution for sample normalization. The mixture was sonicated (Fisher Scientific FB-505) for 5 s followed by a 10 min centrifugation at 16,000 rcf. The supernatant was collected and dried under N2gas. The dried metabolites were resuspended in 30 μl of an 80:20 mixture of MeOH/H2O43. Resuspended metabolites were separated by hydrophilic interaction chromatography with a Luna-NH2 column (5 μm, 100 Å, 50 × 4.6 mm, Phenomenex). Mobile phase A was composed of 100% CH3CN, and mobile phase B was composed of 95:5 (v/v) H2O:CH3CN. For positive mode analysis, mobile phase A and B were supplemented with 0.1% formic acid. The gradient started with 0% B for 5 min and increased linearly to 100% B over 15 min with a flow rate of 0.4 ml/min, followed by an isocratic gradient of 100% B for 10 min at 0.4 ml/min. Then, the column was equilibrated with 0% B for 5 min at 0.4 ml/min. Targeted MS/MS analysis was performed on an Agilent triple quadrupole LC-MS/MS instrument (Agilent Technologies 6460 QQQ). The capillary voltage was set to 4.0 kV. The drying gas temperature was 350 °C, the drying gas flow rate was 10 L/min, and the nebulizer pressure was 45 psi. The mass spectrometer was run in MRM mode. The following MS transitions were used to measure the indicated metabolites: NA (m/z 123.05 → 80.05), 1-MNA (m/z 137 → 94), SAM (m/z 399 → 250), SAH (m/z 385 → 136), and d3-Serine (m/z 109.07 → 63.1). Relative metabolite abundance was quantified by integrated peak area for the given MRM-transition. Data presented are representative of three independent biological experiments each containing three technical replicates for a given condition.
Immunoblots and cytokine array
Cells were lysed in SDS lysis buffer containing 4% SDS and 10 mM HEPES, pH 8.5. Proteins were separated by SDS-PAGE on a 4-20% gel and transferred to a nitrocellulose membrane. The membrane was blocked with 5% non-fat dry milk (NFDM) in Tris-buffered saline with Tween 20 (TBST) for 30 min at RT and probed overnight with primary antibodies in 2% bovine serum albumin in TBST at 4°C (Supplementary Table S13). After washing with TBST, the membrane was incubated with secondary antibodies (Thermo Fisher Scientific) conjugated to horseradish peroxidase at 1:5,000 dilution in 5% NFDM/TBST for 1 hr at RT. Proteins were visualized using Clarity Western ECL Substrate (Bio-Rad) or SuperSignal West Femto Substrate (Fisher Scientific). For the cytokine array, cells were seeded at 3×10⁶ cells per 15 cm plate and grown for 72 hr in growth media. Conditioned media was collected, filtered through a 0.22 μm filter, and processed with the Proteome Profiler Human Cytokine Array Kit, Panel A (R&D Systems) following the manufacturer’s recommendations. Images were quantified using ImageJ. Full-length immunoblots are available in Supplementary Data.
RT-qPCR
Total RNA was isolated and treated with DNase using RNeasy Mini Kit (Qiagen) according to the manufacturer’s protocol. Reverse transcription of 2 μg total RNA was carried out using the High Capacity cDNA Reverse Transcription Kit (ThermoFisher Scientific). qPCR was performed with TaqMan probes and TaqMan Fast Advanced Master Mix or custom primers (IDT) and Fast SYBR Green Master Mix on an Applied Biosystems StepOnePlus Real-Time PCR System and analyzed using the 2-ΔΔCt method (Supplementary Table S14).
Collagen contractility assay
Indicated cells were trypsinized and diluted to 2×10⁵ cells/ml in growth media. 400 μl of diluted cells were mixed with 200 μl of rat tail collagen (5 mg/ml; BD Biosciences) and neutralized with 5 μl 1 N NaOH and transferred to a 24-well plate. After 20 min of incubation, collagen gel was freed from the edges with a pipette tip and 600 μl of cell culture media added to the well. Collagen gels were incubated at 37 °C for 24 hr before fixation (4% paraformaldehyde) and staining with Eosin-Y (Sigma) before imaging to quantify collagen gel area with ImageJ 1.50j.
Proliferation assays
Ovarian cancer cells were seeded at 1,000 cells per well in a 96-well plate and allowed to adhere for 24 hr before addition of conditioned media (72 hr) from the indicated cells. After 24 hr and 48 hr, nuclei were visualized by addition of Hoechst 33258 (1:5000) and wells fluorescently imaged with a Zeiss Axiovert Observer.A1 to extract cell number and doubling time. Images were analyzed with ImageJ 1.50j.
Migration assays
40,000 cells in serum-free media were added to the top chamber of an 8.0 μm PET cell culture insert (Falcon) with conditioned media (72 hr) from indicated cells in the bottom reservoir. After 12 (HeyA8) or 18 (TYK-nu) hr cells were fixed with 4% PFA in PBS, representative fluorescent images collected with a Zeiss Axiovert Observer.A1, stained with 0.1% crystal violet, washed extensively with PBS, and dried. Crystal violet was released with 10% acetic acid and the absorbance at 520 nm measured to quantify relative migration.
Gene expression analysis
RNA was collected from CAFs expressing shCtrl or shNNMT constructs and WI-38 normal fibroblasts in triplicate (AllPrep DNA/RNA Mini Kit, Qiagen). 700 pg of total RNA was used to generate double stranded cDNA, fragmented and biotin labeled according to Affymetrix GeneChip Pico Reagent Manual (Thermo Fisher Scientific). 5.5 μg of fragmented and labeled cDNA was hybridized to Human Clariom S arrays for 16 hr at 45 °C and 60 rpm in an Affymetrix Hybridization Oven 640. Arrays were washed and stained with streptavidin phycoerythrin in an Affymetrix Fluidics Station 450. Arrays were scanned using the Affymetrix Gene Chip Scanner 3000 7G and CEL intensity files generated by GeneChip Command Console Software. Data was processed with Transcriptome Analysis Software 4.0 using Signal Space Transformation-Robust Multi-Chip Analysis (SST-RMA). All analyses were performed at the probe level. Gene set enrichment analysis was performed with GSEA v2.2.0.
Global metabolite profiling using three mass spectrometry platforms
5 million CAFs expressing shCtrl or shNNMT constructs and 4.5 million 3T3 cells expressing control or NNMT overexpression constructs were collected in triplicate by trypsinization and flash frozen in liquid nitrogen. Untargeted metabolomics datasets were acquired using three mass spectrometry platforms at the West Coast Metabolomics Center, University of California, Davis. Metabolites were extracted as previously described44,45. HILIC. For hydrophilic interaction liquid chromatography (HILIC) qTOF for polar metabolites, the dried polar aliquot was resuspended in 80:20 acetonitrile:water (v/v) with internal standards. HILIC-qTOF was performed with a Agilent 1290 infinity UHPLC instrument with a Waters Acquity UPLC BEH Amide column coupled to an Agilent 6530 mass spectrometer equipped with an ion funnel (iFunnel) electro spray ionization source, as described46. For charged surface hybrid (CSH) qTOF for lipidomics, dried extracts were resuspended using a mixture of methanol/toluene (9:1, v/v) (60 μL) containing an internal standard [12-[[(cyclohexylamino)carbonyl]amino]-dodecanoic acid (CUDA)]. For CSH-qTOF, an Agilent 1290 Inifinity LC systems was coupled to either an Agilent 6530 (positive ion mode) or an Agilent 6550 (negative ion mode) mass spectrometer45,47,48. GC-TOF was performed with an Agilent 6890 gas chromatography instrument with an Rtx-5Sil MS column coupled to a Leco Pegasus IV time of flight mass spectrometer as previously described47,49. For GC-TOF platforms, ChromaTOF version 4.50.8 was used for data preprocessing and analyzed with the BinBase algorithm as previously described45,50. For CSH-qTOF and HILIC platforms, raw data files were converted to .abf using the ABF converter and MS-DIAL software was used for peak detection, alignment, gap filling and annotations. Metabolite identifications were performed on 3 levels according to Metabolomics Standards Initiative51 by using chromatography-specific databases in conjunction with mass spectral libraries (Mass Bank of North America and NIST 17), all publicly available on MoNA (http://mona.fiehnlab.ucdavis.edu/).
Global DNA methylation arrays
WI-38 lung fibroblasts expressing control or NNMT overexpression constructs and CAFs expressing shCtrl or shNNMT constructs were passaged for 21 days in 10 μM methionine growth media and DNA and RNA extracted in triplicate using the Qiagen AllPrep DNA/RNA Mini Kit per manufacturer’s instructions for parallel gene expression and DNA methylation analysis. DNA methylation was assessed using Illumina Infinium MethylationEPIC beadchip arrays at the University of Chicago Center for Functional Genomics52. The detectionP function from minfi was used to calculate probe detection p-values. The sample means were examined to ensure all samples had a mean p-value of detection less than 0.01. Background correction with dye-bias normalization and subsequent quantile normalization was applied using the preprocessNoob and preprocessQuantile functions from minfi. Probes were removed with too few remaining beads targeting a given site using the pfilter function from wateRmelon. Probes were removed that were crosshybridising, were located on sex chromosomes, or where SNPs were located within 2 bases of the target site, using rmSNPandCH and dropLociWithSnps from the DMRcate and minfi packages respectively. Probes that aligned to multiple locations were removed using the mutli.hit data from the ChAMP package. Differential tests were carried out separately by cell type using the contrasts NNMT/Ctrl and shNMMT/shCtrl for fibroblasts and CAFs, respectively. Tests for probe-wise differential methylation were carried out with limma using M-values.
Quantitative histone methylation proteomics
Nuclei were isolated using gentle detergent treatment (0.3% NP-40 in NIB-250 buffer) of cells and centrifugation at 0.6 rcf and washed with NIB-250 buffer. Histones were acid-extracted and derivatized with propionic anhydride both prior to and following trypsin. Propionylated histone peptides were resuspended in 50μL water with 1% TFA and 3μL were injected in 3 technical replicates on nanoLC/triple quadrupole MS which consisted of a Dionex UltiMate 3000 coupled to a ThermoFisher Scientific TSQ Quantum triple quadrupole mass spectrometer. Buffer A was 100% LC-MS grade water with 0.1% formic acid and buffer B was 100% ACN. The propionylated peptides were loaded onto an in-house packed C18 trapping column (4 cm × 150 μm; Magic AQ C18, 3μm, 200 Å - Michrom) for 10 min at a flow-rate of 2.5 μL/min in 0.1% TFA loading buffer. The peptides were separated by a gradient from 1 to 35% buffer B from 5 to 45 min. The analytical column was a 10 cm × 75 μm PicoChip (1PCH7515-105H253-NV New Objective) consisting of the same C18 material as the trapping column. The triple quadrupole settings were as follows: collision gas pressure of 1.5 mTorr; Q1 peak width of 0.7 (FWHM); cycle time of 3 s; skimmer offset of 10 V; electrospray voltage of 2.5kV. SRM mass spectrometer transitions were developed as described previously23. Data were analyzed using Skyline software (v3.5; MacCoss Lab, University of Washington) with Savitzky–Golay smoothing of peaks. Automatic peak assignment and retention times were checked manually.
H3K27me3 chromatin immunoprecipitation sequencing and bioinformatics
Two days prior to sample collection, two million 3T3 cells expressing control or NNMT overexpression constructs were seeded in a 15 cm dish and grown in DMEM supplemented with dialyzed FBS and 10 μM methionine. In parallel, RNA was collected from cells using the RNeasy Mini Kit (Qiagen) for gene expression analysis with RNA sequencing. After 48 hours, cells were fixed with 1% formaldehyde for 10 minutes at room temperature. Formaldehyde was quenched with glycine and cells scraped in cold PBS. Nuclei were isolated and chromatin sheared used micrococcal nuclease (MNase) per manufacturer’s suggestions (Cell Signaling SimpleChip Enzymatic Chromatin IP Kit #9003; 1000 gel units MNase/immunoprecipitation for 20 min at 37 °C). 10 μg of sheared DNA was chromatin immunoprecipitated with H3K27me3 (Cell Signaling #9751) or isotype control antibody (Cell Signaling #2729). All experiments were performed in biological triplicates. Libraries were prepared using the NEBNext Ultra II DNA Library Prep Kit for Illumina (NEB) with 5 cycles of PCR and sequencing with an Illumina HiSeq 4000 (SR50). Input samples were pooled before library preparation. RNA-sequencing libraries were prepared using standard NEB library preparation protocols and sequenced with an Illumina HiSeq 2000 (PE150; Novogene).
ChIP-sequencing reads were preprocessed with Trimmomatic 0.36 to remove low quality data and adapters before aligning to GRCm38 with BWA aln 0.7.17. Alignments were filtered and PCR duplicates were marked using sambamba 0.6.5. Differential binding was performed with rgt-THOR 0.11.2 which can integrate biological replicates using a Hidden Markov Model based approach53. THOR incorporates GC-content correction, input DNA normalization and subtraction, and global ChIP-seq signal normalization. Peaks were annotated with homer 4.8.3 and filtered to only keep peaks with an adjusted p-value < 0.05 and within 5 kb of a TSS. We integrated histone binding data with expression data by matching gene symbols of the filtered peaks (based on TSS) and differentially expressed genes (adjusted P-val < 0.05). Peak heatmaps were created by averaging the signals across the treatments and plotting different sets of genes using deepTools 3.1.0. RNA-sequencing reads were trimmed, low-quality reads removed, and aligned to mm10 using STAR v2.5.
5-amino-1-methylquinolin-1-ium iodide (NNMT inhibitor) synthesis
An equimolar mixture of 5-aminoquinoline (Sigma-Aldrich) and iodomethane (Sigma-Aldrich) was heated at 90 °C for 2 hr in isopropyl alcohol (0.5 M). After cooling to room temperature, precipitate was extracted with vacuum filtration, washed with a 1:1 mixture of isopropyl alcohol and ethanol, and dried to obtain a red powder (38.9% yield). For all experiments 5-amino-1-methylquinolinium was dissolved in PBS and filtered through a 0.22 μm syringe filter.
Recombinant hNNMT expression and purification
Human NNMT containing three alanine mutations (Addgene 40734) was cloned into the pET28-lic vector and used as a template for site-directed mutagenesis. A100K, A101E, and A103K present in the wild-type form of hNNMT as well as four additional His residues in N-terminus His-tag were introduced. The resulting vector was transformed into chemocompetent E. coli BL21 (DE3; NEB). 1L of Terrific Broth media (Invitrogen) was inoculated with overnight pre-cultures and grown to OD600 0.6 at 37 °C, 220 rpm; growth was continued at 17 °C overnight. Bacterial pellets were collected, resuspended in 50 mM Tris pH 8.0, 500 mM NaCl, 10% glycerol, 5 mM β-mercaptoethanol, 0.5 mM PMSF and lysed by sonication. Protein from the supernatant of centrifuged sonicate was purified by immobilized metal affinity chromatography using cobalt resin (Takara). Pooled fractions were further purified by size exclusion chromatography (SEC) on HiLoad 16/600 Superdex 75 pg, equilibrated with 50 mM Tris pH 8.0, 500 mM NaCl, 10% glycerol, 0.5 mM TCEP. Purity of protein fractions was assessed by SDS-PAGE. Selected, homogenous SEC fractions were pooled and protein concentrated to 10 mg/mL using 10 kDa MWCO centrifugal filter units (Amicon).
NNMT enzymatic activity assay
The Promega MTase-Glo Methyltransferase Assay kit was used to evaluate NNMT biochemical activity. Each reaction contained 0.04 ng of recombinant NNMT, 8 μM nicotinamide, and 6.7 μM SAM in 1x Reaction Buffer (20 mM Tris buffer pH 8.0, 50 mM NaCl, 1 mM EDTA, 3 mM MgCl2 0.1 mg/mL BSA, 1 mM DTT). Reactions were performed for 20 min at room temperature. MTase-Glo reagent and MTase-Glo Detection solution were added according to manufacturer’s instructions and luminescence signal measured with a SpectraMax i3 plate reader and data analyzed with GraphPad Prism version 7.04.
Cellular thermal shift assay (CETSA)
2×10⁵ CAOV3 cells were resuspended in 100 μL of PBS containing cOmplete Mini EDTA-free protease inhibitor cocktail. Samples were incubated at temperatures ranging between 45 and 70 °C using a BioRad T100 Thermal Cycler to evaluate NNMT aggregation temperature. The negative control sample was incubated at room temperature. NNMT thermal stability upon inhibitor binding was evaluated by addition of NNMTi to cell suspensions and at 58 °C (aggregation temperature; Tagg. Samples were centrifuged at 4000 rcf for 40 min at 4 °C. Supernatants containing the non-aggregated fraction of NNMT were separated by SDS-PAGE. Protein was visualized by immunoblotting using mouse NNMT monoclonal antibody (G4, Santa Cruz Biotechnology) and images analyzed with GraphPad Prism version 7.04.
Xenograft and syngeneic models
All animal experiments were conducted in compliance with approved University of Chicago Institutional Animal Care and Use Committee protocols (71951). Animals were not randomized and were not excluded. Sample size was based on pilot experiments and previous experience with the models. For the xenograft model, female nude mice (6-week old; Harlan) were subcutaneously injected in the left and right flanks with 100,000 HeyA8-Luciferase cells mixed with 200,000 CAFs expressing shCtrl or shNNMT constructs in 50% Matrigel (BD Biosciences) diluted with serum-free DMEM. Tumor burden was assessed 7 and 14 days after injection using a Xenogen IVIS 200. Maximum tumor size was limited to 1 cm in the longest dimension and was not exceeded. Luciferase imaging was performed via intraperitoneal injection of 100 μl D-luciferin (30 mg/ml in PBS; 0.22 μm sterile filtered) 10 min prior to imaging. Images were analyzed with Living Image 4.4 software and proliferation rate (doubling time) extracted from luciferase flux at days 7 and 14. Mice were sacrificed with isoflurane and tumors dissected to assess total tumor burden under blinded conditions. For the NNMT inhibitor experiment, 5 million HeyA8 cells were intraperitoneally injected in 20 female nude mice (6 weeks old, Harlan). Treatment with NNMT inhibitor was started 24 hr after injection. NNMTi (20 mg/kg in PBS; 0.22mm sterile filtered) or PBS (vehicle control) were administered via intraperitoneal injection every 24 hours. Mice were sacrificed with isofluorane after 10 days of treatment and tumors harvested and weighed to assess total tumor burden under blinded conditions. For the syngeneic model, ID8-luciferase/GFP cells were pre-treated with conditioned media (72 hr) from 3T3 cells overexpressing NNMT or a control construct for 48 hr. Animals were not randomized and were not excluded. 4 million pre-treated ID8 cells were injected intraperitoneally in 7 female C57BL/6 mice (6 weeks old; Harlan) and allowed to implant for 14 hr before mice were sacrificed and the omentums harvested. Following imaging of the omentums (GFP), tissues were lysed with luciferase assay lysis buffer (Promega) and luciferase signal detected using a Lumat LB 9507 luminometer (Berthold Technologies). Analysis of tumor burden was conducted under blinded conditions.
Statistics and reproducibility
Statistical analyses were carried out using Perseus, Excel, R, and GraphPad Prism 7.01. Data are reported as mean ± standard error of mean (SEM), unless otherwise noted in figure legends. Number and type of replicates are indicated in the legends of the corresponding figures. Experiments for which representative images are presented were reproduced with at least three biological replicates. Sample size was based on pilot experiments or previous experience with the models. P values are reported in the figures or figure legends and were calculated with unpaired Student’s t-test for two groups or analysis of variation (ANOVA) with Tukey correction for experiments with more than two groups. For survival analyses, significance was assessed with log-rank (Mantel-Cox) test and hazard ratios calculated with log-rank test. P values less than 0.05 were considered significant (95% confidence interval).
Data availability statement.
All data supporting the findings of this study are available within the paper, Extended Data Figures 1–10, the Source Data (of Fig. 2–4 and Extended Data Fig. 2–10), publically accessible repositories, or from the corresponding author upon reasonable request. Proteomic data is available online at http://maxqb.biochem.mpg.de/mxdb/project/show/9373012627500 and have been deposited to the ProteomeXchange Consortium (http://proteomecentral.proteomexchange.org/cgi/GetDataset?ID=PXD006396) via the PRIDE partner repository with the dataset identifier PXD006396. Raw and processed data is available in the Gene Expression Omnibus (GEO) database (gene expression microarray data: GSE112497; DNA methylation array: GSE126672; RNA-sequencing data: GSE124014; ChIP-sequencing data: GSE124015). The MaxQuant quantitative proteomics software package and Perseus data analysis software environment are freely available: http://www.biochem.mpg.de/5111733/software. Supplementary data is available online.
Extended Data
Extended Data Fig. 1: Quantitative proteomics of low-input samples.
(a) MaxLFQ label-free quantitation values and dynamic range are similar across all anatomic sites and in both tumor (left) and stroma (right) samples. (b) Example of experimental replicates of microdissection, protein extraction, and quantitative proteomics with Pearson correlation of 0.98. n = 2 technical replicates. (c) Unsupervised hierarchical clustering of all proteomic samples leads to clustering of tumor (n = 43) and stromal (n=42) samples characterized by proteomic signatures associated with the indicated pathways (green and purple boxes, respectively). Enriched KEGG pathways for tumor (left) and stroma (right) are annotated. (d) One-dimensional principal component analysis of all tumor (n=43) and stromal (n = 42) samples. Component 1 accounts for 23.5% of the total data variation. (e) Volcano plot comparing all tumor and all stromal samples reveals enrichment of known markers characterizing tumor (green; n = 43 samples) and stromal (purple; n = 42 samples) components of the tumor (MUC16 is CA-125). ANOVA FDR < 0.01, n = 11 patients.
Extended Data Fig. 2: HGSC progression is characterized by patient-specific signatures in the tumor compartment and anatomic site-specific signatures in the stroma.
(a) FABP4 expression in tumor (n = 36) and stromal (n = 38) compartments derived from label-free, quantitative proteomics. One-way ANOVA. (b) Plot of ANOVA p-values of tumor (left; n = 43) or stroma (right; n =42) samples calculated by patient (y-axis) or anatomic site (x-axis). In the tumor compartment, differential expression of proteins is driven by the patient grouping; in the stromal compartment, anatomic site-specific differences are more pertinent. (c) Principal component analysis resolves an omental stromal cluster (n =42). No anatomic-site specific clusters are present in tumor samples (n =43). (d) Left and right panels show proportions of all proteins that are significantly different by patient (red) or anatomic site/compartment (blue). 1,474 proteins are differentially expressed in the tumor compartment between patients while only 30 stromal proteins are significantly different between patients. In respect to the compartment (tumor/stroma, blue; gray is undetected) one protein is differentially expressed in the tumor compartment (FABP4) while 128 proteins are differentially expressed in the stroma. (e) Unsupervised hierarchical clustering of tumor (left, 1,474 significant proteins from panel d) and stroma (right, 128 significant proteins from panel d) proteins reveals patient-specific clustering in the tumor compartment (n = 43) while the stromal samples (n = 42) cluster by anatomic site. Note, all omental samples (red) across all patients cluster together. (f) Unsupervised hierarchical clustering of only stromal proteins (n =42) that are differentially expressed between primary sites (FT and Ov) and metastases (Om) reveal anatomic site-specific clusters, including a core signature of 21 proteins consistently upregulated in the stroma of omental metastases (box). (g) Expression of the 21 protein signature in the TCGA subtypes reveals enhanced expression in mesenchymal subtype (n = 21 proteins).
Extended Data Fig. 3: NNMT is highly expressed in the stroma of ovarian cancers.
(a) Quantitative proteomics of the stroma finds elevated expression of NNMT in omental metastases (n = 11) compared to normal (normal fallopian tube (nFT; n = 5), normal ovarian (nOv; n = 5), and normal omentum (nOm; n = 6) and primary tumor tissues (STIC, n = 9; invasive fallopian tube (FT), n = 10; and invasive ovarian (Ov), n = 11). (b) Human omental metastasis tissue stained with NNMT-specific antibody or IgG isotype control; no non-specific staining is observed. Scale bar = 50 μm. (c) Representative NNMT IHC of peritoneal metastasis. (d) NNMT IHC of an omentum with micrometastases (1) and larger metastases (2 and 3). NNMT is detected in the stroma of very early metastases. (e) Quantification of tumor NNMT staining in TMA analysis. Chi-square test, n = 169 ovarian, 135 omental, and 92 peritoneal samples. (f) Representative IHC of NNMT in the stroma of metastases in an autochthonous model of ovarian cancer (top, PAX8:TP53mut;PTEN−/− ;BRCA1mut) and a syngeneic model (bottom, ID8 intraperitoneal xenograft). (g) NNMT is expressed in the stroma of breast and colon cancers, but not normal breast stroma.
Extended Data Fig. 4: NNMT promotes acquisition and maintenance of the CAF phenotype.
(a) qRT-PCR for NNMT in CAFs expressing an shRNA against NNMT. Two-sided t-test, n = 3 biological replicates. (b) Immunofluorescence analysis of smooth-muscle actin (SMA) reveals a decrease of SMA stress fibers upon knockdown of NNMT in CAFs. (c) Representative phase contrast images of normal omental fibroblasts and primary CAFs expressing shCtrl and shNNMT constructs. Upon knockdown of NNMT a reversion of CAF morphology to more closely resemble normal omental fibroblasts is observed. Scale bar = 50 μm. (d) Relative mRNA (two-sided t-test, n = 3 biological replicates) and (e) immunoblotting of fibronectin and SMA in CAFs transfected with the indicated siRNAs. (f) Knockdown of NNMT in stromal cells attenuates expression of fibronectin, SMA, and Snai1 following TGF-β treatment. (g) Cytokine array. A shNNMT construct was expressed in primary human CAFs and a cytokine array performed on the conditioned media. Cytokines downregulated upon knockdown of NNMT are highlighted in blue, those increased in red. Individual cytokines are indicated by Roman numerals. n = 2 technical replicates. (h-k) Gene set enrichment analysis (GSEA) of genes regulated by NNMT in stromal cells reveals associations with (h-i) the epithelial-mesenchymal transition hallmark gene set; (j) proteins enriched in the metastatic stroma compared to primary tumor stroma (proteomics-our data); and (k) the TCGA mesenchymal signature (RNA). (l) Representative images of chemotaxis of indicated HGSC cells in response to conditioned media from CAFs expressing shCtrl or shNNMT constructs. (m) Proliferation of HeyA8 cells grown in direct co-culture with CAFs transfected with the indicated siRNAs. Two-sided t-test, n = 3 biological replicates. All bar graphs represent mean of data and error bars are SEM.
Extended Data Fig. 5: NNMT regulates nicotinamide metabolism and sirtuins.
(a) NNMT depletes nicotinamide (NA), a precursor to NAD+ biosynthesis; NAD+ is an essential cofactor for sirtuin deacetylase activity which broadly regulates acetylation of proteins including tubulin and histones. NamPRT: nicotinamide phosphoribosyl transferase; NMNAT: nicotinamide mononucleotide adenylyltransferase; NADK: nicotinamide adenine dinucleotide kinase. (b) Quantification of NAD+, NADH, and the NAD+/NADH ratio in CAFs expressing shCtrl or shNNMT constructs. Two-sided t-test, n = 3 biological replicates. (c) Relative expression of genes regulated by sirtuin activity in CAFs expressing shCtrl or shNNMT constructs. Two-sided t-test, n = 3 biological replicates. Catalase (CAT), Succinate dehydrogenase subunit B (SDHB) (d) Acetylation of α-tubulin and histone H3K9 are reduced upon knockdown of NNMT in CAFs. (e) Quantification of α-tubulin acetylation immunoblots in CAFs expressing the indicated constructs. Two-sided t-test, n = 3 biological replicates. All bar graphs represent mean of data and error bars are SEM.
Extended Data Fig. 6: NNMT regulates global metabolism.
(a) Untargeted metabolite profiling reveals that NNMT induces conserved metabolic changes. Metabolites that are significantly changed upon both knockdown and overexpression of NNMT are shown (p < 0.05). Samples cluster by NNMT expression status rather than cell of origin. (b) The polyamine pathway consumes decarboxylated SAM (AdoMetDC, generated from SAM by the action of SAM decarboxylase; SAMDC) and generates 5-methylthioadenosine (5-MTA) during the conversion of putrescine to spermidine and spermine. ODC: ornithine decarboxylase; SRM: spermidine synthase; SMS: spermine synthase. (c-d) 5-MTA and putrescine levels are positively associated with NNMT expression in both fibroblasts and CAFs. All bar graphs represent mean of data and error bars are SEM.
Extended Data Fig. 7: NNMT regulates DNA and histone methylation in the stroma.
(a) Overexpression of NNMT leads to hypomethylation. Distribution of significantly different β-values (Benjamini-Hochberg adjusted p-value < 0.01) within 1500 bp of transcriptional start sites in fibroblasts expressing the indicated constructs as assessed by global DNA methylation arrays. β-values are lower in cells overexpressing NNMT, indicating decreased DNA methylation associated with transcriptional start sites. n = 2 biological replicates. (b) KEGG pathway analysis of genes differentially methylated upon both NNMT overexpression and knockdown in normal fibroblasts and CAFs, respectively. FDR (B&H) = Benjamini and Hochberg p-value. (c) Treatment of normal fibroblasts with the DNA methylation inhibitor 5-Aza (100 nM) leads to an increase in SMA expression. (d) Collagen contractility of normal fibroblasts is increased following treatment with 5-Aza (100 nM). Two-sided t-test, n = 3 biological replicates. (e) NNMT-mediated attenuation of H3K4 trimethylation is metabolically regulated and can be rescued by high (200 μM) methionine concentrations. (f) Quantification of H3K4 trimethylation immunoblotting in cells cultured with media containing 10 or 200 μM methionine. Two-sided t-test, n = 3 biological replicates. All bar graphs represent mean of data and error bars are SEM.
Extended Data Fig. 8: NNMT regulates stromal histone methylation.
(a) Genes regulated by the downregulation of H3K27 trimethylation (Acevedo gene set from Molecule Signatures Database) are enriched in genes regulated by NNMT overexpression as assessed by GSEA. (b) Overexpression of NNMT in normal fibroblasts followed by H3K27me3 immunoprecipitation and ChIP-seq. Violin plot of ChIP-seq peak size distribution corresponding to H3K27me3 occupancy at the promoter of genes significantly upregulated (gene expression FDR p < 0.05 from RNA-sequencing analysis) in NNMT overexpressing fibroblasts; NNMT overexpression leads to a significant reduction in H3K27me3 occupancy. Solid black line indicates median, dashed lines the quartiles. (c) Same experimental setup as in (b). H3K27me3 ChIP-sequencing of normal fibroblasts overexpressing NNMT. H3K27me3 read density plots (top) and heatmaps (bottom) in relationship to genes downregulated, upregulated, or unchanged (gene expression FDR p < 0.05 from RNA sequencing analysis) in response to NNMT overexpression. ChIP-seq data are binned into expression groups from parallel RNA sequencing analysis. TSS = transcriptional start site, n = 3 biological replicates. (d) Overexpression of NNMT leads to genome-wide H3K27 hypomethylation (reduced H3K27me3 occupancy) at gene promoters adjacent to transcriptional start sites (TSS). Thus, NNMT expression upregulates expression of a significant number of genes by relieving H3K27me3-mediated transcriptional suppression. (e) Immunohistochemistry of COMP in an omental metastasis. TSS = transcriptional start site. Scale bar = 100 μm. (f) COMP gene expression in CAFs or fibroblasts expressing the indicated constructs. Two-sided t-test, n = 3 biological replicates. (g) Coverage tracks of H3K27me3 ChIP-sequencing analysis of fibroblasts expressing control or NNMT overexpression constructs. Genes regulated by NNMT expression (Comp) display reduced coverage depth while non-perturbed loci (Hoxa10/Hoxa11) are sequenced to similar depths. Comp, Hoxa10, and Hoxa11 exon/intro structure are indicated and Comp gene direction and TSS. All bar graphs represent mean of data and error bars are SEM.
Extended Data Fig. 9: Inhibition of H3K27 trimethylation restores features of the CAF phenotype.
(a) Expression of CAF marker genes in CAFs expressing shNNMT and treated with the EZH2 histone methyltransferase inhibitor DZNep. Two-sided t-test, n = 3 biological replicates. (b) Immunoblot of CAFs expressing a shNNMT construct treated with the general methyltransferase inhibitor 3-DZA. Knockdown of EZH2 in CAFs expressing a shNNMT construct leads to (c) decreased H3K27 trimethylation, and (d) increased collagen contractility. Two-sided t-test, n = 3 biological replicates. All bar graphs represent mean of data and error bars are SEM.
Extended Data Fig. 10: NNMT inhibition.
(a) Raw tumor luminescence values of HeyA8/CAF subcutaneous xenograft at 7 and 14 days following implantation. CAF expressing shNNMT construct (or control; shNNMT) (b) In vitro NNMT enzymatic activity assay in response to NNMTi treatment, n = 3 experimental replicates. (c) Cellular thermal shift assay (CETSA) performed with CAOV3 cells at the indicated temperatures to establish aggregation temperature for NNMT. (d) CETSA suggests cellular target engagement of NNMTi at micromolar concentrations. (e) Small molecule inhibition of NNMT in CAFs leads to reduction in tubulin acetylation. (f) Quantification of H3K4me3 immunoblotting in fibroblasts expressing the indicated constructs following treatment with NNMTi; H3K4 trimethylation is only increased in cells expressing NNMT after treatment with the inhibitor, indicating that effects on histone methylation are NNMT-specific. Two-sided t-test, n = 3 biological replicates. (g) Immunoblotting: NNMT is only expressed in the CAOV3 OvCa cell line. Treatment of (h) OvCa cells or (i) CAFs with the NNMTi only reduced cell viability at high concentrations, n = 3 biological replicates. (j) Representative images and quantification of cancer cell proliferation in murine tumors treated with NNMTi or vehicle control. Two-sided t-test, n = 8 biological replicates. Scale bar = 100 μm. (k) Murine omental tumor tissue stained with H3K27me3 or IgG isotype control antibody demonstrates specificity of antibody. Scale bar = 10 μm. (l) Immunofluorescence of H3K27me3 in omental metastases from mice in Fig. 4d confirms that NNMT inhibition increases histone methylation in the TME. Stromal compartment is highlighted by dashed lines. Scale bar = 50 μm. (m) Quantification of H3K27me3 nuclear staining intensity of stroma or tumor compartment in omental tumors from mice treated with vehicle or NNMTi. H3K27 trimethylation is increased in the stromal compartment. Two-sided t-test, n = 8 biological replicates. (n) Representative images of ovarian tumors expressing stromal NNMT. (o) Kaplan-Meier curve of recurrence-free survival of patients with low (black) or high (red) stromal NNMT expression in primary tumor sites (Two-tailed test). Kaplan-Meier curve of (p) overall and (q) recurrence-free survival of patients with low (black) or high (red) tumor NNMT expression in primary sites (Two-tailed test). All bar graphs represent mean of data and error bars are SEM.
Supplementary Material
ACKNOWLEDGEMENTS
We thank Drs. H. A. Kenny, K. Watters, and A. Mukherjee from the University of Chicago ovarian cancer laboratory for helpful discussions. We are thankful to Gail Isenberg, University of Chicago, for editing the manuscript. This work was supported by a Marsha Rivkin Foundation award (MAE), National Cancer Institute (NCI) grants CA111882 and CA211916 (EL), the Ludwig Institute for Cancer Research (EL), the Arthur L. and Lee G. Herbst Professorship (EL), funding support from Stephanie and John Harris, Marshall Field, Jamee Kane and Abby Gerry (MAE and SDY), NIH grant CA175399 and DP2GM128199 (REM), V Foundation for Cancer Research (V2016-020 to REM), the Körber Foundation / Körber European Science Prize (MM), the Max-Planck Society for the Advancement of Science (MM), the Novo Nordisk Foundation (Grant agreement NNF14CC0001 and NNF15CC0001; FC and MM), and University of Chicago Cancer Center Support Grant P30CA014599.
Footnotes
Supplementary Information is linked to the online version of the paper at www.nature.com/nature.
The authors declare no competing financial interests.
REFERENCES.
- 1.The Cancer Genome Atlas, N. Integrated genomic analyses of ovarian carcinoma. Nature 474, 609–615 (2011). [DOI] [PMC free article] [PubMed] [Google Scholar]
- 2.Zhang H et al. Integrated proteogenomic characterization of human high-grade serous ovarian cancer. Cell 166, 755–765, doi: 10.1016/j.cell.2016.05.069 (2016). [DOI] [PMC free article] [PubMed] [Google Scholar]
- 3.Kuhn E et al. TP53 mutations in serous tubal intraepithelial carcinoma and concurrent pelvic high-grade serous carcinoma-evidence supporting the clonal relationship of the two lesions. J. Pathol 226, 421–426 (2012). [DOI] [PMC free article] [PubMed] [Google Scholar]
- 4.Alexandrov LB et al. Signatures of mutational processes in human cancer. Nature 500, 415–421, doi: 10.1038/nature12477 (2013). [DOI] [PMC free article] [PubMed] [Google Scholar]
- 5.Francavilla C et al. Phosphoproteomics of primary cells reveals druggable kinase signatures in ovarian cancer. Cell reports 18, 3242–3256, doi: 10.1016/j.celrep.2017.03.015 (2017). [DOI] [PMC free article] [PubMed] [Google Scholar]
- 6.Coscia F et al. Integrative proteomic profiling of ovarian cancer cell lines reveals precursor cell associated proteins and functional status. Nat. Commun 7, 12645, doi: 10.1038/ncomms12645 (2016). [DOI] [PMC free article] [PubMed] [Google Scholar]
- 7.Polyak K, Haviv I & Campbell IG Co-evolution of tumor cells and their microenvironment. Trends Genet 25, 30–38 (2009). [DOI] [PubMed] [Google Scholar]
- 8.Kalluri R The biology and function of fibroblasts in cancer. Nat. Rev. Cancer 16, 582–598, doi: 10.1038/nrc.2016.73 (2016). [DOI] [PubMed] [Google Scholar]
- 9.Aebersold R & Mann M Mass-spectrometric exploration of proteome structure and function. Nature 537, 347–355, doi: 10.1038/nature19949 (2016). [DOI] [PubMed] [Google Scholar]
- 10.Altelaar AF & Heck AJ Trends in ultrasensitive proteomics. Curr Opin Chem Biol 16, 206–213, doi: 10.1016/j.cbpa.2011.12.011 (2012). [DOI] [PubMed] [Google Scholar]
- 11.Nieman KM et al. Adipocytes promote ovarian cancer metastasis and provide energy for rapid tumor growth. Nat. Med 17, 1498–1503, doi: 10.1038/nm.2492 (2011). [DOI] [PMC free article] [PubMed] [Google Scholar]
- 12.Pissios P Nicotinamide N-methyltransferase: more than a vitamin B3 clearance enzyme. Trends Endocrinol. Metab, 340–353, doi: 10.1016/j.tem.2017.02.004 (2017). [DOI] [PMC free article] [PubMed] [Google Scholar]
- 13.Aksoy S, Szumlanski CL & Weinshilboum RM Human liver nicotinamide N-methyltransferase. cDNA cloning, expression, and biochemical characterization. J. Biol. Chem 269, 14835–14840 (1994). [PubMed] [Google Scholar]
- 14.Ulanovskaya OA, Zuhl AM & Cravatt BF NNMT promotes epigenetic remodeling in cancer by creating a metabolic methylation sink. Nat. Chem. Biol 9, 300–306, doi: 10.1038/nchembio.1204 (2013). [DOI] [PMC free article] [PubMed] [Google Scholar]
- 15.Kraus D et al. Nicotinamide N-methyltransferase knockdown protects against diet-induced obesity. Nature 508, 258–262, doi: 10.1038/nature13198 (2014). [DOI] [PMC free article] [PubMed] [Google Scholar]
- 16.Hong S et al. Nicotinamide N-methyltransferase regulates hepatic nutrient metabolism through Sirt1 protein stabilization. Nat. Med 21, 887–894, doi: 10.1038/nm.3882 (2015). [DOI] [PMC free article] [PubMed] [Google Scholar]
- 17.Sperber H et al. The metabolome regulates the epigenetic landscape during naive-to-primed human embryonic stem cell transition. Nat. Cell Biol 17, 1523–1535, doi: 10.1038/ncb3264 (2015). [DOI] [PMC free article] [PubMed] [Google Scholar]
- 18.Perets R et al. Transformation of the fallopian tube secretory epithelium leads to high-grade serous ovarian cancer in Brca; Tp53; Pten models. Cancer Cell 24, 751–765 (2013). [DOI] [PMC free article] [PubMed] [Google Scholar]
- 19.Orimo A et al. Stromal fibroblasts present in invasive human breast carcinomas promote tumor growth and angiogenesis through elevated SDF-1/CXCL 12 secretion. Cell 121, 335–348 (2005). [DOI] [PubMed] [Google Scholar]
- 20.Olumi AF et al. Carcinoma-associated fibroblasts direct tumor progression of intiated human prostatic epithelium. Cancer Res 59, 5002–5011 (1999). [DOI] [PMC free article] [PubMed] [Google Scholar]
- 21.Neelakantan H et al. Selective and membrane-permeable small molecule inhibitors of nicotinamide N-methyltransferase reverse high fat diet-induced obesity in mice. Biochem. Pharmacol 147, 141–152, doi: 10.1016/j.bcp.2017.11.007 (2018). [DOI] [PMC free article] [PubMed] [Google Scholar]
- 22.Ferro AJ, Vandenbark AA & MacDonald MR Inactivation of S-adenosylhomocysteine hydrolase by 5’-deoxy-5’-methylthioadenosine. Biochem. Biophys. Res. Commun 100, 523–531 (1981). [DOI] [PubMed] [Google Scholar]
- 23.Zheng Y et al. Total kinetic analysis reveals how combinatorial methylation patterns are established on lysines 27 and 36 of histone H3. Proc. Natl. Acad. Sci. U. S. A 109, 13549–13554, doi: 10.1073/pnas.1205707109 (2012). [DOI] [PMC free article] [PubMed] [Google Scholar]
- 24.Leung CS et al. Calcium-dependent FAK/CREB/TNNC1 signalling mediates the effect of stromal MFAP5 on ovarian cancer metastatic potential. Nat. Commun 5, 5092, doi: 10.1038/ncomms6092 (2014). [DOI] [PMC free article] [PubMed] [Google Scholar]
- 25.Kenny HA et al. Targeting the urokinase plasminogen activator receptor inhibits ovarian cancer metastasis. Clin. Cancer Res 17, 459–471, doi: 10.1158/1078-0432.CCR-10-2258 (2011). [DOI] [PMC free article] [PubMed] [Google Scholar]
- 26.Pozniak Y et al. System-wide Clinical Proteomics of Breast Cancer Reveals Global Remodeling of Tissue Homeostasis. Cell Syst 2, 172–184, doi: 10.1016/j.cels.2016.02.001 (2016). [DOI] [PubMed] [Google Scholar]
- 27.Eckert MA et al. Genomics of ovarian cancer progression reveals diverse metastatic trajectories including intraepithelial metastasis to the fallopian tube. Cancer Discov 6, 1342–1351, doi: 10.1158/2159-8290.CD-16-0607 (2016). [DOI] [PMC free article] [PubMed] [Google Scholar]
- 28.Labidi-Galy SI et al. High grade serous ovarian carcinomas originate in the fallopian tube. Nat. Commun 8, 1093, doi: 10.1038/s41467-017-00962-1 (2017). [DOI] [PMC free article] [PubMed] [Google Scholar]
- 29.Hu M et al. Distinct epigenetic changes in the stromal cells of breast cancers. Nat. Genet 37, 899–905 (2005). [DOI] [PubMed] [Google Scholar]
- 30.Zong Y et al. Stromal epigenetic dysregulation is sufficient to initiate mouse prostate cancer via paracrine Wnt signaling. Proc. Natl. Acad. Sci. U. S. A 109, E3395–3404, doi: 10.1073/pnas.1217982109 (2012). [DOI] [PMC free article] [PubMed] [Google Scholar]
METHODS REFERENCES.
- 31.Wang H et al. Development and evaluation of a micro- and nanoscale proteomic sample preparation method. J. Proteome Res 4, 2397–2403, doi: 10.1021/pr050160f (2005). [DOI] [PMC free article] [PubMed] [Google Scholar]
- 32.Roulhac PL et al. Microproteomics: quantitative proteomic profiling of small numbers of laser-captured cells. Cold Spring Harb Protoc 2011, pdb prot5573, doi: 10.1101/pdb.prot5573 (2011). [DOI] [PMC free article] [PubMed] [Google Scholar]
- 33.Scheltema RA et al. The Q Exactive HF, a benchtop mass spectrometer with a pre-filter, high-performance quadrupole and an ultra-high-field Orbitrap analyzer. Mol Cell Proteomics 13, 3698–3708 (2014). [DOI] [PMC free article] [PubMed] [Google Scholar]
- 34.Michalski A et al. Mass spectrometry-based proteomics using Q Exactive, a high-performance benchtop quadrupole Orbitrap mass spectrometer. Mol. Cell. Proteomics 10, M111 011015, doi: 10.1074/mcp.M111.011015 (2011). [DOI] [PMC free article] [PubMed] [Google Scholar]
- 35.Cox J & Mann M MaxQuant enables high peptide identification rates, individualized p.p.b.-range mass accuracies and proteome-wide protein quantification. Nat. Biotechnol 26, 1367–1372 (2008). [DOI] [PubMed] [Google Scholar]
- 36.Cox J et al. Andromeda: a peptide search engine integrated into the MaxQuant environment. J. Proteome Res 10, 1794–1805, doi: 10.1021/pr101065j (2011). [DOI] [PubMed] [Google Scholar]
- 37.Cox J et al. Accurate proteome-wide label-free quantification by delayed normalization and maximal peptide ratio extraction, termed MaxLFQ. Mol. Cell. Proteomics 13, 2513–2526, doi: 10.1074/mcp.M113.031591 (2014). [DOI] [PMC free article] [PubMed] [Google Scholar]
- 38.Tyanova S et al. Proteomic maps of breast cancer subtypes. Nat. Commun 7, 10259, doi: 10.1038/ncomms10259 (2016). [DOI] [PMC free article] [PubMed] [Google Scholar]
- 39.Tusher VG, Tibshirani R & Chu G Significance analysis of microarrays applied to the ionizing radiation response. Proc. Natl. Acad. Sci. U. S. A 98, 5116–5121, doi: 10.1073/pnas.091062498 (2001). [DOI] [PMC free article] [PubMed] [Google Scholar]
- 40.Cox J & Mann M 1D and 2D annotation enrichment: a statistical method integrating quantitative proteomics with complementary high-throughput data. BMC Bioinformatics 13 Suppl 16, S12, doi: 10.1186/1471-2105-13-S16-S12 (2012). [DOI] [PMC free article] [PubMed] [Google Scholar]
- 41.Kenny HA et al. Mesothelial cells promote early ovarian cancer metastasis through fibronectin secretion. J. Clin. Invest 124, 4614–4628, doi: 10.1172/JCI74778 (2014). [DOI] [PMC free article] [PubMed] [Google Scholar]
- 42.Mitra AK et al. MicroRNAs reprogram normal fibroblasts into cancer-associated fibroblasts in ovarian cancer. Cancer Discov 2, 1100–1108, doi: 10.1038/onc.2015.89 (2012). [DOI] [PMC free article] [PubMed] [Google Scholar]
- 43.Chang JW, Lee G, Coukos JS & Moellering RE Profiling Reactive Metabolites via Chemical Trapping and Targeted Mass Spectrometry. Anal. Chem 88, 6658–6661, doi: 10.1021/acs.analchem.6b02009 (2016). [DOI] [PMC free article] [PubMed] [Google Scholar]
- 44.Cajka T & Fiehn O LC-MS-based lipidomics and automated identification of lipids using the LipidBlast in-silico MS/MS library. Methods Mol. Biol 1609, 149–170, doi: 10.1007/978-1-4939-6996-8_14 (2017). [DOI] [PubMed] [Google Scholar]
- 45.Cajka T, Smilowitz JT & Fiehn O Validating quantitative untargeted lipidomics across nine liquid chromatography-high-resolution mass spectrometry platforms. Anal. Chem 89, 12360–12368, doi: 10.1021/acs.analchem.7b03404 (2017). [DOI] [PubMed] [Google Scholar]
- 46.Showalter MR et al. Obesogenic diets alter metabolism in mice. PLoS One 13, e0190632, doi: 10.1371/journal.pone.0190632 (2018). [DOI] [PMC free article] [PubMed] [Google Scholar]
- 47.Tu LN et al. Metabolomic characteristics of cholesterol-induced non-obese nonalcoholic fatty liver disease in mice. Sci. Rep 7, 6120, doi: 10.1038/s41598-017-05040-6 (2017). [DOI] [PMC free article] [PubMed] [Google Scholar]
- 48.Fahrmann J et al. Systemic alterations in the metabolome of diabetic NOD mice delineate increased oxidative stress accompanied by reduced inflammation and hypertriglyceremia. Am. J. Physiol. Endocrinol. Metab 308, E978–989, doi: 10.1152/ajpendo.00019.2015 (2015). [DOI] [PMC free article] [PubMed] [Google Scholar]
- 49.Fiehn O Metabolomics by gas chromatography-mass spectrometry: combined targeted and untargeted profiling. Curr. Protoc. Mol. Biol 114, 1–32, doi: 10.1002/0471142727.mb3004s114 (2016). [DOI] [PMC free article] [PubMed] [Google Scholar]
- 50.Skogerson K, Wohlgemuth G, Barupal DK & Fiehn O The volatile compound BinBase mass spectral database. BMC Bioinformatics 12, 321, doi: 10.1186/1471-2105-12-321 (2011). [DOI] [PMC free article] [PubMed] [Google Scholar]
- 51.Sumner LW et al. Proposed minimum reporting standards for chemical analysis Chemical Analysis Working Group (CAWG) Metabolomics Standards Initiative (MSI). Metabolomics 3, 211–221, doi: 10.1007/s11306-007-0082-2 (2007). [DOI] [PMC free article] [PubMed] [Google Scholar]
- 52.Pidsley R et al. Critical evaluation of the Illumina MethylationEPIC BeadChip microarray for whole-genome DNA methylation profiling. Genome Biol 17, 208, doi: 10.1186/s13059-016-1066-1 (2016). [DOI] [PMC free article] [PubMed] [Google Scholar]
- 53.Allhoff M, Sere K, J FP, Zenke M & I GC Differential peak calling of ChIP-seq signals with replicates with THOR. Nucleic Acids Res 44, e153, doi: 10.1093/nar/gkw680 (2016). [DOI] [PMC free article] [PubMed] [Google Scholar]
Associated Data
This section collects any data citations, data availability statements, or supplementary materials included in this article.
Supplementary Materials
Data Availability Statement
All data supporting the findings of this study are available within the paper, Extended Data Figures 1–10, the Source Data (of Fig. 2–4 and Extended Data Fig. 2–10), publically accessible repositories, or from the corresponding author upon reasonable request. Proteomic data is available online at http://maxqb.biochem.mpg.de/mxdb/project/show/9373012627500 and have been deposited to the ProteomeXchange Consortium (http://proteomecentral.proteomexchange.org/cgi/GetDataset?ID=PXD006396) via the PRIDE partner repository with the dataset identifier PXD006396. Raw and processed data is available in the Gene Expression Omnibus (GEO) database (gene expression microarray data: GSE112497; DNA methylation array: GSE126672; RNA-sequencing data: GSE124014; ChIP-sequencing data: GSE124015). The MaxQuant quantitative proteomics software package and Perseus data analysis software environment are freely available: http://www.biochem.mpg.de/5111733/software. Supplementary data is available online.


