

Abstract
Motivation
Transcriptome-based computational drug repurposing has attracted considerable interest by bringing about faster and more cost-effective drug discovery. Nevertheless, key limitations of the current drug connectivity-mapping paradigm have been long overlooked, including the lack of effective means to determine optimal query gene signatures.
Results
The novel approach Dr Insight implements a frame-breaking statistical model for the ‘hand-shake’ between disease and drug data. The genome-wide screening of concordantly expressed genes (CEGs) eliminates the need for subjective selection of query signatures, added to eliciting better proxy for potential disease-specific drug targets. Extensive comparisons on simulated and real cancer datasets have validated the superior performance of Dr Insight over several popular drug-repurposing methods to detect known cancer drugs and drug–target interactions. A proof-of-concept trial using the TCGA breast cancer dataset demonstrates the application of Dr Insight for a comprehensive analysis, from redirection of drug therapies, to a systematic construction of disease-specific drug-target networks.
Availability and implementation
Dr Insight R package is available at https://cran.r-project.org/web/packages/DrInsight/index.html.
Supplementary information
Supplementary data are available at Bioinformatics online.
1 Introduction
Computational drug repurposing has recently gained increasing popularity in modern pharmacogenomic studies. Large-scale drug-perturbed gene expression datasets, such as Connectivity Map (CMap) (Lamb et al., 2006; Subramanian et al., 2017), provide unprecedented opportunities for prioritizing treatments based on the associations between disease state and chemical intervention. Numerical computational approaches have been developed, taking full advantage of these high-throughput resources, for in silico prediction of disease–drug connectivity and drug–drug connectivity (El-Hachem et al., 2017; Hameed et al., 2018; Iorio et al., 2010, 2013; Lee et al., 2016a; Peyvandipour et al., 2018; Sirota et al., 2011). Notable successes have been achieved using CMap and its variants to uncover novel therapeutic redirections of existing drugs to treat various types of diseases, including obesity (Lee et al., 2016b; Liu et al., 2015a), neurodegenerative diseases (Sandor et al., 2017; Siavelis et al., 2016), gastrointestinal and liver diseases (Hicks et al., 2017), stroke and sepsis (Chen et al., 2015b) and cancers (Hsieh et al., 2016; Liu et al., 2015b; Xiang et al., 2016; Zhao et al., 2016). It is worth noting that the rapid growth of computational drug discovery also reflects a paradigm shift in pharmacogenomics research: from the conventional pursuit of a ‘magic bullet’ that targets a single ‘disease-causing’ gene, to the emerging polypharmacology approaches that examine disease–drug–gene interactions at the system and network level.
Despite a promising first step, systematic delineation of disease-specific drug–gene interactions has continued to challenge the current statistical framework, leaving significant computational potential on the table. Conventional drug-repurposing methods follow a two-step model to identify drugs that reverse disease phenotypes. First, a list of signature genes is compiled based on the disease dataset. One widely adopted approach is to use statistical tests (e.g. differential gene expression analysis) to prioritize the genes by their ability to differentiate phenotypic changes in the disease data. Then the top and bottom ranked genes are selected for CMap query. Once a signature has been created, the second step is to perform enrichment analysis comparing this signature to the drug-perturbed expression profiles from the reference dataset for drug prioritization.
As far as the performance of drug repurposing is concerned, the two-step paradigm is limited in the following ways. In practice, it is very difficult to determine the optimal query signature. Surprisingly, choices of the signature criteria and size vary drastically from one study to another in real applications, as shown in Supplementary Table S1 (Musa et al., 2017). For example, in a central nervous system (CNS) injury study, 21 genes were selected as a signature based on a P-value threshold of 0.05 and absolute fold change ≥1.5, compared with a glioblastoma (GBM) study where 1000 genes were used for drug analysis based on a P-value threshold of 0.0001 and absolute fold change ≥4. Although adaptations have been reported to tackle this issue by intensively iterating through hundreds or even thousands of possible signature size configurations to select the best parameter based on certain objective functions, their efficacy in a real-word application has yet to be adequately demonstrated. Aside from the excessive computational overhead, the utility of these remedies is limited either due to the requirement of external information (e.g. known FDA-approved drugs) or the proposed procedure is merely an ad hoc solution with no guarantee that the target criteria can even be achieved (Shigemizu et al., 2012; Wen et al., 2016). Another limitation of the two-step model is that, because the signatures include a limited number of genes determined solely from the disease dataset, the genes that are differentially expressed in the drug-perturbed expression data with informative importance may be overlooked. Therefore, enrichment analysis based on a non-optimized signature with arbitrary size not only creates a big hurdle for accurate modeling of disease–drug association, but also compromises genome-wide, systematic investigation of drug–target interactions.
To overcome the above-mentioned limitations in developing a much improved and system-wide examination of the associations between diseases, drugs and genes, we developed a novel computational framework called Dr Insight (Drug Repurposing: Integration and Systematic Investigation of Genomic High-Throughput data). Unlike the conventional two-step model, Dr Insight employs order statistics to directly measure the concordance (e.g. inverse association) between the disease data and drug-perturbed data for each individual gene. Concordantly expressed genes (CEGs) are elicited as features to further formulate an outlier sum statistic for drug analysis. Dr Insight has several unique advantages compared to the existing methods: (i) Dr Insight completely eliminates the need for users to provide a fixed-sized gene signature derived from the disease dataset, which allows automated, signature-free drug query. (ii) For the first time, the order statistics offer a robust statistical evaluation of the concordance of gene expression change in both disease and drug profiles. Compared with the conventional model of using only differentially expressed genes (DEGs) as signatures to calculate the drug connectivity, statistically significant CEGs construct an improved set of features that represent potential drug targets with inverted expression in the disease dataset. (iii) Whereas drug-target detection in the conventional framework is typically limited to around a dozen to a few hundred genes, Dr Insight has expanded the search of potential drug targets to the entire transcriptome. Dr Insight empowers genome-wide drug-target analysis with an in-depth examination of drug modes of action (MoA) at the pathway and network level. A feature comparison of Dr Insight with several popular signature-based drug-repurposing methods, including CMap (Lamb et al., 2006), sscMap (Zhang and Gant, 2009), NFFinder (Setoain et al., 2015) and Cogena (Jia et al., 2016), is listed in Supplementary Table S2.
To demonstrate the advantage of this new drug-repurposing framework, we applied Dr Insight to both simulated datasets as well as three cancer datasets and two non-cancer datasets (Supplementary Material S1.1 and Supplementary Table S3) and compared it against the four signature-based methods. We showed that Dr Insight, without the need to tune the signature size, performed better than previous signature-based methods at detecting known drugs (FDA-approved or in advanced clinical trials, see Supplementary Material S1.2 and Supplementary Table S4 for details) in both simulation and real data. Using data collected from drug target databases such as the Search Tool for Interactions of Chemicals (STITCH) (Kuhn et al., 2008) and the Comparative Toxicogenomics Database (CTD) (Davis et al., 2009) (Supplementary Material S1.3), we further illustrated the exceptional performance of Dr Insight for drug target prediction by validating that the CEGs detected were statistically more enriched in known drug–target interactions compared with DEGs. Finally, we used the TCGA breast cancer dataset as a case study to demonstrate that Dr Insight was not only a powerful tool for novel re-direction of breast cancer drugs, but also provided unbiased, systematic prediction of potential drug target pathways to facilitate mechanistic understanding of disease–drug interactions.
2 Materials and methods
Dr Insight completely shifts the computational framework from the conventional signature-based enrichment analysis to a genome-wide, disease-drug concordance alignment. Figure 1 gives the principal workflow of Dr Insight. Instead of extracting a list of significantly up- and down-regulated signature genes based on differential gene expression analysis, Dr Insight uses order statistics to combine information from disease data and drug-perturbed expression data (Fig. 1A). Such a ‘handshake’ between the two parts of the data allows a systematic portrait of the drug connectivity at the finest resolution: for each individual gene, the order statistic gives a quantitative measure of its connectivity between the disease and drug profiles. As an important feature selection step, genes with statistically significant connectivity are elicited as CEGs, which comprehensively include genes that are concordantly expressed in both disease and drug-perturbed expression data without depending on a pre-defined DEG selection criteria (Fig. 1B). The CEGs are further pooled together to calculate an overall connectivity score for each individual drug based on an outlier-sum method (Gu et al., 2012; Tibshirani and Hastie, 2007) to test drug treatment effect (Fig. 1C). Finally, in combination with several external gene set databases such as Gene Ontology (GO) (Ashburner et al., 2000), Kyoto Encyclopedia of Genes and Genomes (KEGG) (Kanehisa and Goto, 2000) and NCI Pathway Interaction Database (PID) (Schaefer et al., 2009), the drug–CEG interactions serve as the skeleton to assemble disease-specific drug-target interaction networks (Fig. 1D and E).
Fig. 1.

Workflow of Dr Insight. (A) The gene rank list from the differential analysis (e.g. tumor versus normal) on the disease dataset is used as input. The reference database contains the gene rank lists (drug instances) from CMap. (B) Type 1 and type 2 CEGs are identified using order statistics. The bar plot shows the log P-values of type 1 (blue) and type 2 (red) CEGs. (C) An outlier-sum score (OS) is calculated for each drug instance and are used to perform K-S test, where the OS scores of the instances from one drug treatment set (red x’s) are compared against the rest of the drug instances. (D) Between-drug and within-drug tests are performed to identify disease-specific drug-pathway regulations. The node is colored by the average z-scores of CEGs within a pathway. (E) The output of Dr Insight: a drug-pathway connection network. The size of the pathways (orange circles) are proportional to their node degrees
2.1 Global investigation of concordant gene expression
The input for Dr Insight is a complete rank list of all genes based on differential gene expression analysis between case and control samples (e.g. tumor versus normal). In a disease study, we are typically interested in whether the drug under investigation shows potential treatment effect (i.e. negative connectivity) or adverse effect (positive connectivity) with respect to a given disease profile. When investigating treatment effect, a gene is deemed ‘concordantly expressed’ if it is inversely expressed between the disease data and the reference drug data. In other words, a CEG should be up-regulated in the disease data but down-regulated after drug perturbation, and vice versa. On the other hand, a CEG in the drug adverse effect model should display positive correlation as being either up- or down-regulated in both disease data and drug data.
For gene , we denote its scaled rank (the original rank scaled by the total number of genes ) in the disease data and the ith drug instance (i.e. instance from CMap, see Supplementary Abbreviations and Terminologies for definition) as and respectively, where , . In the case of a drug treatment effect study, the ranks are inversely ordered in disease and drug data (i.e. large-scaled rank represents up-regulation of gene expression in the disease phenotype, while large-scaled rank represents that gene is down-regulated in drug instance ). In this work, we only focus on finding drugs that can reverse the disease status back to normal (treatment effect), although this concept can be easily generalized to investigate adverse effect of drugs. For concordant gene expression, two patterns are defined when studying drug treatment effect:
Type 1 concordant expression: gene is up-regulated in the disease phenotype and down-regulated after drug perturbation;
Type 2 concordant expression: gene is down-regulated in the disease phenotype and up-regulated after drug perturbation.
2.2 Detection of concordantly expressed genes using order statistic
To model type 1 concordance of gene between disease data and drug instance , we calculate the minimum statistic (smallest order statistic) as follows:
| (1) |
is a non-parametric statistic measuring whether gene has large ranks in both the disease data (up-regulation) and reference drug data (down-regulation). A large value indicates that gene has strong type 1 concordance, in which case a right-tailed test is appropriate. Under the null hypotheses that and are independent rank values, the one-sided P-value for in a right-tailed test is given by:
| (2) |
where is the regularized incomplete Beta function (see the proof of Theorem 1 in Supplementary Material S2).
Similarly, we use the maximum statistic (largest order statistic):
| (3) |
to model type 2 concordance. A smaller gives stronger evidence that gene is down-regulated in the disease data and up-regulated upon drug perturbation, hence suggesting the use of a left-tailed test. According to Theorem 2 (Supplementary Material S2), the one-sided P-value for in a left-tailed test is given by:
| (4) |
Statistically significant genes (P-value ) derived from minimum and maximum statistics are referred to as type 1 or type 2 CEGs, respectively, which will be later utilized as key features for downstream drug repurposing analysis. We also comprehensively assessed Dr Insight’s performance with a series of P-value cut-offs on five disease datasets, including three cancer and two non-cancer datasets, and confirmed that the recommended 0.05 thresholds had robust performance across all applications (Supplementary Material S3, Supplementary Fig. S1).
2.3 Modeling disease–drug connectivity: CEG-based outlier-sum statistic
In Dr Insight, the detection of CEGs is considered as an important feature selection step. Statistically significant CEGs have reversed differential gene expression between the disease and reference drug data. An effective drug treatment is one that reverts the aberrant gene expression back to normal levels. Therefore, for each drug instance , we formulate an outlier-sum based statistic to model the overall disease-drug connectivity as:
| (5) |
where and are z-scores transformed from the P-values for the minimum and maximum statistics. denotes the z-score that corresponds to the significance level of , where . is the indicator function, which returns 1 when the input condition is true; and 0 otherwise. The instance-level outlier sum is an aggregation of the number of CEGs weighted by their individual concordant expression score, which can be regarded as a surrogate for overall disease–drug connectivity. In other words, Dr Insight utilizes the CEG-based outlier-sum statistic to prioritize potential new drug treatments for a given disease. To be more specific, for a drug treatment set , such as a group of instances that are collected from a particular cell line under the same drug perturbation (see Supplementary Material S4.2), we first calculate the outlier-sum for every individual drug instance in , and then compare them with the reference distribution of outlier-sum statistics derived from the entire drug database. We use a two-sample Kolmogorov–Smirnov (K-S) test to determine whether the from the instances in drug treatment set are larger than those from the rest of the instances in the CMap database. Drug treatment sets with significant K-S test P-values will be detected as novel repurposing drug candidates.
2.4 Modeling disease-specific drug–gene connectivity: from CEGs to drug-target pathways
Computational elicited CEGs are not only a good proxy for disease–drug connection, but they also provide de novo prediction of potential disease-specific drug targets. As opposed to the conventional methods that only include DEGs from the disease data as candidate drug targets, the elicited CEGs constitutes an optimized gene set to study drug–gene connectivity by aggregating disease transcriptome changes with drug perturbation. To further associate biological functionalities with the detected CEGs so as to attain a system-level delineation of the disease-specific drug–target interactions, we provide an interface to perform enrichment analysis of the detected CEGs on functional gene sets, such as pathways and GO terms from public databases.
Take pathway analysis as an example. The inputs of the pathway analysis module include selected CEGs and their corresponding z-scores for each drug instance. Dr Insight only performs pathway analysis on significant drugs that are identified at step C of the workflow (Fig. 1C). In the case study presented in Section 3.5, we used 222 pathways from the National Cancer Institute PID (Schaefer et al., 2009) downloaded from Pathway Commons (Cerami et al., 2011), while the software also provides an interface so that users can upload their own list of pathways or gene sets. For pathway , the instance-level (for the ith drug instance ) and drug treatment set-level (for drug treatment set ) outlier-sum statistic are given by:
| (6) |
and
| (7) |
respectively, where the CEG z-scores for drug treatment set , and , are calculated by:
| (8) |
and
| (9) |
Two statistical tests are used to determine drug-targetable, dysregulated pathways. First, we use the two-sample Kolmogorov–Smirnov test (K-S test) to perform a ‘between-drug’ significance test by comparing the pathway-level outlier-sum of drug treatment set with the rest of the drugs in the database. The P-value of the test indicates whether genes in pathway have a stronger pattern of concordant expression in drug treatment set compared with other drugs. Second, for each drug treatment set , we performed a ‘within-drug’ significance test to compare of pathway to of a random pathway of the same size. Fisher’s exact test is employed to calculate the P-value for within-drug significance. Finally, we use the maximum of the between- and within-drug P-values to select statistically significant pathways for each proposed drug treatment set as a system-level representation of potential drug MoA.
3 Results
3.1 Signature-based connectivity mapping shows poor agreement in drug detection using different signature sizes
The determination of query signature has been a long-standing problem for drug connectivity mapping(Musa et al., 2017; Shigemizu et al., 2012). However, no existing literature has systematically studied the impact of signature selection on drug-repurposing results. Therefore, we applied a range of signature sizes to several existing drug-repurposing methods, including CMap, sscMap and NFFinder, to study the consistency of the identified drugs with potential treatment effect. In Figure 2, the Venn diagrams show the overlap of the identified drugs from five different signature selections (sizes from 50 to 1000 gene probes, see Supplementary Material S4.1 for details) for each of the three connectivity-mapping methods on TCGA breast cancer dataset. Surprisingly for the CMap method, only five drugs were identified by all signature sizes, accounting for less than 4% (5/151) of the total identified drugs (Fig. 2A). On the other hand, as many as 35 drugs detected by size 50 were not reported by any other signature size. Overall, only 58 out of 151 (less than 40%) drugs were commonly identified under three or more size settings using CMap, indicating a lack of consistency among the identified drugs with different signature sizes. For sscMap, Figure 2B shows that the signature size had a dramatic effect in controlling the number of significant drug treatments. When the signature size was small (50 and 100), sscMap only identified around a dozen significant drugs, compared with the number that was dramatically bumped up to over 1000 when the signature size increased to 600 gene probes. NFFinder showed similar results to CMap with only 6% (62 out of 1069) of the drugs that were commonly identified by all signature sizes (Fig. 2C). The above study demonstrated an important limitation of the existing signature-based drug-repurposing methods that the results from different signature sizes show very poor agreement with one another.
Fig. 2.
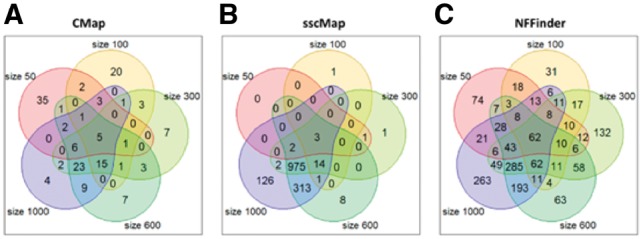
Overlap of detected drugs (P-value ≤ 0.05) using different signature sizes on the TCGA breast cancer dataset. Five signature sizes at probe level are selected: 50, 100, 300, 600 and 1000. (A) CMap. (B) sscMap. (C) NFFinder
To further validate our findings, we applied the three methods to two additional prostate cancer datasets (Supplementary Fig. S2A). In general, the results were very consistent with those from the breast cancer dataset, where the overlap of five signature sizes remained very small: from no overlap (sscMap on GEO dataset) to 13% (CMap on TCGA dataset). In the best case scenario, the percentage of drugs that were commonly detected in at least three signature settings did not exceed 41% (CMap on TCGA dataset), further confirming the enormous gap between detected drugs from these signature-based methods using different query signatures.
Moreover, we also compared the performance of different signature-based methods when the same input size was used. Also using TCGA breast cancer dataset as an example, we compared CMap, sscMap, NNFinder and Cogena at a series of given signature sizes from 50 to 1000 probes. We see that, with the same size input, the four different methods resulted in very inconsistent results (Supplementary Fig. S2B). There were only a small percentage of common drugs identified by all four methods for signature sizes from 200 to 1000. No common drugs were identified with small signature sizes (size 50 and 100). On the other hand, a large percentage of drugs proposed by each method were unique to itself. These evidences further strengthen our previous argument that not only do different signature sizes result in inconsistent drug repurposing candidates, but also different methods have very poor agreement with one another when the same gene signatures are used.
3.2 Performance comparison using realistic simulation
We performed simulation studies to evaluate the performance of Dr Insight compared with several representative signature-based, two-step drug-repurposing methods, including CMap, sscMap, NFFinder and Cogena. We first computationally elicited a group of drugs from the CMap database as a synthetic positive drug set (i.e. ground-truth drugs) based on cluster analysis. A Monte Carlo strategy was then employed to simulate input disease data using correlation structures trained from known FDA-approved drugs and a real disease dataset. The above procedure generates ‘realistic’ simulation data by preserving known disease–drug association patterns. Details about simulation design can be found in Supplementary Material S5 and Supplementary Figure S3.
We used datasets from the TCGA (breast cancer and prostate cancer) to generate two simulation studies. For Dr Insight, the entire synthetic disease rank list was used as input. DEG-derived signatures of varying sizes were used for querying CMap, sscMap and NFFinder. For Cogena, we selected query signatures using the criteria of FDR ≤ 0.05 and log-fold-change ≥ 1, which is recommended by the original Cogena paper. The overall performance was evaluated by the receiver operating characteristic (ROC) curve (Supplementary Material S6 and Supplementary Fig. S4) and the areas under the ROC curves (AUCs) were calculated for each method (Table 1).
Table 1.
AUC values of five drug-repurposing methods
| Methods | AUC value for BRCA-derived simulation data avg (min/max) | AUC value for PRAD-derived simulation data avg (min/max) |
|---|---|---|
| CMap | 0.75 (0.58/0.84) | 0.73 (0.66/0.79) |
| sscMap | 0.75 (0.51/0.87) | 0.77 (0.62/0.86) |
| NFFinder | 0.54 (0.52/0.57) | 0.52 (0.50/0.54) |
| Cogenaa | 0.60 | 0.56 |
| Dr Insight | 0.91 b | 0.88 |
Cogena has only one AUC value (per simulation data), which is derived from the gene signature selected with the recommended criteria by Cogena paper. bBold values denote the best AUC values across all five methods.
CMap, with eight different query signatures, produced an average AUC of 0.75 that ranged from 0.58 to 0.84 from the eight ROC curves on TCGA breast cancer-derived simulation dataset. It also achieved an average AUC of 0.73 (min: 0.66, max: 0.79) in the prostate cancer derived dataset. Similar results were observed for sscMap, which produced average AUCs of 0.75 (breast cancer) and 0.77 (prostate cancer), with gaps as much as 0.36 (breast cancer, min: 0.51, max: 0.87) or 0.24 (prostate cancer, min: 0.62, max: 0.86) between the best and the worst performance. Consistent with what we observed in the previous section, the prediction performance of CMap and sscMap differed significantly with varying query signature sizes. The drug predictabilities of NFFinder and Cogena on both simulation datasets were worse with AUC values no greater than 0.6. Dr Insight, on the other hand, yielded much higher AUC values (0.91 and 0.88 on two simulated datasets, respectively) without requiring a pre-determined query signature, which were at least comparable or even greater than the best performance of all signature-based methods with any signature size. The simulation studies validated that the new signature-free, CEG-based drug-repurposing framework had appealing performance over the conventional signature-based, two-step models to detect disease–drug associations simulated from known FDA-approved cancer drugs.
Additionally, we also evaluated the false positive rate of Dr Insight under the null hypothesis. To be more specific, we generated random disease data through permutations and ran Dr Insight on these ‘null’ datasets. We repeated this procedure for 50 times and summarized the number of significant drugs (i.e. false positives) accordingly (P <= 0.05). In general, Dr Insight had an average false positive rate around 1.15%, indicating good specificity of the algorithm when there is no association between the disease and drug data.
3.3 Benchmarking drug prediction performance on cancer datasets
In addition to the synthetic datasets, we further evaluated the efficacy of Dr Insight to prioritize cancer treatment on public cancer datasets. Three datasets were included in this study: two TCGA datasets [breast cancer (Cancer Genome Atlas Network, 2012) and prostate cancer (Cancer Genome Atlas Research Network, 2015)] that were previously used to perform realistic simulation, plus one additional prostate cancer dataset that was downloaded from the GEO database (Varambally et al., 2005). FDA-approved drugs and clinical-trial drugs for breast and prostate cancers were collected as ground-truth drug sets (Supplementary Material S1.2) to benchmark the performance of the different methods. Similar to the simulation study, we compared Dr Insight with four other signature-based methods (CMap, sscMap, NFFinder and Cogena). The gene signatures sized from 50 to 1000 probes were used for the first three methods and the Cogena gene signature was selected with the criteria of FDR ≤ 0.05 and log-fold-change ≥ 1. For each of the methods, we ranked all of the drugs by their detection of P-values and those with statistical significance stronger than 0.05 were identified as potential treatments.
We performed enrichment analysis (Fisher’s exact test, see Supplementary Material S6) to evaluate whether the drug candidates that were identified by each method had statistically significant overlap with the ground-truth breast cancer or prostate cancer drugs. The number of proposed candidate drugs by each method are listed in Supplementary Tables S5.1–S5.11. Figure 3 gives the bar plots of log P-values from the enrichment tests of all five methods, three of which had varying signature sizes. For CMap, sscMap and NFFinder, an overall conclusion is that their performances to identify known cancer drugs varied dramatically from one dataset to another. More importantly, large deviations were observed when different signature sizes were applied. For instance, CMap achieved its best performance with an enrichment P-value of 0.07 for the TCGA breast cancer data when the signature size was 100, while for the GEO prostate cancer data, the top2 CMap performances were produced by signature sizes of 200 and 800. sscMap and NFFinder had similar behaviors, which strongly supported our earlier conclusion that the conventional signature-based methods had poor agreement among different signature selections. As for Cogena, though reasonable empirical criteria for signature selection was applied, its performance in drug detection was still limited. Cogena had its best performance on the TCGA breast cancer dataset with an enrichment P-value of 0.007, yet it failed to retrieve statistically significant results on the other two datasets. In contrast, Dr Insight obtained the best performance at identifying known cancer treatments on all three datasets, without the requirement to pre-select the query signature. Notably on the TCGA and GEO prostate cancer datasets, Dr Insight returned significant enrichment P-values of 1.2e-4 and 1.3e-5, respectively. These P-values were significantly better than the next best performances of a P-value of 0.007 given by Cogena on the TCGA breast cancer, and a P-value of 4.0e-4 given by NFFinder (size 100) on the GEO prostate cancer dataset. Comparable results were observed on two non-cancer datasets: systemic lupus erythematosus data (Banchereau et al., 2016) and Hepatitis B virus infection data (Yoneda et al., 2016) (Supplementary Fig. S5). In conclusion, applications on cancer datasets verified the robust and exceptional performance of the new CEG-based, signature-free drug-repurposing model, which achieved the best performance validated by known cancer drugs.
Fig. 3.
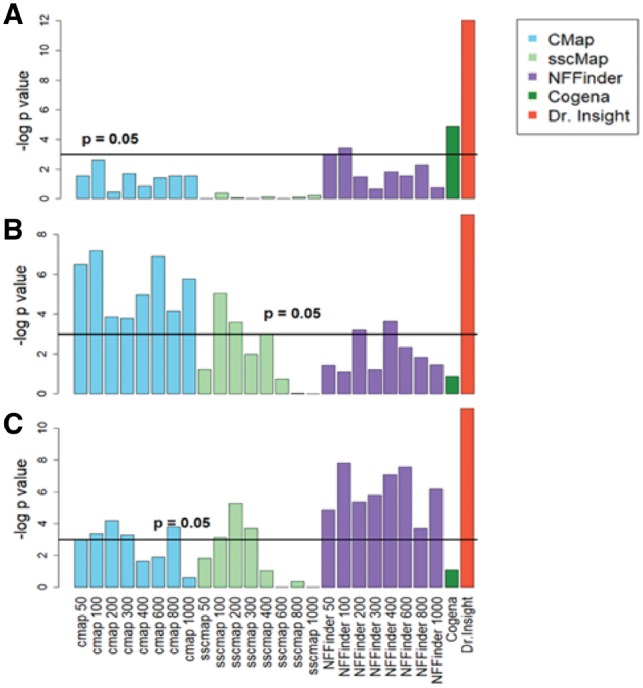
Comparing Dr Insight with existing methods on cancer datasets. The bar plots give the log-transformed enrichment P-values from the five methods. Multiple enrichment P-values are reported for CMap, sscMap and NFFinder, which correspond to query signatures of different sizes. The horizontal lines indicate the 0.05 statistical significance level. (A) TCGA breast cancer dataset. (B) TCGA prostate cancer dataset. (C) GEO prostate cancer dataset
3.4 CEGs significantly improve drug target prediction
In addition to its superior performance in drug identification, another major contribution from Dr Insight is that it optimizes the modeling of drug–gene connectivity (i.e. drug target prediction), using a CEG-based feature selection approach. Under the conventional drug-repurposing framework, people largely rely on DEGs that are identified from the disease data alone to investigate drug–gene connectivity, and thereafter for pathway analysis (Shigemizu et al., 2012). In contrast, Dr Insight uses order statistics to systematically retrieve CEGs with concordant gene expression change between disease data and drug treatment data, which, in theory, offers an optimized set of candidates as potential disease-specific drug targets.
To test whether the CEG-based methodology substantially improves the outcome for drug target prioritization, we first collected known drug–target interactions from the STITCH database as ground truth to benchmark the performance of CEG- and DEG-based methods on the three public cancer datasets. Figure 4A gives the bar plots of the percentages of the drugs whose CEGs were over-represented by known drug–target interactions from the STITCH database. Details of the percentage calculations can be found in Supplementary Material S7 and Supplementary Tables S6 and S7. For the DEG-based method, a range of DEG sizes, from 50 to 1000 probes, were tested. For drugs detected by Dr Insight using the CEG-based method from the TCGA breast cancer dataset, 15 out of 34 drugs (44%) had significant enrichment on targets collected from the STITCH database, compared with a maximum performance of 19% of enriched drugs achieved by the DEG-based method. The performance of the DEG-based method, however, also varied significantly from one signature size to another, yielding as much as 5-fold of discrepancy between signature sizes from 50 to 200 probes and 1000 probes in the case of TCGA breast cancer study. Similarly, in the other two datasets, the CEG-based method consistently outperformed the DEG-based method, with 29% and 42% of drugs that were statistically enriched in the TCGA and GEO prostate cancer datasets, respectively, compared with the best performances of 11% and 19% of over-represented ground-truth targets from the DEG-based method. In summary, for all the three cancer studies, the CEG-based method achieved at least twice the efficacy of existing methods at retrieving drugs that are enriched in known drug–target interactions reported by the STITCH database.
Fig. 4.
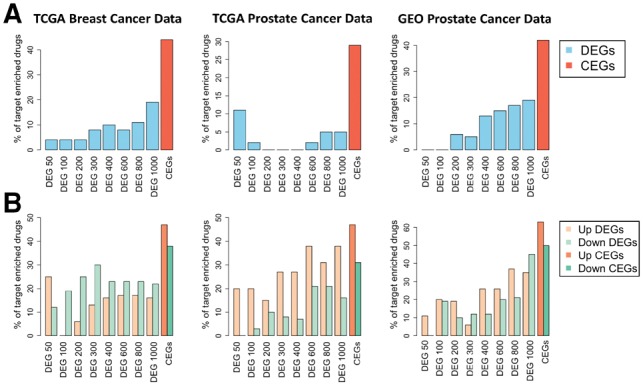
Percentages of the identified drugs with statistically significant enrichment in known drug targets from drug-target databases. (A) Results from STITCH database. (B) Results from the CTD database
In a second validation study, we used drug–target interactions from the CTD database to test the enrichment of the CEG and DEG-based methods. Since the drug–target interactions from the CTD database are directed, we also separated the CEGs and DEGs into up- and down-regulated subsets. Figure 4B gives the percentages of drugs with statistically significant overlap with known targets in the CTD database. From Figure 4B, we see that the CEG-based method achieved universally better performance for both up- and down-regulated target genes in all the three cancer datasets. For instance, for the TCGA breast cancer dataset, 47% and 38% of the drugs from the CEG-based method had significant enrichment in up- and down-regulated genes validated by the CTD database, compared with much smaller percentages of the significant drugs being identified by the best DEG-based method (13% and 30%, achieved by size of 300). The results of the DEG-based method shown in Figure 4 were calculated with CMap-detected drugs, while the results based on sscMap and NFFinder-detected drugs are shown in Supplementary Figures S6 and S7, respectively. The above validation studies strongly supported that, by incorporating differential gene expression from both disease data and drug-perturbed data simultaneously, Dr Insight successfully improved drug–target prediction using CEGs as surrogates for disease-specific drug–gene connectivity.
3.5 Case study: disease-specific drug–pathway–gene connections inferred from the TCGA breast cancer dataset
Finally, we used the TCGA breast cancer dataset as an example to take a close look at applying Dr Insight to re-engineer novel disease specific drug–pathway–gene connections (Supplementary Material S10). Figure 5A gives the drug–pathway interaction network among 10 significant drugs (fulvestrant is not included in the network because there is no significant pathway identified for it) and 31 pathways from the NCI PID pathways (Schaefer et al., 2009) reconstructed by Dr Insight. The color of the edges between drugs and pathways represents the type of interaction, i.e. down-regulation (green) and up-regulation (red).
Fig. 5.
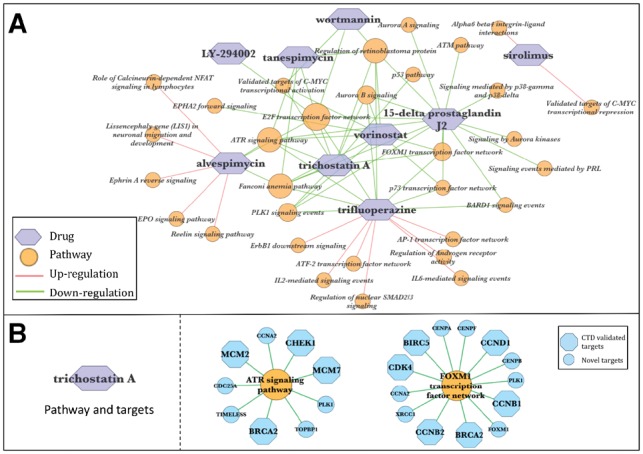
Reconstructed breast cancer drug–pathway–gene connections for TCGA breast cancer data. (A) Reconstructed drug–pathway interaction network. (B) Representative target pathways of TSA and the potential target genes. Blue hexagons are the pathway genes that are identified as TSA CEGs and being documented as TSA targets in the CTD database; blue circles are the novel unregistered TSA CEGs. The networks are visualized using Cytoscape (Shannon et al., 2003)
Five out of the ten identified drugs are in our ground-truth breast cancer drug list. Among them, fulvestrant is an FDA-approved drug for treating hormone receptor-positive breast cancer. Also identified were the HSP90-inhibiting drugs tanespimycin and alvespimycin, the HDAC-inhibiting drug vorinostat and the anti-proliferation drug sirolimus, all of which are in advanced stages of clinical trials for treating breast cancer (Chen et al., 2016). Additionally, five novel drug treatments for breast cancer were identified, which were also supported by a number of earlier studies. For instance, 15-delta prostaglandin J2, a member of cyclopentenone prostaglandins, was previously reported to induce apoptosis and cell death of breast cancer cells (Kim et al., 2009; Pignatelli et al., 2004). More interestingly, the HDAC inhibitor trichostatin A (TSA) was found to have antitumor activity against breast cancer not only in cell lines but also in animal models (Liu and Li, 2015; Vigushin et al., 2001).
Previously, pathway analysis in the context of connectivity-mapping-based drug repurposing typically relies on enrichment test (e.g. Fisher’s exact test) of input DEGs (Lee et al., 2012; Shigemizu et al., 2012). One key advantage of Dr Insight’s pathway analysis is that, derived from the CEGs, the identified pathways are more enriched in ‘drug actionable targets’ compared with the DEG-based method. Here, ‘drug actionable targets’ refers to target genes within a pathway with reversed expression, i.e. ranked top/bottom 10% before and after drug perturbation. We systematically compared the percentages of drug actionable targets from Dr Insight (CEG) and the conventional DEG-based method (Supplementary Material S8). Supplementary Table S8 shows that pathway results from Dr Insight were highly enriched in actionable targets (>40%), which was several-fold higher than the average enrichment by the DEG-based method.
Through subsequent pathway analysis, we found that several pathways, such as ATR signaling pathway, PLK1 signaling events and FOXM1 transcription factor network, were down-regulated by multiple drugs (Fig. 5A) in our data, suggesting that these pathways are particularly important for breast cancer tumorigenesis. Consistent with our discovery, abnormal regulation of the above-mentioned cell cycle signaling-related pathways have been reported to cause aberrant breast cell proliferation and apoptosis. Such aberration may lead to tumorigenesis owing to the dysregulation of their critical component genes, including the DNA damage response kinase genes ATR and ATM (Smith et al., 2010), and the cell cycle regulating protein modulators such as FOXM1(Hunt et al., 1997). Of note, the connections between these potential breast cancer drugs and target pathways have been previously addressed in a number of studies. The HDAC inhibitor TSA is an example. TSA down-regulates cyclin genes like CCNB1 and CCND1, and cyclin-dependent kinases such as CDK4, to arrest cell cycle at G1 or G2/M phase in breast cancer MCF10A-ras cells (Park et al., 2008). These cell cycle-related genes are critical functional components of FOXM1 and PLK1 pathways (Fig. 5B, Supplementary Fig. S8), which are demonstrated to be down-regulated by TSA in our TCGA breast cancer study. In addition, Liu et al. reported that TSA promoted cell apoptosis by down-regulating MCM family genes in colon cancer cells (Liu et al., 2013). While MCM genes and their highly associated pathways, including ATR signaling pathway (Fig. 5B) and E2F transcription network (Supplementary Fig. S8), are identified by Dr Insight as potential TSA targets to treat breast cancer, our results, together with the discovery by Liu et al. suggest a possible mechanism through which TSA promotes breast cancer cell apoptosis. In addition to the above-mentioned dysregulated CEGs that are documented as known targets in drug–target interaction databases, Dr Insight also detected dozens of novel drug–target interactions (Fig. 5B), many of which were supported by previous literature. An example of novel drug targets is PLK1, a kinase for efficient G2/S arrest that is known to be directly inhibited by TSA administration in colon cancer cells (McKenzie et al., 2010). The above set of evidence demonstrates the ability of Dr Insight to produce a systematic layout of breast cancer drug interaction network by bridging novel and known target genes with key molecular pathways such as cell cycle arrest and apoptosis.
4 Discussion
In conclusion, to overcome the limitations of the existing computational framework, we have developed Dr Insight, which for the first time ever, offers signature-free, enhanced drug repurposing based on gene expression data. The genome-wide concordance evaluation by Dr Insight takes into account the dysregulation of gene expression from both disease and drug-perturbed data simultaneously, which renders the statistically significant CEGs as better features to investigate the connections among diseases, drugs and genes. Dr Insight has broken the computational bottleneck for transcriptome-based drug discovery, which provides an unbiased first look from novel redirections of existing drugs toward a systematic understanding of disease-specific drug MoAs at molecular level.
We have demonstrated using TCGA breast cancer dataset that, in addition to five FDA-approved drugs or drugs in advanced clinical trials for breast cancer treatment, Dr Insight also identified a few new drug candidates, which were previously reported to have antitumor functions. The identified pathways further pave the road for in-depth investigation of these recommended small molecules. The users may cross-reference their de novo identified disease-specific drug pathways with existing disease-pathway databases to further understand the efficacy and the side effects of the proposed drugs. One such example is given by Chen et al. to study the associations between pathways and adverse drug reactions (Chen et al., 2015a). A candidate drug can be flagged when it activates pathways that lead to adverse effects.
Another important aspect in performance evaluation is to assess the robustness of the methods against noise in the data. Therefore, we further performed the sensitivity analysis of Dr Insight, together with other representative methods on simulation data with controlled noise. Based on the numerical results, we conclude that Dr Insight can tolerate as much as 60% to even 90% of added noise, depending on datasets (Supplementary Material S9, Supplementary Fig. S10).
In addition to the signature-based methods that are compared in the main text, another simple, yet ‘global’ method that comes naturally to mind for connectivity mapping is the inverse correlation method. To comprehensively validate the advantage of Dr Insight in drug repurposing, we also compared Dr Insight with the inverse correlation method on all five disease datasets. The results showed that Dr Insight consistently outperformed the inverse correlation method in all studies, although interestingly, the performance of the inverse correlation method remained quite robust to noise (Supplementary Material S9, Supplementary Figs S9 and S10).
Supplementary Material
Acknowledgements
We thank Dr Carson Harrod and Jacob Cardenas from Baylor Scott & White Research Institute for their helpful comments and suggestions on our work.
Funding
This work has been supported by the National Institute of Allergy and Infectious Diseases under grant U19AI082715.
Conflict of Interest: none declared.
References
- Ashburner M. et al. (2000) Gene ontology: tool for the unification of biology. The Gene Ontology Consortium. Nat. Genet., 25, 25–29. [DOI] [PMC free article] [PubMed] [Google Scholar]
- Banchereau R. et al. (2016) Personalized immunomonitoring uncovers molecular networks that stratify lupus patients. Cell, 165, 551–565. [DOI] [PMC free article] [PubMed] [Google Scholar]
- Cancer Genome Atlas Network. (2012) Comprehensive molecular portraits of human breast tumours. Nature, 490, 61–70. [DOI] [PMC free article] [PubMed] [Google Scholar]
- Cancer Genome Atlas Research Network. (2015) The molecular taxonomy of primary prostate cancer. Cell, 163, 1011–1025. [DOI] [PMC free article] [PubMed] [Google Scholar]
- Cerami E.G. et al. (2011) Pathway Commons, a web resource for biological pathway data. Nucleic Acids Res., 39, D685–D690. [DOI] [PMC free article] [PubMed] [Google Scholar]
- Chen H.R. et al. (2016) A network based approach to drug repositioning identifies plausible candidates for breast cancer and prostate cancer. BMC Med. Genomics, 9, 51. [DOI] [PMC free article] [PubMed] [Google Scholar]
- Chen X. et al. (2015a) Systematic analysis of the associations between adverse drug reactions and pathways. Biomed. Res. Int., 2015, 670949. [DOI] [PMC free article] [PubMed] [Google Scholar]
- Chen X. et al. (2015b) Terazosin activates Pgk1 and Hsp90 to promote stress resistance. Nat. Chem. Biol., 11, 19–25. [DOI] [PMC free article] [PubMed] [Google Scholar]
- Davis A.P. et al. (2009) Comparative Toxicogenomics Database: a knowledgebase and discovery tool for chemical-gene-disease networks. Nucleic Acids Res., 37, D786–D792. [DOI] [PMC free article] [PubMed] [Google Scholar]
- El-Hachem N. et al. (2017) Integrative cancer pharmacogenomics to infer large-scale drug taxonomy. Cancer Res., 77, 3057–3069. [DOI] [PubMed] [Google Scholar]
- Gu J. et al. (2012) Robust identification of transcriptional regulatory networks using a Gibbs sampler on outlier sum statistic. Bioinformatics, 28, 1990–1997. [DOI] [PMC free article] [PubMed] [Google Scholar]
- Hameed P.N. et al. (2018) A two-tiered unsupervised clustering approach for drug repositioning through heterogeneous data integration. BMC Bioinformatics, 19, 129. [DOI] [PMC free article] [PubMed] [Google Scholar]
- Hicks D.F. et al. (2017) Transcriptome-based repurposing of apigenin as a potential anti-fibrotic agent targeting hepatic stellate cells. Sci. Rep., 7, 42563. [DOI] [PMC free article] [PubMed] [Google Scholar]
- Hsieh Y.Y. et al. (2016) Repositioning of a cyclin-dependent kinase inhibitor GW8510 as a ribonucleotide reductase M2 inhibitor to treat human colorectal cancer. Cell Death Discov., 2, 16027. [DOI] [PMC free article] [PubMed] [Google Scholar]
- Hunt K.K. et al. (1997) Adenovirus-mediated overexpression of the transcription factor E2F-1 induces apoptosis in human breast and ovarian carcinoma cell lines and does not require p53. Cancer Res., 57, 4722–4726. [PubMed] [Google Scholar]
- Iorio F. et al. (2010) Discovery of drug mode of action and drug repositioning from transcriptional responses. Proc. Natl. Acad. Sci. USA, 107, 14621–14626. [DOI] [PMC free article] [PubMed] [Google Scholar]
- Iorio F. et al. (2013) Transcriptional data: a new gateway to drug repositioning? Drug Discov. Today, 18, 350–357. [DOI] [PMC free article] [PubMed] [Google Scholar]
- Jia Z. et al. (2016) Cogena, a novel tool for co-expressed gene-set enrichment analysis, applied to drug repositioning and drug mode of action discovery. BMC Genomics, 17, 414. [DOI] [PMC free article] [PubMed] [Google Scholar]
- Kanehisa M., Goto S. (2000) KEGG: kyoto encyclopedia of genes and genomes. Nucleic Acids Res., 28, 27–30. [DOI] [PMC free article] [PubMed] [Google Scholar]
- Kim D.H. et al. (2009) Effects of 15-deoxy-delta 12, 14-prostaglandin J2 on the expression of p53 in MCF-7 cells. Ann. N.Y. Acad. Sci., 1171, 202–209. [DOI] [PubMed] [Google Scholar]
- Kuhn M. et al. (2008) STITCH: interaction networks of chemicals and proteins. Nucleic Acids Res., 36, D684–D688. [DOI] [PMC free article] [PubMed] [Google Scholar]
- Lamb J. et al. (2006) The Connectivity Map: using gene-expression signatures to connect small molecules, genes, and disease. Science, 313, 1929–1935. [DOI] [PubMed] [Google Scholar]
- Lee H. et al. (2016a) Drug repositioning for cancer therapy based on large-scale drug-induced transcriptional signatures. PLoS One, 11, e0150460.. [DOI] [PMC free article] [PubMed] [Google Scholar]
- Lee J. et al. (2016b) Withaferin A is a leptin sensitizer with strong antidiabetic properties in mice. Nat. Med., 22, 1023–1032. [DOI] [PMC free article] [PubMed] [Google Scholar]
- Lee J.H. et al. (2012) CDA: combinatorial drug discovery using transcriptional response modules. PLoS One, 7, e42573. [DOI] [PMC free article] [PubMed] [Google Scholar]
- Liu J., Li Y. (2015) Trichostatin A and Tamoxifen inhibit breast cancer cell growth by miR-204 and ERalpha reducing AKT/mTOR pathway. Biochem. Biophys. Res. Commun., 467, 242–247. [DOI] [PubMed] [Google Scholar]
- Liu J. et al. (2015a) Treatment of obesity with celastrol. Cell, 161, 999–1011. [DOI] [PMC free article] [PubMed] [Google Scholar]
- Liu X. et al. (2015b) Expression profiling identifies bezafibrate as potential therapeutic drug for lung adenocarcinoma. J. Cancer, 6, 1214–1221. [DOI] [PMC free article] [PubMed] [Google Scholar]
- Liu Y. et al. (2013) MCM-2 is a therapeutic target of trichostatin A in colon cancer cells. Toxicol. Lett., 221, 23–30. [DOI] [PubMed] [Google Scholar]
- McKenzie L. et al. (2010) p53-dependent repression of polo-like kinase-1 (PLK1). Cell Cycle, 9, 4200–4212. [DOI] [PMC free article] [PubMed] [Google Scholar]
- Musa A. et al. (2017) A review of connectivity map and computational approaches in pharmacogenomics. Brief Bioinform., 18, 903. [DOI] [PMC free article] [PubMed] [Google Scholar]
- Park H. et al. (2008) Effects of trichostatin A, a histone deacetylase inhibitor, on the regulation of apoptosis in H-ras-transformed breast epithelial cells. Int. J. Mol. Med., 22, 605–611. [PubMed] [Google Scholar]
- Peyvandipour A. et al. (2018) A novel computational approach for drug repurposing using systems biology. Bioinformatics, 34, 2817–2825. [DOI] [PMC free article] [PubMed] [Google Scholar]
- Pignatelli M. et al. (2004) 15-deoxy-Delta-12,14-prostaglandin J2 induces programmed cell death of breast cancer cells by a pleiotropic mechanism. Carcinogenesis, 26, 81–92. [DOI] [PubMed] [Google Scholar]
- Sandor C. et al. (2017) Transcriptomic profiling of purified patient-derived dopamine neurons identifies convergent perturbations and therapeutics for Parkinson’s disease. Hum. Mol. Genet., 26, 552–566. [DOI] [PMC free article] [PubMed] [Google Scholar]
- Schaefer C.F. et al. (2009) PID: the Pathway Interaction Database. Nucleic Acids Res., 37, D674–D679. [DOI] [PMC free article] [PubMed] [Google Scholar]
- Setoain J. et al. (2015) NFFinder: an online bioinformatics tool for searching similar transcriptomics experiments in the context of drug repositioning. Nucleic Acids Res., 43, W193–W199. [DOI] [PMC free article] [PubMed] [Google Scholar]
- Shannon P. et al. (2003) Cytoscape: a software environment for integrated models of biomolecular interaction networks. Genome Res., 13, 2498–2504. [DOI] [PMC free article] [PubMed] [Google Scholar]
- Shigemizu D. et al. (2012) Using functional signatures to identify repositioned drugs for breast, myelogenous leukemia and prostate cancer. PLoS Comput. Biol., 8, e1002347. [DOI] [PMC free article] [PubMed] [Google Scholar]
- Siavelis J.C. et al. (2016) Bioinformatics methods in drug repurposing for Alzheimer’s disease. Brief Bioinform., 17, 322–335. [DOI] [PubMed] [Google Scholar]
- Sirota M. et al. (2011) Discovery and preclinical validation of drug indications using compendia of public gene expression data. Sci. Transl. Med., 3, 96ra77. [DOI] [PMC free article] [PubMed] [Google Scholar]
- Smith J. et al. (2010) The ATM-Chk2 and ATR-Chk1 pathways in DNA damage signaling and cancer. Adv. Cancer Res., 108, 73–112. [DOI] [PubMed] [Google Scholar]
- Subramanian A. et al. (2017) A next generation connectivity map: L1000 platform and the first 1,000,000 profiles. Cell, 171, 1437–1452.e1417. [DOI] [PMC free article] [PubMed] [Google Scholar]
- Tibshirani R., Hastie T. (2007) Outlier sums for differential gene expression analysis. Biostatistics, 8, 2–8. [DOI] [PubMed] [Google Scholar]
- Varambally S. et al. (2005) Integrative genomic and proteomic analysis of prostate cancer reveals signatures of metastatic progression. Cancer Cell, 8, 393–406. [DOI] [PubMed] [Google Scholar]
- Vigushin D.M. et al. (2001) Trichostatin A is a histone deacetylase inhibitor with potent antitumor activity against breast cancer in vivo. Clin. Cancer Res., 7, 971–976. [PubMed] [Google Scholar]
- Wen Q. et al. (2016) A gene-signature progression approach to identifying candidate small-molecule cancer therapeutics with connectivity mapping. BMC Bioinformatics, 17, 211. [DOI] [PMC free article] [PubMed] [Google Scholar]
- Xiang M. et al. (2016) Gene expression-based discovery of atovaquone as a STAT3 inhibitor and anti-cancer agent. Blood.,128, 1845–1853. [DOI] [PMC free article] [PubMed] [Google Scholar]
- Yoneda M. et al. (2016) Hepatitis B virus and DNA stimulation trigger a rapid innate immune response through NF-kappaB. J. Immunol., 197, 630–643. [DOI] [PubMed] [Google Scholar]
- Zhang S.D., Gant T.W. (2009) sscMap: an extensible Java application for connecting small-molecule drugs using gene-expression signatures. BMC Bioinformatics, 10, 236.. [DOI] [PMC free article] [PubMed] [Google Scholar]
- Zhao W. et al. (2016) Candidate antimetastasis drugs suppress the metastatic capacity of breast cancer cells by reducing membrane fluidity. Cancer Res., 76, 2037–2049. [DOI] [PMC free article] [PubMed] [Google Scholar]
Associated Data
This section collects any data citations, data availability statements, or supplementary materials included in this article.