

SUMMARY
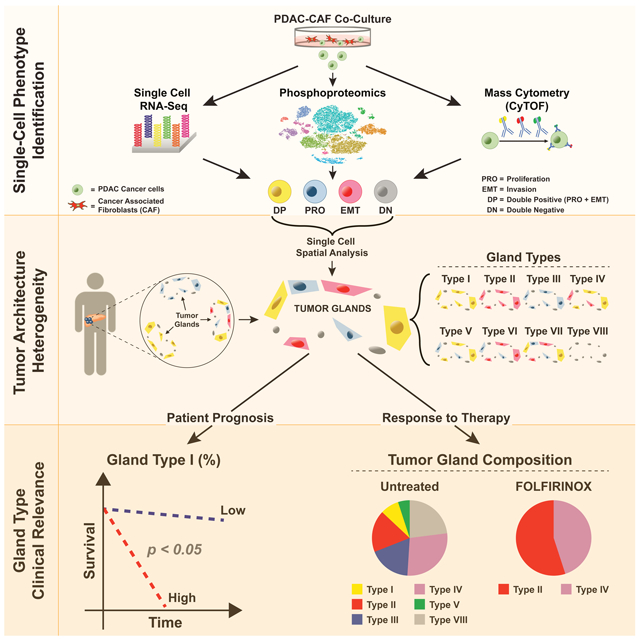
Single-cell technologies have described heterogeneity across tissues, but the spatial distribution and forces that drive single-cell phenotypes have not been well defined. Combining single-cell RNA and protein analytics in studying the role of stromal cancer associated fibroblasts (CAFs) in modulating heterogeneity in pancreatic cancer (PDAC) model systems, we have identified significant single cell population shifts towards invasive (EMT) and proliferative (PRO) phenotypes linked with MAPK and STAT3 signaling. Using high-content digital imaging of RNA in situ hybridization in 195 PDAC tumors, we quantified these EMT and PRO subpopulations in 319,626 individual cancer cells that can be classified within the context of distinct tumor gland “units”. Tumor gland typing provided an additional layer of intratumoral heterogeneity that was associated with differences in stromal abundance and clinical outcomes. This demonstrates the impact of the stroma in shaping tumor architecture by altering inherent patterns of tumor glands in human PDAC.
Graphical Abstract
eTOC Blurb
Clinical outcomes for pancreatic cancer are impacted by intra-tumoral tissue architecture as defined by single cell analyses and high content digital imaging.
INTRODUCTION
The stroma of pancreatic ductal adenocarcinoma (PDAC) consists of a complex ecosystem composed of immune cells, endothelial cells, and cancer associated fibroblasts (CAFs), providing a niche for cancer cells to modulate tumor growth and invasive behavior (Amedei et al., 2014; Apte et al., 2013; Clark et al., 2007; Erkan et al., 2012; Patel et al., 2014b). Pancreatic CAFs, which make up the bulk of the tumor stroma (Hanahan and Weinberg, 2011; Kleeff et al., 2016; Olive et al., 2009), have classically been thought to increase growth, suppress the immune response, and enhance metastatic dissemination (Hamada et al., 2012; Obong et al., 2013; Waghray et al., 2016; Xu et al., 2010). However, recent work in mouse models has shown that reduction of stromal CAFs can, in contrast, lead to more aggressive PDAC behavior (Özdemir et al., 2014; Rhim et al., 2014). Moreover, regional variations of stromal content in PDAC tumors create a mosaic in which cancer cells appear as “tumor islands” that are scattered within a “sea” of CAFs. Together, these data support a complex and nuanced interaction between PDAC and CAF cells that is not uniformly stimulatory or inhibitory (Gore and Korc, 2014; Laklai et al., 2016; Neesse et al., 2015). Previously, we had demonstrated significant heterogeneity between PDAC primary tumor cells and circulating tumor cells by single cell RNA-sequencing (scRNA-seq) and identified distinct subpopulations enriched for either epithelial-to-mesenchymal transition (EMT) or proliferative (PRO) features (Ting et al., 2014). RNA in situ hybridization (RNA-ISH) of primary tumors revealed significant enrichment of these markers in a subpopulation of PDAC cells at the tumor-stroma interface, which suggested an important role of microenvironmental CAFs in PDAC cell heterogeneity. Here, we utilized single cell RNA and proteomic technologies to dissect the role of CAFs on PDAC cell heterogeneity in model systems and translate these findings to primary human tumors through characterizing these subpopulations within their architectural context.
RESULTS
CAFs co-cultured with PDAC cells lead to single cell transcriptional heterogeneity of EMT and PRO phenotypes in a patient-derived PDAC cell line
To understand the effect of the stromal microenvironment on PDAC cell transcriptional programs, we utilized a GFP/luciferase pancreatic cancer cell line (PDAC-3) (Indolfi et al., 2016) and a mCherry CAF cell line (CAF-1) to allow for separation and isolation of each cell type in co-culture (Figures 1A and S1A). We cocultured PDAC cells and CAFs in different ratios (50:50, 30:70, 10:90 PDAC:CAF) to capture the spectrum of varying stromal content in human primary PDACs. After 72 hours of co-culture, 92 PDAC and 92 CAF cells across conditions were individually micromanipulated and sequenced by scRNA-seq (Figure 1A and Star Methods). A set of 186 differentially expressed genes (FDR < 0.2) was identified in PDAC cells alone compared to the 10:90 PDAC:CAF condition (Table S1). Of these, 51 genes were downregulated, while 135 genes were upregulated in response to CAF coculture (Figure 1B and Table S1). Gene set enrichment analysis identified 54 gene sets that were differentially expressed (Table S1, FDR < 0.1). A correlation matrix showed that these gene sets were grouped into two major classes thematically linked to PRO (HALLMARK_E2F_TARGETS) and EMT (HALLMARK_EPITHELIAL_ MESENCHYMAL _TRANSITION) activity (Figure S1B), which is consistent with our scRNA-seq in vivo analyses from the autochthonous PDAC mouse model (Ting et al., 2014).
Figure 1. PDAC:CAF co-culture alters PDAC single cell heterogeneity and is associated with a DP (PRO+EMT) phenotype.

(A) Schema of single cell RNA-seq strategy in PDAC:CAF co-culture. Patient-derived GFP/Luciferase-tagged PDAC-3 cells were cultured alone (100:0) or with different proportions of mCherry-tagged CAF-1 cells, and after 72 hours, single cells were micromanipulated and subjected to RNA-seq. (B) Expression heatmap of PDAC-3 single cell RNA-seq (columns) showing 186 differentially expressed genes identified by comparing 100%pDAc-3 (100:0) with 10%PDAC-3 : 90%CAF-1 co-culture (10:90). Hierarchical gene clustering dendrogram shown (right) with two major clusters that are downregulated (I=orange) or upregulated (II=magenta) with co-culture (10:90 condition). (C) Expression heatmap of 30 genes selected for PRO and EMT gene meta-signatures. Scales in log2 normalized gene counts. (D) Contour plots representing the expression of PRO and EMT status (gene meta-signature values) in individual PDAC-3 cells for each co-culture condition.
To quantify PRO/EMT activity in individual cells, we created two gene metasignatures specific for PRO and EMT phenotypes (Figure 1C) and observed heterogeneous acquisition of PRO and EMT transcriptional programs across all CAF concentrations (Figure 1D). Interestingly, we identified a subpopulation of cancer cells, which simultaneously co-expressed a PRO and EMT (DP= double positive) phenotype, predominantly confined in the highest CAF co-culture condition (10:90). In the absence of CAFs, 65% of PDAC cells are double negative (DN) for PRO or EMT genes, while in the 50:50 PDAC:CAF co-culture condition, PDAC cells shifted from this DN state to a mixture of PRO, EMT, or DP cells. Notably, the medium stromal condition had a predominant EMT and DP population (83%, EMT + DP).
Analysis of scRNA-seq of CAF cells from the same co-culture experiment showed the expected high baseline EMT signature, given their mesenchymal nature, and increased PRO phenotype, demonstrating crosstalk between PDAC and CAF cells (Figure S1C). An unbiased analysis of CAF scRNA-seq data comparing 100% CAFs vs 50:50 PDAC:CAF conditions yielded 3059 differentially expressed genes (FDR < 0.2) with 2158 genes up and 901 genes down (Figure S1D and Table S1). These differentially expressed genes were enriched for 88 gene sets (FDR < 0.1) (Table S1), which were thematically linked with proliferation (HALLMARK_E2F_TARGETS) and interferon response (HALLMARK_ INTERFERON_GAMMA). Notably, the proliferation signature was also enriched in PDAC cells, while the gain of an inflammatory interferon response was more specific to CAF cells (Figure S1E). Consistent with the interferon response, we noted a shift in population toward inflammatory CAFs (Figure S1F and Table S1) with PDAC co-culture, as it has been recently identified by scRNA-seq work by others (Biffi et al., 2019; Öhlund et al., 2017). Altogether, these findings demonstrate the importance of PDAC:CAF crosstalk in the development of single cell heterogeneity in PDACs.
CAF conditioned media (CAF-CM) contributes to PRO and EMT functional behavior across PDAC cell lines
To evaluate the relative contribution of CAF secreted factors to the EMT and PRO phenotype, we performed flow cytometry analysis (Figure 2A) for an EMT (FN1) and a PRO marker (Ki67) in a panel of 6 patient-derived PDAC cell lines composed of classical epithelial and quasi-mesenchymal subtypes that were exposed to CAF-CM (Figure S2A, PDAC−2,−3,−5,−6,−8,−9). As shown in Figures 2B and S2B, we observed a shift towards relatively higher levels of both the EMT (FN1) and PRO (Ki67) phenotype with the generation of DP (EMT+PRO) cells in the presence of CAF-CM from three different pancreatic CAF lines (CAF1, CAF-2, and CAF-3). This validated our scRNA-seq findings at the protein level and demonstrated the generalizability in acquiring the DP phenotype in multiple PDAC lines upon CAF-CM exposure irrespective of PDAC subtype (Figures 2B and S2B).
Figure 2. CAF conditioned media (CAF-CM) contributes to PRO and EMT functional behavior across PDAC cell lines.

(A) Experimental schema to evaluate PRO marker (Ki67) and EMT marker (FN1) to identify single cell phenotype in other PDAC cell lines at the protein level. (B) Bar graphs of percent DP (Ki67+FN1) cells in PDAC cell line analyzed by flow cytometry after 72 hours of growth in CAF conditioned media (CAF-CM) or DMEM. Mean +/− SD shown. **= p<0.01, ****= p<0.0001, two-tailed unpaired t-test. (C) Box plots of fold change in viable PDAC cells after 72 hrs compared to day 0 of in vitro culture. Cells were seeded alone (100:0) or co-cultured with different proportions of CAF-1 cells (50:50, 30:70 and 10:90). *= p<0.05, **= p<0.01, ****=p<0.0001, NS= p>0.05, two-tailed unpaired t-test. (D) Representative bioluminescence images of orthotopic tumors (upper images) of PDAC-3 cells alone (100:0) or with different proportions of CAF-1 cells (PDAC:CAF= 30:70 or 10:90). Explanted liver and lung to quantify distant metastasis (lower images). Scale bar organ dimensions=0.5cm. Scale bar Photon Flux= Luminescence (A.U.). (E) Proliferation curves of PDAC-3 xenograft with or without CAF co-injection (**=p< 0.01, Two-way ANOVA, dots= mean values, error bars= standard error of the mean). (F) Liver and lung metastatic index: normalized to primary tumor signal (*=p<0.05, Mann-Whitney Test).
To test whether these specific transcriptional profiles reflect significant functional changes in PDAC cell behavior, we performed a set of in vitro and in vivo experiments. First, we co-cultured multiple PDAC lines with each of the three CAF lines in varied PDAC:CAF proportions: 100:0, 50:50, 30:70 and 10:90 (Figures 2C and S2C). The majority of PDAC cell lines had increased proliferation with the highest stromal CAF coculture ratio (10:90) when compared to PDAC cells grown alone (p<0.01) for all three CAF lines. Notably, the PDAC-8 did not have increased proliferation when mixed with all CAF lines, which may be related to being the most epithelial PDAC cell line (Figure S2A). In addition, we performed invasion assays through Matrigel-coated Boyden chambers and observed significant (p<0.05) increases in invasive behavior in the PDAC lines with baseline detectable invasive capabilities (Figure S2D).
We extended this work in vivo with pancreatic orthotopic tumors composed of PDAC-3 and CAF cells at different ratios of 10:90, 30:70, and 100:0 (PDAC:CAF) in immunodeficient mice. Using in vivo luciferase imaging (Figure 2D), we observed that primary tumor growth was significantly faster in the 10:90 PDAC:CAF tumors (7.9X larger compared to control at 4 weeks), but not in the 30:70 PDAC:CAF tumors (Figure 2E), in accordance with our in vitro data (Figures 1D and 2C). Interestingly, increased metastatic tumor burden was observed in both PDAC:CAF orthotopic tumors compared to PDAC cells alone (Figures 2F). To further determine if our in vitro model system mirrors in vivo functional behavior of cancer cells, we orthotopically xenografted PDAC-8 alone or with CAFs in 10:90 ratio (PDACs:CAFs). Consistent with our in vitro data, we found no increase in primary tumor growth (Figure S2E upper panel). However, there was a significant increase in metastatic burden (Figure S2E lower panel), which could be linked with the significant gain of the DP subpopulation (Figure 2E). Taken together, these in vitro and in vivo results show that changes in stroma content modulates PDAC cell transcriptional profiles, leading to distinct gains in proliferative and metastatic capabilities in multiple patient-derived PDAC cell lines.
CAF-CM activates MAPK and STAT3 signaling pathways in DP cells across PDAC cell lines
Given PDAC cells shift toward the EMT and PRO phenotypes in the presence of CAF-CM, we wanted to identify the signaling pathways activated in PDAC cells due to CAF-CM exposure. We performed a time course mass spectrometry-based phospho-proteomics experiment on PDAC-3 cells exposed to CAF-CM at 5 min, 15 min, 1 hour, 3 hours and 24 hours (Figure 3A). This experiment revealed significant enrichment of EMT and PRO protein networks (Figures 3B and 3C) with early activation of the MAPK pathway (MEK/ERK) followed by an upregulation of the STAT3 pathway (STAT3) at 24 hours (Figure 3B and Table S2). We confirmed MAPK and STAT3 co-activation in PDAC-3 cells at 24 and 72 hours by phospho-immunoblotting (Figure 3D).
Figure 3. CAF-CM activates MAPK and STAT3 signaling pathways in PDAC cells.

(A) Experimental schema for identifying signaling pathways upregulated in PDAC-3 cells by CAF-CM. (B-C) Time course mass spectrometry-based phospho-proteomics experiment using PDAC-3 cells exposed to CAF-CM. (B) Protein networks showing upregulation of phospho-proteins (color circles) related to cell cycle (blue), EMT (purple), MAPK (MeK-ERK) (green) and STAT3 pathways (yellow) in PdAC-3 cells after different times of exposure to CAF-CM compared to DMEM. (C) Bar graph displaying the negative log10 q-values of the three most significant upregulated gene ontology terms enriched after 24 hours of CAF-CM. (D) Immunoblots of phosphorylated MAPK (p-MEK and p-ERK) and STAT3 (p-STAT3) proteins with paired total protein following 24 and 72 hours of exposure to CAF-CM in PDAC-3 cells. Vinculin as protein loading control. (E) Heatmap showing relative cell growth inhibition of PDAC-3 alone (100:0) or with different PDaC:CAF culture conditions 50:50, 30:70, 10:90 when treated with multiple combinations of MEKi (trametinib) and STAT3i (pyrimethamine). i = inhibitor. (F) Scatter plots showing the mean intensity (mean and standard deviation) of crystal violet staining to quantify PDAC-3 cell transwell invasion after 48 hours of exposure to CAF-CM plus MEKi (trametinib), STAT3i (pyrimethamine), combination, or vehicle (DMSO) control. **= p<0.01, NS= p>0.05, two-tailed unpaired t-test. (G) Scatter plots showing the amount of DP (MKI67+FN1) cells identified by RNA-IsH flow cytometry (mean and standard deviation) exposed to CAF-CM with MEKi (trametinib), STAT3i (SH-4-54), combination, or vehicle (DMSO) control. **= p<0.01, NS= p>0.05, two-tailed unpaired t-test.
To confirm that MAPK and STAT3 signaling were functionally important for EMT and PRO behavior, we used a small molecule inhibitor of MAPK/MEK (MEKi=trametinib) and two inhibitors of STAT3 (STAT3i= SH-4-54 or pyrimethamine, Figure S3A) on 5 PDAC cell lines. The combination of MEKi and STAT3i had increasing effects on multiple PDAC cell lines (PDAC-2, PDAC-3, PDAC-6, PDAC-9) with higher CAF coculture ratios, although PDAC-8 was very sensitive to these drugs at baseline without CAFs (Figure 3E and S3B). In addition, the combined MAPK/MEK and STAT3 inhibitors were more effective in suppressing invasion in migratory cell lines (Figure 3F and S3C, PDAC-2, PDAC-3 and PDAC-9) and in abrogating the DP phenotype in PDAC-3 than either inhibitor alone (Figures 3G). In summary, CAF-CM upregulates MAPK and STAT3 signaling pathways in cancer cells, which leads to increased sensitivity for MEKi/STAT3i combination treatment (anti-proliferative and anti-invasive effects) across multiple PDAC lines.
The pharmacological targeting of DP cells by MEKi/STAT3i combination indicated a simultaneous upregulation of these two pathways in this cell type. To test this hypothesis, we performed multiplexed flow cytometry for FN1 (EMT), Ki67 (PRO), phospho-STAT3 (p-STAT3), and phospho-ERK (p-ERK) in four PDAC lines (PDAC-2, -3, -5 and -9). We cultured PDAC lines with or without CAF-CM and demonstrated a notable enrichment in MAPK/STAT3 activation in DP cells (Figures 4A, 4B, and S4A). To further validate the presence of these populations with a more quantitative single cell proteomic analysis, we used mass cytometry (CyTOF) for a panel of 21 markers including FN1, Ki67, p-ERK, and p-STAT3 in PDAC-3 with or without CAF-CM (Figure 4A). Quadrant analysis after 72 hours of CAF-CM exposure confirmed heterogeneous populations of PDAC cells with different levels of ERK and STAT3 activation (Table S3), as well as the enrichment of a DP population with coincident activation of ERK and STAT3 (Figures 4C, and S4B). Analysis of all markers evaluated by CyTOF revealed that IGFR1 (p<0.0001), p-STAT5 (p<0.0001) and p-ERK (p<0.0001) were the top three proteins upregulated in DP vs. PRO cells (Figure S4C and Table S4), while p-AKTThr308 (p<0.0001), p-NFKBSer529 (p<0.0001) and cMYC (p<0.0001) were the top three proteins upregulated in DP cells vs. EMT cells (Figure S4D and Table S4).
Figure 4. DP cells co-upregulates MAPK and STAT3 signaling pathways in multiple PDAC lines, in human primary tumors, and in a liver metastasis.
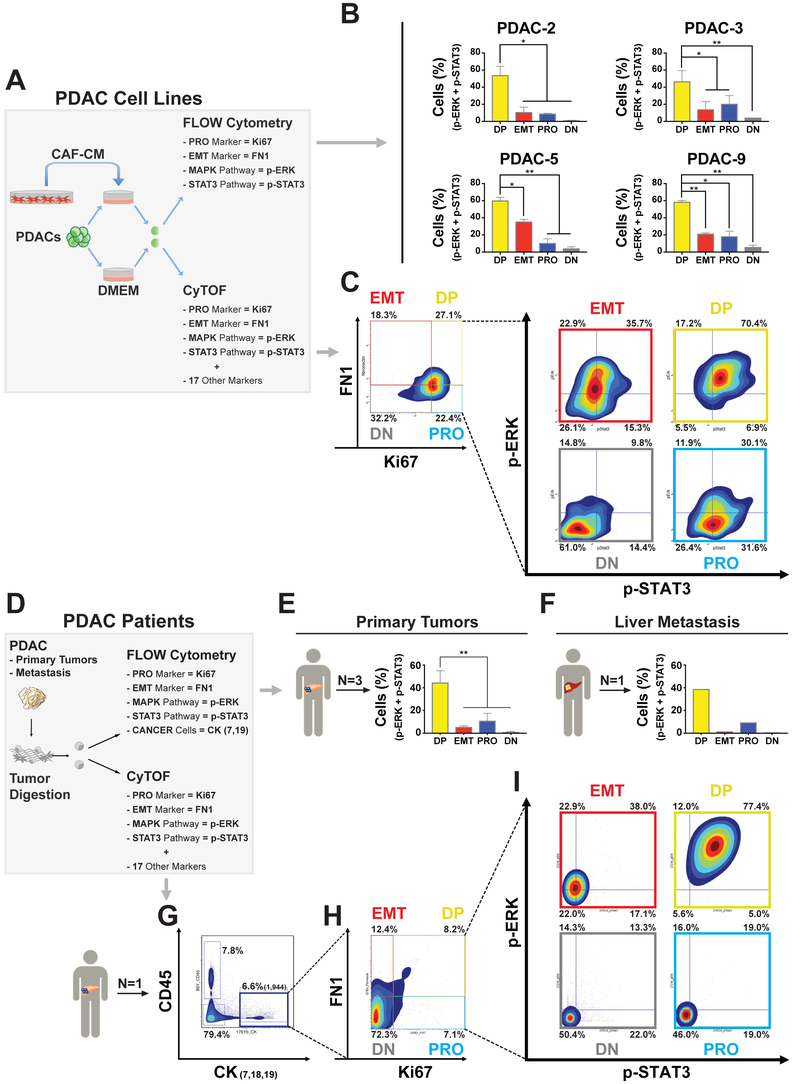
(A) Experimental schema of patient-derived PDAC cell lines exposed to CAF-1 conditioned media (CAF-CM) and analyzed for EMT (FN1), PRO (Ki67), MAPK (p-ERK), and STAT3 (p-STAT3) pathways with multiparameter flow cytometry or mass cytometry (CyTOF). (B) Bar graph (mean +/− SD) showing the percentages of DP (Ki67+/FN1+), EMT (−/FN1+), PRO (Ki67+/−) and DN (−/−) cells that have a coupregulation of both p-ERK and p-STAT3. *= p<0.05, **= p<0.01, two-tailed unpaired t-test. (C) Contour density plots showing Ki67 and FN1 positive subpopulations in PDAC-3 cells after 72 hours of CAF-CM exposure and contour density plots showing p-ERK and p-STAT3 activation in DP, EMT, PRO and DN subpopulation. (D) Experimental schema for human PDAC samples (primary tumors and a liver metastasis) analyzed for EMT (FN1), PRO (Ki67), MAPK (p-ERK), and STAT3 (p-STAT3) pathways with multiparameter flow cytometry (FN1, Ki67, p-STAT3, p-ERK, CK-7, and CK-19) or CyTOF. (E) Bar graphs (mean +/− SD) showing the percentages of DP (Ki67+/FN1+), EMT (−/FN1+), PRO (Ki67+/−) and DN (−/−) cells in three human primary PDAC tumors and (F) in a liver metastasis. (G) Contour density plots showing epithelial cancer markers (CK7,18,19)***** compared with white blood cell marker (CD45). (H) Quadrant analysis of gated CK7,18,19 cells for Ki67 and FN1 expression. (I) Contour density plots showing p-ERK and p-STAT3 activation in each cell phenotype (DP, EMT, PRO and DN) previously identified.
To validate these findings in patients, we performed multiplexed flow cytometry (FN1, Ki67, p-STAT3, p-ERK, CK-7, and CK-19) in three primary tumors and one liver metastasis from different PDAC patients. This set of experiments confirmed the specific co-activation of MAPK and STAT3 in DP cells (Figures 4D-4F), which was also seen in an additional human primary tumor analyzed by CyTOF (Figures 4D, 4G-4I and Table S3). Furthermore, CyTOF re-confirmed the enrichment of p-ERK (p<0.0001), IGFR1 (p<0.0001), and p-STAT5 (p<0.0001) in DP cells vs. PRO cells, and p-AKTThr308 (p<0.001), p-NFKBSer529 (p<0.0001) and cMYC (p<0.0001) in DP cells vs. EMT cells (Figures S4E and S4F, Table S4). Taken altogether, these results show that MAPK and STAT3 pathways are co-activated in individual DP PDAC cells in both our cell line model as well as in human primary and metastatic PDAC tumors.
CAF-secreted TGF-beta drives the DP phenotype in PDAC cell lines
Having identified variation in EMT and PRO phenotypes in the presence of CAF-CM, we next sought to identify CAF-secreted factors responsible for these phenotypic changes. To ensure that CAF-secreted factors alone were sufficient to modify EMT and PRO phenotypes, we generated no-serum CAF-CM and showed increased proliferation of two PDAC lines (PDAC-2 and PDAC-3) exposed to no-serum CAF-CM (Figure S5A). We then performed mass spectrometry on no-serum CAF-CM and no-serum PDAC-CM, taken from 4 PDAC lines: 2 quasi-mesenchymal (PDAC-2 and PDAC-3) and 2 epithelial (PDAC-6 and PDAC-8, Figure 5A and Table S5). We compared CAF and PDAC secretomes to identify proteins that were at least 8-fold more abundant in noserum CAF-CM (Figure 5B, x-axis) and had a high positive correlation (Pearson R > 0.80) with DP induction (fold change) across PDAC cell lines (Figure 5B, y-axis). This yielded 7 candidate proteins including TGFB1, a well-established secreted factor involved with cancer cell aggressiveness and progression (Figure 5C). We confirmed high TGFB1 in no serum CAF-CM by ELISA in additional biological replicates (Figure S5B).
Figure 5. CAF-secreted TGFB1 drives the DP phenotype in PDAC cell lines.

(A) Experimental schema for discovery of CAF secreted factor by comparing PDAC and CAF conditioned media (CAF-1_CM and PDAC_CM) analyzed by mass spectrometry. (B) Scatter plot showing the Log2 fold difference of each secreted protein between CAF and PDACs (x-axis; CAF/average of PDAC-2, −3, −6 and −8) and the Pearson correlation coefficient between the quantitation of secreted proteins in each PDAC line (PDAC_CM mass spectrometry) compared to DP induction (fold changes) in response to CAF-CM (Fig. 2A). The box is a magnification of the top right quadrant identifying 7 proteins with highest differential quantitation between CAF and PDAC CM (> 8-fold) and highest Pearson correlation coefficient (>0.8). (C) Enriched secreted protein ordered by decreasing values of their Pearson correlation coefficients and adjusted p-value for differential quantitation between CAF and PDAC CM. (D) Box plots showing the PDAC-2, -3, -9 cell line viability exposed to both CAF-CM and a neutralizing anti-human TGFB1 antibody after 3 days for PDAC-2 and PDAC-3 and 5 days for PDAC-9. (E) Box plots of relative cell growth in PDAC cell lines treated with different amounts of recombinant TGFB1. For box plots *= p<0.05, **= p<0.01, ***= p<0.001, ****=p<0.0001, NS= p>0.05, two-tailed unpaired t-test. (F) Bar graphs showing percentages of DP cells (Ki67+/FN1+) obtained by flow cytometry analysis across PDAC cell lines upon treatment with 0.5 ng/ml of human recombinant TGFB1. Mean +/−SD shown. *= p<0.05, **= p<0.01, ****=p<0.0001, two-tailed unpaired t-test.
To test whether TGFB1 plays a mechanistic role in PDAC-CAF crosstalk, we used a neutralizing antibody against TGFB1, which abrogated pro-proliferative effects in 3 PDAC lines cultured in CAF-CM (Figures 5D and S5C). We then applied recombinant TGFB1 protein to 5 PDAC cell lines and observed increased cell proliferation at a minimum concentration of 0.1 ng/mL across all lines (Figure 5E). These data indicate that TGFB1 is a significant contributor to the gain of proliferative capability in PDAC cell lines. Combined with the known gain of EMT behavior induced by TGFB1 in cancer cells, we predicted that TGFB1 signaling would contribute to the generation of the DP phenotype. Indeed, recombinant TGFB1 was sufficient to generate cells with the DP phenotype in all PDAC cell lines when assessed by flow cytometry (Figures 5F and S5D).
RNA-ISH confirms EMT and PRO single cell phenotypes in primary human PDAC tumors
To further translate these findings from our cell line models to patients, we performed RNA-ISH in 195 human primary PDAC tumors for MKI67 and FN1 expression (Figures 6A and S6A). RNA-ISH staining and digital scanning were performed on a total of 365 cores with an average of 1.9 cores per patient (range: 1-5) on tissue microarray (TMA) format. Each core had on average 9.8 glands (SD=5.8) assessed, and 40.5% (79 of 195) of patients had a single core analyzed. Although MKI67 was found localized to tumor cells, we noted the significant expression of FN1 in stromal CAFs consistent with our scRNA-seq data. Given the shared expression of FN1 between PDAC cells and CAFs, the ability to separate these populations in situ was critical for our analysis. A customizable digital microscopy analysis platform (Visiopharm) was used to quantify DP, PRO, EMT, and DN phenotypes in each individual tumor gland identified. A total of 3593 tumor glands were analyzed with an average of 18.4 glands per patient (SD=13.4). We scored a total of 319,626 individual cancer cells (Figure 6A) providing 38,177 PRO cells (11.9%), 55,802 EMT cells (17.5%), 35,295 DP cells (11.0%), and 190,352 DN cells (59.6%). To validate the robustness of our single markers (MKI67 and FN1), we stained tumor xenografts (PDAC-3 cell line) with dual-color tissue RNA-ISH for MKI67 and PCNA (Figure S6B) or FN1 and VIM (Figure S6C), which are well-known alternative markers of PRO and EMT, respectively. We then applied our digital microscopy analysis platform and found a high concordance (range: 70-75%) of these markers in tumor cells. We then proceeded with our analysis on human tumors, noticing a high inter-tumor single-cell heterogeneity (Figure S6D). However, when evaluating each of these cell types (DP, EMT, PRO and DN) normalized by the total number of cells per patient (i.e. without any spatial information), only PRO cells were a significant prognostic biomarker (Log-Rank Test, p=0.0188), which interestingly was associated with improved patient survival (Figures 6B and S6E).
Figure 6. Tumor glands are independent “units” in the architecture of primary PDAC tumors.

(A) Representative images of dual-color tissue RNA-ISH of primary human PDACs stained for PRO marker MKI67 (Ki67) and EMT marker FN1. Representative image analysis of tumor glands using quantitative digital pathology software to score single cancer cells in distinct cell phenotypes: DP (Ki67+/FN1+), EMT (−/FN1+), PRO (Ki67+/−) and DN (−/−). Image Bar = 20 μm, Inset Bar = 3 μm. (B-C) Kaplan-Meier survival curves for high vs low DP (Ki67+/FN1+), EMT (Ki67−/FN1+), and PRO (Ki67+/FN1−) cells. (B) Single cell scoring by the total number of cancer cells per tumor (left column) compared to (C) single cell scoring normalized per gland basis (right column). A uniform cutoff of 15% was applied to divide low- vs high-risk patients in each Kaplan-Meier curve.
We then hypothesized that spatial information (Figures 6A and S6A) and the composition of discrete tumor glands would be important features linked with patient outcomes. Indeed, if cell types in each tumor gland are considered part of a “unit” and percentages normalized per gland basis (Figures 6C and S6F), then DP (Log-Rank Test, p=0.0379), PRO (p=0.005), and DN cells (p=0.009) all become statistically significant prognostic markers, and EMT cells trend toward significance (p=0.056). Altogether, these results point toward a tumor gland as an independent functional “unit” carrying more information than single cells removed from their architectural context.
Stromal content is associated with distinct patterns of tumor glands in human primary PDAC tumors
The heterogeneous impact of cell types (DP, EMT, PRO, and DN) on patient outcomes, when considering tumor gland architecture, suggested the existence of different gland types. Therefore, we defined 8 different classes of tumor glands based on their internal cell composition (Figures 7A). We first classified glands that are predominantly occupied by a single cell type (>= 15% of each type): DP (Type I), EMT (Type II), or PRO (Type III). We then classified glands that contained two cell types (>= 15% of both types): DP+EMT (Type IV), DP+PRO (Type V), or EMT+PRO (Type VI). Tumor glands that have all three cell types (>= 15% of all types) or none of them (< 15% of all types) were classified as Type VII and Type VIII, respectively. By performing this classification, we observed both inter- and intra-patient heterogeneity in gland type composition (Figure 7B and S7A).
Figure 7. Stromal content and cytotoxic therapies are correlated with distinct patterns of tumor glands in human primary PDAC tumors.

(A) Representative images of eight distinct tumor glands found in human primary PDACs based on their composition of DP, EMT, PRO, and DN cells. Bar = 10 μm. Number of glands scored shown at the bottom. (C) Upper panel: Representative image of dual-color RNA-ISH staining for cytokeratins (KRT 7, 8, 18, 19, blue color) and SPARC gene (red color) of tissue microarray (TMA) slides of human primary PDAC tumors and representative image of digital analysis to determine the amount of stroma (SPARC) in human primary PDAC tumors. Tumor area is represented by the total amount of the blue area (cytokeratins), while stroma is the sum of the red (cellular compartment) and yellow (extracellular compartment) area for each core. Lower panel: Bar plots depicting the differences in intratumoral glandular heterogeneity in low (<75%, PDAC:CAF=~50:50), medium (75-85%, PDAC:CAF=~30:70), and high (>85%, PDAC: CAF=~10:90) stroma PDAC tumors. Tumor glands enriched in primary PDACs in each stroma class shown below: Type III in low stroma, Type II and Type IV in medium stroma, and Type I and Type IV in high stroma tumors. (D) Violin plots showing the distribution of different types of tumor glands based on stromal content in PDAC tumors. (E) Multivariate survival analysis (COX-Regression Model) including tumor gland types and clinical stage (stage II and III). (F) Upper panel: Pie charts comparing the intratumor glandular composition of untreated patients (N=195) with FOLFIRINOX-treated patients (N=25). Lower panel: Box plots showing the distribution of each gland type in untreated (left panel) vs FOLFIRINOX-treated patients (right panel).
Given the effect of CAFs in changing PRO and EMT phenotypes in our in vitro and in vivo models, we evaluated the relationship of stromal content with gland heterogeneity in human PDAC tumors. We binned primary PDACs in low (<75%), medium (75-85%), or high-stroma (>85%) tumors (stroma content medium value= 79%, Table S6) by quantitating the total area occupied by stroma in each TMA core stained with RNA-ISH for SPARC, a well-known PDAC stromal gene (Infante et al., 2007) (Figures 7C). To determine the entire stromal area, we developed a digital image analysis algorithm that allowed us to quantify the cellular compartment (SPARC positive staining, red color) as well as the extracellular compartment (yellow color), to have a better estimation of the total area occupied by stroma (Figure 7C upper panel). Notably, we observed an enrichment of gland types containing distinct cell types (DP, EMT, or PRO) based on stroma content: DP glands (Type I) were only significantly enriched in high-stroma tumors, EMT containing glands (Type II and IV) in medium-stroma tumors, and PRO glands (Type III) in low-stroma tumors (Figures 7C lower panel, 7D, and S7B). Altogether, this linkage between stroma abundance and tumor gland types validates the relevance of our preclinical models.
To determine the potential functional relevance of tumor glands, we stained our orthotopic tumor xenografts with RNA-ISH to compare tumor gland composition in primary tumors vs. distant metastases (Figure S7C). Interestingly, distant liver metastases only contained EMT and DP containing glands (Type II and Type IV), indicative of an enrichment for these cell types in metastatic colonization (Figure S7C). Altogether, these results provide in vivo evidence that points toward differences in fitness of certain cell types (DP and EMT) with specific tumor gland types that are linked with metastasis and potentially other behavior that are reflected in clinical outcomes. To evaluate this possibility, we performed univariate survival analysis (Kaplan-Meier) for each gland type in our patient cohort and found that tumor glands containing predominantly DP or EMT cells (Type I, II, IV) had significant association with worsened patient survival (Log-Rank Test, Type I p=0.005; Type II p=0.043; Type IV p=0.001) (Figures S7D). Contrastingly, glands that do not contain any DP or EMT cells, but only PRO cells (Type III), were associated with improved survival (Log-Rank Test, p=0.030).
To evaluate for independent predictors for survival, we performed multivariate Cox regression analyses including all gland types and single cell phenotypes (DP, PRO, EMT and DN). We found that only Type I glands (DP-predominant gland) remain statistically significant (Figure S7E; Type I: HR 1.46; 95%CI 1.03–2.06; p-value=0.033). Introduction of clinical staging into the multivariate model with gland types still demonstrated independent prognostic significance of Type I glands (Figure 7E and Table S6; HR 1.49; 95%CI 1.10-2.02; p-value=0.009). In sum, the presence of Type I glands provided independent prognostic information from conventional clinical parameters in PDAC patients treated with upfront surgical resection. More recent clinical trials have indicated that preoperative (neoadjuvant) FOLFIRINOX chemotherapy and radiation therapy can increase PDAC resectability and long-term survival (Murphy et al., 2018). These heavily pretreated tumors provided an opportunity to determine if certain gland types are selected for in the face of intensive cytotoxic chemotherapy. We analyzed 25 of these patients with RNA-ISH and scored 22,959 individual cancer cells in 416 tumor glands (Table S7). We found significant depletion of all gland types, except for Type II and Type IV (EMT and EMT+DP), compared to our cohort of 195 untreated resected PDAC samples (Figure 7F and S7F). This suggests that specific gland types are selected in the setting of significant cytotoxic stress.
Altogether, these data highlight the importance of stroma in shaping single cell and tumor gland heterogeneity, which greatly impacts PDAC tumor biology, response to cytotoxic therapies, and patient survival.
DISCUSSION
The importance of the tumor microenvironment in shaping cancer cell behavior has been well known, but there has been conflicting literature on the suppressive versus supportive role of these elements in pancreatic cancer. Although previous works by Özdemir (Özdemir et al., 2014) and Rhim (Rhim et al., 2014) pointed to tumor restraining effects of stromal CAFs, these models provided near complete depletion of CAFs in the setting of established or developing tumors, which is distinct from our model of changing CAF content in the establishment of tumors. Altogether, these collective works demonstrate that the relative changes in stromal content can have diverse effects depending on the temporal development of tumors. Moreover, computational methods have suggested distinct behavior of PDAC subtypes with different types of stroma (Moffitt et al., 2015). The current work presented along with previous publications using scRNA-seq has revealed the heterogeneous landscape of both tumor and microenvironmental cells (Bernard et al., 2018; Biffi et al., 2019; Öhlund et al., 2017; Patel et al., 2014a; Ting et al., 2014; Tirosh et al., 2016a; 2016b), providing an additional source of dynamic behavior in PDACs. Our work extends on these studies by providing both functional and analytical characterization of heterotypic responses of PDAC cells with stromal CAFs. The combination of single-cell RNA (scRNA-seq and RNA-ISH) and protein (flow cytometry and CyTOF) analytical platforms have provided unprecedented resolution of the relationship of signaling pathways (MAPK and STAT3) and transcriptional programs (PRO and EMT) in individual cancer cells across model systems and primary human tumors. In addition, CAF secreted TGFB1 was identified as a contributor to the generation of the DP phenotype in multiple PDAC cell lines, although we acknowledge additional work is required to fully characterize the cellular interactions between cancer and stromal cells in the development of DP cells. TGFB1 has been shown to directly engage MAPK signaling in pancreatic cancer (Principe et al., 2017) and STAT3 signaling in lung cancer (Liu et al., 2014), head and neck squamous cell carcinoma (Wang et al., 2018), and hepatocellular carcinoma (Tang et al., 2017). Moreover, EMT and ERK signaling in PDACs have been shown to be correlated (Qin et al., 2015; Zhao et al., 2015). In addition, the rational combination of MEK and STAT3 inhibitors in KRAS mutated pancreatic and colon cancer has been demonstrated (Zhao et al., 2015). We extend on these results by demonstrating the importance of the dual activation of MAPK and STAT3 in generating PDAC cell phenotypes and the correlation of this signaling to TGFB1 produced by CAFs. This highlights the importance of evaluating combination drug sensitivity with variations in stromal CAF composition. It also suggests the possibility of therapeutic opportunities linked to more accurate assessment of stromal composition. Moreover, therapies that alter stromal composition can lead to beneficial or harmful effects, depending on the relative stromal content, the differences of intratumoral drug concentrations, and regional variations in tumor gland types. However, we note that the dynamics of TGFB1 and STAT3 signaling do not solely apply to tumor cells and that recent work has described the importance of these signaling pathways in PDAC CAF heterogeneity (Biffi et al., 2019). Altogether, these pathways are clearly important in PDAC pathogenesis, and additional work is needed to dissect the relative contributions of these signaling pathways in both tumor cells and stromal CAFs.
Most importantly, we have highlighted the significance of understanding the context of single-cell heterogeneity within individual tumor glands. This inherent intratumoral heterogeneity indicates that primary tumors do not behave uniformly, but they are composed of different tumor gland “units” each with distinct proliferative and metastatic propensity. This glandular heterogeneity can only be assessed with methods that evaluate single cell populations in situ and cannot be ascertained from scRNA-seq approaches alone. This is particularly important for genes that are shared between cancer and non-cancer cells, such as EMT markers (e.g. FN1, VIM). In fact, the singlecell phenotypes (DP and EMT) we identified in our model system only had prognostic significance when accounting for individual tumor gland compositions and not when considered in aggregate. Others have evaluated single immunohistochemistry markers including p-ERK and Ki67 in PDAC but have found the need to combine five different markers together with clinicopathological features to obtain relevant prognostic utility (Qin et al., 2015). This illustrates the limitations of single marker stains and scoring tumors based on bulk aggregate staining. However, while the results from this dataset indicate gland type as a potential novel biomarker for PDAC patients, it remains to be determined how intratumor heterogeneity would affect the gland type sensitivity and specificity of a single-core biopsy. Additional work will be required to estimate the optimal number of glands and cores needed for specific clinical applications.
Altogether, these findings demonstrate the importance of tumor-stroma interplay in PDAC and underscore the significance of RNA-ISH analytics to include architectural context in complementing single-cell RNA-seq analysis. To capture this complexity, we have developed a new methodology to perform large scale RNA-ISH single cell analysis in human tissues, which can be directly translated to the clinical realm. Understanding these heterotypic interactions between cancer cells and their microenvironment within the context of tumor architecture has revealed novel mechanistic insight into the pathogenesis of PDAC and offers a new tool to study the role of intratumoral heterogeneity in normal and tumor tissues.
STAR*METHODS TEXT
CONTACT FOR REAGENT AND RESOURCE SHARING
Further information and requests for resources and reagents should be directed to and will be fulfilled by the Lead Contact, David T. Ting (DTING1@mgh.harvard.edu).
EXPERIMENTATAL MODEL AND SUBJECT DETAILS
Human Subjects
A tissue-micro array (TMA) of primary PDACs from patients, who were resected at Massachusetts General Hospital, was constructed. All these patients have signed an appropriate informed-consent form under the approved IRB protocol No. 2013P001854. Fresh and cryopreserved human tumors and liver metastasis were obtained from patients resected at Massachusetts General Hospital upon signing the informed consent in accordance with the IRB protocol No. 2003P001289.
Patient-Derived Cell Lines
Patient-Derived PDAC cell lines were derived from metastatic ascites from patients under a discarded tissue protocol in accordance with the Massachusetts General Hospital (MGH) IRB protocol 2011P001236. Primary cancer associated fibroblast (CAF) lines (CAF-1 and CAF-3) were derived from PDAC tumor tissue collected in accordance with the Massachusetts General Hospital (MGH) IRB protocol 2003P001289.
Mouse Models
All animal experiments were approved by the IACUC (protocol No. 2014N000321) of Massachusetts General Hospital (MGH). NOD/SCID/gamma-c (NSG; NOD.Cg-Prkdcscid Il2rgtm1Wjl/Sz, from Jackson Laboratories) mice were used for the orthotopic xenograft model. All mice were female and 4-6 weeks old. All animal care was performed according to Institutional guidelines at MGH.
METHOD DETAILS
Patient-Derived PDAC Cell Line Generation
(Figure 1A) Patient-Derived PDAC cell lines were derived from metastatic ascites from patients under a discarded tissue protocol in accordance with the Massachusetts General Hospital (MGH) IRB protocol 2011P001236 as previously described (Indolfi et al., 2016). To produce replication-incompetent lentivirus, 293T cells were co-transfected with Lenti-GFP-Luciferase construct in combination with REV, VSVG, PDML (Addgene) using Lipofectamine Plus reagent (Invitrogen). Twenty-four hours later, growth medium was replenished. Viral supernatants were harvested 48 hours post-transfection, concentrated with Lenti-X Concentrator (Clontech), and viral pellets were resuspended in 400 μl base medium. PDAC cell lines were infected overnight with 50 μl lentivirus in 6 μg/ml Polybrene. Cell lines were grown adherent in DMEM (high glucose, pyruvate; cat. No 11995065), Penicillin 100 U/mL and Streptomycin 100 μg/mL (PenStrep 1X), and 10% fetal bovine serum (FBS). All lines were tested for mycoplasma contaminations.
Patient-Derived CAF Line Generation
(Figure 1A) Primary cancer associated fibroblast (CAF) lines (CAF-1 and CAF-3) were derived from PDAC tumor tissue collected in accordance with the Massachusetts General Hospital (MGH) IRB protocol 2003P001289. The tissue was chopped with a sterile scalpel and then digested for 3 hours at 37° C using Collagenase Digestion Medium (DMEM/F12, Penicillin 100 U/mL and Streptomycin 100 μg/mL, Insulin 10 μg/mL, Hydrocortisone 0.5 μg/mL, collagenase digestion 125 units/mg). Following tissue digestion, cells were plated in adherent conditions in Growth Medium (DMEM, PenStrep 1X, 10% FBS) and passaged regularly. CAFs were immortalized for continual culturing by infecting with hTERT (pBABE-hygro-hTERT) within 2-weeks of CAF line establishment. To produce replication-incompetent lentivirus, 293T cells were cotransfected with mCherry pUltra-hot (Addgene #24130) construct in combination with REV, VSVG, PDML (Addgene) using Lipofectamine Plus reagent (Invitrogen). Twenty-four hours later, growth medium was replenished. Viral supernatants were harvested 48 hours post-transfection, concentrated with Lenti-X Concentrator (Clontech), and viral pellets were resuspended in 400 μl base medium. CAFs were infected overnight with 50 μl lentivirus in 6 μg/ml Polybrene. All lines were tested for mycoplasma contaminations. CAF-2 line was obtained from Dr. Ulrich F. Wellner (Clinic of Surgery, UKSH Campus Lübeck, Germany) and Dr. Oliver Schilling (Institute of Pathology, University Medical Center Freiburg, Germany). CAF-2 cells were cultured by the outgrowth method from a surgically resected tissue specimen of histologically proven pancreatic ductal adenocarcinoma (pT2, pN1, L1. V1. Pn0. G3. R0. cM0. no neoadjuvant tx). CAF-2 cells were subsequently immortalized by lentiviral mediated stable transfection of hTERT.
Immunofluorescence
(Figure S1A) Patient-derived PDAC-3 and CAF-1 cells were co-cultured in chambered slides (Millicell® EZ slide Cat.No: PEZGS0416) and immunostained using a primary-secondary approach. Cell were washed three times with PBS and fixed with 4% paraformaldehyde for 5 min, washed 3 times with PBS for 5 min each, blocked with 5% normal goat serum in PBS per 30 min, permeabilized with 0.3% TWEEN 20 for 5 min, and stained primary antibodies were rabbit anti-wide spectrum cytokeratin (1:50, Abcam ab9377) and mouse anti-actin a-smooth muscle actin (1:500, Sigma A2547). Secondary immunofluorescent-tagged antibodies were used for signal amplification. Goat antirabbit IgG Alexa Fluor 488 and goat anti-mouse IgG 594 were used for secondary amplification. Nuclei were then counterstained with nuclear 4,6-diamidino-2-phenylindole (DAPI) and the slides were rinsed with PBS, cover slipped and stored at 4°C. Fluorescence images were acquired using a stan dard up-right fluorescent microscope (Nikon 90-I eclipse). GFP and mCherry protein was detected in PDAC-3 and CAF-1 cells, respectively, in co-culture in chambered slides.
Cell culture and Micromanipulation
(Figure 1A) A total of 100,000 cells were plated in each well of a 6-well plate. In each well, a different number of GFP/Luciferase-tagged PDAC-3 cells and mCherry-tagged CAF-1 cells were seeded to establish the following conditions: 100% PDAC-3 cells, 50% PDAC-3 cells + 50% CAF-1 cells, 30% PDAC-3 cells + 70% CAF-1 cells, 10% PDAC-3 cells + 90% CAF-1 cells and 100% CAF-1 cells. After 72 hours of co-culture, cells were trypsinized and resuspended in PBS solution, and micromanipulated. CTCs were then individually micromanipulated using a 10 μm transfer tip on an Eppendorf TransferMan NK2 micromanipulator, transferred into PCR tubes containing RNA protective lysis buffer (Clontech Laboratories), and flash frozen in liquid nitrogen as previously described (Ting et al., 2014).
Single Cell Amplification and Sequencing
(Figures 1A-1D, Figures S1B-S1E, and Table S1) After lysis, amplified cDNA was generated from RNA from each single cell using the SMARTer Ultra Low Input RNA Kit for Sequencing - v3 kit (Clontech Laboratories) according to the manufacturer’s protocol. Briefly, 1 μl of a 1:50,000 dilution of ERCC RNA Spike-In Mix (Life Technologies) was added to each sample. First-strand synthesis of RNA molecules was performed using the poly-dT-based 3’-SMART CDS primer II A followed by extension and template switching by the reverse transcriptase. The second strand synthesis and amplification PCR was run for 18 cycles, and the amplified cDNA was purified with a 1x Agencourt AMPure XP bead cleanup (Beckman Coulter). The Nextera® XT DNA Library Preparation kit (Illumina) was used for sample barcoding and fragmentation according to the manufacturer’s protocol. 1 ng of amplified cDNA was used for the enzymatic tagmentation followed by 12 cycles of amplification and unique dual-index barcoding of individual libraries. PCR product was purified with a 1.8x Agencourt AMPure XP bead cleanup. The eluted cDNA libraries did not undergo the bead-based library normalization step in the Nextera XT protocol. Library validation and quantification was performed by quantitative PCR using the KAPA SYBR® FAST Universal qPCR Kit (Kapa Biosystems). The individual libraries were pooled at equal concentrations, and the pool concentration was determined using the KAPA SYBR® FAST Universal qPCR Kit. The pool of libraries was subsequently sequenced in three replicates on a HiSeq 2500 in Rapid Run Mode using a 2 × 100 base pair kit and a dual flow cell.
Flow Cytometry
(Figures 2B, S2B, 5F, and S5D) 50,000 PDAC-2 and PDAC-3. 100,000 PDAC-5 and PDAC-6 and 150,000 PDAC-8 and PDAC-9 cells were seeded in 6-well plate in DMEM with 2% FBS and with or without 30% CAF conditioned media (CAF-CM) from three different CAF lines (CAF-1, CAF-2, and CAF-3) (Figures 2B and S2B) or 0.5 ng/ml of human recombinant TGFB1 (Figures 5F and S5D). After 2 days for PDAC-2, 3 days for PDAC-3 and PDAC-6, and 5 days for PDAC-8 and PDAC-9 due to intrinsic differences in cell growth among patient-derived PDAC lines, cells were harvested and stained for Ki67 Ab (Brilliant Violet 605™ anti-human Ki-67 Antibody, biolegend, https://www.biolegend.com/ja-jp/products/brilliant-violet-605-anti-human-ki-67-antibody-8708) and for FN1 Ab(Anti-Fibronectin antibody, Alexa Fluor® 647, ab198934, http://www.abcam.com/fibronectin-antibody-f1-alexa-fluor-647-ab198934.html). For the isotype controls we used: Isotype control Ki67: Brilliant Violet 605™ Mouse IgG1, κ Isotype Ctrl Antibody, Biolegend (https://www.biolegend.com/ja-jp/products/brilliant-violet-605-mouse-igg1--kappa-isotype-ctrl-7630) and Isotype control FN1: Rabbit IgG, monoclonal [EPR25A] - Isotype Control, Alexa Fluor® 647, ab199093 http://www.abcam.com/rabbit-igg-monoclonal-epr25a-isotype-control-alexa-fluor-647-ab199093.html). For staining buffer PBS + 2% FBS, while for the permeabilization and fixation we used eBioscience™ Foxp3 / Transcription Factor Staining Buffer Set (Catalog number: 00–5523-00). Cells were trypsinized and and transferred in a V-Bottom 96 well plate. Washed one time with PBS and with staining buffer. Then, 100 ul of Fixation Reagent (first reagent of the kit) in each well were added and incubate for 30 min at RT. Then, cells were spun down at 800g for 5 min and 50 ul of the Permeabilization reagent with Abs (Ki67 and FN1 1:100) was added in each well for 30 min at RT. Then, cells were spun down 800 g for 5 min and wash one time with Staining Buffer and resuspended in staining buffer. Data analyses were performed with Cytobank (https://cytobank.org/). After selecting for singlets, we noticed in all PDAC lines there are two different populations with distinct intensity levels of ki67: a large population composed of ~93% of cells and a smaller population with higher intensity levels for ki67 (~7%). We confirmed that in both populations we had a statistical significant increase in DP cells upon CAF-CM exposure. We then decided to focus on the main population (90% of cells), not considering in the percentage count cells belongings to this small population to avoid any bias in identifying the effect of CAF-CM across all PDAC lines. Contour density plot for each quadrant were generated. Data were acquired using LSRII flow cytometer (BD Biosciences).
Proliferation Assay
(Figure 2C and Figure S2C) A total of 2000 PDAC-2, PDAC-3, PDAC-5, PDAC-6, PDAC-8 and PDAC-9 GFP+/Luciferase+ (GFP+/LUC+) tagged cells were seeded in each well of a 96-well plate alone (control) or with different PDACs:CAFs proportions: 50%:50% (2000:2000), 30%:70% (2000:4600) and 10%:90% (2000:18000) using three different CAF lines (CAF-1, CAF-2, and CAF-3). To measure the amount on cancer cells in each well, we removed the media in each well after 72 hours from initial seeding, and we added 50 μl of new cell culture media and 50 μl of Bright Glo™ (Promega) at room temperature. Percentages of tumor growth respect to day 1 or total photon flux for each well were calculated and plotted. Interaction factor of the Two-way ANOVA was used to determine the statistical significance of differential proliferation or unpaired t-test was performed to establish the proliferation advantage in a specific time point.
(Figure S5A) A total of 1000 PDAC-2 and PDAC-3 GFP+/Luciferase+ (GFP+/LUC+) tagged cells were seeded in each well of a 96-well plate in DMEM with 2% FBS or supplemented with 30% no-Serum CAF-CM. To obtain no-Serum CAF-CM, we add to a confluent plate of CAFs DMEM without any fetal bovine serum for 72 hours, which we then filtered with 0.2 micron filters to ensure no CAFs cells could be transferred to PDAC culture. To measure the amount on cancer cells in each well we removed the media in each well and we added 50 μl of new cell culture media and 50 μl of Bright Glo™ (Promega) at room temperature. Percentage of tumor growth respect to day 1 were calculated and plotted. Interaction factor of the Two-way ANOVA was used to determine the statistical significance of differential proliferation or unpaired t-test was performed to establish the proliferation advantage in a specific time point (Figures 5D and S5C) A total of 1000 PDAC-2 and PDAC-3, and 4000 PDAC-9 GFP+/Luciferase+ (GFP+/LUC+) tagged cells were seeded in each well of a 96-well plate in DMEM with 2% FBS + 30% + CAF-CM with escalating doses (0.2, 0.6, 2.5, 10 ug/ml) of an anti-TGFB neutralizing AB or an isotype AB control (R&D system, Monoclonal Mouse IgG1 Clone # 1D11, Catalog Number: MAB1835, https://www.rndsystems.com/products/tgf-beta1-2-3-antibody-1d11_mab1835 and Mouse IgG1 Isotype Control, Monoclonal Mouse IgG1 κ Clone # 11711, Catalog Number: MAB002, https://www.rndsystems.com/products/mouse-igg-1-isotype-control_mab002). Cells were read at 3 days for PDAC-2 and PDAC-3 and 7 days for PDAC-9. To measure the amount on cancer cells in each well we removed the media in each well and we added 50 μl of new cell culture media and 50 μl of Bright Glo™ (Promega) at room temperature. Percentage of tumor growth respect to day 1 were calculated and plotted. Unpaired t-test was performed to establish the proliferation advantage in a specific time point.
(Figure 5E) A total of 1000 PDAC-2 and PDAC-3, 3000 PDAC-6, and 4000 PDAC-8 and PDAC-9 GFP+/Luciferase+ (GFP+/LUC+) tagged cells were seeded in each well of a 96-well plate in DMEM with 2% FBS plus escalating doses (0.1, 0.2, 0.5, 2.5, 5.0 ng/ml) of Recombinant Human TGF-beta 1 Protein (R&D system, Catalog Number: 240-B, https://www.rndsystems.com/products/recombinant-human-tgf-beta-1-protein_240-b#product_datasheets). PDAC-2 and PDAC-3 were read at day 4, while PDAC-6, PDAC-8 and PDAC-9 at day 6. To measure the amount on cancer cells in each well we removed the media in each well and we added 50 μl of new cell culture media and 50 μl of Bright Glo™ (Promega) at room temperature. Percentage of tumor growth respect to day 1 were calculated and plotted. Unpaired t-test was performed to establish the proliferation advantage in a specific time point.
Invasion Assay
(Figure S2C) A total of 50,000 PDAC-3 cells were seeded in each matrigel-coated Boyden chamber (Corning® BioCoat™ Matrigel® Invasion Chambers, Corning®). Each Boyden chamber was placed in an individual well of a 24-well plate with 200,000 CAF-1 cells plated at the bottom of each 24-well. After 48 hours, Boyden chambers were removed and washed with PBS. Non-invading PDAC-3 cells were removed with cotton swabs before fixing for 10 min with 4% PFA. After fixation, each transwell was washed 3 times with PBS for 5 min and nuclear 4,6-diamidino-2-phenylindole (DAPI) was used to stain cell nuclei (1:1000) for 30 minutes. After washing 3 times with PBS for 5 min, each membrane was cut out and mounted with 65uL of mounting media. For each membrane, five distinct fluorescent images at 4X power field in different but representative areas of the membrane were taken with a Nikon fluorescent microscope (Nikon 90i). Surface area (area percentage) occupied by invading cells was quantified with Fiji software(Schindelin et al., 2012) (Image J software, version 2.0.0-rc-43/1.51d) and the average of those 5 images per technical replicate was used to calculate statistical differences between cells exposed to CAF conditioned media compared to regular media (unpaired t-test). To establish the number of technical replicates (samples size), we used a power calculation approach assuming we wanted to detect a minimum difference between groups of 2 folds in invasion ability after 48 hours of conditioned media (CM) treatment. Having a coefficient of variation less than 35%, we decided to have a minimum of 3 technical replicates per condition, which allowed us to detect 2 fold differences with a power of 90% (α error = 0.05).
(Figures 3F and S3C) 200,000 CAF cells in each well of a 24-well plate were seed. After 12 hours, 50,000 PDAC-2 and PDAC-3 cells and 125,000 PDAC-9 cells were seeded at the top of a matrigel-coated Boyden chamber (Corning® BioCoat™ Matrigel® Invasion Chambers, Corning®) and 5 nM of Trametinib (MEKi) and 3.5 uM of pyrimethamine were added to the treatment groups as single agent or in combination. In the control group was the highest amount of the vehicle control (DMSO). After 48 hours, the media and any remaining cells that have not migrated through the membrane were removed from the top of the transwell using a cotton-tipped applicator. The transwell inserts were fixed in PFA 4% for 10 min, washed with PBS and stained with 0.005% crystal violet in PBS for 10 min, followed by another wash step with PBS. A cotton-tipped applicator was used to remove the excess crystal violet. The membranes of the transwell inserts were allowed to dry overnight and imaged the next day. We captured images of the entire Boyden-Chamber area (bottom down) with an Olympus MVX10 dissection microscope in bright field. Using Visiopharm image analysis software, we created a dedicated algorithm to quantify the mean intensity of the crystal violet area within the Boyden-Chamber. The mean intensity was defined by the red channel in RGB color space.
Orthotopic Mouse Xenografts
(Figures 2D-2F and S2E) All animal experiments were approved by the IACUC of Massachusetts General Hospital. NOD/SCID/gamma-c (NSG; NOD.Cg-Prkdcscid Il2rgtm1Wjl/Sz, from Jackson Laboratories) mice were used for the orthotopic xenograft model. All13 mice were female and 4-6 week old. Mice were kept anesthetized during all surgical procedures (2.5% isoflurane gas). A 1.5 cm abdominal incision was made, and the pancreas was pulled out from the abdominal cavity. Matrigel (50uL) and DMEM (1:1) containing 100,000 PDAC-3 GFP-Luciferase tagged cancer cells alone or with 900,000 CAF-1 cells (PDAC-3%:CAF-1%, 10:90 condition) or with 233,333 CAF-1 cells (PDAC-3%:CAF-1%, 30:70 condition) were injected into the pancreas (Figures 2D-2F). Matrigel (50uL) and DMEM (1:1) containing 100,000 PDAC-8 GFP-Luciferase tagged cancer cells alone or with 900,000 CAF-1 cells (PDAC-3%:CAF-1%, 10:90 condition) were injected into the pancreas (Figures S2E). After injection, the peritoneum was closed using absorbable sutures (4-0 DemeGUT™), and the skin was sealed using silk (4-0 LOOK 780B). Tumors were monitored weekly using in vivo luciferase imaging on the IVIS Lumina platform (Perkin Elmer/Caliper). Tumor growth was estimated by measuring bioluminescent signal (photon flux) from the abdominal region of interest 5 minutes after intraperitoneal injection of 150 μl of luciferin. Four weeks after injections, mice were euthanized accordingly to the approved mouse protocol. IVIS imaging of primary tumors, livers and lungs from animal just sacrificed were taken immediately after sacrificing the animals. Normalized metastatic tumor burden (metastatic index) was calculated by dividing the total amount of photon flux from liver and lungs of each animal by the photon flux of its primary tumor. Mice were randomly chosen to be injected with or without CAFs and all mice that develop tumors were included in the study. Mice that died for early surgical complication (<24 hours from injection) were excluded from the study. Investigators were not blinded throughout the experiment. To establish the number of mice per each experiment (samples size), we used a power calculation approach assuming we wanted to detect a minimum difference between groups of 2 folds in tumor growth 4 week from initial injection. Assuming a coefficient of variation less than 45%, we decided to have a minimum of 4 mice per arm, which allowed us to detect 2 fold differences with a power of 80% (α error = 0.05).
Phosphoproteomics
(Fig. 3B and Table S2) 3*106 PDAC-3 cells were seeded in 15cm plates with 20 ml of DMEM medium. Ten plates for each time point were prepared and after 24 hours 10ml of DMEM (control sample) or CAF-1 conditioned medium were added in each plate. Cells were harvested using Trypsin. One extra step of washing cells with PBS was performed to remove all the FBS proteins and cell pellet was stored at −80°C. Cells from the time-course experiment were lysed, protein reduced with DTT and alkylated with iodoacetamide, precipitated following the MeOH/CHCl3 protocol, and digested with LysC and trypsin as previously described (Edwards and Haas, 2015). For each sample 2 mg of peptides were subjected to phosphopeptide enrichment on TiO2 beads (GL Sciences, Japan). The peptides were incubated for 1 hour with 8 mg of beads in 2 M lactic acid/50 % ACN. The beads were washed 3 times with 50 % ACN/0.1 % TFA. Phosphopeptides were eluted with 2 × 200 μL of 50 mM KH2PO4, pH 10, and the eluate acidified with 1 % TFA. Phosphopeptides were labeled with TMT10plex reagents (Thermo Fisher Scientific), pooled, and subjected to phosphotyrosine peptide enrichment using phosphotyrosine antibody-conjugated beads (Cell Signaling Technology, Danvers, MA). The flow-through containing peptides with serine and threonine phosphorylation were fractionated into 24 fractions using basic-pH reversed phase chromatography essentially as described previously (Edwards and Haas, 2015). The 25 samples were dried, re-suspended in 5 % ACN/5 % formic acid, and analyzed in 3-hour runs via LC-M2/MS3 on an Orbitrap Fusion mass spectrometer using the Simultaneous Precursor Selection (SPS) supported MS3 method (McAlister et al., 2014; Ting et al., 2011) essentially as described previously (Erickson et al., 2015). MS2 spectra were assigned using a SEQUEST-based in-house built proteomics analysis platform (Huttlin et al., 2010) allowing phosphorylation of serine, threonine, and tyrosine residues as a variable modification. The Ascore algorithm was used to evaluate the correct assignment of phosphorylation within the peptide sequence (Beausoleil et al., 2006). Based on the target-decoy database search strategy (Elias and Gygi, 2007) and employing linear discriminant analysis and posterior error histogram sorting, peptide and protein assignments were filtered to false discovery rate (FDR) of < 1 % (Huttlin et al., 2010). Peptides with sequences that were contained in more than one protein sequence from the UniProt database were assigned to the protein with most matching peptides (Huttlin et al., 2010). TMT reporter ion intensities were extracted as that of the most intense ion within a 0.03 Th window around the predicted reporter ion intensities in the collected MS3 spectra. Only MS3 with an average signal-to-noise value of larger than 40 per reporter ion as well as with an isolation specificity (Ting et al., 2011) of larger than 0.75 were considered for quantification. A two-step normalization of the protein TMT-intensities was performed by first normalizing the protein intensities over all acquired TMT channels for each protein based on the median average protein intensity calculated for all proteins. To correct for slight mixing errors of the peptide mixture from each sample a median of the normalized intensities was calculated from all protein intensities in each TMT channel and the protein intensities were normalized to the median value of these median intensities.
Western blot Assays
(Figure 3D)1*105 PDAC-3 cells accordingly to their proliferation rate (to arrive at a similar final confluency) were seeded in 10 cm dishes with 10 ml of DMEM media. After 24 hours of incubation, 5 ml of CAF-1 conditioned media (CM) or regular DMEM were added to treated cells or control samples, respectively. After 24 or 72 hours after CM exposure all supernatant was removed and plates were washed twice with PBS and stored at −80°C. For western blotting of cellular lysates, cells were resuspended in lysis buffer (20 mmol/L Tris, 150 mmol/L NaCl, 1% Nonidet P-40, 0.1 mmol/L EDTA, and protease and phosphatase inhibitors), incubated on ice for 10 minutes, and centrifuged at 14,000 rpm for 10 minutes. Protein concentration was determined by BCA Protein Assay (Pierce). Proteins were resolved using the NuPAGE Novex Midi Gel system on 4% to 12% Bis–Tris gels (Invitrogen), transferred to nytrocellulose membranes, and probed with the antibodies listed below. Representative blots are shown from several experiments. Chemiluminescence was detected with the Syngene G:Box camera (Synoptics). All measurements were performed in the linear range without saturation and were normalized to Vinculin (Abcam, ab129002, rabbit mAb) loading control. All the other antibodies used are from Cell Signaling Technologies: Phospho-p44/42 MAPK (Erk1/2) (Thr202/Tyr204) Antibody #9101; p44/42 MAPK (Erk1/2) (137F5) Rabbit mAb #4695 and Phospho-Stat3 (Tyr705) (D3A7) XP® Rabbit mAb #9145; Stat3 (79D7) Rabbit mAb #4904. Band densitometric analyses were perfomed with Genetools software from Syngene.
Drug Screening
(Figures 3E and S3B) A total of 2000 PDAC-2, PDAC-3, PDAC-5, PDAC-6, PDAC-8 and PDAC-9 GFP+/Luciferase+ (GFP+/LUC+) tagged cells were seeded in each well of a 96-well plate alone (control) or with different PDACs:CAF-1 proportions: 50%:50% (2000:2000), 30%:70% (2000:4600) and 10%:90% (2000:18000), and treated with different concentrations of trametinib (selleckchem) and Pyrimethamine (selleckchem) or SH-4-54 (selleckchem) for 72 hours. After 72 hours of drug exposure, supernatant was removed and 50 μl of DMEM and 50 μl of Bright GLO (Luciferase Assay System - Promega) were added. After 5 min of incubation each 96-well plate was read in a bioluminescence plate reader (EnVision Multilabel Reader, PerkinElmer, Product Number=2104-0010A). Heatmap were generated using Prism version 7.
(Figure S3B) For the conditioned media (CM) drug screening experiment 1 *103 PDAC cells were seeded with or without 30% of CAF-1 CM and after 24 hours cells were treated with different concentrations of Pyrimethamine, SH-4-54 (selleckchem) and BP-1-102 (selleckchem) or with control Vehicle (DMSO). To measure the amount on cancer cells in each well, we removed the media in each well after 72 hours from initial seeding, and we added 50 μl of new cell culture media and 50 μl of Bright Glo™ (Promega) at room temperature. Relative cell viability compared to control samples for each drug was determined and dose-respond curves generated with Prism software version 7. Data points represent means ± SD of three independent experiments.
RNA-ISH Flow Assay
(Figure 3G) 100,000 PDAC-3 GFP+/Luciferase+ (GFP+/LUC+) tagged cells were seeded in each well of a 6 well plate and supplemented with CAF-CM 30%. After 12 hours, 2 nM of MEKi (trametinib) and 2uM of STAT3i (SH-4-54) were added as single agents or in combination. After, 48 hours of exposure cells were harvested and a flow ISH protocol was performed as indicated below. In this study, Flow ISH was performed using Prime Flow RNA Assay Kit by Thermo Fisher Scientific (Catalogue No. 88-18005). This assay uses highly specific, branched DNA technology with the single cell resolution of flow cytometry. Cells were washed and aliquoted in in 2%FBS+PBS and added to a 96 well plate. These cells were then treated with RNA Fixation Buffers and Permeabilization Buffer. The following hybridization step was performed using FN1-Type1 and KI67-Type6 probes at 40°C for about 2 hours, to allow the target-specific probes to hybridize to target mRNA. This was proceeded by a series of signal amplification steps; PreAmplifiers (PreAmps) were added to bind to the target-specific probe, and Amplifiers (Amps) were subsequently added to bind to the PreAmps. Next, label probe oligonucleotides conjugated to a florescent dye were added which hybridize to their corresponding Amplifier molecule thus completing the branched DNA tree and providing signal amplification of up to 8,000-16,000 fold per target. The cells were further analyzed on a flow cytometer. Cells were acquired using LSRFortessa-X20 flow cytometer (BD Biosciences) and after selecting for the singlets, we identified the DP population for KI67 and FN1 and we determined the changing in the amount of this population due to drug treatments by counting the number of cells per minute using FlowJo software version 9.9.5.
Multiplex Flow Cytometry
(Figure 4B and S4A) PDAC Cell Lines: 50,000 PDAC-2 and PDAC-3, 100,000 PDAC-5 and 150,000 PDAC- PDAC-9 cells were seeded in 6-well plate in DMEM with 2% FBS and with or without 30% CAF conditioned media (CAF-CM). After 3 days cells were harvested and stained for Ki67 Ab (Brilliant Violet 605™ anti-human Ki-67 Antibody, Biolegend, https://www.biolegend.com/ja-jp/products/brilliant-violet-605-anti-human-ki-67-antibody-8708) and for FN1 Ab(Anti-Fibronectin antibody, Alexa Fluor® 647, ab198934, Abcam http://www.abcam.com/fibronectin-antibody-f1-alexa-fluor-647-ab198934.html), for p-ERK (PE anti-ERK1/2 Phospho (Thr202/Tyr204) Antibody, Biolegend, catalog #: 369505, https://www.biolegend.com/en-us/products/pe-anti-erk1-2-phospho-thr202-tyr204-antibody-13590) and p-STAT3 (Brilliant Violet 421 ™ anti-STAT3 Phospho (Tyr705) Antibody, Biolegend, https://www.biolegend.com/en-us/products/brilliant-violet-421-anti-stat3-phospho-tyr705-antibody-13030). To assess if the phosphor signal was specific we used Lambda Protein Phosphatase (Lambda PP, Catalog #: P0753S, New England BioLabs, https://www.neb.com/products/p0753-lambda-protein-phosphatase-lambda-pp#Product%20Information). For the isotype controls we used: Isotype control Ki67: Brilliant Violet 605™ Mouse IgG1, κ Isotype Ctrl Antibody, Biolegend (https://www.biolegend.com/ja-jp/products/brilliant-violet-605-mouse-igg1--kappa-isotype-ctrl-7630) and Isotype control FN1: Rabbit IgG, monoclonal [EPR25A] - Isotype Control, Alexa Fluor® 647, ab199093 http://www.abcam.com/rabbit-igg-monoclonal-epr25a-isotype-control-alexa-fluor-647-ab199093.html).
Cells were harvested and transfer to fixation tubes, spin them down, and fix in 4% PFA for 10min at RT. After fixation, we brought volume up to 3 ml and Staining buffer (PBS + 2% FBS) and spin cells at 800Xg for 4min. Cell were washed once and methanol permeabilization was performed by adding 1ml ice-cold methanol drop-wise while vortexing. We incubated cells on ice for 20 min and washed twice with staining buffer spinning down at 1000xg, 4min. We divided each sample into two and add the lamba phosphatase and incubated at 30C for 30 minutes the samples that have the phosphatase, while the others were kept on ice. We washed twice all the samples and transfer to 96w V-bottom plate. Permeabilization reagent with Abs (1:200 Ki67, and 1:100 FN1, while 5ul for p-ERk and p-STAT3 were added to each well with a total volume of 100ul/well) were added in each well for 30 min at RT. Then, cells were spun down 800 g for 5 min and wash one time with Staining Buffer and resuspended in staining buffer and read at the cells were acquired using LSRII flow cytometer (BD Biosciences) and data analyses were performed with Cytobank (https://cytobank.org/). After selecting for singlets, we gaited the top upper right population for Ki67 and FN1 (Top= ~1.5%, Range: 1.1%-1.8%) and the checked their levels of p-ERK and P-STAT3. Contour density plot for each quadrant were generated.
(Figure 4E and 4F) PDAC Patient Samples (primary tumors and liver metastasis): Surgically resected tumors were cryopreserved in DMEM:F12 media containing 30% FBS and 10% DMSO. Vials containing tumor pieces were emptied onto 10 cm plates, freezing medium was aspirated off, and tumor pieces were washed in PBS. Tumor pieces were added to a collagenase solution (10ml HBSS + 16mg Collagenase Type 1) in a 50 ml tube and incubated at 37C for 2 hours, and pipetted frequently throughout incubation to aide in tumor dissociation. After incubation, 10 ml of media (DMEM F-12 + 10%FBS + 1% Anti-Anti) was added to the collagenase + tumor solution, pipetted up and down and filtered through a 100 micron nylon mesh filter into a new 50 ml tube. Flow-through was centrifuged for 5 min at 1,200 RPM, supernatant aspirated, resuspended in 50 ml media and centrifuged for 5 min at 1,000 RPM. Supernatant aspirated and cells resuspended in 5 ml media. Materials: DMEM and Ham’s F-12, 50/50 mix (Fisher Scientific MT-10-092-CV), US Certified FBS (Life Technology/Gibco 16000044), HBSS (Mediatech 21-020-CV) Collagenase Type I (Sigma C0130), DPBS (Mediatech 21-031-CV), 100 micron nylon mesh (Fisher Scientific 22363549). Cell were then stained with Ki67 Ab (Brilliant Violet 605™ anti-human Ki-67 Antibody, Biolegend, https://www.biolegend.com/ja-jp/products/brilliant-violet-605-anti-human-ki-67-antibody-8708), FN1 Ab (Anti-Fibronectin antibody, Alexa Fluor® 647, ab198934, Abcam http://www.abcam.com/fibronectin-antibody-f1-alexa-fluor-647-ab198934.html), p-ERK (PE anti-ERK1/2 Phospho (Thr202/Tyr204) Antibody, Biolegend, catalog #: 369505, https://www.biolegend.com/en-us/products/pe-anti-erk1-2-phospho-thr202-tyr204-antibody-13590) and p-STAT3 (Brilliant Violet 421 ™ anti-STAT3 Phospho (Tyr705) Antibody, Biolegend, https://www.biolegend.com/en-us/products/brilliant-violet-421-anti-stat3-phospho-tyr705-antibody-13030). To identify live tumor cells in human tumor explants we used live/dead staining Zombie Red (Biolegend cat. 423109, https://www.biolegend.com/en-us/products/zombie-red-fixable-viability-kit-9338) as well as Abs recognizing cytokeratin (CK)-7 (EPR1619Y, Alexa Fluor® 488 conjugated, Abcam ab185048 https://www.abcam.com/cytokeratin-7-antibody-epr1619y-cytoskeleton-marker-alexa-fluor-488-ab185048.html) and CK-19 (A53-B/A2, FITC conjugated, Abcam ab178543 https://www.abcam.com/cytokeratin-19-antibody-a53-ba2-fitc-ab178543.html). Isotype controls were as follows: for Ki67: Brilliant Violet 605™ Mouse IgG1, κ Isotype Ctrl Antibody, Biolegend (https://www.biolegend.com/ja-jp/products/brilliant-violet-605-mouse-igg1--kappa-isotype-ctrl-7630); for FN1: Rabbit IgG, monoclonal [EPR25A] - Isotype Control, Alexa Fluor® 647, ab199093 http://www.abcam.com/rabbit-igg-monoclonal-epr25a-isotype-control-alexa-fluor-647-ab199093.html), for CK-7: monoclonal Rabbit IgG clone EPR25A, Alexa Fluor® 488 conjugated (Abcam ab199091, https://www.abcam.com/rabbit-igg-monoclonal-epr25a-isotype-control-alexa-fluor-488-ab199091.html), for CK-19: Mouse IgG2a clone X5563, FITC conjugated (Abcam ab91362, https://www.abcam.com/mouse-igg2a-x5563-fitc-isotype-control-ab91362.html). To assess specificity of phospho signal, an aliquot of each sample was incubated with Lambda Protein Phosphatase (Lambda PP, Catalog #: P0753S, New England BioLabs, https://www.neb.com/products/p0753-lambda-protein-phosphatase-lambda-pp#Product%20Information).Cells were harvested, and dead cells were labeled on ice for 15 min using Zombie Red (Biolegend) diluted 1:400 in PBS. Cells were subsequently spun down, and fixed in 1ml 4% PFA for 10min at RT. After fixation, we brought volume up to 3 ml using staining buffer (PBS + 2% FBS) and spun cells at 800Xg for 4min. Cell were washed once more with staining buffer, and methanol permeabilization was performed by adding 1ml ice-cold methanol drop-wise while vortexing. We incubated cells on ice for 20 min and washed twice with staining buffer spinning down at 1000xg, 4min. We divided each sample in two, and incubated one with lamba phosphatase at 30 C for 30 minutes, while the other was kept on ice. We washed twice all the samples and transferred them to a 96w V-bottom plate. Each sample was stained with 100μl of staining buffer containing the following Abs: Ki67 25ng, FN1 0.5μg, p-STAT3 0.25μg, p-ERK 0.25μg, CK-7 1μg CK-19 μg. Isotype controls were used at matching concentrations. Staining was carried out at RT for 30 min. Then, cells were spun down 800 g for 5 min, washed once in staining buffer and acquired using a LSRII flow cytometer (BD Biosciences). Data analysis were performed with Cytobank (https://cytobank.org/) or FlowJo (https://www.flowjo.com). After gating on singlets and, for tumor samples, on live CKhi tumor cells, we selected the top ~1.5% (Range: 1.1%-1.8%) of Ki67+ / FN1+ cells and measured their levels of p-ERK and p-STAT3.
Mass cytometry
(Figures 4D, 4E, S4B, S4C, and S4D; Table S3 and S4) PDAC-3 cell line Experiment (Sample Preparation of the time course in vitro experiment, PDAC-3 + CAF-CM) 105 PDAC-3 cells were seeded in 10 cm dishes with 10 ml of DMEM media. After 24 hours of incubation, 5 ml of CAF-1 conditioned media (CM) or regular DMEM were added to treat cells or to establish control plates, respectively. After 24 or 72 hours after CM exposure all supernatant was removed and the plates were washed with cold PBS (4°C), trypsinized for 5 min. 5 ml of cold (4°C) DMEM media was added and cells were spun down at 4°C for 3 min at 1500 RPM (RCF=524), washed once with cold PBS and spun down again. Finally, supernatant was removed and cells were immediately fixed with 4% PFA for 5 minutes and washed two times with permeabilization buffer (Fluidigm Sciences). Barcoding reagents (Fluidigm Sciences) were immediately added to samples after diluting in permeabilization buffer (5μl to 500 μl). Barcoded samples were washed with PBS twice, mixed together, methanol permeabilized in 90% MeOH, and stored in - 80°C. Before analysis, samples were washed in 0.5% BSA in PBS twice and incubated with the antibody cocktail for one hour in room temperature while rocking for 1 hour. Samples were then incubated overnight with iridium labeled DNA intercalator with 0.2% PFA in PBS for labeling DNA. Following a wash with 0.5% BSA in PBS, cells are fixed using 4% PFA, washed with pure water and filtered. Internal control beads (Fluidigm Sciences) were added for normalizing any changes to signal response of the instrument. The samples were analyzed using CyTOF 2 housed at the Ragon Institute Facility.
(Figures 4G-4I, S4E, and S4F; Table S4 and S5) PDAC Patient Experiment (tumor sample digestion and preparation) PDAC tumor samples were collected in the frozen section room after the diagnosis of PDAC was confirmed. A piece of tumor of ~1cm3 was collected and put in cold PBS and kept on ice for about 30 min before tumor processing. In a tissue culture hood, we grounded the tumor with sterile blades, and we put the grounded tumor in a 15 ml falcon tubes with 9 ml of 1U/ml of Dispase solution (Stemcell, Catalog #07923) and 1 ml of a 10X Collagenase/Hyaluronidase solution (Stemcell, Catalog #07912). We put the falcon tube in the incubator for 1 hour, manually mixing the solution every 10 minutes. After an hour, cells were spun down at 4°C for 3 min at 1500 RPM (RCF=524), washed once with cold PBS and spun down again. Finally, supernatant was removed and cells were immediately fixed with 4% PFA for 5 minutes. Sample was washed with PBS, methanol permeabilized in 90% MeOH, and stored in −80°C. Before analysis, samples were washed in 0.5% BSA in PBS twice and incubated for one hour in room temperature while rocking for 1 hour with the antibody cocktail. Samples were then incubated overnight with iridium labeled DNA intercalator with 0.2% PFA in PBS for labeling DNA. Following a wash with 0.5% BSA in PBS, cells are fixed using 4% PFA, washed with pure water and filtered. Internal control beads (Fluidigm Sciences) were added for normalizing any changes to signal response of the instrument. The samples were analyzed using Helios housed at the MGH flow core facility at 149 MGH Research Building, Charlestown.
(Figures 4C and 4F) Antibody List: A panel of 20 markers, which include well characterized transcription factors and tyrosine kinase involved in several signaling pathways, were selected (see table below for specifications). For PDAC-3 cell lines experiment GFP Ab and CK5, 8, 18 were included in the cocktail, while for the patient sample they were removed and alpha smooth muscle actin (SMA) and CD45 were included to identify CAFs and white blood cells along with CK7, 18, 19 to positively select cancer cells. We manually conjugated the Ab with the metal. These are the Abs that we used in this paper (Mass of the metal, Metal, Epitope, Clone, Concentration, Unit, Vendor): 141, Pr, EpCAM, EBA-1, 5, ug/ml, BD ; 142, Nd, Casp3 (cleaved), D3E9, 0.5, %, Fluidigm; 148, Nd, HER2, 29D8, 25, ug/ml, Cell Signaling; 149, Sm, p4EBP1 (T37/46), 236B4, 0.25, %, Fluidigm; 150, Nd, pStat5 (Y694), 47, 1, %, Fluidigm; 151, Eu, c-Met, D1C2, 25, ug/ml, Cell Signaling; 152, Sm, pAkt (S473), D9E, 1, %, Fluidigm; 153, Eu, Fibronectin, HFN7.1, 25, ug/ml, Abcam; 154, Sm, pAkt (T308), D25E6, 25, ug/ml, Cell Signaling; 156, Gd, p-p38, D3F9, 0.5, ul, Fluidigm; 158, Gd, pStat3 (Y705), Y705, 1, %, Fluidigm; 159, Tb, c-Myc, D3N8F, 25, ug/ml, Cell Signaling; 163, Dy, SMA, E184, 20, ug/ml, Abcam; 164, Dy, p90rsk (S380), D5D8, 25, ug/ml, Cell Signaling; 165, Ho, pGSK3-B (S9), D85E12, 5, ug/ml, Cell Signaling; 166, Er, pNf-Kb, S529, 1, %, Fluidigm; 168, Er, Ki-67, B56, 0.5, %, Fluidigm; 169, Tm, GFP, 5F12.4, 0.5, %, Fluidigm; 170, Er, IGF1R-B, D23H3, 25, ug/ml, Cell Signaling; 171, Yb, pErk (T202/Y204), D13.14.4E, 50, ug/ml, Cell Signaling; 173, Yb, Vimentin, D21H3, 2.5, ug/ml, Cell Signaling; 176, Yb, CK 7,18, 19, RCK102, C04, 0.5, ug/ml, Abcam; 175, Lu, CK 5, 8, 18, RCK102+C-04, 1.25, ug/ml, Abcam.
Mass Spectrometry
(Figures 5B and 5C; Table S6) Cell Culture: CAF and PDAC Conditioned Media: CAF and PDACs (PDAC-2, −3 −6 and −8) were put at maximum confluency in 10% DMEM, then washed 5 times with PBS and DMEM without any FBS was added. After 48-72 hours supernatant for each line was collected and immediately put in −80C. Two replicates per lines were collected. Mass Spectrometry: Secretome Proteomics: 5 ml of media were concentrated under vacuum to a final volume of 500 μL. Proteins were reduced, alkylated, precipated (MeOH/CHCl3), digested with LysC followed by trypsin, and labeled with TMT10-plex reagents as described previously(Lapek et al., 2017). The pooled peptides were dried and resuspended in 5% ACN/5% formic acid, and analyzed in 3-hour runs via LC-M2/MS3 on an Orbitrap Fusion mass spectrometer using the Simultaneous Precursor Selection (SPS) supported MS3 method (McAlister et al., 2014; Ting et al., 2011) essentially as described previously (Erickson et al., 2015). MS2 spectra were assigned using a SEQUEST-based in-house built proteomics analysis platform.
Tissue Microarray Construction
(Figure 6A and 6C) A tissue-micro array (TMA) of primary PDACs from patients who were resected at Massachusetts General Hospital was generated in accordance with IRB protocol 2013P001854. For each tumor, 1-3 cores were obtained. All clinical annotated information from January 1997 through January 2016 was compiled in a database, and the overall survival for PDAC patients was calculated.
RNA-ISH Staining
(Figure 6A and 6D) In this study, ISH was performed using View RNA Tissue ISH (2-plex) technology using the manual platform (Catalogue No. QVT0012, ThermoFisher). The View-RNA ISH assay uses highly specific, branched DNA technology in which signal amplification is implemented to detect any two target mRNAs within the FFPE tissue section via a series of sequential hybridization steps.
FFPE tissue sections (human TMA, xenografts and cell blocks) were deparaffinized and pretreated to allow unmasking and RNA probe accessibility. This was done by first baking the slides at 60°C for 1 hour followed by treatment with Histoclear and 100% Ethanol. The samples were then exposed to 1X Pretreatment Solution and Protease enzyme to allow probe accessibility (Table below). The following hybridization step was performed at 40°C for about 2-3 hours, to allow the target-specific probes to hybridize to target mRNA. This was proceeded by a series of signal amplification steps; PreAmplifiers (PreAmps) were added to bind to the target-specific probe, and Amplifiers (Amps) were subsequently added to bind to the PreAmps. Next, type-specific label probes conjugated to alkaline phosphates were added to bind to the Amps, thus completing the branched DNA tree and providing signal amplification of up to 3,000-fold per target. The signal was visualized by sequential addition of Fast Blue substrate which binds to Type-6 label probe and Fast Red substrate which binds to Type-1 label probe producing blue and red precipitates (dots). For human samples we used SPARC (Type 1, 1:50), KRT (Type 6, 1:50), FN1 (Type 1, 1:50) and KI67 (Type 6, 1:50). We performed 10 mins at 90°-95°C for Pretreatment 1X Buffer and 10 mins at 40°C for Protease (1:100). For Mouse xenografts we used CDH1 (Type 1, 1:30), FN1 (Type 1 and 6, 1:10), EPCAM (Type 6, 1:10), PCNA (Type 1, 1:10), VIM (Type 6, 1:10), KI67 (Type 6, 1:10), and COL1A1 (Type 1, 1:20). We performed 7 mins at 90°-95°C for Pretreatment 1X Buffer and 7 mins at 40°C for Protease (1:100). The target mRNAs were then visualized using a standard brightfield microscope.
(Figures 6A, 6B, and S7A-S7C) Co-staining for PRO and EMT markers: we performed quantitative RNA-ISH of primary tumors and metastases obtained from the xenograft model using PRO (MKI67 or PCNA) and EMT (FN1 or COL1A1) markers. PRO: Ki67, PCNA and EMT: FN1, COL1A1. As before, bright field images were captured using a Leica Aperio CS-O slide scanning microscope at 40x magnification. Digital image analysis was performed using VIS (Visiopharm) software. An algorithm was created to enumerate the number cells of each type within a gland. Gland regions were manually selected for analysis. At least 10 glands were randomly chosen per slide. Following the same method as in the above section on PRO and EMT Phenotypes Quantification in Primary PDACs, cells were classified as: double positive (DP), blue positive only (BLUE), or red positive only (RED). The number of blue and red dots defined the thresholds for positivity. To account for staining variability, each threshold (BLUE or RED) was empirically determined for each RNA-ISH probe. For MKI67 (blue) and FN1 (red) RNA-ISH probes, the thresholds within a cell boundary were set to 2 blue dots and 1 red dot. For PCNA (blue) and COL1A1 (red), the thresholds within a cell boundary were set to 9 blue dots and 1 red dot. Larger dots were assumed to represent an aggregate of 2 or more smaller dots, therefore, were giving greater weight in the cell assignment.
(Figures S7B and S7C) Co-staining for Proliferation or EMT markers: to validate the performance of MKI67 and FN1 RNA-ISH markers for assessing PRO and EMT status, respectively, we stained primary tumor xenografts from the PDAC-3 cell line using well-established PRO (PCNA) and EMT (VIM) markers. Slides were stained with dual color RNA-ISH for either MKI67 and PCNA or FN1 and VIM. Using VIS (Visiopharm) digital image analysis software, the number of cells of each type within a gland were quantified. It was noted that the hematoxylin stain of this new set of slides was lighter than previous slide sets. Using the same features and algorithm described above, the Bayesian classifier was retrained on a region of an image from the new slide set. The training region was chosen to accurately capture the lighter hematoxylin stain as well as the blue positive and red positive areas. Following the same digital image analysis method as described above, cells were classified as RED, BLUE, or DP (double positive). Red positive cells were defined as a cell containing 1 or more red dots and 0 blue dots. Similarly, blue positive cells were defined as having 0 red dots and 1 or more blue dots. Double positive cells were defined as having 1 or more red dots and 1 or more blue dots. Larger dots were assumed to represent an aggregate of 2 or more smaller dots, therefore, were giving greater weight in the cell assignment.
Stroma-Tumor Ratio Quantification
(Figures 7C) to determine stroma-tumor ratio, we performed RNA in situ hybridization (RNA-ISH). Paraffin-embedded PDAC-TMA blocks were freshly cut and frozen at −80°C. Upon removal from the freezer, slides were baked for 1 hr at 60°C and fixed in 10% formaldehyde for 1 hr at room temperature (RT). Paraffin was removed using HistoClear and RNA-ISH was performed according to the Affymetrix ViewRNA ISH Tissue-2 Plex Assay. Tissue sections were permeabilized by pretreating in buffer solution for 10 min at 95°C and digested with protease for 10 min, before being fixed at RT in 5% formaldehyde. Target probe sets were applied and hybridized to the tissue by incubating for 2 hrs at 40°C. Type 1 SPARC probe (V A1-11122) was used at 1:50 to stain stroma cells, while Type 6 probes of KRT 7, 8, 18, 19 (VA6-11562, VA6-11560, VA6-11561, VA6-10947) pooled each at 1:200 were used to stain epithelial cancer cells. Signal was amplified through the sequential hybridization of PreAmplifier and Amplifer QT mixes to the target probe set. Target mRNA molecules were detected by applying Type 6 Label Probe with Fast Blue substrate and Type 1 Label Probe with Fast Red substrate. Tissue was counterstained with Gill’s Hematoxylin for 10 seconds at room temperature. DAPI (Invitrogen, D3571; 3.0 μg/ml) staining was performed for 1 min.
Staging
(Figures 7E) For each patient in our dataset (195), we reviewed the clinical chart to obtain the grade assigned (190 patients) after the operation and the information (T,N,M) to determine the staging (187 patients), which we included in the Table S7. To determine the stage, we applied the stage system currently in use in the clinics (AJCC Cancer Staging Manual, Eighth Edition, 2017). We then performed multivariate survival analyses including all gland types + single cell phenotypes (DP, EMT, PRO, and DN cells) or all gland types + clinical stage (stage II and III). We used R as a software to run the analysis and used the coxph {survival} as command.
QUANTIFICATION AND STATISTICAL ANALYSIS
Single cell RNA-Sequencing
(Figure 1A) The paired-end reads from the three sequencing runs were combined and aligned to the hg38 genome from http://genome.ucsc.edu using the STAR v2.4.0h aligner with default settings. Reads that did not map or mapped to multiple locations were discarded. Duplicate reads were marked using the MarkDuplicates tool in picard-tools-1.8.4 and were removed. The uniquely aligned reads were counted using htseq-count in the intersection-strict mode against the Homo_sapiens.GRCh38.79.gtf annotation table from http://www.ensembl.org. Genes with fewer than 10 reads in fewer than 5 samples were excluded from analysis, as were samples with fewer than 7000 genes with 5 or more reads. Read counts were normalized by applying a modified DESeq2 sample-specific scale factor. Briefly, a gene expression target vector was calculated as the mean of log transformed counts across all cells. Genes were classified into deciles ranging from highest to lowest average counts based on the target vector. We defined each cell’s detection limit as the lowest category where the median gene count was at least 1, and genes in lower categories where treated as censored. The scale factor was calculated as the median ratio of cell-specific counts to target counts, excluding genes below the detection limit. Differential expression analysis was done using a log-rank test on scale-normalized counts. Gene set enrichment analysis using Broad Institute MsigDB v5.0 gene sets was run using a Wilcoxon Rank Sum test with each gene’s differential expression p-value signed by the direction of its fold change as the ordering statistic. This was accomplished using the runGSA function from the piano package in R with the options geneSetStat=“wilcoxon”, signifMethod=“nullDist”, and gsSizeLim=c(5,300). The genes used for the Proliferation and EMT meta-signatures were chosen as the 15 genes from the HALLMARK_E2F_TARGETS and HALLMARK_EPITHELIAL_MESENCHYMAL _TRANSITION gene sets that had the most negative median correlation with genes of the other gene set. Meta-signature scores for each cell were calculated as the mean expression rank for the 15 genes that comprise the given meta-signature.
GSE113616 is the GEO number to have access to our single cell RNA-Seq data https://www.ncbi.nlm.nih.gov/geo/info/linking.html.
Clustering Epithelial and Mesenchymal Cell Lines
(Figure S2A) PDAC cell lines were classified as classical or quasi-mesenchymal based on a modified version of the Collison et al. PDAssigner genesets. The original genesets provided in the paper was compared to the NMF weight results provided as supplemental data of Collision et al 2011. We selected the subset of genes up-regulated in each subtype that were also supported by the NMF results. A total of 53 genes were used to classify cell lines into the three cancer subtypes (classical, quasi-mesenchymal, and exocrine-like). 22 genes were up-regulated in classical (AGR2, ATP10B, CAPN8, CEACAM5, CEACAM6, ELF3, ERBB3, FOXQ1, FXYD3, GPRC5A, GPX2, LGALS4, MUC13, PLS1, S100P, SDR16C5, ST6GALNAC1, TFF1, TFF3, TMEM45B, TOX3, TSPAN8). 11 genes were up-regulated in quasi-mesenchymal (AIM2, CAV1, FAM26F, GPM6B, KRT14, LOX, PAPPA, PHLDA1, S100A2, SLC2A3, TWIST1). 20 genes were up-regulated in exocrine-like (CEL, CELA2B, CELA3A, CELA3B, CFTR, CLPS, CPB1, CTRB2, GP2, PLA2G1B, PNLIP, PNLIPRP2, PRSS1, PRSS2, REG1A, REG1B, REG3A, SLC3A1, SLC4A4, SPINK1). Average signatures scores for each geneset was calculated for each PDAC cell line. Each cell line was classified as the cancer subtype with the highest score. The following genes were excluded from the analysis because they were not found to be expressed in any sample (CELA2B, CELA3A, CELA3B, CLPS, CPB1, CTRB2, GP2, PNLIP, PLA2G1B, REG1B, REG3A, AIM2, PRSS2). Expression values are measured as RPM (read per million). A floor of −20 and ceiling of +20 was applied to the median polished values of the heatmap to aid visualization of expression trends.
Identification of CAF subpopulations
(Figure S1F) Single-cell RNA-Sequencing of CAF cells, collected from each of the PDAC:CAF co-cultures (100% CAF, 10%PDAC+90%CAF, 30%PDAC+70%CAF and 50%PDAC+50%CAF), was obtained, and CAF-1 cells were classified as quiescent (PSCs), myofibroblast (myCAF) or inflammatory (iCAF) using a modified set of genes published by Ohlund et al 2017. Pair-wise differential expression analyses between each of the cell types was provided as supplementary information in the original publication. Leveraging these analyses, a unique set of genes for each cell type showing at least 4-fold higher expression and adjusted p-value < 0.05 relative to the other cell types were identified. A set of 14, 68 and 90 genes showing higher expression in myCAF, quiescent PSCs and iCAF cells, respectively, were identified. The expression data was gene-wise normalized by the median expression of the 100% CAF cells and log2 transformed. Signature scores were calculated by averaging the expression of the cell-type specific gene sets. Each CAF single-cell was defined as the cell-type with the maximum signature score. Relative abundances of each cell type were calculated for each co-culture.
Phosphoproteomics
(Figure 3A-3C) Phosphoprotein fold changes compared to control samples were obtained by dividing the median value intensity of each protein in early time points (5 min, 15min, 1 hour, 3 hours) with the median value intensity of the same protein in the 5-min control sample (DMEM). For 24-hour time point the same algorithm was applied, but we used 24-hour control sample to take into account cell confluency given the fast growing capacity of PDAC-3 cells. Z-score for each time point was calculated and only proteins with a z-score > 1.96 were considered upregulated comparted to control samples. Uploading all the upregulated proteins into the STING database (http://string-db.org/) we obtained a functional protein network with pathway (KEGG) and gene ontology (GO) enrichment analysis. Only pathways and GO terms with a false discovery rate < 0.05 were considered statistically significant. All enriched proteins were used to create a protein-protein interaction network using string database (high confident value → 0.7) and cytoscape software was used to represent this protein interaction network and to highlight the proteins enriched in each pathway/phenotype: cell cycle, EMT/invasion, MAPK and STAT3 pathways.
Mass Cytometry
(Figures 4D and 4E) PDAC-3 cell line: Data was normalized, concatenated and debarcoded using software from Nolan Lab (http://web.stanford.edu/group/nolan/resources.html). Data was uploaded to Cytobank where some of the illustrations were prepared. Intensities were normalized using arcsinh transform (arcsinh(x/5)). Tumor cells were identified by gating for Ir intercalator+, Ce140- (internal control bead signal), cytokeratin+ (supplementary data). Data was gated and analyzed online using Cytobank. By using a scatter plot in Ki67 versus FN1 for both 24 and 72 hours, we noticed a shift of the entire cell population from the lower left quadrant, double negative (DN) state, toward the upper right quadrant, double positive (DP) state. We then manually drew the Ki67/FN1 gate based on this shift compared to the control sample at 24 hours. This enabled analyzing the shifted population. We then replotted cancer cells from each quadrant accordingly to their p-ERK and p-STAT3 status. A new gate was manually drawn to quantify and compared among different cell types (DP, EMT, PRO and DN) the proportion of cells that have a simultaneous up-regulation of p-ERK and p-STAT3.
(Figures S4C and S4D): Normalized data was imported in R software to test which markers were significantly enriched in each cell types (DP, EMT, PRO, and DN) compared to the other types. Cell types were defined based on the expression levels of Ki67 and FN1. Specifically, DP cells were defined as cells that express levels of both markers higher than the 75-quantiles (top 25% for both Ki67 and FN1); DN cells are the cells that express levels of both markers lower than the 25-quantiles (bottom 25% for both Ki67 and FN1); EMT cells are cells that express levels of FN1 more than the 75-quantiles and concomitant levels of Ki67 less than the 25-quantiles (top 25% for FN1 and bottom 25% for Ki67); and PRO cells are cells that express levels of Ki67 more than the 75-quantiles and concomitant levels of FN1 less than the 25-quantiles (top 25% for Ki67 and bottom 25% for FN1). We then compared the expression level of all the markers among cell types (DP, EMT, PRO, and DN) using a nonparametric test (Mann-Whitney U test) and adjusting the p-values for multiple hypothesis testing with Benjamini-Hochberg corrections. Statistical significance was attributed whenever the adjusted p-values were less than 0.05. The top three markers with the lowest adjusted p-value, other than PRO (Ki67) and EMT (FN1 and VIM) markers, were chosen to be shown in Figures 4C and 4D.
(Figures 4G-4I) Human Samples: Data was normalized, concatenated and debarcoded using software from Nolan Lab (http://web.stanford.edu/group/nolan/resources.html). Data was uploaded to Cytobank where some of the illustrations were prepared. Intensities were normalized using arcsinh transform (arcsinh(x/5)). Tumor cells were identified by gating for Ir intercalator+, Ce140- (internal control bead signal), Cytokeratin+ (CK7,18,19+, supplementary data) and CD45− cells. After having identified cancer cells, we plotted them accordingly to their level of Ki67 and FN1 to identify different subpopulations of cancer cells (DP, EMT, PRO, and DN). Since this sample was directly isolated from a PDAC patient without any treatment controls (as we had in our cell line experiment), we drew the Ki67/FN1 gate to select a subpopulation of cancer cells with relatively high level of both Ki67 and FN1 protein. We then replotted cancer cells present in each quadrant accordingly to their p-ERK and p-STAT3 status. A new gate was manually drawn to quantify and compared among different cell types (DP, EMT, PRO and DN) to the proportion of cells that have a simultaneous up-regulation of p-ERK and p-STAT3. (Figures S4E and S4F) Normalized data was imported in R software to test which markers were significantly enriched in each cell types (DP, EMT, PRO, and DN) compared to the other types. Cell types were defined based on the expression levels of Ki67 and FN1. Specifically, DP cells were defined as cells that express levels of both markers higher than the 75-quantiles (top 25% for both Ki67 and FN1); DN cells are the cells that express levels of both markers lower than the 25-quantiles (bottom 25% for both Ki67 and FN1); EMT cells are cells that express levels of FN1 more than the 75-quantiles and concomitant levels of Ki67 less than the 25-quantiles (top 25% for FN1 and bottom 25% for Ki67); and PRO cells are cells that express levels of Ki67 more than the 75-quantiles and concomitant levels of FN1 less than the 25-quantiles (top 25% for Ki67 and bottom 25% for FN1). We then compared the expression level of all the markers among cell types (DP, EMT, PRO, and DN) using a nonparametric test (Mann-Whitney U test) and adjusting the p-values for multiple hypothesis testing with Benjamini-Hochberg corrections. Statistical significance was attributed whenever the adjusted p-values were less than 0.05.
Mass Spectrometry
(Figure 5A-5C) Expression data of 2000 secreted proteins were obtained. We removed all proteins that were not annotated to be secreted proteins by intersecting our dataset with 2249 taken from the human protein atlas, https://www.proteinatlas.org/humanproteome/secretome#prediction). After this filtering, 416 secreted proteins remained. To identify the potential candidates that drive the DP phenotype, we selected proteins that were both secreted at a high level by CAFs (Fig. 5B; x axis) and positively correlated with the effect of CAF-CM across PDAC lines (Fig. 5B; y axis). The x-axis of the Fig. 5B was determined by the log2 ratio of the average expression of each protein secreted by CAF-1 over the average expression across all PDACS (PDAC-2 + PDAC-3 + PDAC-6 + PDAC-8). The y-axis of the Fig. 5B was the correlation between the relative secreted protein concentration for each PDAC with the amount of DP induction evaluated by flow cytometry (Figure 2B). DP induction was obtained for each PDAC line by dividing the percentages of DP cells upon CAF-CM exposure by the percentages of DP cells in standard DMEM (2% FBS). The rationale to correlate the effect of CAF-CM with the amount of secreted proteins by each PDAC assumes that cancer cells with lower basal levels of a candidate secreted factor should increase more in the percentages of DP cells upon CAF-CM exposure. Using these criteria, we selected 7 candidates that are highly enriched in the CAFs secretome (8 fold enriched compared to PDACs, dashed vertical line, Figure 5B) and have a Pearson correlation coefficient higher than 0.8 (dashed horizontal line, Figure 5B). (Figure 5C) For each protein detected in the mass spectrometry we performed an ANOVA (F-test) to test the relative concentration differences among lines (CAF + PDACs). We After multiple hypothesis correction we found identified 1395 significant proteins with FDR <0.1. For these significant proteins we compared the protein concentration between CAF against the average concentration across all PDACs (PDAC-2, -3, -6, and -8) using a Student’s T-test followed by Benjamini-Hochberg correction. We then selected all proteins that were annotated as secreted (2249 taken from the human protein atlas https://www.proteinatlas.org/humanproteome/secretome#prediction).
RNA-ISH Staining
(Figure 6A and 6B) Image Analysis: To determine the proliferation and EMT quantification each PDAC TMA slides were stained with RNA-ISH for the proliferation gene MKI67 and the EMT gene FN1 as described above. Slides were imaged using a Leica Aperio CS-O slide scanning microscope at 40x magnification. Images were analyzed using VIS (Visiopharm) digitial image analysis software. First, the image of the tissue microarray slide was processed using the VIS TissueArray module, thus permitting each core to be viewed and analyzed as a separate stand-alone image. Then, core images were processed using the VIS ImageAnalysis module. Glands were manually selected for analysis by drawing a region of interested (ROI) polygon around the gland. Confirmation of malignant tumor islands was performed by two fully trained pathologist (K.S.A. and A.N.). Approximately 15-20 glands were randomly chosen per core or tissue section in FOLFIRINOX-treated tumors. Areas from a representative gland ROI were used to train a Bayesian algorithm to segment cells, Fibronectin positive (fastRed) regions, and Ki67 positive (fastBlue) regions. The feature set used for classification was based on color deconvolution of the underlying color components: fastRed, fastBlue, and hematoxylin. Additional spatial filters (mean filter, median filter, VIS proprietary “poly blobs” filter, etc.) were applied to reduce background noise, aid delineation of cell boundaries, and enhance visualization of red and blue dots of various sizes. Following classification and refining of cell segmentation, cells were given an assignment of either: blue positive (Ki67+FN−), red positive (Ki67−FN1+), double positive (Ki67+FN1+), or double negative (Ki67−FN1−) according to the number of red dots and blue dots present within cell boundaries. Blue positive cells were defined as having 0-1 red dots and 3 or more blue dots. Similarly, red positive cells were defined as a cell containing 2 or more red dots and 0-2 blue dots. Double positive cells were defined as having 2 or more red dots and 3 or more blue dots. Conversely, double negative cells were those that had 0-1 red dots and 0-2 blue dots. The threshold for blue positivity was set higher (3 vs 2) to compensate for background hematoxylin (blue). Larger dots were assumed to represent an aggregate of smaller dots (2 or more for small red dots and 3 or more small for blue dots). The final steps in the analysis involved cleaning up the image for final presentation by removing any background dots and changing the color labels.
(Figures 6B and S6) Data Analysis: To get the single cell count we used two different normalization approaches. We normalized the number of cells of each type per patient either by dividing each cell type by the total number of cells counted for each patient – referred from now on in the methods section as the single cell counts normalized by Total Cell Count (nTCC, Figure 6B and S6E) or we divided the number of cells of each type by the total number of cells in the corresponding tumor gland then averaged per patient – referred from now on in the methods section as the single cell normalized by Gland (nG, Figure 6C and S6F). We then computed Kaplan Meier curves and performed a Log-Rank Test to examine if the two different cell count normalization schemes were significantly associated with overall survival. Kaplan-Meier cutoff (Figure 6B, 6C, S6E and S6F): DP cell nTCC 15%, nG 14.5%, PRO cell nTCC 14.5%, nG 15.5%, EMT cell nTCC 16%, nG 16%, DN cell nTCC 52%, nG %56.5. To define different types of tumor glands we applied the following nG criteria based on the observation that 59.6% of cells counted were DN, so ~45% of cells belong to either DP, EMT or PRO class. We assigned an equal weight to each class and scored DN glands (Type VIII) as those glands that had cell types (DP, EMT, and PRO) that did not reach the 15% cutoff. We assigned the DP gland (Type I), EMT (Type II) or PRO (Type III) only if either DP or EMT or PRO cells, respectively, were greater than the 15% cutoff. Conversely, we assign to Type IV, V, and VI to glands in which only two cell types meet the criteria of 15%. Specifically, DP + EMT cells= Type IV, DP + PRO cells= Type V, PRO + EMT cells= Type VI (Figure 7A). Lastly, we assign to Type VII if all three cell types (DP, EMT, and PRO) exceed the 15% cutoff. Kaplan-Meier cutoff (Figures S7D): Type I 9%, Type II 12%, Type III 30%, Type IV 18%, Type V 18%, Type VI 18%, Type 21VII %, Type VIII 56%.
Stroma-Tumor Ratio Quantification
(Figures 7C) Stained slides were imaged using a Leica Aperio CS-O slide scanning microscope at 40x magnification. The images were analyzed using VIS (Visiopharm) software. The image of the tissue microarray slide was processed using the VIS TissueArray module, thus permitting each core to be viewed and analyzed as a separate stand-alone image. Core images were then processed using the ImageAnalysis module. We identified tissue areas for quantification using an algorithm based on intensity in the HSI (Hue Saturation Intensity) color space as well as the blue color band in the RGB color space (Figure S21, left panel, second image). A spatial filter was applied to remove noise. Tissue areas that could potentially skew results such as necrotic tissue and normal tissue were annotated by hand and removed from analysis. To quantify stroma fraction, five image features were used to train a Bayesian classifier to discriminate KRT+, SPARC+, and unstained tissue regions. The color components of red (SPARC+) and blue (KRT+) stained areas were extracted using color deconvolution. For the first two features, a spatial “poly blobs” filter was applied to capture small red or blue dots, respectively. To bring out larger red stained regions that result from aggregation of many SPARC+ dots, we used red-green contrast for the third feature. Red-green contrast is defined as the differential intensity of the red and green color bands in RGB space. To bring out larger blue (KRT+) regions and to identify unstained tissue regions, two additional features were created. Following Bayesian classification, post processing was performed to further refine identification of tumor and stroma regions and to calculate the stroma area fraction of the tissue core (Figures 7C). The stroma fraction was defined as the red (SPARC+) area plus the unstained stroma regions (shown as yellow in Figures 7C) normalized by the total tissue area (red + blue + unstained). A subset of TMA tissue cores had dimmer KRT (blue) RNAish inter and intra-core staining. While still distinct, the fainter blue stain was under-called by the above algorithm. Therefore, we created another algorithm that was more sensitive to the fainter blue stain. As before, we used color deconvolution to pull out the blue color components with emphasis on discrimination of lighter blues. We trained a Bayesian classifier using three features: one to discriminate red (SPARC+) regions and two others to define light and dark blue (KRT+) regions. To ensured that no blue signal was lost, the algorithm was designed to allow manual validation of lighter blue regions in each image by adjustment of the blue threshold. We quantified the stroma in 72 PDAC patients. For each patient, we computed the mean stroma ratio (MSR) across all the TMA cores (total number of core= 135, Core/Patient= 1.9). We split patients into three groups: low (MSR < 75%), medium (75%=<MSR<85%), and high (MSR >= 85%). We divided tumor glands accordingly to each stroma class, and we took the percentage for each gland type (Figures 7C). To test whether there were any differences in the distribution of each gland type among stroma classes (low, medium and high), we performed Wilcoxon signed-rank test (Figures 7D and S7B).
Statistical Analysis
Assuming a normal error distribution for quantitative measurements we used an unpaired t-test: Figures 2B and 2C; Figures 3F and 3G; Figures 4B, 4E and 4F; Figures 5D-5F, Figures S2B, 2C, and S2D, Figure S3C, Figures S5B and S5C. The Wilcoxon rank-sum test was used to test the significance between two variables without assuming a normal distribution: Figures 2F; Figures 7D; Figures S2E; Figure S7B and 7F. Pearson correlation was used to determine the correlation coefficient between two variables: Figure 5B y-axis. Two-way anova was used to determine the statistical significance for in vitro and in vivo proliferation curves: Figures 2E; Figure S2E and S5A. The Log-rank test was used to determine statistical significance of differences in Kaplan-meier survival curves: Figures 6B and 6C; Figure S7D. Cox models were fit using the R-function ‘coxph’ from the ‘survival’ package. We took the ‘NoType’ glands and ‘NEG’ cells (Figure S7E) or ‘NoType’ glands and Stage I (Figure 7E) as the baseline in their corresponding Cox models. The model beta measures the log hazard ratio associated with a one percent change in gland type composition. Hazard ratios corresponding to a 10% change in gland type proportion was estimated by exp(10*beta). We obtained the associated 95% confidence intervals by computing CI = exp(10*beta +/− 1.96*se(beta)). All statistical analyses were done by using Prism 6, 7 and R software. P-values lower than 0.05 were considered statistically significant.
DATA AND SOFTWARE AVAILABILITY
Data analysis and Data Availability
Data analysis, statistical test, and visualization were conducted in R (version 3.4.0; R foundation for Statistical Computing, Vienna, Austria), GraphPad Prism (v8.0), and Visiopharm (2018.9.4.5608). The accession number for the RNA sequencing data reported in this paper is GEO: GSE113616.
Supplementary Material
Figure S1. PDAC:CAF co-culture alters PDAC single cell heterogeneity and is associated with a DP (PRO+EMT) phenotype, Related to Figure 1.
(A) Upper Panel. Representative immunofluorescence images (DAPI nuclear stain, blue; KRT=wide-spectrum cytokeratin, green; α-SMA=alpha-smooth muscle actin, red) of PDAC-3 and CAF-1 cells in co-culture. Scale bar= 100μm. Lower Panel. Representative immunofluorescence images (DAPI, blue; GFP= green fluorescent protein, green; mCherry, red) distinguishing GFP-tagged PDAC-3 cells from mCherry-tagged CAF-1 cells in co-culture. Scale bar= 25μm. (B) Heatmap showing the correlation matrix of the 54 significantly enriched gene sets. (C) Contour plot representing the PRO and EMT activation status for each single CAF-1 cell across different co-culture conditions (PDAC:CAF= 0:100, 10:90, 30:70, 50:50). (D) Unsupervised hierarchical clustering of the 3059 differentially expressed genes (FDR < 0.2) between CAF alone (PDAC:CAF= 0:100) vs. 50:50 culture condition. The classes (I and II) represent the two major genes clusters (I= 901 genes, II=2158 genes) identified. (E) Contour plots showing for CAF-1 cells their activation status of PRO and INTERFERON γ meta-signatures. PDAC:CAF conditions: 0:100, 50:50, 30:70, 10:90. (F) Pie charts indicate the proportion of myofibroblasts or “myCAFs”, inflammatory CAFs or “iCAFs”, and pancreatic stellate cells or “PSCs” from our single-cell RNA-Sequencing experiment mixing PDAC-3 cells with different proportions of CAF-1 cells (PDAC:CAFs= 0:100, 10:90, 30:30, and 50:50).
Table S4. Differentially expressed proteins from Mass cytometry (CyTOF) data comparing PRO vs. DP cells or EMT vs. DP cells in PDAC-3 cells exposed to CAF conditioned media (left panel) and expression values for CyTOF markers (right panel), Related to Figure S4.
Table S5. Normalized intensity mass spectrometry values for secreted proteins from CAF-1, PDAC-2, PDAC-3, PDAC-6 and PDAC-8 cell lines, Related to Figure 5.
Table S6. Survival, stage, grade, stroma content, cell and gland types data for the 195 PDAC patients stained with dual color RNA-ISH for MKI67 and FN1 genes, Related to Figure 6 and Figure 7.
Table S7. Cell and gland types data for the 25 neoadjuvant FOLFIRINOX treated PDAC patients stained with dual color RNA-ISH for MKI67 and FN1 genes, Related to Figure 7.
Table S3. Mass cytometry (CyTOF) expression values of proteins from PDAC-3 exposed to CAF conditioned media (left panels) and from a primary human PDAC tumor (right panel), Related to Figure 4 and Figure S4.
Figure S2. CAF conditioned media (CAF-CM) contributes to PRO and EMT functional behavior across PDAC cell lines, Related to Figure 2.
(A) Clustering and Classification of PDAC cell lines based on RNA-seq expression values in accordance with PDAC subtypes (Classical, Quasi-Mesenchymal and Exocrine-like) identified by Collisson et al., Nature Medicine, 2011. (B) Bar graphs of percent DP (Ki67+FN1) cells in PDAC cell line analyzed by flow cytometry after 72 hours of growth in DMEM or CAF conditioned media (CAf-CM) from two newly-generated CAF lines (CAF-2 and CAF-3). Mean +/− SD shown. *= p<0.05, **= p<0.01, ***= p<0.001 ****= p<0.0001, two-tailed unpaired t-test. (C) Box plots of cell proliferation in viable PDAC cells co-cultured with two newly-generated CAF lines: CAF-2 and CAF-3. Cells were seeded alone (100:0) or co-cultured with different proportions of CAF-1 cells (50:50, 30:70 and 10:90). *= p<0.05, **= p<0.01, ***= p<0.001 ****= p<0.0001, two-tailed unpaired t-test, NS= p>0.05, two-tailed unpaired t-test. (D) Box plots showing the invasion ability of each PDAC line with and without CAF conditioned media (CAF-CM). (E) Left panel: Representative bioluminescence images of orthotopic tumors (upper images) of PDAC-8 cells alone (100:0) or with 90% of CAF-1 cells (PDAC:CAF= 10:90). Explanted liver and lung to quantify distant metastasis (lower images). Scale bar Photon Flux= Luminescence (A.U.). Right panel: Proliferation curves of PDAC-8 xenograft with or without CAF-1 co-injection, NS= p>0.05, Two-way ANOVA, dots= mean values, error bars= standard error of the mean). Distant metastasis (metastatic index): normalized to primary tumor signal (*=p<0.05, Mann-Whitney Test).
Figure S3. CAF-CM activates MAPK and STAT3 signaling pathways in PDAC cells, Related to Figure 3.
(A) Plots showing the relative cell growth (viability) of PDAC-3 cells treated with three different STAT3 inhibitors (STAT3i= SH-4-54 and Pyrimethamine) compared to vehicle control when cancer cells were exposed (red dots) or not (blue dots) to CAF conditioned media (CAF-CM). Dots=mean values and bars= standard. (B) Upper Panel. Heatmap showing the inhibition of proliferation (cell viability) of multiple pDACs alone (100:0) or with different PDAC:CAF culture conditions 50:50, 30:70, 10:90 when treated with MEKi (trametinib)/STAT3i (pyrimethamine) combinations therapy. Lower Panel. Heatmap showing the inhibition of proliferation (cell viability) of multiple PDACs alone (100:0) or with different PDAC:CAF culture conditions 50:50, 30:70, 10:90 when treated with MEKi (trametinib)/STAT3i (SH-4-54) combinations therapy. (C) Invasion assay (Matrigel-coated Boyden Chambers) of PDAC cell lines in CAF conditioned media (CAf-CM) with single or combination treatment with MEKi (Trametinib) and STAT3i (pyrimethamine).
Figure S4. DP cells co-upregulates MAPK and STAT3 signaling pathways in multiple PDAC lines, in human primary tumors, and in a liver metastasis, Related to Figure 4.
(A) Representative flow cytometry plots for each PDAC-2 and PDAC-3 lines. Contour density plots showing Ki67 and FN1 expression levels in each PDAC line after (left plots). After gating, we generated 4 quadrants (DP= Ki67+/FN1+, EMT=Ki67-/FN1+, PRO=Ki67+/FN1−, DN=Ki67−/FN1−) and we plotted the cells in each quadrant (Ki67/FN1 gate) based on p-ERK and p-STAT3 staining (right contour plots). (B) Time course single cell phospho-proteomics experiment using mass cytometry (CyTOF) in PDAC-3 cells exposed to CAF-1 conditioned media (CM). Left Panel. Density plots showing Ki67 and FN1 positive subpopulations in PDAC-3 cells after 24 and 72 hours of CAF-1 CM exposure. Based on Ki67 and FN1 activation, four populations (DP= Ki67+/FN1+, EMT=Ki67−/FN1+, PRO=Ki67+/FN1−, DN=Ki67−/FN1−) are identified. Right Panel. Density plots of p-ERK and p-STAT3 in PRO and EMT subpopulation quadrant analysis. (C-D) Bar graphs showing the three most differentially expressed protein markers (the lowest adjusted p-values) between (C) DP vs. PRO cells and (D) DP vs. EMT cells. (E-F) Bar graphs showing changes of the three most differentially expressed protein markers between (E) DP vs PRO cells and (F) DP vs EMT cells. **= p<0.01, ***= p<0.001, ****= p<0.0001 Mann-Whitney-Wilcoxon Test.
Figure S5. CAF-secreted TGFB1 drives the DP phenotype in PDAC cell lines, Related to Figure 5.
(A) Cell viability assay growth curves of PDAC-2 and PDAC-3 cell line with or without No-Serum CAF-CM. ****= p<0.0001, two-tail unpaired t-test (B) ELISA assay to quantify the amount of TGFB1 in No-Serum CAF-CM or in DMEM with 2% FBS. * P-value<0.05, two tail unpaired t-test. Histogram height= mean values, Bars= Standard Deviation. (C) Box plots showing the inhibition of proliferation across several patient-derived PDACs when exposed to both CAF conditioned media (CAF-CM) and decreasing doses of an Ab isotype control. *= p<0.05, NS= p>0.05, two-tailed unpaired t-test. (D) Representative flow cytometry contour density plots for each PDAC cell line. DMEM was used as control to set placement of quadrants (~0.5% of DP cells) for detecting the increase in DP state in CAF-CM treated samples.
Figure S6. Tumor glands are independent “units” in the architecture of primary PDAC tumors, Related to Figure 6.
(A) Representative images of dual-color RNA-ISH stained primary human PDACs for single cell RNA scoring for PRO and EMT markers. Middle image bar = 20 μm, surrounding images = 2 μm. (B-C) Representative Images of a dual color tissue RNA-ISH for (B) MKI67 (Ki67) in blue and PCNA in red or (C) VIM in blue and FN1 in red of a primary tumor xenograft (PDAC-3 cells orthotopically xenografted). Visopharm digital imaging software was used to quantify the number of double positive (DP, yellow) and single positive stained cells (Blue and Red). (D) Bar graph showing inter-tumoral heterogeneity based on single cell phenotypes (DP, EMT, PRO, and DN cells). Each column is a different tumor. (E-F) Kaplan-Meier survival curves for high vs low DN (Ki67-/FN1−) cells. (E) Single cell scoring by the total number of cancer cells per tumor (left column) compared to (F) single cell scoring normalized per gland basis (right column). A uniform cutoff of 55% was applied to divide low- vs high-risk patients in each Kaplan-Meier curve.
Figure S7. Stromal content and cytotoxic therapies are correlated with distinct patterns of tumor glands in human primary PDAC tumors, Related to Figure 7.
(A) Intra-tumor heterogeneity. Patients’ cores are grouped with a black vertical line (black segment on the left of each grouped vertical bars), while each core is represented by the horizontal colored-bars (tumor gland percentages). PDAC patients with 2 cores are shown on left and ≥ 3 cores on the right. (B) Violin plots showing different percentages of PDAC tumor gland types in low, medium, or high stromal content primary PDAC tumors. (C) Dual color Tissue RNA-ISH for two different sets of probes MKI67 (Ki67) + FN1 or PCNA + COL1A1 of primary tumors and distant metastases (liver metastasis) in mice xenografted with PDAC-3 cell line. Tumor gland quantification was performed using Visopharm as digital image analysis software. (D) Kaplan-Meier curves (p-values= Log-Rank Test) for all gland types dividing low vs high-risk patients. (E) Multivariate survival analysis (COX regression model) including all gland and single cell types. (F) Box plots showing the distribution of single cell phenotypes (DP, EMT, PRO, and DN cells) in our cohort on untreated (N=195) or FOLFIRINOX-treated patients.
Table S1. Single-cell RNA sequencing differentially expressed genes and gene set enriched pathways in PDAC-3 and CAF-1 cells. CAF-1 normalized gene counts to identified CAF subpopulations (iCAF, myCAF, and PSCs), Related to Figure 1 and Figure S1.
Table S2. Mass spectrometry-based phospho-proteomics expression values from PDAC-3 cells exposed to CAF conditioned media and harvested at different time points (5 min, 15 min, 1 hour, 3 hours and 24 hours), Related to Figure 3.
| REAGENT or RESOURCE | SOURCE | IDENTIFIER |
|---|---|---|
| Antibodies | ||
| Anti-human Ki-67 Antibody-605 | BioLegend | Cat# 350522 |
| Anti-Fibronectin antibody-647 | abcam | Cat# ab198934 |
| Anti-ERK1/2 Phospho (Thr202/Tyr204) Antibody-PE | BioLegend | Cat# 369506 |
| Anti-STAT3 Phospho (Tyr705) Antibody-421 | BioLegend | Cat# 651010 |
| Anti-Cytokeratin 7 antibody-488 | abcam | Cat# ab185048 |
| Bacterial and Virus Strains | ||
| pBABE-hygro-hTERT | addgene | Cat# 1773 |
| Chemicals, Peptides, and Recombinant Proteins | ||
| pUltra-hot-mCherry | Cat# 24130 | |
| Critical Commercial Assays | ||
| Tissue RNA-ISH Staining (2-plex) | ThermoFisher | Cat# QVT0012 |
| Deposited Data | ||
| RNA sequencing | This paper | GEO: GSE113616 |
| Proteomic Data | This paper | MassIVE: MSV000083544 |
| Experimental Models: Cell Lines | ||
| Patient-Derived PDAC cell lines (N=6) | Cristina Ferrone lab, Massachusetts General Hospital Harvard Medical School | N/A |
| Patient-derived cancer associated fibroblasts (CAF-1 and CAF-3) | Ting lab, Massachusetts General Hospital Harvard Medical School | N/A |
| Patient-derived cancer associated fibroblasts (CAF-2) | Dr. Ulrich F. Wellner Clinic of Surgery, UKSH Campus Lübeck, Germany and Dr. Oliver Schilling Institute of Pathology, University Medical Center Freiburg, Germany | N/A |
| Experimental Models: Organisms/Strains | ||
| NSG (NOD.Cg-Prkdcscid Il2rgtm1Wjl/SzJ) | The Jackson laboratories | Stock No: 005557 |
| Software and Algorithms | ||
| R software | CRAN (Open Source) | Version: 3.4.0 |
| Prism 8 | Graphpad | Version: 8 |
| Image software analysis | Visiopharm | Version: 2018.9.4.5608 |
Highlights.
Cancer associated fibroblasts (CAFs) contribute to pancreatic cancer heterogeneity
Cancer cells can have a double positive (DP) phenotype: proliferation and invasion
High CAF abundance linked with DP cells enriched for MAPK and STAT3 co-signaling
Intra-tumoral gland types provide tissue heterogeneity linked with clinical outcome
ACKNOWLEDGEMENTS
We are grateful to Laura Libby, Emily M. Silva, and Danielle Bestoso for mouse colony care and administrative support. This work was supported by American-Italian Cancer Foundation Post-Doctoral Research Fellowship (M.L.), Hirshberg Foundation seed grand (M.L), Tosteson & Fund for Medical Discovery Fellowship (M.L.), the Burroughs Wellcome Fund (D.T.T., M.N.R.), the NSF PHY-1549535 (D.T.T.), SU2C and Lustgarten Foundation (D.T.T.), the V Foundation (M.R.), Affymetrix, Inc. (D.T.T., K.S.A, N.D., M.N.R., V.D.), the NIH T32GM007753 (R.Y.E), the Warshaw Institute for Pancreatic Cancer Research (D.T.T., M.L.), the Verville Family Pancreatic Cancer Research Fund (D.T.T.), and the NIH U01 CA215798 (W.H.). ESSCO Breast Cancer Research (S.M.) NIH Grant 2R01CA129933 (D.A.H.), NIH Grant 2U01EB012493 (D.A.H.), NIH Grant U01CA214297 (D.A.H. and S.M.), the Breast Cancer Research Foundation (D.A.H.), Howard Hughes Medical Institute (D.A.H.), and National Foundation for Cancer Research (D.A.H.). Grant U01CA215798 (W.H.).
Footnotes
DECLARATION OF INTERESTS
D.T.T. has received consulting fees from Merrimack Pharmaceuticals, Ventana Roche, and EMD Millipore Sigma, which are not related to this work. D.T.T. is a founder and has equity in PanTher Therapeutics, which is not related to this work. D.T.T., V.D., and M.N.R. have a sponsored research agreement with ACD-Biotechne and previously with Affymetrix. M.J.A has received consulting income from SynapDx, BlueBird Bio, Fulcrum Therapeutics, Leap Therapeutics, NextGenJane, Progenity, Inc. and Third Rock Ventures, not related to this work. M.J.A. has financial interests in Monitor Biotechnologies (formerly known as Beacon Genomics), not related to this work. M.L. has received consulting fees from Merrimack Pharmaceuticals not related to this work. J.W.F is a paid consultant with Foundation Medicine not related to this work. All the other Authors declare no competing interests.
Publisher's Disclaimer: This is a PDF file of an unedited manuscript that has been accepted for publication. As a service to our customers we are providing this early version of the manuscript. The manuscript will undergo copyediting, typesetting, and review of the resulting proof before it is published in its final citable form. Please note that during the production process errors may be discovered which could affect the content, and all legal disclaimers that apply to the journal pertain.
REFERENCES
- Amedei A, Niccolai E, and Prisco D (2014). Pancreatic cancer: Role of the immune system in cancer progression and vaccine-based immunotherapy. Hum. Vaccin. Immunother. 10, 3354–3368. [DOI] [PMC free article] [PubMed] [Google Scholar]
- Apte MV, Wilson JS, Lugea A, and Pandol SJ (2013). A Starring Role for Stellate Cells in the Pancreatic Cancer Microenvironment. Gastroenterology 144, 1210–1219. [DOI] [PMC free article] [PubMed] [Google Scholar]
- Beausoleil SA, Villén J, Gerber SA, Rush J, and Gygi SP (2006). A probability-based approach for high-throughput protein phosphorylation analysis and site localization. Nat Biotechnol 24, 1285–1292. [DOI] [PubMed] [Google Scholar]
- Bernard V, Semaan A, Huang J, San Lucas FA, Mulu FC, Stephens BM, Guerrero PA, Huang Y, Zhao J, Kamyabi N, et al. (2018). Single Cell Transcriptomics of Pancreatic Cancer Precursors Demonstrates Epithelial and Microenvironmental Heterogeneity as an Early Event in Neoplastic Progression. Clin. Cancer Res. [DOI] [PMC free article] [PubMed] [Google Scholar]
- Biffi G, Oni TE, Spielman B, Hao Y, Elyada E, Park Y, Preall J, and Tuveson DA (2019). IL1-Induced JAK/STAT Signaling Is Antagonized by TGFβ to Shape CAF Heterogeneity in Pancreatic Ductal Adenocarcinoma. Cancer Discov 9, 282–301. [DOI] [PMC free article] [PubMed] [Google Scholar]
- Clark CE, Hingorani SR, Mick R, Combs C, Tuveson DA, and Vonderheide RH (2007). Dynamics of the Immune Reaction to Pancreatic Cancer from Inception to Invasion. Cancer Res 67, 9518–9527. [DOI] [PubMed] [Google Scholar]
- Edwards A, and Haas W (2015). Multiplexed Quantitative Proteomics for High-Throughput Comprehensive Proteome Comparisons of Human Cell Lines In Proteomis in Systems Biology, (New York, NY: Springer New York; ), pp. 1–13. [DOI] [PubMed] [Google Scholar]
- Elias JE, and Gygi SP (2007). Target-decoy search strategy for increased confidence in large-scale protein identifications by mass spectrometry. Nat. Methods 4, 207–214. [DOI] [PubMed] [Google Scholar]
- Erickson BK, Jedrychowski MP, McAlister GC, Everley RA, Kunz R, and Gygi SP (2015). Evaluating Multiplexed Quantitative Phosphopeptide Analysis on a Hybrid Quadrupole Mass Filter/Linear Ion Trap/Orbitrap Mass Spectrometer. Anal. Chem. 87, 1241–1249. [DOI] [PMC free article] [PubMed] [Google Scholar]
- Erkan M, Hausmann S, Michalski CW, Fingerle AA, Dobritz M, Kleeff J, and Friess H (2012). The role of stroma in pancreatic cancer: diagnostic and therapeutic implications. Nat. Rev. Gastroenterol. 9, 454–467. [DOI] [PubMed] [Google Scholar]
- Gore J, and Korc M (2014). Pancreatic Cancer Stroma: Friend or Foe? Cancer Cell 25, 711–712. [DOI] [PMC free article] [PubMed] [Google Scholar]
- Hamada S, Masamune A, Takikawa T, Suzuki N, Kikuta K, Hirota M, Hamada H, Kobune M, Satoh K, and Shimosegawa T (2012). Pancreatic stellate cells enhance stem cell-like phenotypes in pancreatic cancer cells. Biochem. Biophys. Res. Commun. 421, 349–354. [DOI] [PubMed] [Google Scholar]
- Hanahan D, and Weinberg RA (2011). Hallmarks of Cancer: The Next Generation. Cell 144, 646–674. [DOI] [PubMed] [Google Scholar]
- Huttlin EL, Jedrychowski MP, Elias JE, Goswami T, Rad R, Beausoleil SA, Villén J, Haas W, Sowa ME, and Gygi SP (2010). A Tissue-Specific Atlas of Mouse Protein Phosphorylation and Expression. Cell 143, 1174–1189. [DOI] [PMC free article] [PubMed] [Google Scholar]
- Indolfi L, ligorio M, Ting DT, Xega K, Tzafriri AR, Bersani F, Aceto N, Thapar V, Fuchs BC, Deshpande V, et al. (2016). A tunable delivery platform to provide local chemotherapy for pancreatic ductal adenocarcinoma. Biomaterials 93, 71–82. [DOI] [PMC free article] [PubMed] [Google Scholar]
- Infante JR, Matsubayashi H, Sato N, Tonascia J, Klein AP, Riall TA, Yeo C, lacobuzio-Donahue C, and Goggins M (2007). Peritumoral Fibroblast SPARC Expression and Patient Outcome With Resectable Pancreatic Adenocarcinoma. J. Clin. Oncol. 25, 319–325. [DOI] [PubMed] [Google Scholar]
- Kleeff J, Korc M, Apte M, La Vecchia C, Johnson CD, Biankin AV, Neale RE, Tempero M, Tuveson DA, Hruban RH, et al. (2016). Pancreatic cancer. Nature 2, 1–23. [DOI] [PubMed] [Google Scholar]
- Laklai H, Miroshnikova YA, Pickup MW, Collisson EA, Kim GE, Barrett AS, Hill RC, Lakins JN, Schlaepfer DD, Mouw JK, et al. (2016). Genotype tunes pancreatic ductal adenocarcinoma tissue tension to induce matricellular fibrosis and tumor progression. Nat. Med. 1–12. [DOI] [PMC free article] [PubMed] [Google Scholar]
- Lapek JD, Greninger P, Morris R, Amzallag A, Pruteanu-Malinici I, Benes CH, and Haas W (2017). Detection of dysregulated protein-association networks by high-throughput proteomics predicts cancer vulnerabilities. Nature 35, 983–989. [DOI] [PMC free article] [PubMed] [Google Scholar]
- Liu R-Y, Zeng Y, Lei Z, Wang L, Yang H, Liu Z, Zhao J, and Zhang H-T (2014). JAK/STAT3 signaling is required for TGF-β-induced epithelial-mesenchymal transition in lung cancer cells. Int J Oncol 44, 1643–1651. [DOI] [PubMed] [Google Scholar]
- McAlister GC, Nusinow DP, Jedrychowski MP, Wühr M, Huttlin EL, Erickson BK, Rad R, Haas W, and Gygi SP (2014). MultiNotch MS3 Enables Accurate, Sensitive, and Multiplexed Detection of Differential Expression across Cancer Cell Line Proteomes. Anal. Chem. 86, 7150–7158. [DOI] [PMC free article] [PubMed] [Google Scholar]
- Moffitt RA, Marayati R, Flate EL, Volmar KE, Loeza SGH, Hoadley KA, Rashid NU, Williams LA, Eaton SC, Chung AH, et al. (2015). Virtual microdissection identifies distinct tumor- and stroma-specific subtypes of pancreatic ductal adenocarcinoma. Nat. Genet. 47, 1168–1178. [DOI] [PMC free article] [PubMed] [Google Scholar]
- Murphy JE, Wo JY, Ryan DP, Jiang W, Yeap BY, Drapek LC, Blaszkowsky LS, Kwak EL, Allen JN, Clark JW, et al. (2018). Total Neoadjuvant Therapy With FOLFIRINOX Followed by Individualized Chemoradiotherapy for Borderline Resectable Pancreatic Adenocarcinoma. JAMA Oncol 4, 963–967. [DOI] [PMC free article] [PubMed] [Google Scholar]
- Neesse A, Algül H, Tuveson DA, and Gress TM (2015). Stromal biology and therapy in pancreatic cancer: a changing paradigm. Gut 64, 1476–1484. [DOI] [PubMed] [Google Scholar]
- Obong AE, Clear AJ, Watt J, Wang J, Fatah R, Riches JC, Marshall JF, Aleong JC, Chelala C, Gribben JG, et al. (2013). Activated Pancreatic Stellate Cells Sequester CD8+ T Cells to Reduce Their Infiltration of the Juxtatumoral Compartment of Pancreatic Ductal Adenocarcinoma. Gastroenterology 145, 1121–1132. [DOI] [PMC free article] [PubMed] [Google Scholar]
- Olive KP, Jacobetz MA, Davidson CJ, Gopinathan A, McIntyre D, Honess D, Madhu B, Goldgraben MA, Caldwell ME, Allard D, et al. (2009). Inhibition of Hedgehog Signaling Enhances Delivery of Chemotherapy in a Mouse Model of Pancreatic Cancer. Science 324, 1454–1457. [DOI] [PMC free article] [PubMed] [Google Scholar]
- Öhlund D, Handly-Santana A, Biffi G, Elyada E, Almeida AS, Ponz-Sarvise M, Corbo V, Oni TE, Hearn SA, Lee EJ, et al. (2017). Distinct populations of inflammatory fibroblasts and myofibroblasts in pancreatic cancer. J. Exp. Med. 214, 579–596. [DOI] [PMC free article] [PubMed] [Google Scholar]
- Özdemir BC, Pentcheva-Hoang T, Carstens JL, Zheng X, Wu C-C, Simpson TR, Laklai H, Sugimoto H, Kahlert C, Novitskiy SV, et al. (2014). Depletion of Carcinoma-Associated Fibroblasts and Fibrosis Induces Immunosuppression and Accelerates Pancreas Cancer with Reduced Survival. Cancer Cell 25, 719–734. [DOI] [PMC free article] [PubMed] [Google Scholar]
- Patel AP, Tirosh JJ, Trombetta John J, Suva ML, Regev A, and Bernstein BE (2014a). Single-cell RNA-seq highlights intratumoral heterogeneity in primary glioblastoma. Science 344, 1392–1396. [DOI] [PMC free article] [PubMed] [Google Scholar]
- Patel MB, Pothula SP, Xu Z, Lee AK, Goldstein D, Pirola RC, Apte MV, and Wilson JS (2014b). The role of the hepatocyte growth factor/c-MET pathway in pancreatic stellate cell-endothelial cell interactions: antiangiogenic implications in pancreatic cancer. Carcinogenesis 35, 1891–1900. [DOI] [PubMed] [Google Scholar]
- Principe DR, Diaz AM, Torres C, Mangan RJ, DeCant B, McKinney R, Tsao M-S, Lowy A, Munshi HG, Jung B, et al. (2017). TGFβ engages MEK/ERK to differentially regulate benign and malignant pancreas cell function. Nature 36, 4336–4348. [DOI] [PMC free article] [PubMed] [Google Scholar]
- Qin R, Smyrk TC, Reed NR, Schmidt RL, Schnelldorfer T, Chari ST, Petersen GM, and Tang AH (2015). Combining clinicopathological predictors and molecular biomarkers in the oncogenic K-RAS/Ki67/HIF-1α pathway to predict survival in resectable pancreatic cancer. Br J Cancer 112, 514–522. [DOI] [PMC free article] [PubMed] [Google Scholar]
- Rhim AD, Oberstein PE, Thomas DH, Mirek ET, Palermo CF, Sastra SA, Dekleva EN, Saunders T, Becerra CP, Tattersall IW, et al. (2014). Stromal Elements Act to Restrain, Rather Than Support, Pancreatic Ductal Adenocarcinoma. Cancer Cell 25, 735–747. [DOI] [PMC free article] [PubMed] [Google Scholar]
- Schindelin J, Arganda-Carreras I, Frise E, Kaynig V, Longair M, Pietzsch T, Preibisch S, Rueden C, Saalfeld S, Schmid B, et al. (2012). Fiji: an open-source platform for biological-image analysis. Nat. Methods 9, 676–682. [DOI] [PMC free article] [PubMed] [Google Scholar]
- Tang L-Y, Heller M, Meng Z, Yu L-R, Tang Y, Zhou M, and Zhang YE (2017). Transforming Growth Factor-β (TGF-β) Directly Activates the JAK1-STAT3 Axis to Induce Hepatic Fibrosis in Coordination with the SMAD Pathway. Journal of Biological Chemistry 292, 4302–4312. [DOI] [PMC free article] [PubMed] [Google Scholar]
- Ting DT, Wittner Ben, S, ligorio M, Jordan NV, Shah AM, Miyamoto DT, Aceto N, Bersani F, Brannigan BW, Xega K, et al. (2014). Single-Cell RNA Sequencing Identifies Extracellular Matrix Gene Expression by Pancreatic Circulating Tumor Cells. Cell Rep 1–15. [DOI] [PMC free article] [PubMed] [Google Scholar]
- Ting L, Rad R, Gygi SP, and Haas W (2011). MS3 eliminates ratio distortion in isobaric multiplexed quantitative proteomics. Nat. Methods 8, 937–940. [DOI] [PMC free article] [PubMed] [Google Scholar]
- Tirosh I, Izar B, Prakadan SM, Wadsworth MH, Treacy D, Trombetta JJ, Rotem A, Rodman C, Lian C, Murphy G, et al. (2016a). Dissecting the multicellular ecosystem of metastatic melanoma by single-cell RNA-seq. Science 352, 189–196. [DOI] [PMC free article] [PubMed] [Google Scholar]
- Tirosh I, Venteicher AS, Hebert C, Escalante LE, Patel AP, Yizhak K, Fisher JM, Rodman C, Mount C, Filbin MG, et al. (2016b). Single-cell RNA-seq supports a developmental hierarchy in human oligodendroglioma. Nature 539, 309–313. [DOI] [PMC free article] [PubMed] [Google Scholar]
- Waghray M, Yalamanchili M, Dziubinski M, Zeinali M, Erkkinen M, Yang H, Schradle KA, Urs S, Pasca Di Magliano M, Welling TH, et al. (2016). GM-CSF Mediates Mesenchymal-Epithelial Cross-talk in Pancreatic Cancer. Cancer Discov 6, 886–899. [DOI] [PMC free article] [PubMed] [Google Scholar]
- Wang Y, Wu C, Zhang C, Li Z, Zhu T, Chen J, Ren Y, Wang X, Zhang L, and Zhou X (2018). TGF-β-induced STAT3 overexpression promotes human head and neck squamous cell carcinoma invasion and metastasis through malat1/miR-30a interactions. Cancer Letters 436, 52–62. [DOI] [PubMed] [Google Scholar]
- Xu Z, Vonlaufen A, Phillips PA, Fiala-Beer E, Zhang X, Yang L, Biankin AV, Goldstein D, Pirola RC, Wilson JS, et al. (2010). Role of Pancreatic Stellate Cells in Pancreatic Cancer Metastasis. Am. J. Pathol. 177, 2585–2596. [DOI] [PMC free article] [PubMed] [Google Scholar]
- Zhao C, Xiao H, Wu X, and Li C (2015). Rational combination of MEK inhibitor and the STAT3 pathway modulator for the therapy in K-Ras mutated pancreatic and colon cancer cells. Oncotarget 1–16. [DOI] [PMC free article] [PubMed] [Google Scholar]
Associated Data
This section collects any data citations, data availability statements, or supplementary materials included in this article.
Supplementary Materials
Figure S1. PDAC:CAF co-culture alters PDAC single cell heterogeneity and is associated with a DP (PRO+EMT) phenotype, Related to Figure 1.
(A) Upper Panel. Representative immunofluorescence images (DAPI nuclear stain, blue; KRT=wide-spectrum cytokeratin, green; α-SMA=alpha-smooth muscle actin, red) of PDAC-3 and CAF-1 cells in co-culture. Scale bar= 100μm. Lower Panel. Representative immunofluorescence images (DAPI, blue; GFP= green fluorescent protein, green; mCherry, red) distinguishing GFP-tagged PDAC-3 cells from mCherry-tagged CAF-1 cells in co-culture. Scale bar= 25μm. (B) Heatmap showing the correlation matrix of the 54 significantly enriched gene sets. (C) Contour plot representing the PRO and EMT activation status for each single CAF-1 cell across different co-culture conditions (PDAC:CAF= 0:100, 10:90, 30:70, 50:50). (D) Unsupervised hierarchical clustering of the 3059 differentially expressed genes (FDR < 0.2) between CAF alone (PDAC:CAF= 0:100) vs. 50:50 culture condition. The classes (I and II) represent the two major genes clusters (I= 901 genes, II=2158 genes) identified. (E) Contour plots showing for CAF-1 cells their activation status of PRO and INTERFERON γ meta-signatures. PDAC:CAF conditions: 0:100, 50:50, 30:70, 10:90. (F) Pie charts indicate the proportion of myofibroblasts or “myCAFs”, inflammatory CAFs or “iCAFs”, and pancreatic stellate cells or “PSCs” from our single-cell RNA-Sequencing experiment mixing PDAC-3 cells with different proportions of CAF-1 cells (PDAC:CAFs= 0:100, 10:90, 30:30, and 50:50).
Table S4. Differentially expressed proteins from Mass cytometry (CyTOF) data comparing PRO vs. DP cells or EMT vs. DP cells in PDAC-3 cells exposed to CAF conditioned media (left panel) and expression values for CyTOF markers (right panel), Related to Figure S4.
Table S5. Normalized intensity mass spectrometry values for secreted proteins from CAF-1, PDAC-2, PDAC-3, PDAC-6 and PDAC-8 cell lines, Related to Figure 5.
Table S6. Survival, stage, grade, stroma content, cell and gland types data for the 195 PDAC patients stained with dual color RNA-ISH for MKI67 and FN1 genes, Related to Figure 6 and Figure 7.
Table S7. Cell and gland types data for the 25 neoadjuvant FOLFIRINOX treated PDAC patients stained with dual color RNA-ISH for MKI67 and FN1 genes, Related to Figure 7.
Table S3. Mass cytometry (CyTOF) expression values of proteins from PDAC-3 exposed to CAF conditioned media (left panels) and from a primary human PDAC tumor (right panel), Related to Figure 4 and Figure S4.
Figure S2. CAF conditioned media (CAF-CM) contributes to PRO and EMT functional behavior across PDAC cell lines, Related to Figure 2.
(A) Clustering and Classification of PDAC cell lines based on RNA-seq expression values in accordance with PDAC subtypes (Classical, Quasi-Mesenchymal and Exocrine-like) identified by Collisson et al., Nature Medicine, 2011. (B) Bar graphs of percent DP (Ki67+FN1) cells in PDAC cell line analyzed by flow cytometry after 72 hours of growth in DMEM or CAF conditioned media (CAf-CM) from two newly-generated CAF lines (CAF-2 and CAF-3). Mean +/− SD shown. *= p<0.05, **= p<0.01, ***= p<0.001 ****= p<0.0001, two-tailed unpaired t-test. (C) Box plots of cell proliferation in viable PDAC cells co-cultured with two newly-generated CAF lines: CAF-2 and CAF-3. Cells were seeded alone (100:0) or co-cultured with different proportions of CAF-1 cells (50:50, 30:70 and 10:90). *= p<0.05, **= p<0.01, ***= p<0.001 ****= p<0.0001, two-tailed unpaired t-test, NS= p>0.05, two-tailed unpaired t-test. (D) Box plots showing the invasion ability of each PDAC line with and without CAF conditioned media (CAF-CM). (E) Left panel: Representative bioluminescence images of orthotopic tumors (upper images) of PDAC-8 cells alone (100:0) or with 90% of CAF-1 cells (PDAC:CAF= 10:90). Explanted liver and lung to quantify distant metastasis (lower images). Scale bar Photon Flux= Luminescence (A.U.). Right panel: Proliferation curves of PDAC-8 xenograft with or without CAF-1 co-injection, NS= p>0.05, Two-way ANOVA, dots= mean values, error bars= standard error of the mean). Distant metastasis (metastatic index): normalized to primary tumor signal (*=p<0.05, Mann-Whitney Test).
Figure S3. CAF-CM activates MAPK and STAT3 signaling pathways in PDAC cells, Related to Figure 3.
(A) Plots showing the relative cell growth (viability) of PDAC-3 cells treated with three different STAT3 inhibitors (STAT3i= SH-4-54 and Pyrimethamine) compared to vehicle control when cancer cells were exposed (red dots) or not (blue dots) to CAF conditioned media (CAF-CM). Dots=mean values and bars= standard. (B) Upper Panel. Heatmap showing the inhibition of proliferation (cell viability) of multiple pDACs alone (100:0) or with different PDAC:CAF culture conditions 50:50, 30:70, 10:90 when treated with MEKi (trametinib)/STAT3i (pyrimethamine) combinations therapy. Lower Panel. Heatmap showing the inhibition of proliferation (cell viability) of multiple PDACs alone (100:0) or with different PDAC:CAF culture conditions 50:50, 30:70, 10:90 when treated with MEKi (trametinib)/STAT3i (SH-4-54) combinations therapy. (C) Invasion assay (Matrigel-coated Boyden Chambers) of PDAC cell lines in CAF conditioned media (CAf-CM) with single or combination treatment with MEKi (Trametinib) and STAT3i (pyrimethamine).
Figure S4. DP cells co-upregulates MAPK and STAT3 signaling pathways in multiple PDAC lines, in human primary tumors, and in a liver metastasis, Related to Figure 4.
(A) Representative flow cytometry plots for each PDAC-2 and PDAC-3 lines. Contour density plots showing Ki67 and FN1 expression levels in each PDAC line after (left plots). After gating, we generated 4 quadrants (DP= Ki67+/FN1+, EMT=Ki67-/FN1+, PRO=Ki67+/FN1−, DN=Ki67−/FN1−) and we plotted the cells in each quadrant (Ki67/FN1 gate) based on p-ERK and p-STAT3 staining (right contour plots). (B) Time course single cell phospho-proteomics experiment using mass cytometry (CyTOF) in PDAC-3 cells exposed to CAF-1 conditioned media (CM). Left Panel. Density plots showing Ki67 and FN1 positive subpopulations in PDAC-3 cells after 24 and 72 hours of CAF-1 CM exposure. Based on Ki67 and FN1 activation, four populations (DP= Ki67+/FN1+, EMT=Ki67−/FN1+, PRO=Ki67+/FN1−, DN=Ki67−/FN1−) are identified. Right Panel. Density plots of p-ERK and p-STAT3 in PRO and EMT subpopulation quadrant analysis. (C-D) Bar graphs showing the three most differentially expressed protein markers (the lowest adjusted p-values) between (C) DP vs. PRO cells and (D) DP vs. EMT cells. (E-F) Bar graphs showing changes of the three most differentially expressed protein markers between (E) DP vs PRO cells and (F) DP vs EMT cells. **= p<0.01, ***= p<0.001, ****= p<0.0001 Mann-Whitney-Wilcoxon Test.
Figure S5. CAF-secreted TGFB1 drives the DP phenotype in PDAC cell lines, Related to Figure 5.
(A) Cell viability assay growth curves of PDAC-2 and PDAC-3 cell line with or without No-Serum CAF-CM. ****= p<0.0001, two-tail unpaired t-test (B) ELISA assay to quantify the amount of TGFB1 in No-Serum CAF-CM or in DMEM with 2% FBS. * P-value<0.05, two tail unpaired t-test. Histogram height= mean values, Bars= Standard Deviation. (C) Box plots showing the inhibition of proliferation across several patient-derived PDACs when exposed to both CAF conditioned media (CAF-CM) and decreasing doses of an Ab isotype control. *= p<0.05, NS= p>0.05, two-tailed unpaired t-test. (D) Representative flow cytometry contour density plots for each PDAC cell line. DMEM was used as control to set placement of quadrants (~0.5% of DP cells) for detecting the increase in DP state in CAF-CM treated samples.
Figure S6. Tumor glands are independent “units” in the architecture of primary PDAC tumors, Related to Figure 6.
(A) Representative images of dual-color RNA-ISH stained primary human PDACs for single cell RNA scoring for PRO and EMT markers. Middle image bar = 20 μm, surrounding images = 2 μm. (B-C) Representative Images of a dual color tissue RNA-ISH for (B) MKI67 (Ki67) in blue and PCNA in red or (C) VIM in blue and FN1 in red of a primary tumor xenograft (PDAC-3 cells orthotopically xenografted). Visopharm digital imaging software was used to quantify the number of double positive (DP, yellow) and single positive stained cells (Blue and Red). (D) Bar graph showing inter-tumoral heterogeneity based on single cell phenotypes (DP, EMT, PRO, and DN cells). Each column is a different tumor. (E-F) Kaplan-Meier survival curves for high vs low DN (Ki67-/FN1−) cells. (E) Single cell scoring by the total number of cancer cells per tumor (left column) compared to (F) single cell scoring normalized per gland basis (right column). A uniform cutoff of 55% was applied to divide low- vs high-risk patients in each Kaplan-Meier curve.
Figure S7. Stromal content and cytotoxic therapies are correlated with distinct patterns of tumor glands in human primary PDAC tumors, Related to Figure 7.
(A) Intra-tumor heterogeneity. Patients’ cores are grouped with a black vertical line (black segment on the left of each grouped vertical bars), while each core is represented by the horizontal colored-bars (tumor gland percentages). PDAC patients with 2 cores are shown on left and ≥ 3 cores on the right. (B) Violin plots showing different percentages of PDAC tumor gland types in low, medium, or high stromal content primary PDAC tumors. (C) Dual color Tissue RNA-ISH for two different sets of probes MKI67 (Ki67) + FN1 or PCNA + COL1A1 of primary tumors and distant metastases (liver metastasis) in mice xenografted with PDAC-3 cell line. Tumor gland quantification was performed using Visopharm as digital image analysis software. (D) Kaplan-Meier curves (p-values= Log-Rank Test) for all gland types dividing low vs high-risk patients. (E) Multivariate survival analysis (COX regression model) including all gland and single cell types. (F) Box plots showing the distribution of single cell phenotypes (DP, EMT, PRO, and DN cells) in our cohort on untreated (N=195) or FOLFIRINOX-treated patients.
Table S1. Single-cell RNA sequencing differentially expressed genes and gene set enriched pathways in PDAC-3 and CAF-1 cells. CAF-1 normalized gene counts to identified CAF subpopulations (iCAF, myCAF, and PSCs), Related to Figure 1 and Figure S1.
Table S2. Mass spectrometry-based phospho-proteomics expression values from PDAC-3 cells exposed to CAF conditioned media and harvested at different time points (5 min, 15 min, 1 hour, 3 hours and 24 hours), Related to Figure 3.
Data Availability Statement
Data analysis and Data Availability
Data analysis, statistical test, and visualization were conducted in R (version 3.4.0; R foundation for Statistical Computing, Vienna, Austria), GraphPad Prism (v8.0), and Visiopharm (2018.9.4.5608). The accession number for the RNA sequencing data reported in this paper is GEO: GSE113616.