SUMMARY
Ferroptosis, a cell death process driven by cellular metabolism and iron-dependent lipid peroxidation, is implicated in various diseases such as ischemic organ damage and cancer1,2. As a central regulator of ferroptosis, the enzyme glutathione peroxidase 4 (GPX4) protects cells from ferroptosis by neutralizing lipid peroxides, which are byproducts of cellular metabolism; as such, inhibiting GPX4 directly, or indirectly by depriving its substrate glutathione or building blocks of glutathione (such as cysteine), can trigger ferroptosis3. Ferroptosis contributes to the antitumour function of multiple tumour suppressors including p53, BAP1, and fumarase4-7. Counterintuitively, mesenchymal cancer cells, which are prone to metastasis and often resistant to various treatments, have shown to be highly susceptible to ferroptosis8,9. Here, we demonstrate that ferroptosis can be regulated non-cell autonomously by cadherin-mediated intercellular contacts. In epithelial cells, E-cadherin-mediated intercellular interaction suppresses ferroptosis through intracellular Merlin-Hippo signalling. Antagonizing this signalling axis unleashes the activity of the proto-oncogenic transcriptional co-activator YAP to promote ferroptosis through upregulation of multiple ferroptosis modulators, including acyl-CoA synthetase long chain family member 4 (ACSL4) and transferrin receptor. This finding provides mechanistic insights into the observations that epithelial mesenchymal transition (EMT)/metastasis-prone cancer cells are highly sensitive to ferroptosis8. Importantly, the regulation of ferroptosis by cell-cell contact and Merlin-YAP signalling is not limited to epithelial cells; a similar mechanism also modulates ferroptosis in some non-epithelial cells. Finally, we found that genetic inactivation of the tumour suppressor Merlin, a frequent tumourigenic event in mesothelioma10,11, renders cancer cells more sensitive to ferroptosis in an orthotopic mouse model of malignant mesothelioma. Together, this study unveils the role of intercellular interaction and intracellular Merlin-YAP signalling in dictating ferroptotic death; it also suggests that malignant mutations in Merlin-YAP signalling can serve as biomarkers predicting cancer cell responsiveness to future ferroptosis-inducing therapies.
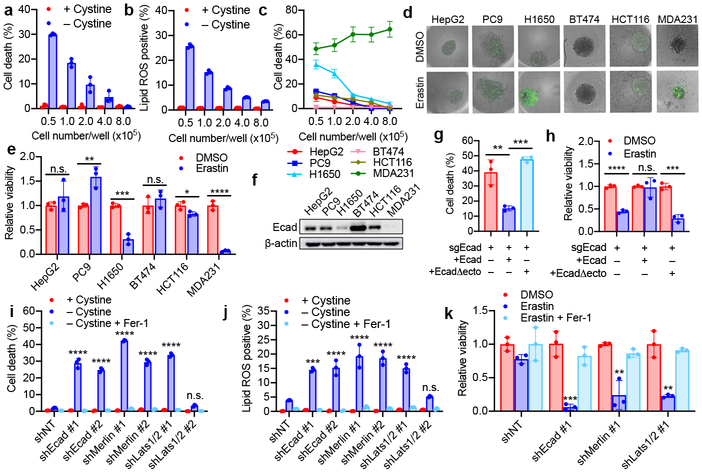
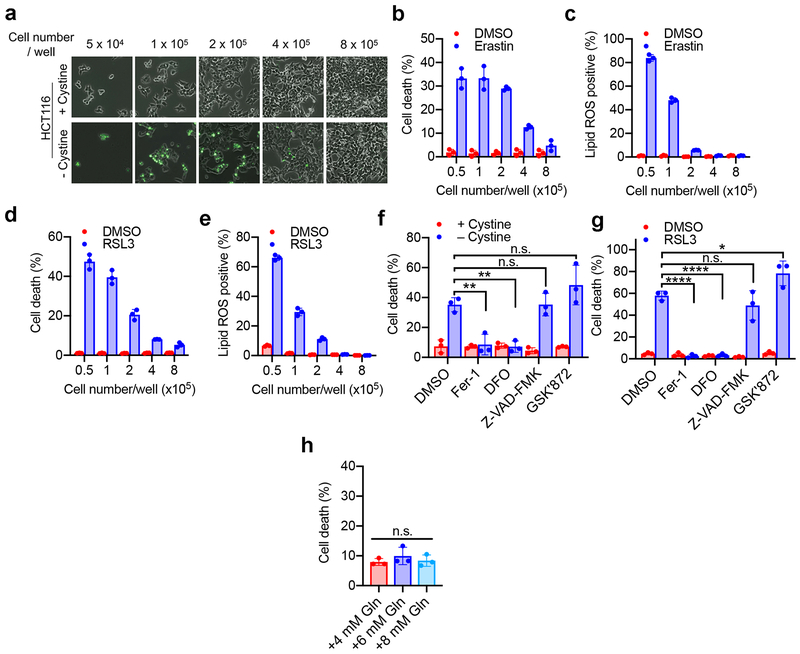
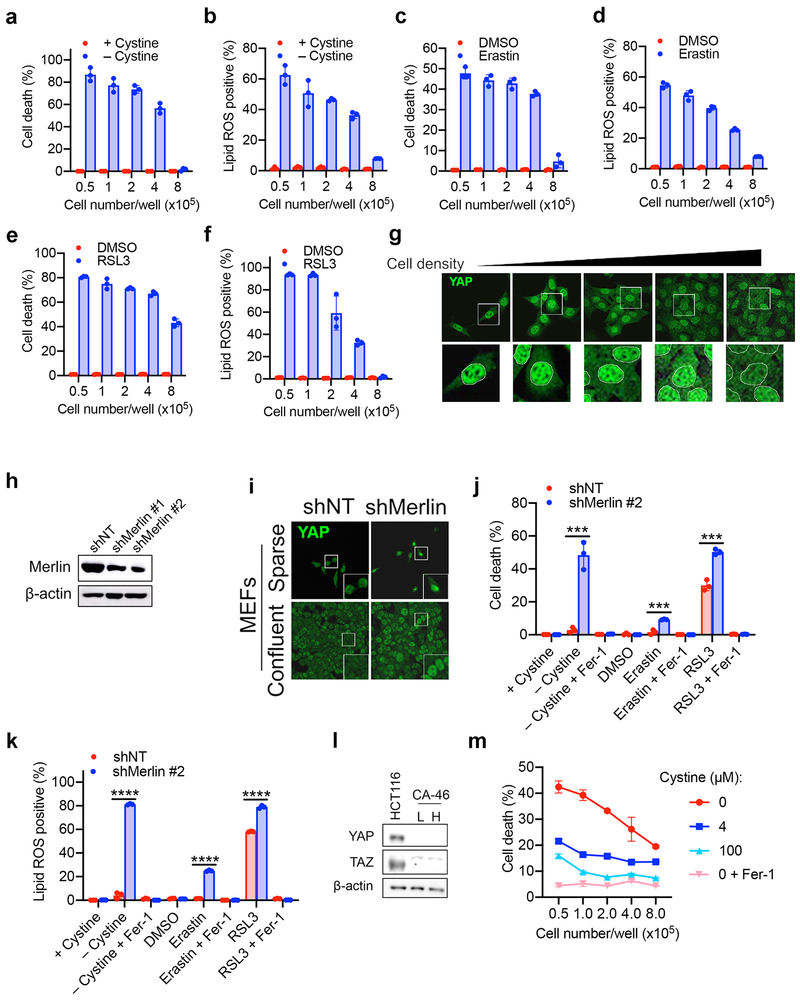
Cellular metabolism plays a crucial role in ferroptosis1,2. To further study the underlying mechanisms, we manipulated cellular metabolism by altering ingredients of culture medium or cell number in culture. Unexpectedly, we observed that cells became more resistant to ferroptosis when approaching high confluence. In HCT116 human colon cancer cells, higher cell confluence conferred resistance to ferroptosis and associated lipid peroxidation, induced by cystine starvation, cystine transporter inhibitor erastin, and GPX4 inhibitor RSL3 (Fig. 1a-b and Extended Data Fig. 1a-e). Using corresponding pharmacological inhibitors, we confirmed that cells underwent ferroptosis rather than apoptosis or necroptosis under these conditions (Extended Data Fig. 1f-g). Notably, previous published observations also suggest cell density-dependent ferroptosis: GPX4-null mouse embryonic fibroblasts (MEFs) were able to grow when seeded at high density or as 3D spheroids, but died rapidly upon passage at low density12,13.
Figure 1. E-cadherin and the Hippo pathway regulate ferroptosis in a cell density-dependent manner.
a-b, HCT116 cells were seeded with indicated density in 6-well plates and cultured for 24 h. (a) Ferroptosis was measured after cystine starvation for 30 h, by SYTOX Green staining followed by flow cytometry. (b) Lipid ROS was quantified after 24 h of cystine starvation (C11-BODIPY staining followed by flow cytometry). Data plot: mean ± s.d.; n = 3 biological replicates (same in later panels). c, 6 cell lines were seeded as indicated and treated with cystine starvation for 30 h for ferroptosis measurement. d-e, Spheroids generated from indicated cell lines were cultured for 72 h and treated with 15 μM erastin for 30 h. SYTOX Green stained dead cells (d); ATP assay measured viability (e). P-values (two tailed t-test): n.s. p=0.3757 and 0.3572 (from left to right), * p = 0.0323, ** p = 0.0086, *** p = 0.0004, **** p < 0.0001. f, Western blot of Ecad in indicated cell lines. Image represents three experiments; see Supplementary Fig. 1 for raw image (same for all other blots). g, Cystine starvation-induced ferroptosis in ΔEcad HCT116 cells and ΔEcad cells expressing full-length or ectodomain-truncated (Δecto) Ecad. P-values (one-way ANOVA): ** p=0.0025, *** p=0.0005. h, Viability of spheroids generated from indicated cells with erastin measurement. P-values (two-tailed t-test): n.s., p=0.8683, *** p=0.0004, **** p<0.0001. i, ferroptosis of HCT116 cells with indicated treatment. Fer-1, 2 µM ferrostatin-1. P-values (one-way ANOVA): n.s., p=0.6880, **** p<0.0001. Note shLats1/2#2 did not knockdown Lats2 (Extended Data Fig. 3e) and thus failed to sensitise ferroptosis. j, Lipid ROS measurement of cells as in (i). P-values (one-way ANOVA): n.s., p=0.9383, *** p=0.0001, **** p<0.0001. k, Viability of spheroids generated from HCT116 cells with indicated treatment. P-values (one-way ANOVA): ** p=0.0012, 0.0010, *** p=0.0002.
To examine if such cell density dependence is a general property of ferroptosis, we tested a panel of human epithelial cancer cell lines (Fig. 1c). Most tested cell lines showed cell density dependence, with two exceptions: MDA-MB-231 (MDA231) cells were always sensitive to ferroptosis, whereas BT474 cells always resistant, regardless of density. To better mimic the in vivo context, we cultured these cells into 3D tumour spheroids. Consistently, erastin triggered more prominent cell death in spheroids formed by MDA231 cells and H1650 cells (Fig. 1d-e). One possibility explaining this phenomenon is that high cell density more rapidly depletes glutamine (required for cysteine deprivation-induced ferroptosis4,14). However, replenishing glutamine to confluent cells failed to restore cell death (Extended Data Fig. 1h).
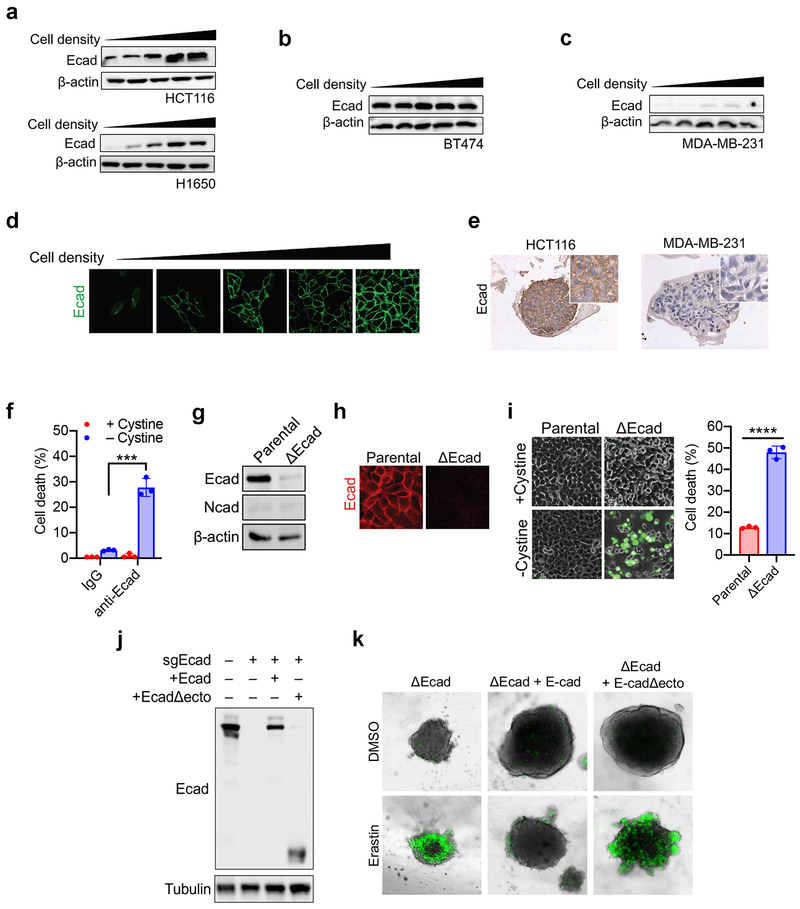
Cells tend to forge cell-cell contacts with higher cell confluence, and E-cadherin (Ecad) is an important mediator of intercellular contact in epithelial cells15. Ecad expression correlated with sensitivity to ferroptosis: Ecad was undetectable in MDA231 cells and very low in H1650 cells (Fig. 1f). As cell density increased, Ecad expression increased and became enriched at sites of cell-cell contact in cells that underwent density-dependent ferroptosis; BT474 cells, which are resistant to ferroptosis regardless of confluence, expressed high Ecad even at low cell density (Extended Data Fig. 2a-d). Strong expression of Ecad was detected in spheroids generated from HCT116 cells, but not those generated from MDA231 cells (Extended Data Fig. 2e). To further determine whether Ecad plays a causative role, we tested whether inhibition of Ecad dimerisation would sensitise confluent cells to ferroptosis. Indeed, an anti-Ecad antibody that blocks its intercellular dimerisation dramatically increased the sensitivity of confluent cells to ferroptosis (Extended Data Fig. 2f). Ecad-depletion (ΔEcad) rendered confluent HCT116 cells sensitive to ferroptosis (Extended Data Fig. 2g-i). Ecad depletion did not induce N-cadherin (Ncad) expression in HCT116 cells (Extended Data Fig. 2g). Re-expression of full-length Ecad, but not a truncated mutant lacking the ectodomain (required for Ecad intercellular dimerisation), restored resistance to ferroptosis in ΔEcad cells (Fig. 1g-h and Extended Data Fig. 2j-k).
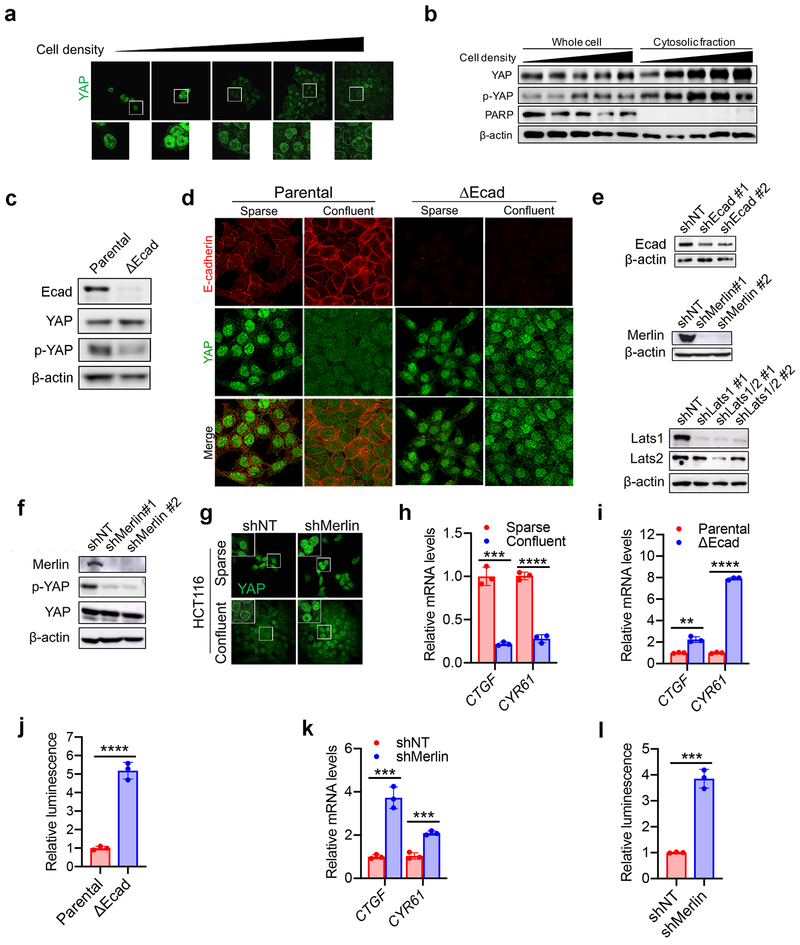
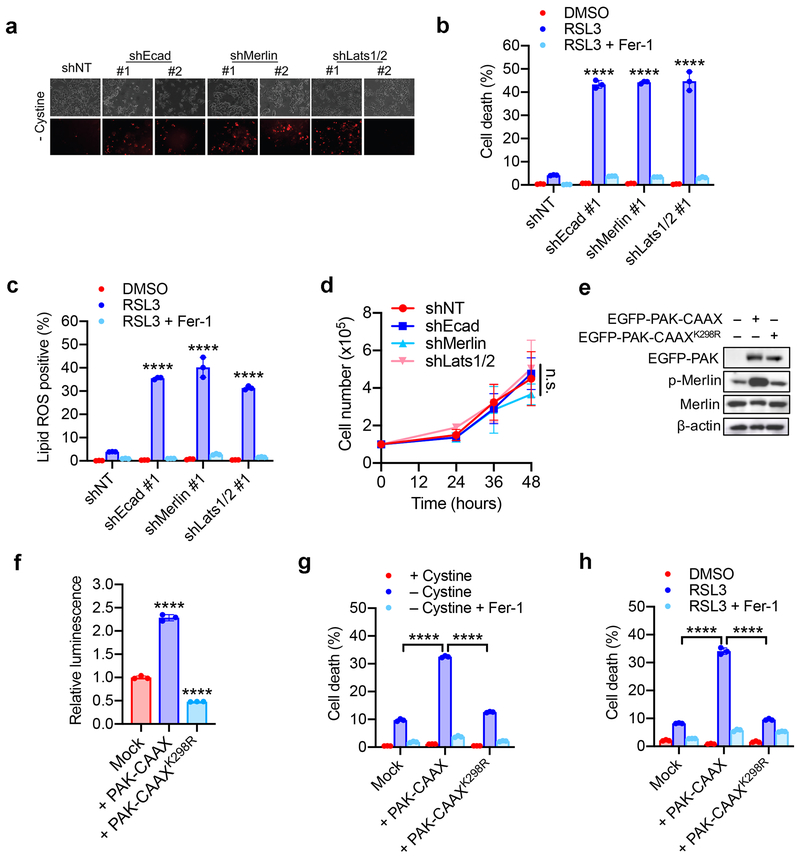
Ecad-mediated intercellular interaction can signal to the Hippo pathway16,17, which regulates a plethora of biological events, including proliferation and organ size control18,19. The Hippo pathway involves the tumour suppressor Merlin and a kinase cascade comprising Mst1/2 and Lats1/2. Merlin has been shown to activate the Hippo signalling pathway by inhibiting CRL4DCAF1, a ubiquitin ligase that promotes proteasomal degradation of Lats1/220,21. Lats1/2 phosphorylates the pro-oncogenic transcription co-activator YAP, leading to its nuclear exclusion and inactivation. As expected, as HCT116 cells grew more confluent, increased phosphorylation and decreased nuclear localisation of YAP were observed (Extended Data Fig. 3a-b); Ecad knockout or Merlin RNAi diminished cell density-regulated nuclear exclusion of YAP (Extended Data Fig. 3c-g, Supplementary Table 1). To further confirm that YAP is functionally activated under these conditions, we used an 8xGTIIC-luciferase reporter assay that monitors transcriptional activity of YAP with its primary binding partners, the TEAD family of transcription factors22. Low cell density, loss of Ecad, or Merlin RNAi all increased YAP activity and upregulated transcription of canonical YAP targets CTGF and CYR61 (Extended Data Fig. 3h-l). Knockdown of Ecad, Merlin, and Lats1/2 all sensitised HCT116 cells to ferroptosis in culture and spheroids (Fig. 1i-k and Extended Data Fig. 4a-c). Importantly, knockdown of Ecad, Merlin, and Lats1/2 did not decrease cell proliferation within the time frame of the experiment, ruling out the possibility that increased ferroptosis was due to reduced cell confluence (Extended Data Fig. 4d). Additionally, p21-activated kinase (PAK) can phosphorylate and inactivate Merlin17. Consistently, constitutively active PAK, but not its inactive mutant, enhanced YAP activity and ferroptosis (Extended Data Fig. 4e-h). Taken together, Ecad and Hippo signalling negatively regulate ferroptosis.
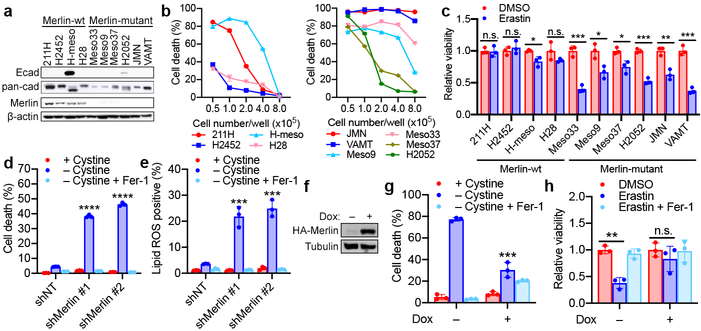
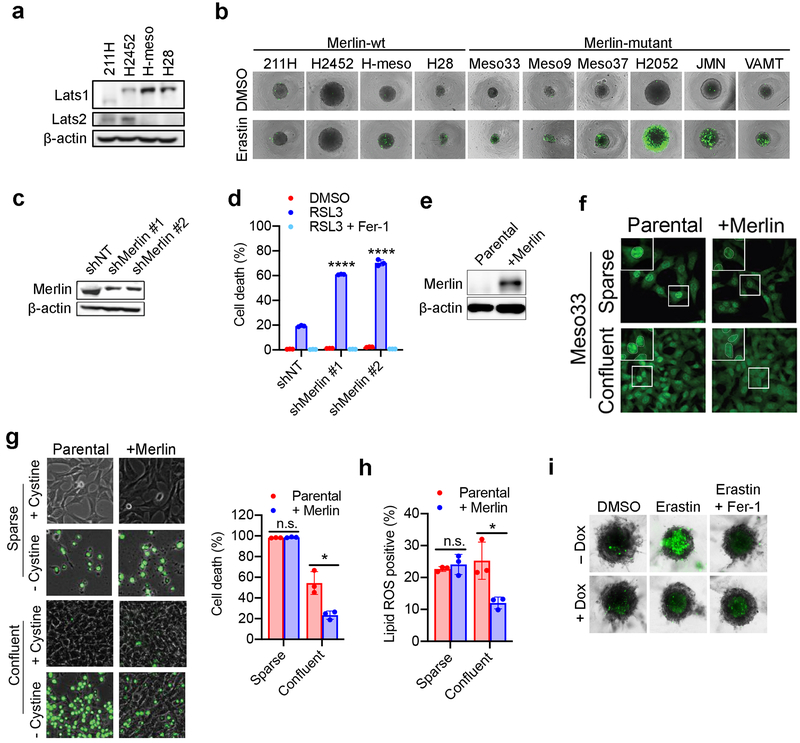
Heterozygous deletion and loss-of-function mutations of the Merlin-encoding gene NF2 are detected with high frequency in malignant mesothelioma (MM), and inactivation of either Merlin or Lats1/2 is observed in ~50% of MM patients10,11. We assessed Merlin status and ferroptosis sensitivity in a cohort of human MM cell lines. Of 10 patient-derived cell lines we examined, 4 are Merlin-wild type (wt) and 6 are Merlin-defective21 (Fig. 2a). All Merlin-wt cells expressed a cadherin protein (not necessarily Ecad) and either Lats1 or Lats2 (Fig 2a and Extended Data Fig. 5a). Several Merlin-mutant cell lines can undergo potent ferroptosis even at the highest tested density and in spheroids, while all Merlin-wt cells were relatively insensitive to ferroptosis under the same conditions (Fig. 2b-c and Extended Data Fig. 5b). Consistently, Merlin RNAi sensitised confluent Merlin-wt 211H cells to ferroptosis (Fig. 2d-e and Extended Data Fig. 5c-d), and Merlin reconstitution in confluent, Merlin-defective Meso33 cells decreased nuclear localisation of YAP and mitigated ferroptosis (Extended Data Fig. 5e-h). Further, we generated a doxycycline (Dox)-inducible system to express Merlin in Meso33 cells (Fig. 2f). Indeed, Dox-induced Merlin restoration inhibited ferroptosis at high density and in a spheroid model (Fig. 2g-h and Extended Data Fig. 5i).
Figure 2. Merlin mediates cell density-dependent inhibition of ferroptosis in mesothelioma cells.
a, Western blot assessing Ecad, pan-cadherin, and Merlin expression in a panel of mesothelioma cell lines cultured at high confluence. b, Merlin-wt (left) or Merlin-mutant (right) mesothelioma cells were seeded at the indicated densities. Cell death was measured after 24 h of cystine starvation. Data are plotted as mean ± s.d.; n = 3 biological replicates. c, Spheroids grown from the indicated cell lines were treated with 10 μM erastin for 24 h before viability measurement. Data are plotted as mean ± s.d.; n = 3 biological replicates. P-values were acquired by two-tailed t-test, n.s. p=0.8860, 0.4981, 0.1474, * p=0.0203, 0.0180, 0.0162, ** p=0.0033, *** p=0.0005, 0.0001, 0.0003. d, Confluent cells were treated with media lacking cystine with or without Fer-1 for 24 h. Data are plotted as mean ± s.d.; n = 3 biological replicates. P-values were acquired by one-way ANOVA, **** p<0.0001. e, Lipid ROS measurement after 18 h of treatment. Data are plotted as mean ± s.d.; n = 3 biological replicates. P-values were acquired by one-way ANOVA, *** p=0.0005, 0.0002. f, Western blot confirming expression of Merlin in Meso33 cells containing Dox-inducible Merlin following 48 h of treatment with 1 µg/ml Dox. g, Cells in the presence or absence of Dox were treated with cystine starvation for 12 h. Data are plotted as mean ± s.d.; n = 3 biological replicates. P-values were acquired by two-tailed t-test, *** p=0.0003. h, Spheroids were grown in the presence or absence of Dox for 72 h, at which point 10 µM erastin was added. After 24 h, viability was measured. Data are plotted as mean ± s.d.; n = 3 biological replicates. P-values were acquired by two-tailed t-test, n.s., p=0.3393, ** p=0.0010.
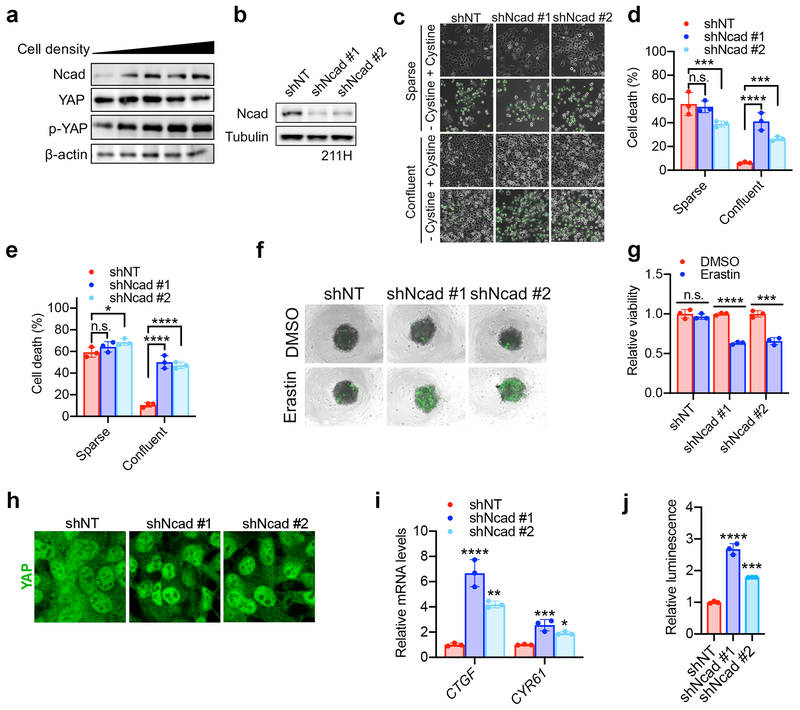
Of the Merlin-wt mesothelioma cells, only H-meso cells expressed Ecad (Fig. 2a). 211H cells express Ncad in a cell density-dependent manner (Extended Data Fig. 6a). We found that Ncad was similarly able to suppress ferroptosis in these cells and signal through the Merlin-YAP axis (Extended Data Fig. 6b-k). We also observed cell density-dependent, Merlin-regulated ferroptosis in MEFs, which are not of epithelial origin (Extended Data Fig. 7a-k). Intriguingly, we also observed a modest effect of cell density in a Burkitt lymphoma cell line, which does not express YAP or its homolog TAZ (Extended Data Fig 7l-m), suggesting an alternative mechanism (cystine production via transsulfuration might be a contributor as reported previously23).
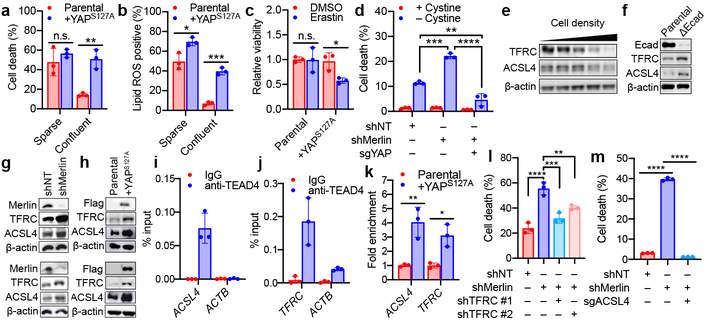
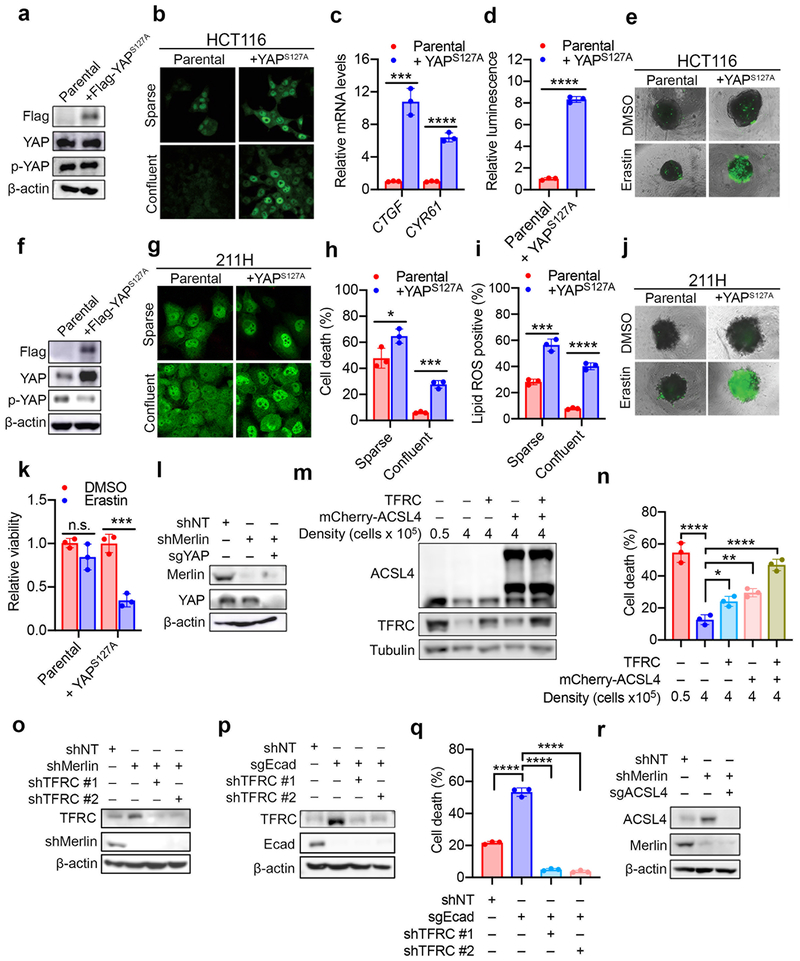
The exquisite correlation between YAP activity and Ecad/Merlin-regulated ferroptosis prompted us to perform additional functional experiments to determine whether YAP promotes ferroptosis. The YAPS127A mutant cannot be phosphorylated by Lats1/2 at the S127 residue, thus enhancing nuclear retention and transcriptional co-regulatory activity even at high density20,24,25 (Extended Data Fig. 8a-d). HCT116 or 211H cells expressing YAPS127A were markedly more sensitive to ferroptosis at high density or in spheroids (Fig. 3a-c and Extended Data Fig. 8e-k). HCT116 cells lacking YAP were no longer sensitised to ferroptosis following Merlin RNAi (Fig. 3d and Extended Data Fig. 8l), demonstrating that Merlin suppresses ferroptosis by inhibiting YAP activity.
Fig. 3. The transcriptional regulatory activity of YAP promotes ferroptosis.
a, Cells were cultured as indicated. Cell death was measured after 24 h of cystine starvation. Data plot: mean ± s.d.; n = 3 biological replicates (same for other panels). P-values (two-tailed t-test): n.s., p=0.3525, ** p=0.0031. b, Lipid ROS was measured after 16 h of cystine starvation. P-values (two-tailed t-test): * p=0.0202, *** p=0.0001. c, Spheroids generated from parental HCT116 cells and YAPS127A-overexpressing cells were treated as indicated for viability measurement. P-values (two-tailed t-test): n.s., p=0.9571, * p=0.0200. d, Ferroptosis of indicated cells. P-values (one-way ANOVA): ** p=0.0043, *** p=0.0004, **** p<0.0001. e, 211H cells were seeded at increasing density and expression of TFRC and ACSL4 were assessed. f, TFRC and ACSL4 in parental and ΔEcad HCT116 cells. g, TFRC and ACSL4 in shNT/shMerlin HCT116 (top) or 211H (bottom) cells. h, TFRC and ACSL4 in HCT116 (top) and 211H (bottom) cells expressing YAPS127A. i, TEAD4 binding to the ACSL4 promoter in 211H cells was assessed by ChIP analysis using control immunoglobulin G (IgG) and an anti-TEAD4 antibody. Values are percent of input. qPCR primers were designed based on TEAD4 binding peak regions depicted in the ENCODE TEAD4 ChIP-seq datasets. j, TEAD4 binding to the promoter region of TFRC was analysed as described in (i). k, ChIP monitoring the occupancy of TEAD4 on ACSL4 and TFRC promoters in parental or YAPS127A-overexpressing 211H cells. The enrichment was calculated based upon qPCR relative to the IgG control. P-values (two-tailed t-test): * p=0.0103, ** p=0.0079. l, Cell death measurement in cells treated with cystine starvation and indicated shRNAs. P-values (one-way ANOVA): ** p=0.0072, *** p=0.0004, **** p<0.0001. m, Cell death measurement in cells treated with cystine starvation, and indicated shRNA and/or sgRNA, for 30 h. P-values (one-way ANOVA): **** p<0.0001.
Subsequently, we examined a battery of putative YAP-TEAD gene targets that are known ferroptosis regulators. Putative YAP-TEAD gene targets were selected from TEAD4 ENCODE ChIP-seq datasets GSM1010875 and GSM1010868. Among these genes, we validated that transferrin receptor 1 (TFRC) and acyl-CoA synthetase long chain family member 4 (ACSL4), both critical mediators of ferroptosis14,26, are true targets of the YAP-TEAD complex. Expression of TFRC and ACSL4 decreased with increasing cell density, and TFRC and ACSL4 were upregulated by Ecad depletion, Merlin knockdown, or YAPS127A overexpression (Fig. 3e-h). TEAD4 binds to the promoter regions of TFRC and ACSL4 genes, and binding was enhanced by YAPS127A overexpression (Fig. 3i-k). Confluent HCT116 cells were sensitised to ferroptosis following expression of either TFRC or ACSL4, and co-expression of both further enhanced cell death (Extended Data Fig. 8m-n). Conversely, reduced expression of TFRC or ACSL4 mitigated ferroptosis in sensitised cells (Fig 3l-m and Extended Data Fig. 8o-r). Together, these data indicate that upregulation of TFRC and ACSL4 contributes to the ability of YAP to promote ferroptosis. Notably, co-overexpression of TFRC and ACSL4 failed to restore ferroptosis in confluent cells to the level of that in sparse cells, even when the ectopic ACSL4 level was higher than that in sparse cells (Extended Data Fig. 8m-n), suggesting additional YAP target genes contribute to this process.
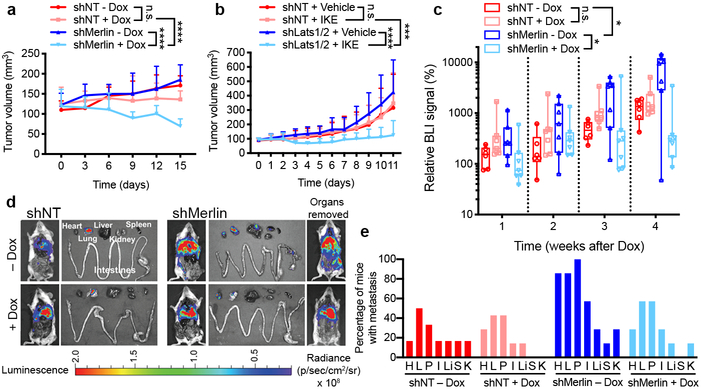
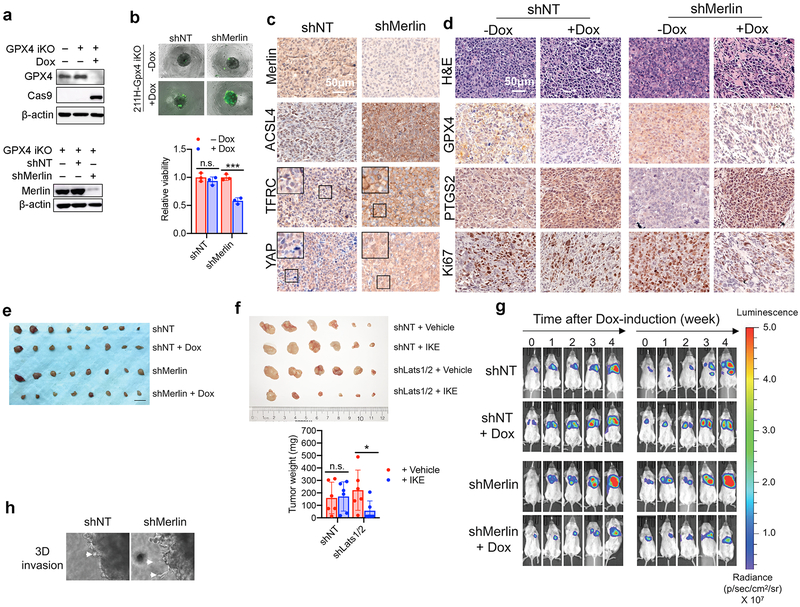
As loss of Merlin frequently drives mesothelioma10,11, we examined whether Merlin status could predict mesothelioma sensitivity to ferroptosis. We generated Dox-inducible, CRISPR/Cas9-mediated GPX4 knockout (GPX4-iKO) 211H cells harbouring non-targeting shRNA (shNT) or Merlin shRNA (shMerlin) (Extended Data Fig. 9a). Spheroids cultured from shMerlin cells were more sensitive than shNT cells to GPX4 knockout-induced ferroptosis (Extended Data Fig. 9b). We then used shNT-GPX4-iKO cells and shMerlin-GPX4-iKO cells to produce subcutaneous xenograft tumours in athymic nude mice. In tumours, Merlin knockdown increased TFRC and ACSL4 expression, and nuclear YAP (Extended Data Fig. 9c). Dox feeding sharply reduced GPX4 expression in tumours, and in shMerlin tumours, an increase in the ferroptosis marker PTGS23 and a reduced proliferation (Ki67 staining) (Extended Data Fig. 9d). Importantly, upon Dox feeding, shMerlin tumours receded whereas shNT tumours only showed a decrease in growth (Fig. 4a and Extended Data Fig. 9e). Similarly, Lats1/2 knockdown rendered xenograft tumours generated by HCT116 cells significantly more sensitive to imidazole ketone erastin (IKE), an erastin derivative amenable for use in vivo27 (Fig. 4b and Extended Data Fig. 9f).
Fig. 4. Merlin dictates GPX4 dependency in murine models of mesothelioma.
a, Growth curves of tumours derived from GPX4iKO-shNT or GPX4iKO-shMerlin 211H cells injected subcutaneously into nude mice fed with doxycycline diet or normal diet (n = 8 per group). Data are plotted as mean ± s.d.; P-values were acquired by two-way ANOVA, n.s., p=0.6776 **** p<0.0001. b, The indicated HCT116 cells were injected subcutaneously into nude mice (n = 6 per group). Tumours were grown to a volume of 90 mm3, at which point 50 mg/kg imidazole ketone erastin (IKE) was administered intraperitoneally daily for 12 days. Data are plotted as mean ± s.d.; P-values were acquired by two-way ANOVA, n.s., p=0.9808, *** p=0.0001, **** p<0.0001. For knockdown efficiency of Lats1/2, see Extended Data Fig. 3e. c, GPX4iKO-shNT or GPX4iKO-shMerlin 211H were orthotopically injected into the pleural cavity of mice. Relative BLI signal (photons per second) percentage change versus time-point 0; n = 6 (shNT-Dox) or 7 mice for each group. Data are plotted as box and whisker plots, with a line at the median value. Boxes represent the interquartile range, and whiskers represent the range of values. P-values were acquired by two-way ANOVA, n.s., p=0.1545, * p=0.0237, 0.0287. d, Bioluminescence imaging in excised organs, and in mouse bodies before and after organs were removed. e, Percentage of mice in each group with metastases in excised organs. shNT-Dox: n=6; shNT+Dox, shMerlin-Dox, shMerlin-Dox: n=7. H, heart. L, lung. P, peritoneum. I, intestines/mesenteric lymph nodes. Li, liver. S, spleen. K, kidneys.
We next developed an intrapleural mouse model of mesothelioma, by orthotopically implanting shMerlin-GPX4-iKO or shNT-GPX4-iKO cells harbouring a retroviral TK-GFP-Luciferase (TGL) reporter. shMerlin-GPX4-iKO cells grew more aggressively than shNT-GPX4-iKO cells in mice, consistent with the tumour suppressive nature of Merlin; Dox feeding reduced growth of shMerlin tumours, while shNT tumours were unaffected (Fig. 4c and Extended Data Fig. 9g). After sacrificing, various organs were excised for bioluminescence imaging. shNT tumours grew within the pleural cavity, attaching to the aortic arch, lung or thoracic muscles, whereas shMerlin tumours metastasized to the pericardium, peritoneum, abdominal organs including liver, intestine and distal lymph nodes (Fig. 4d-e), consistent with previous reports that Merlin loss enhances metastasis of mesothelioma10. Supporting this notion, spheroids cultured from shMerlin cells extended more finger-like protrusions into Matrigel (Extended Data Fig. 9h). Importantly, the metastatic capability of shMerlin tumours was reduced by Dox-induced GPX4 knockout (Fig. 4d-e). Therefore, Merlin status might be useful as a biomarker to predict mesothelioma metastasis and responsiveness to the induction of ferroptotic cell death.
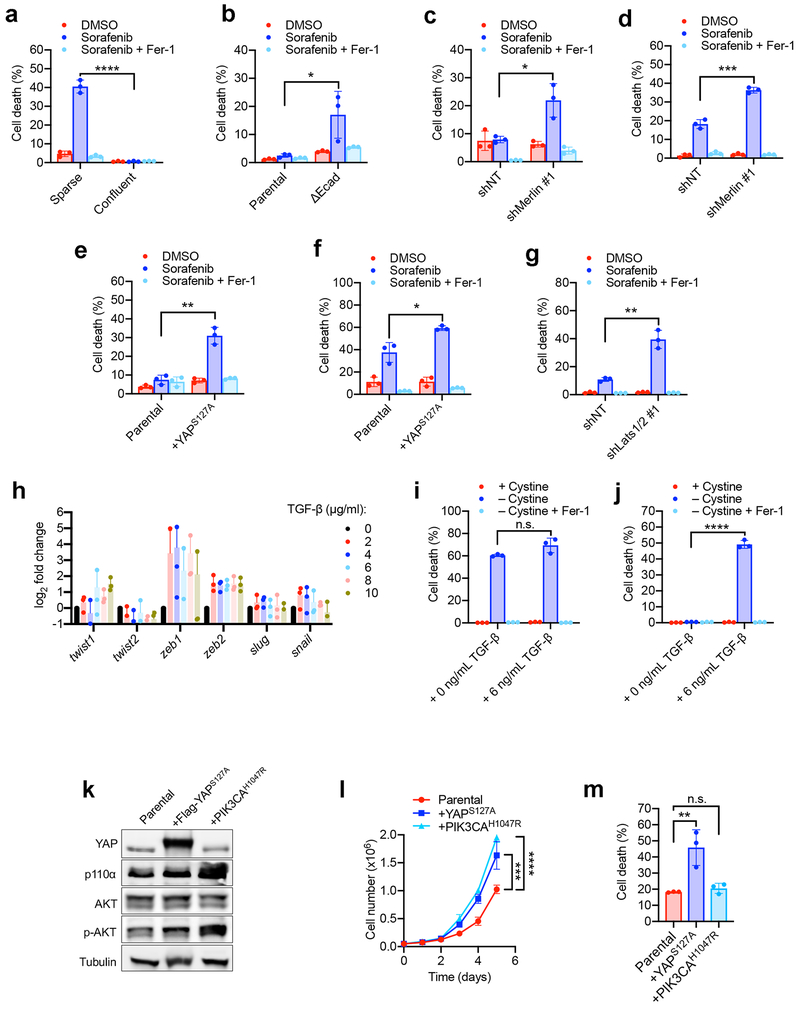
Sorafenib, an orally administered multi-kinase inhibitor used for the treatment of hepatocellular carcinoma and renal cell carcinoma, also induces ferroptosis via system xc- inhibition28. The potential for sorafenib as a therapy for MM has been tested in clinical trials. The results suggest that sorafenib can stabilise the disease but only achieves responses in a small proportion of unselected patients29,30. However, these trials did not examine the genetic status of the Merlin-Hippo pathway. We found that sorafenib induced ferroptosis in a cell density and Hippo signalling-dependent manner (Extended Data Fig. 10a-g). Additionally, in epithelial cancer cells, decreased Ecad, Merlin, or Hippo pathway activity, and enhanced YAP activation can promote EMT and metastasis19. Consistently, as TGF-β can induce expression of multiple EMT genes, it also enhanced ferroptosis in mammary tumour cells isolated from MMTV-neu mice at high cell density (Extended Data Fig 10h-j).
Collectively, we describe here a non-cell autonomous mechanism for the regulation of ferroptosis: neighbouring cells can have a significant impact on decision making of ferroptosis via the cadherin-Merlin-Hippo-YAP signalling axis. Considering that multicellular organisms are under frequent insult of oxidative stress, this intercellular mechanism might represent another layer of crucial defence to protect themselves from ferroptosis, a terminal consequence of oxidative stress.
Since cellular metabolism plays a crucial role in ferroptosis, and enhanced proliferation often leads to stronger metabolism, could proliferation-stimulating oncogenic mutation be a good predictor of ferroptosis sensitivity? Previous publications argue against this view. For example, loss of function of tumour suppressors p53 and BAP1 increases resistance, instead of sensitivity, to ferroptosis5,7. Further, unlike YAPS127A, overexpression of the oncogenic PIK3CAH1047R mutant failed to sensitise confluent 211H cells to ferroptosis, although both increased proliferation (Extended Data Fig. 10k-m). Taken together, oncogenic mutations may impact ferroptosis by mechanisms other than enhancing proliferation.
As the cadherin-Merlin-Hippo-YAP signalling axis is frequently mutated in cancer, this study has clear cancer therapeutic implications – malignant alterations of multiple components in this signalling axis all sensitise cancer cells to ferroptosis. A potential concern about the feasibility of ferroptosis-inducing cancer therapy is whether there is any selectivity of the ferroptosis-inducing agents toward cancer cells over normal tissue. Our finding suggests that there might be a dose-responsive window for cancers harbouring certain genetic signatures, and that ferroptosis-inducing cancer therapies, if becoming available (IKE and sorafenib hold potential for this purpose), might have significant benefits in overcoming cancer resistance to current treatments.
METHODS
Cell culture
Mouse Embryonic Fibroblasts (MEFs), mouse NF639 cells, human epithelial tumour cells, and human mesothelioma cells were cultured in Dulbecco’s Modified Eagle Medium (DMEM) containing 10% fetal calf serum (FCS), 2 mM L-glutamine, 100 units/ml penicillin and 100 μg/ml streptomycin. CA-46 Burkitt lymphoma cells were cultured in RPMI media supplemented with 20% serum and 100 units/ml penicillin and 100 µg/ml streptomycin. The mesothelioma cell line panel was a gift from the Giancotti Lab (MD Anderson Cancer Center, Houston, TX). Media was prepared by the MSKCC Media Preparation Core Facility. All cell lines were subjected to STR authentication through ATCC and were tested for mycoplasma contamination.
Generation of Three-dimensional Spheroids
Spheroids were generated by plating tumour cells at 103/well into U-bottom Ultra Low Adherence (ULA) 96-well plates (Corning, Tewksbury, MA, USA). Optimal three-dimensional structures were achieved by centrifugation at 600 g for 5 min followed by addition of 2.5% Matrigel (Corning). Plates were incubated for 72 h at 37°C, 5% CO2, 95% humidity for formation of a single spheroid of cells. Spheroids were then treated with erastin in fresh medium containing Matrigel for the indicated time.
Induction and inhibition of ferroptosis
To induce ferroptosis, cells with different density were seeded in 6-well plates. For cystine-starvation experiments, cells were washed with PBS twice and then cultured in cystine-free medium in the presence of 10% (v/v) dialyzed FBS for the indicated time. The ferroptosis inducing compounds erastin and RSL3 and the ferroptosis inhibitor Ferrostatin-1 were purchased from Sigma-Aldrich (St. Louis, MO, USA).
Measurement of cell death, cell viability and lipid peroxidation
Cell death was analysed by propidium iodide (Invitrogen, Waltham, MA, USA) or SYTOX Green (Invitrogen) staining followed by microscopy or flow cytometry. For 3D spheroids, cell viability was determined using the CellTiter-Glo® 3D Cell Viability Assay (Promega, Madison, WI, USA) according to the manufacturer’s instructions. Viability was calculated by normalizing ATP levels to spheroids treated with normal full media. To analyze lipid peroxidation, cells were stained 5 μM BODIPY-C11 (Invitrogen) for 30 minutes at 37°C followed by flow cytometric analysis. Lipid ROS positive cells are defined as cells having fluorescence greater than 99% of the unstained sample.
Immunoblotting
Nuclear and non-nuclear (membranes and cytosol) fractions were prepared as previously described. Proteins in the cell lysate were resolved on 8% or 15% SDS-PAGE gels and transferred to a nitrocellulose membrane. Membranes were incubated in 5% skim milk for 1 hour at room temperature and then with primary antibodies diluted in blocking buffer at 4°C overnight. The following primary antibodies were used: rabbit anti-GPX4, mouse anti E-cadherin, rabbit anti-N-cadherin, rabbit anti-Merlin, rabbit anti-transferrin receptor (Abcam, Cambridge, MA, USA), mouse anti-β-actin, mouse anti-Flag, mouse anti-HA (Sigma-Aldrich), rabbit anti-Merlin, rabbit anti-phospho-Merlin (Ser518), rabbit anti-Lats1, rabbit anti-Lats2, rabbit anti-YAP, rabbit anti-phospho-YAP (Ser127), mouse anti-Cas9, rabbit anti-p110α, mouse anti-AKT, rabbit anti-phospho-AKT (Ser473), rabbit anti-TAZ, rabbit anti-pan cadherin (Cell Signaling, Danvers, MA, USA), rabbit anti-ACSL4 (Thermo Fisher, Waltham, MA, USA), mouse anti-α-tubulin (Calbiochem, San Diego, CA, USA), rabbit anti-GFP (Invitrogen). Goat anti-mouse or donkey anti-rabbit IgG (Invitrogen) conjugated to horseradish peroxidase and an Amersham Imager 600 (GE Healthcare Life Sciences, Marlborough, MA, USA) were used for detection. Representative blots of at least two independent experiments are shown. After three washes, the membranes were incubated with goat anti-mouse HRP-conjugated antibody or donkey anti-rabbit HRP-conjugated antibody at room temperature for 1 hour and subjected to chemiluminescence using Clarity™ Western ECL Substrate (Bio-Rad, Hercules, CA, USA).
Plasmids and cloning
pWZL Blast mouse E-cadherin and pWZL Blast DN E-cadherin were from the Weinberg Lab (Addgene plasmids # 18804 and 18800, respectively). pRK5-Flag-HA-Merlin was from the Giancotti Lab (Addgene plasmid # 27104). 8xGTIIC-luciferase was from the Piccolo lab (Addgene plasmid # 34615). mCherry-TFR-20 was from the Davidson lab (Addgene plasmid # 55144). pQCXIH-Flag-YAP-S127A was from the Guan Lab (Addgene plasmid # 33092). pBABE-Flag-HA-Merlin was generated by PCR from pRK5-Flag-HA-Merlin (primers listed in Supplementary Table 2), digested by PacI and EcoRI FastDigest restriction enzymes (Thermo Fisher), and ligated into the empty pBABE-puro backbone using T4 ligase (NEB, Ipswich, MA, USA). FUW-tetO-Flag-HA-Merlin was created by digesting pRK5-Flag-HA-Merlin with EcoRI and XbaI and was ligated into the FUW-tetO-MCS vector from the Piccolo lab (Addgene plasmid # 84008). FUW-m2rtTA was from the Jaenisch lab (Addgene plasmid # 20342). PIK3CAH1047R was a gift from the Cantley lab (Weill Cornell Medicine, New York, NY).
Gene Silencing and Expression
Lentiviral vectors encoding shRNAs targeting human E-cadherin, human N-cadherin, human and mouse Merlin, human Lats1 and Lats2, and human TFRC were generated by core facility of MSKCC and listed in Supplementary Table 1. Lentiviruses were produced by the co-transfection of the lentiviral vector with the Delta-VPR envelope and CMV VSV-G packaging plasmids into 293T cells using PEI. Media was changed 12 hours after transfection. The supernatant was collected 48 hours after transfection and passed through a 0.45 µm filter to eliminate cells. Cells were incubated with infectious particles in the presence of 4 μg/ml polybrene (Sigma-Aldrich) overnight and cells were given fresh complete medium. After 48 hours, cells were placed under the appropriate antibiotic selection.
Generation of constitutive and inducible CRISPR/Cas9-mediated Gene Knockouts
E-cadherin, YAP, and ACSL4 depleted cells were generated with CRISPR/Cas9-mediated knockout system. HCT116 cells were transfected with a human E-cadherin CRISPR/Cas9 KO plasmid (sc-400031), and HCT116-shMerlin cells were transfected with a human YAP CRISPR/Cas9 KO plasmid (sc-400040 or a human ACSL4 CRISPR/Cas9 KO plasmid (sc-401649), all purchased from Santa Cruz Biotechnology. Target sequence was a pool of three different gRNA plasmids located within the coding DNA sequence fused to Streptococcus pyogenes Cas9, and GFP. Single GFP+ cells were sorted using a BD FACSAria II cytometer (BD Biosciences, Franklin Lakes, NJ, USA) to 96-well plate and single-cell clones were tested by Western blotting.
The lentiviral doxycycline-inducible FLAG-Cas9 vector pCW-Cas9 and pLX-sgRNA were from Eric Lander & David Sabatini (Addgene plasmids # 50661 and 50662, respectively). Guide RNA sequence CACGCCCGATACGCTGAGTG was used to target human Gpx4. To construct the lentiviral sgRNA vector for Gpx4, a pair of oligonucleotides (Forward and Reverse) was annealed, phosphorylated and ligated into pLX-sgRNA. Lentiviral particles containing the sgRNA or Cas9 vectors were produced by co-transfection of the vectors with the Delta-VPR envelope and CMV VSV-G packaging plasmids into 293T cells using PEI. Media was changed 12 hours after transfection and supernatant was collected 48 hours after transfection. MSTO-211H cells in 6-well tissue culture plates were infected in pCW-Cas9 virus-containing supernatant containing 4 µg/ml of polybrene. 24 hours after infection, virus was removed, and cells were selected with 2 μg/ml puromycin. Single clones were screened for inducible Cas9 expression. 2 μg/ml doxycycline was added to the culture media for 3 days. Single clones with Cas9 expression were infected with Gpx4 gRNA virus-containing supernatant containing 8 μg/ml polybrene. Twenty-four hours after infection, virus was removed, and cells were selected with 10 μg/ml blasticidin. Single clones with doxycycline-inducible Cas9 expression and Gpx4 knockout were amplified for further experiments, named Gpx4 iKO MSTO-211H cells.
ChIP assay
Cells were crosslinked in 0.75% formaldehyde for 15 min, then glycine was added to a final concentration of 125 mM for 5 min. After wash with cold PBS, cells were collected in PBS and sonicated on an ultrasonic homogenizer for 10 min at 20% power on ice to shear DNA to an average fragment size of 200–1000 bp. Fifty μL of each sonicated sample was removed to determine DNA concentration and fragment size. Cell lysates were incubated overnight with 20 μL Magna ChIP™ Protein A+G Magnetic Beads (EMD Millipore, Burlington, MA, USA) and 10 µg ChIP grade TEAD4 antibody (Abcam) at 4°C. Beads were collected, washed and treated with Proteinase K for 2 h at 60°C and RNase for 1 h at 37°C. DNA was purified with a PCR purification kit (Qiagen, Germantown, MD, USA). DNA fragments were assessed by qRT–PCR using the primer sequences listed in Supplementary Table 2. Samples were normalized to input DNA.
RNA extraction and qRT-PCR
RNA was extracted using the TRIzol reagent (Invitrogen). 20% chloroform was added to each sample, vortexed briefly, and incubated at room temperature for 15 min. Samples were then centrifuged at high speed at 4°C for 15 min. The aqueous phase was moved to a new tube and an equal volume of isopropanol was added. Samples were incubated at room temperature for 10 min, followed by centrifugation at high speed at 4°C for 10 min. Pellets were washed in 95% ethanol, dried, and resuspended in nuclease-free water. cDNA was synthesized using iScript™ cDNA Synthesis Kit according to the manufacturer’s instructions (Bio-Rad). qRT-PCR was performed with IQ™ SYBR® Green Supermix (Bio-Rad) in a CFX Connect Real-Time PCR Detection System (Bio-Rad). The sequences of primers used are listed in Supplementary Table 2.
In Vivo Xenograft Mouse Study
Gpx4 iKO MSTO-211H cells were infected with lentiviral vectors encoding shRNAs targeting human Merlin or shNT (GeneCopoeia, Rockville, MD, USA). The resulting cells were called shNT-Gpx4 iKO MSTO-211H cells and shMerlin-Gpx4 iKO MSTO-211H cells. Six- to eight-week-old female athymic nu/nu mice were purchased from Envigo (East Millstone, NJ, USA). For s.c. tumour models, mice were injected in the right flank with 1 × 10⁷ shNT-GPX4 iKO MSTO-211H cells or shMerlin-GPX4 iKO MSTO-211H cells suspended in 150 μL Matrigel. Tumours were measured with callipers every 3 days. When tumours reached a mean volume of 100 mm3, mice with similarly sized tumours were grouped into four treatment groups. For control or knockout cohorts, mice were given intraperitoneal (i.p.) injections of 0.9% sterile saline or Doxycycline (100 mg/kg body weight) for two days. At the same time, mice were provided with either a normal diet or Doxycycline diet for control or knockout cohorts, respectively. For all experiments, mice were sacrificed at a pre-determined endpoint. According to the Institutional Animal Care and Use Committee (IACUC) protocol for these experiments, once any tumour exceeded a volume of 1000 mm3, 1.5 cm in diameter, or 10% of body weight, the mice would immediately be euthanized. At the end of the study, mice were euthanized with CO2 and tumours were taken for immunohistochemical staining. Results are presented as mean tumour volume ± SD.
For shLats1/2 s.c. tumour models, female athymic nu/nu mice aged 6 to 8 weeks were injected in the right flank with 2 × 10⁶ shNT HCT116 cells or shLats1/2 HCT116 cells. Tumours were measured with callipers daily. When tumours reached a mean volume of 90 mm3, mice were randomized into four groups and treated with vehicle (65% D5W (5% dextrose in water), 5% Tween-80, 30% PEG-400) or 50 mg/kg IKE (65% D5W (5% dextrose in water), 5% Tween-80, 30% PEG-400) via IP injection once a day. At the end of the study, mice were euthanized with CO2 and tumours were taken for measurement of weight. According to the Institutional Animal Care and Use Committee (IACUC) protocol for these experiments, once any tumour exceeded a volume of 1000 mm3, 1.5 cm in diameter, or 10% of body weight, the mice would immediately be euthanized.
All protocols for animal experiments were approved by the Memorial Sloan Kettering Cancer Center Institutional Animal Care and Use Committee (IACUC).
Orthotopic pleural mesothelioma animal model
ShNT-Gpx4 iKO MSTO-211H cells and shMerlin-Gpx4 iKO MSTO-211H cells were infected with retroviral TK-GFP-Luciferase reporter vector (TGL). To develop the orthotopic mouse model of pleural mesothelioma, female NOD/SCID mice (Envigo, Somerset, NJ) aged 6 to 8 weeks were used. Mice were anesthetized using inhaled isoflurane and oxygen. Intrapleural injection of 2×10⁶ shNT-Gpx4 iKO-TGL MSTO-211H cells or shMerlin-Gpx4 iKO-TGL MSTO-211H cells in 100 μl of serum-free medium via a left thoracic incision was performed to establish the orthotopic mesothelioma tumour model. Tumour growth was monitored by weekly bioluminescence imaging (BLI) for luciferase and mice were monitored daily for survival. Nod/Scid mice bearing tumours were anesthetized using isoflurane and injected i.p. with 50 mg/kg D-luciferin (Molecular Probes, Carlsbad, CA, USA). BLI was measured with 18 filters (500–840 nm) in an IVIS Spectrum (PerkinElmer, Waltham, MA, USA) 10 min after injection. During image acquisition, mice were maintained on isoflurane via nose cone. Bioluminescence images were acquired using an IVIS Spectrum. BLI signal was reported as total flux (photons per second), which represents the average of ventral and dorsal flux. At the end-point of the study, the animals were injected with D-luciferase and sacrificed 10 min later. Organs were exposed and BLI was measured. After organs were excised, BLI images were taken again as described. Imaging analysis was performed using the Living Image software (Caliper Life Sciences, Waltham, MA, USA) All protocols for animal experiments were approved by the Memorial Sloan Kettering Cancer Center Institutional Animal Care and Use Committee (IACUC).
Immunohistochemistry
Formalin-fixed, paraffin-embedded specimens were collected, and a routine H&E slide was first evaluated. Immunohistochemical staining was done on 5 μm-thick paraffin-embedded sections using mouse anti-Merlin (Abcam), rabbit anti-GPX4 (Abcam), rabbit anti-PTGS2 (Cell Signaling), mouse anti-Ki67 (Cell Signaling), rabbit anti-ACSL4 (Thermo Fisher), rabbit anti-TFRC (Abcam), and rabbit anti-YAP (Cell Signaling) antibodies with a standard avidin-biotin HRP detection system according to the instructions of the manufacturer (anti-mouse/rabbit HRP-DAB Cell & Tissue Staining Kit, R&D Systems Minneapolis, MN). Tissues were counterstained with haematoxylin, dehydrated, and mounted. In all cases, antigen retrieval was done with the BD Retrievagen Antigen Retrieval Systems as per instructions of the manufacturer.
Tumour Spheroid Invasion Assay
Spheroids were generated as described in 200 µl complete growth medium and cultured for 72 h after cell seeding. The ULA 96-well plates containing 3-day old spheroids were placed on ice. 100 µl per well of growth medium was removed from the spheroid plates. Using ice-cold tips, 100 µl of Matrigel was transferred to each well and mixed gently with medium, avoiding disturbance of the spheroids. Plates were placed in an incubator at 37°C to allow the Matrigel to solidify. One hour later, 100 µl/well of complete growth medium was added. Images for each tumour spheroid were taken 48 h later.
Statistical Analysis
All statistical analyses were performed using GraphPad Prism 6.0 Software. Data are presented as mean ± SD from 3 independent experiments. P-values are calculated by Student’s two-tailed t-test, one-way ANOVA, or two-way ANOVA as indicated in figure legends. For ANOVA, adjustments were made for multiple comparisons by Dunnett or Tukey corrections as appropriate. Exact P-values can be found in figure legends. In cases where more than one comparison has the same statistical range, values are listed as they appear from left to right in the corresponding panel.
Data availability
Source data for all Western blots can be found in Supplementary Figure 1. The gating strategy used for flow cytometry experiments can be found in Supplementary Figure 2. Raw data for all experiments in this paper are available as Source Data Figures. ChIP-seq datasets analysed in this article are publicly available in the ENCODE database under the identifiers GSM1010875 and GSM1010868.
Extended Data
Extended Data Figure 1. Intercellular contact suppresses ferroptosis.
a. Cystine starvation-induced ferroptosis in HCT116 cells cultured with different cell density. HCT116 cells were seeded into 6-well plates at the indicated density. After 24 h, cells were treated with normal media or cystine-free media for 30 h and stained with SYTOX Green. Phase contrast and fluorescent images are overlayed.
b. HCT116 cells with different cell density were treated with 30 μM erastin. Cell death was quantified by SYTOX Green staining followed by flow cytometry (after 30 h of erastin treatment). Data are plotted as mean ± s.d.; n = 3 biological replicates.
c. Cells were treated as described in (b). Lipid ROS production was assessed by C11-BODIPY staining followed by flow cytometry (after 24 h of erastin treatment). Data are plotted as mean ± s.d.; n = 3 biological replicates.
d. Cell death in HCT116 cells cultured with indicated cell density and treated with 5 μM RSL3 for 24 h. Data are plotted as mean ± s.d.; n = 3 biological replicates.
e. Lipid ROS in HCT116 cells cultured with indicated cell density and treated with 5 μM RSL3 for 16 h. Data are plotted as mean ± s.d.; n = 3 biological replicates.
f. HCT116 cells were seeded at a density of 5 × 10⁴ cells/well and grown for 24 hours. Cells were washed in PBS and cultured in cystine-free media with the indicated treatments for 30 h. Fer-1: Ferrostatin-1, 1 µM; DFO: iron chelator deferoxamine, 50 µg/ml; Z-VAD-FMK: pan-caspase inhibitor, 20 µM; GSK’872: RIPK3 inhibitor, 10 µM. Data are plotted as mean ± s.d.; n = 3 biological replicates. P-values were acquired by one-way ANOVA, n.s., p=0.9999, 0.1995 (from left to right in the figure), ** p=0.0070, 0.0050.
g. HCT116 cells were seeded at a density of 5 × 10⁴ cells/well and grown for 24 hours. Cells were then treated with 5 µM RSL3 and the indicated inhibitors for 24 hours before measuring cell death. Inhibitor concentrations used as described in (f). Data are plotted as mean ± s.d.; n = 3 biological replicates. P-values were acquired by one-way ANOVA, n.s., p=0.4989, * p=0.0366, **** p<0.0001.
h. HCT116 cells were seeded at a density of 8 × 10⁵ cells/well, grown for 24 hours, and treated with cystine-free media containing the indicated amounts of glutamine for 30 h. Cell death was measured by SYTOX Green staining coupled with flow cytometry. Data are plotted as mean ± s.d.; n = 3 biological replicates. P-value was acquired by one-way ANOVA, n.s., p=0.5156.
Extended Data Figure 2. E-cadherin-mediated intercellular interaction regulates ferroptosis in a density-dependent manner.
a. Ecad expression increases with cell density in HCT116 (top) and H1650 (bottom) cells.
b. BT474 cells express high Ecad regardless of cell density.
c. MDA231 cells express low Ecad regardless of cell density.
d. Immunofluorescence of Ecad at increasing cell density in HCT116 cells.
e. Tumour spheroids generated from HCT116 or MDA231 cells were fixed, sectioned, and stained for Ecad expression by immunohistochemistry.
f. HCT116 cells were treated with either α-IgG or α-Ecad antibody that blocks dimerisation. These cells were subjected to cystine starvation for 30 h. Cell death was measured by PI staining coupled with flow cytometry. Data are plotted as mean ± s.d.; n = 3 biological replicates. P-values were acquired by two-tailed t-test, *** p=0.0003.
g. Expression of Ecad and Ncad in HCT116 cells following CRISPR-Cas9-mediated Ecad knockout (ΔEcad).
h. Ecad knockout in HCT116 cells was further confirmed by immunofluorescence.
i. Cell death measurement of ΔEcad and the parental cell line seeded at a density of 4 × 10⁵ cells/well after 30 h of cystine starvation. Data are plotted as mean ± s.d.; n = 3 biological replicates. P-values were acquired by two tailed t-test, **** p<0.0001.
j. Western blot confirming reconstitution of Ecad or ectodomain-truncated Ecad (EcadΔecto) into ΔEcad HCT116 cells.
k. ΔEcad cells or ΔEcad cells re-expressing full length Ecad or EcadΔecto were cultured into spheroids and treated with erastin for 30 h, followed by SYTOX Green staining to monitor cell death.
Extended Data Figure 3. Cell density, E-cadherin, and Merlin converge on the transcriptional co-regulator YAP.
a. HCT116 cells were cultured at different cell density. YAP localisation was assessed by immunofluorescence. Images below are enlarged to show localisation.
b. The levels of p-YAP (S127) and YAP in whole cell or cytosolic fractions of HCT116 cells cultured at different density were analysed by Western blot. PARP was used as a marker for nuclear protein.
c. The levels of Ecad, YAP and p-YAP in parental and ΔEcad HCT116 cells were analysed by Western blot.
d. Immunofluorescence of YAP (green) and Ecad (red) in parental and ΔEcad HCT116 cells.
e. Western blots confirming knockdown efficiency of Ecad (shEcad), Merlin (shMerlin), or Lats1/2 (shLats1/2) in HCT116 cells.
f. Expression levels of Merlin, p-YAP, YAP and β-actin in HCT116 shNT and shMerlin cells were analysed by Western blot.
g. Knockdown of Merlin in HCT116 cells induced the nuclear accumulation of YAP in dense cell cultures, as assessed by immunofluorescence.
h. HCT116 cells were seeded at 1 × 10⁵ (sparse) or 8 × 10⁵ (confluent) and grown for 24 hours. RNA was purified and mRNA of the canonical YAP targets, CTGF and CYR61, was measured by qPCR. Data are plotted as mean ± s.d.; n = 3 biological replicates. P-values were acquired by two-tailed t-test, *** p=0.0002, **** p<0.0001.
i. Parental and ΔEcad HCT116 cells were plated at high density and transcription levels of CTGF and CYR61 were measured by qPCR. Data are plotted as mean ± s.d.; n = 3 biological replicates. P-values were acquired by two-tailed t-test, ** p=0.0013, **** p<0.0001.
j. Luciferase assay for YAP/TEAD transcriptional activity in HCT116 and ΔEcad cells using the 8xGTIIC-luciferase reporter. Data are plotted as mean ± s.d.; n = 3 biological replicates. P-values were acquired by two-tailed t-test, **** p<0.0001.
k. HCT116 cells harboring non-targeting hairpins or hairpins targeting Merlin were plated at high density and transcription levels of CTGF and CYR61 were measured by qPCR. Data are plotted as mean ± s.d.; n = 3 biological replicates. P-values were acquired by two-tailed t-test, *** p=0.0007, 0.0005.
l. YAP/TEAD activity in HCT116 shNT and shMerlin cells was measured using the 8xGTIIC-luciferase reporter. Data are plotted as mean ± s.d.; n = 3 biological replicates. P-values were acquired by two-tailed t-test, *** p=0.0002.
Extended Data Figure 4. The Hippo pathway links cell density and intercellular contact to ferroptosis.
a. Confluent cells were subjected to cystine starvation for 30 h. Dead cells were stained by PI.
b. HCT116 cells expressing shNT, shEcad, shMerlin, or shLats1/2 as indicated were treated with 5 µM RSL3 with or without 2 µM Fer-1. Cell death was measured at 18 h. Data are plotted as mean ± s.d.; n = 3 biological replicates. P-values were acquired by one-way ANOVA, **** p<0.0001.
c. Cells were treated as described in (b). Lipid ROS was assessed at 12 h after treatment. Data are plotted as mean ± s.d.; n = 3 biological replicates. P-values were acquired by one-way ANOVA, **** p<0.0001.
d. Cumulative cell growth curve expressed as the total cell count of shEcad, shMerlin and shLats1/2 HCT116 cells. Data are plotted as mean ± s.d.; n = 3 biological replicates. P-value was acquired by two-way ANOVA, n.s., p=0.9497.
e. HCT116 cells were transfected with EGFP-PAK containing a prenylation (CAAX) motif (thus constitutively active), or an inactive mutant form of PAK (K298R). Expression and phosphorylation of Merlin was assayed by Western blot.
f. HCT116 cells expressing activated or inactive PAK were transfected with the 8xGTIIC-luciferase reporter, and YAP/TEAD activity was measured by luminescence. Data are plotted as mean ± s.d.; n = 3 biological replicates. P-values were acquired by one-way ANOVA, **** p<0.0001.
g. HCT116 cells expressing activated or inactive PAK were plated at high density and treated with cystine-free media with or without 1 µM Ferrostatin-1 for 30 h. Data are plotted as mean ± s.d.; n = 3 biological replicates. P-values were acquired by one-way ANOVA, **** p<0.0001.
h. Cells were prepared as described in (g) and treated with DMSO or 5 µM RSL3 with or without 1 µM Ferrostatin-1. Cell death was measured at 24 h. Data are plotted as mean ± s.d.; n = 3 biological replicates. P-values were acquired by one-way ANOVA, **** p<0.0001.
Extended Data Figure 5. Merlin expression correlates with sensitivity to ferroptosis in mesothelioma cell lines.
a. Expression of Lats1/2 was tested in the indicated mesothelioma cell lines by Western blot.
b. Spheroids were treated with 10 μM erastin for 24 h before SYTOX Green staining.
c. Western blot confirming knockdown efficiency of Merlin in MSTO-211H cells.
d. Confluent MSTO-211H cells expressing shNT or shMerlin as indicated were treated with 1 µM RSL3, with or without 2 µM Fer-1. Cell death (left, 24 h after treatment) and lipid ROS production (right, 16 h) were measured. Data are plotted as mean ± s.d.; n = 3 biological replicates. P-values were acquired by one-way ANOVA, **** p<0.0001.
e. Merlin-mutant Meso33 cells were reconstituted with wild type Merlin. Expression of Merlin was confirmed by Western blot.
f. Localisation of YAP (green) under sparse or confluent conditions in Meso33 cells expressing wild type Merlin was determined by immunofluorescence.
g. Meso33 cells expressing wild type Merlin were cultured under sparse or confluent conditions and stimulated with cystine-free media. Cell death was measured by SYTOX Green staining coupled with flow cytometry after 24 h of treatment. Data are plotted as mean ± s.d.; n = 3 biological replicates. P-values were acquired by two-tailed t-test, n.s., p=0.1874, * p=0.0104.
h. Meso33 cells expressing wild type Merlin were cultured as described in (g). Lipid ROS was measured after 16 h of cystine starvation. Data are plotted as mean ± s.d.; n = 3 biological replicates. P-values were acquired by two-tailed t-test, n.s., p=0.4860, * p=0.0201.
i. Meso33 spheroids harbouring Dox-inducible Merlin expression were grown in the presence or absence of Dox for 72 h, at which point 10 µM erastin was added. After 24 h, spheroids were stained with SYTOX Green for cell death.
Extended Data Figure 6. N-cadherin suppresses ferroptosis in MSTO-211H cells in a density-dependent manner.
a. 211H cells were cultured at different cell density, and the levels of Ncad, p-YAP and total YAP were analysed by Western blot
b. 211H cells were infected with lentiviruses expressing Ncad shRNA (shNcad). Knockdown efficiency of Ncad was confirmed by Western blot.
c. shNT or shNcad 211H cells, cultured sparse or confluent as indicated, were subjected to cystine starvation for 24 h, at which point cell death was monitored by SYTOX Green staining.
d. Flow cytometric quantification of cell death in (c). Data are plotted as mean ± s.d.; n = 3 biological replicates. P-values were acquired by one-way ANOVA, n.s., p=0.8426, *** p=0.0056, 0.0015, **** p<0.0001.
e. shNT or shNcad 211H cells, cultured sparse or confluent as indicated, were treated with 1 µM RSL3 for 16 h, at which point cell death was measured by SYTOX Green staining followed by flow cytometry. Data are plotted as mean ± s.d.; n = 3 biological replicates. P-values were acquired by one-way ANOVA, n.s., p=0.3012, * p=0.0315, **** p<0.0001.
f. Spheroids generated from shNT and shNcad 211H cells were treated with 10 μM erastin for 24 h. Cell death within the spheroids was determined by SYTOX Green staining.
g. Cell viability of spheroids described in (f) was assayed by measuring cellular ATP levels. Data are plotted as mean ± s.d.; n = 3 biological replicates. P-values were acquired by two-tailed t-test, n.s., p=0.4365, *** p=0.0006, **** p<0.0001.
h. shNT or shNcad 211H cells were plated at high density and YAP localisation was assessed by immunofluorescence.
i. shNT or shNcad MSTO-211H cells were plated at high density and transcription levels of CTGF and CYR61 were measured by qPCR. Data are plotted as mean ± s.d.; n = 3 biological replicates. P-values were acquired by one-way ANOVA, * p=0.0108, ** p=0.0016, *** p=0.0007, p=**** p<0.0001.
j. Luciferase assay for YAP/TEAD activity in shNT or shNcad 211H cells was measured by 8xGTIIC-luciferase reporter assay. Data are plotted as mean ± s.d.; n = 3 biological replicates. P-values were acquired by one-way ANOVA, *** p=0.0002, **** p<0.0001.
Extended Data Figure 7. Ferroptosis can be regulated by the Hippo pathway in non-epithelial cells.
a. Mouse embryonic fibroblasts (MEFs) were cultured at the indicated density and treated with normal media or cystine free media. Cell death was measured at 12 h. Data are plotted as mean ± s.d.; n = 3 biological replicates.
b. Cells were treated as described in (a) and lipid ROS was measured at 8 h.
c. MEFs treated with 1 µM erastin at the indicated densities were measured for cell death at 12 h.
d. Cells were treated as described in (c) and lipid ROS was measured at 8 h.
e. MEFs treated with 1 µM RSL3 at the indicated densities were measured for cell death at 8 h.
f. Cells were treated as described in (e) and lipid ROS was measured at 5 h.
g. Immunofluorescence probing for YAP localisation in MEFs seeded at increasing density. Images below are enlarged to show localisation.
h. Hairpins targeting Merlin were infected into MEFs, and knockdown efficiency was assessed by Western blot.
i. Immunofluorescence testing YAP localisation following Merlin knockdown in MEFs.
j. RNAi depletion of Merlin in confluent MEFs led to increased cell death upon cystine starvation, erastin (1 µM, 12 h) or RSL3 (1 µM, 8 h) treatment, which was blocked by Ferrostatin-1 (2 µM). Data are plotted as mean ± s.d.; n = 3 biological replicates. P-values were acquired by two-tailed t-test, *** p=0.0007, 0.0007, 0.0006.
k. Cells were treated as described in (j) and lipid ROS was assessed at 8 h (cystine starvation, erastin) or 5 h (RSL3). Data are plotted as mean ± s.d.; n = 3 biological replicates. P-values were acquired by two-tailed t-test, **** p<0.0001.
l. Western blot probing for YAP and TAZ in CA-46 Burkitt lymphoma cells.
m. Cell death measurement of CA-46 cells treated as indicated after 24 h.
Extended Data Figure 8. YAP regulates ferroptosis.
a. Western blot confirming expression of YAPS127A in HCT116 cells.
b. YAP localisation in HCT116 cells expressing YAPS127A was assessed by immunofluorescence.
c. Transcriptional levels of CTGF and CYR61 were measured by qPCR in HCT116 cells expressing YAPS127A. Data are plotted as mean ± s.d.; n = 3 biological replicates. P-values were acquired by two-tailed t-test, *** p=0.0005, **** p<0.0001.
d. YAP/TEAD activity in HCT116 cells expressing YAPS127A was measured by 8xGTIIC-luciferase reporter assay. Data are plotted as mean ± s.d.; n = 3 biological replicates. P-value was acquired by two-tailed t-test, **** p<0.0001.
e. Spheroids generated from parental HCT116 cells and YAPS127A-overexpressing cells were treated with 15 μM erastin for 30 h, followed by SYTOX Green staining.
f. 211H cells were infected with retroviral vectors encoding the Flag-YAPS127A mutant. Levels of Flag-YAP, YAP, and p-YAP were analysed by Western blot.
g. Localisation of YAP (green) was determined by immunofluorescence in 211H cells expressing constitutively active YAP.
h. Parental and YAPS127A-overexpressing 211H cells were cultured under sparse or confluent conditions and cell death was induced by cystine starvation. Cell death was measured after 24 h of treatment. Data are plotted as mean ± s.d.; n = 3 biological replicates. P-values were acquired by two-tailed t-test, * p=0.0354, *** p=0.0003.
i. Cells were cultured as described in (h) and lipid ROS was measured after 16 h of cystine starvation. Data are plotted as mean ± s.d.; n = 3 biological replicates. P-values were acquired by two-tailed t-test, *** p=0.0006, **** p<0.0001.
j. Spheroids generated from parental 211H cells and YAPS127A-overexpression cells were treated with 10 μM erastin for 24 h. Cell death was measured by SYTOX staining.
k. Cells were cultured as described in (j) and cell viability within spheroids was measured by cellular ATP levels. Data are plotted as mean ± s.d.; n = 3 biological replicates. P-values were acquired by two-tailed t-test, n.s., p=0.1534, *** p=0.0009.
l. YAP was knocked out by CRISPR-Cas9 in shMerlin HCT116 cells.
m. HCT116 cells were transduced with retroviral particles containing mCherry-ACSL4, transfected with TFRC, or both. Expression was assayed by Western blot. Two bands were detected for mCherry-ACSL4, representing the full-length mCherry-ACSL4 and that with mCherry tag truncated.
n. HCT116 cells treated as described in (m) were plated at the indicated density and treated with 2 µM RSL3 for 24 h. Cell death was measured by SYTOX Green staining coupled with flow cytometry. Data are plotted as mean ± s.d.; n = 3 biological replicates. P-values were acquired by one-way ANOVA, * p=0.0158, ** p=0.0012, **** p<0.0001.
o. Western blot confirming knockdown of TFRC in HCT116 shMerlin cells.
p. Western blot confirming knockdown of TFRC in HCT116 ΔEcad cells.
q. Cells described in panel p were treated with media containing or lacking cystine for 30 h. Cell death was measured by SYTOX Green staining. Data are plotted as mean ± s.d.; n = 3 biological replicates. P-values were acquired by one-way ANOVA, **** p<0.0001.
r. Western blot of HCT116 cells with CRISPR-Cas9-mediated ACSL4 knockout and shMerlin.
Extended Data Figure 9. Merlin and Lats1/2 regulate cancer cell sensitivity to ferroptosis in vivo.
a. Western blot confirming knockout of GPX4 in 211H cells following treatment with 1 µg/ml Dox for 5 days (top). These cells were then infected with the indicated hairpins (bottom).
b. Spheroids formed by shNT-GPX4-iKO or shMerlin-GPX4-iKO 211H cells were treated with or without Dox for 5 days. Cell death and cell viability within the spheroids were determined by SYTOX staining (top) and cellular ATP measurement (bottom). Data are plotted as mean ± s.d.; n = 3 biological replicates. P-values were acquired by two-tailed t-test, n.s., p=0.3523, *** p=0.0007.
c. shNT-GPX4-iKO cells and shMerlin-GPX4-iKO cells were subcutaneously injected into nude mice. The effect of Merlin knockdown on xenografted tumours was validated by immunohistochemical (IHC) staining of Merlin, ACSL4, TFRC, and YAP, all counter-stained with haematoxylin (blue), on sections of tumours bearing shNT and shMerlin as indicated. Inset images are enlarged to show TFRC expression at plasma membranes and increase in nuclear localisation of YAP.
d. shNT-GPX4-iKO cells and shMerlin-GPX4-iKO cells were subcutaneously injected into nude mice and fed with Dox diet or normal diet (n = 8 per group). Representative images of haematoxylin and eosin (H&E) staining and IHC staining for GPX4, PTGS2, and Ki67, all counter-stained with haematoxylin (blue), were taken from sections of xenografted tumours, bearing shNT or shMerlin and with or without Dox diet (to induce GPX4 knockout) as indicated.
e. Images of resected MSTO-211H subcutaneous tumours (scale bar = 1 cm).
f. HCT116 shNT or shLats1/2 cells were injected subcutaneously and treated wih or without IKE. Tumors were resected and weighed. Top, images of resected HCT116 shNT or shLats1/2 tumors. Bottom, mass of resected tumors. Data are plotted as mean ± s.d.; n =6 mice per group. P-values were acquired by two-tailed t-test, n.s., p=0.8677, * p=0.0486.
g. Representative bioluminescent imaging (BLI) showing the tumour growth of indicated cells in an orthotopic model of mesothelioma in NOD/SCID mice. Dox treatment started when average total flux reached 108 photons per second (time-point 0).
h. Tumour spheroids of 211H cells expressing shNT or shMerlin were grown in Matrigel, and invasion was monitored. In the representative images, arrows show protrusions extruded from the main body of spheroids.
Extended Data Figure 10. The Hippo pathway as a potential biomarker for predicting cancer cell sensitivity to ferroptosis.
a. HCT116 cells were seeded at a density of 0.5 × 10⁵ cells/3.5 cm2 well (sparse) or 4 × 10⁵ cells/3.5 cm2 well (confluent) and grown for 24 h. Cells were then treated with DMSO, 10 µM sorafenib, or 10 µM sorafenib and 2 µM Fer-1 as indicated. Data are plotted as mean ± s.d.; n = 3 biological replicates. P-value was acquired by two-tailed t-test, **** p<0.0001.
b. ΔEcad or the parental HCT116 cells were seeded at 4 × 10⁵ cells/3.5 cm2 well and grown for 24 h. Cells were then treated with 10 µM sorafenib and 2 µM Fer-1 as indicated. Data are plotted as mean ± s.d.; n = 3 biological replicates. P-value was acquired by two-tailed t-test, * p=0.0394.
c. HCT116 shNT or shMerlin cells were seeded at high density and treated with 10 µM sorafenib and 2 µM Fer-1 as indicated. Data are plotted as mean ± s.d.; n = 3 biological replicates. P-value was acquired by two-tailed t-test, * p=0.0167.
d. 211H shNT or shMerlin cells were seeded at high density and treated with 10 µM sorafenib and 2 µM Fer-1 as indicated. Data are plotted as mean ± s.d.; n = 3 biological replicates. P-value was acquired by two-tailed t-test, *** p=0.0004.
e. HCT116 cells expressing YAPS127A or the parental cells were seeded at high density and treated with 10 µM sorafenib and 2 µM Fer-1 as indicated. Data are plotted as mean ± s.d.; n = 3 biological replicates. P-value was acquired by two-tailed t-test, ** p=0.0014.
f. 211H cells expressing YAPS127A or the parental cells were seeded at high density and treated with 10 µM sorafenib and 2 µM Fer-1 as indicated. Data are plotted as mean ± s.d.; n = 3 biological replicates. P-value was acquired by two-tailed t-test, * p=0.0143.
g. HCT116 shNT or shLats1/2 cells were seeded at high density and treated with 10 µM sorafenib and 2 µM Fer-1 as indicated. Data are plotted as mean ± s.d.; n = 3 biological replicates. P-value was acquired by two-tailed t-test, ** p=0.0017.
h. NF639 cells, derived from mouse mammary tumours containing MMTV-neu, were treated with various concentrations of TGF-β for 48 h. Expression of a panel of EMT-related genes was assayed by qPCR as indicated. Data are plotted as mean ± s.d.; n = 3 biological replicates.
i. NF639 cells were treated with or without 6 ng/µL TGF-β for 48 h, at which point they were plated at low density (0.8 cells x 105/3.5 cm2 well), grown overnight, and treated with media containing or lacking cystine, or lacking cystine with 1 µM ferrostatin-1 for 12 h. Cell death was measured by SYTOX green staining coupled with flow cytometry. Data are plotted as mean ± s.d.; n = 3 biological replicates. P-value was acquired by two-tailed t-test, n.s., p = 0.0777.
j. NF639 cells were plated at a high density of 3.2 × 10⁵ cells/3.5 cm2 well, grown overnight, and treated as described in (b). Data are plotted as mean ± s.d.; n = 3 biological replicates. P-value was acquired by two-tailed t-test; **** p<0.0001.
k. 211H cells were infected with YAPS127A or the activated mutant PIK3CAH1047R. Lysates were probed for overexpression and phosphorylated AKT (S473) to confirm the activity of PIK3CAH1047R.
l. 50,000 cells were seeded in 3.5 cm2 plates and grown for a total of 5 days. Cells were counted daily. Data are plotted as mean ± s.d.; n = 3 biological replicates. P-values were acquired by two-way ANOVA, *** p=0.0007, **** p<0.0001.
m. Cells were seeded at high density (8 × 10⁵ cells / 3.5 cm2 well) and treated with cystine starvation media for 24 hours before cell death analysis by flow cytometry. Data are plotted as mean ± s.d.; n = 3 biological replicates. P-values were acquired by one-way ANOVA, n.s., p=0.8838, ** p=0.0041.
Supplementary Material
ACKNOWLEDGEMENTS
The authors thank Dr. Elisa De Stanchina and Ms. Elizabeth Peguero of the Antitumour Assessment Core of Memorial Sloan Kettering Cancer Center for their help with mouse modelling experiments. The authors thank members of the Jiang lab for critical reading and suggestions. This work is supported by NIH R01CA204232 (to XJ), a Geoffrey Beene Cancer Research fund (to XJ), a Functional Genomic Initiative fund (to XJ), a China Scholarship Council fellowship (to JW), and NIH T32 fellowship 5T32GM008539–23 (to AMM), National Cancer Institute R35CA209896 and P01CA087497 (to BRS), National Natural Science Foundation of China 31871388 (to MG). This work is also supported by NCI cancer centre core grant P30 CA008748 to Memorial Sloan Kettering Cancer Center.
Footnotes
COMPETING INTERESTS
BRS holds equity in and serves as a consultant to Inzen Therapeutics, consults with GLG and Guidepoint Global, and is an inventor on patents and patent applications related to IKE and ferroptosis.
REFERENCES
- 1.Stockwell BR et al. Ferroptosis: A Regulated Cell Death Nexus Linking Metabolism, Redox Biology, and Disease. Cell 171, 273–285, doi: 10.1016/j.cell.2017.09.021 (2017). [DOI] [PMC free article] [PubMed] [Google Scholar]
- 2.Gao M & Jiang X To eat or not to eat-the metabolic flavor of ferroptosis. Curr Opin Cell Biol 51, 58–64, doi: 10.1016/j.ceb.2017.11.001 (2018). [DOI] [PMC free article] [PubMed] [Google Scholar]
- 3.Yang WS et al. Regulation of ferroptotic cancer cell death by GPX4. Cell 156, 317–331, doi: 10.1016/j.cell.2013.12.010 (2014). [DOI] [PMC free article] [PubMed] [Google Scholar]
- 4.Gao M et al. Role of Mitochondria in Ferroptosis. Mol Cell 73, 354–363 e353, doi: 10.1016/j.molcel.2018.10.042 (2019). [DOI] [PMC free article] [PubMed] [Google Scholar]
- 5.Jiang L et al. Ferroptosis as a p53-mediated activity during tumour suppression. Nature 520, 57–62, doi: 10.1038/nature14344 (2015). [DOI] [PMC free article] [PubMed] [Google Scholar]
- 6.Jennis M et al. An African-specific polymorphism in the TP53 gene impairs p53 tumor suppressor function in a mouse model. Genes Dev 30, 918–930, doi: 10.1101/gad.275891.115 (2016). [DOI] [PMC free article] [PubMed] [Google Scholar]
- 7.Zhang Y et al. BAP1 links metabolic regulation of ferroptosis to tumour suppression. Nat Cell Biol 20, 1181–1192, doi: 10.1038/s41556-018-0178-0 (2018). [DOI] [PMC free article] [PubMed] [Google Scholar]
- 8.Viswanathan VS et al. Dependency of a therapy-resistant state of cancer cells on a lipid peroxidase pathway. Nature 547, 453–457, doi: 10.1038/nature23007 (2017). [DOI] [PMC free article] [PubMed] [Google Scholar]
- 9.Hangauer MJ et al. Drug-tolerant persister cancer cells are vulnerable to GPX4 inhibition. Nature 551, 247–250, doi: 10.1038/nature24297 (2017). [DOI] [PMC free article] [PubMed] [Google Scholar]
- 10.Hmeljak J et al. Integrative Molecular Characterization of Malignant Pleural Mesothelioma. Cancer Discov 8, 1548–1565, doi: 10.1158/2159-8290.CD-18-0804 (2018). [DOI] [PMC free article] [PubMed] [Google Scholar]
- 11.Bueno R et al. Comprehensive genomic analysis of malignant pleural mesothelioma identifies recurrent mutations, gene fusions and splicing alterations. Nat Genet 48, 407–416, doi: 10.1038/ng.3520 (2016). [DOI] [PubMed] [Google Scholar]
- 12.Seiler A et al. Glutathione peroxidase 4 senses and translates oxidative stress into 12/15-lipoxygenase dependent- and AIF-mediated cell death. Cell Metab 8, 237–248, doi: 10.1016/j.cmet.2008.07.005 (2008). [DOI] [PubMed] [Google Scholar]
- 13.Schneider M et al. Absence of glutathione peroxidase 4 affects tumor angiogenesis through increased 12/15-lipoxygenase activity. Neoplasia 12, 254–263 (2010). [DOI] [PMC free article] [PubMed] [Google Scholar]
- 14.Gao M, Monian P, Quadri N, Ramasamy R & Jiang X Glutaminolysis and Transferrin Regulate Ferroptosis. Mol Cell 59, 298–308, doi: 10.1016/j.molcel.2015.06.011 (2015). [DOI] [PMC free article] [PubMed] [Google Scholar]
- 15.van Roy F & Berx G The cell-cell adhesion molecule E-cadherin. Cell Mol Life Sci 65, 3756–3788, doi: 10.1007/s00018-008-8281-1 (2008). [DOI] [PMC free article] [PubMed] [Google Scholar]
- 16.Kim NG, Koh E, Chen X & Gumbiner BM E-cadherin mediates contact inhibition of proliferation through Hippo signaling-pathway components. Proc Natl Acad Sci U S A 108, 11930–11935, doi: 10.1073/pnas.1103345108 (2011). [DOI] [PMC free article] [PubMed] [Google Scholar]
- 17.Okada T, Lopez-Lago M & Giancotti FG Merlin/NF-2 mediates contact inhibition of growth by suppressing recruitment of Rac to the plasma membrane. J Cell Biol 171, 361–371, doi: 10.1083/jcb.200503165 (2005). [DOI] [PMC free article] [PubMed] [Google Scholar]
- 18.Zhao B, Lei QY & Guan KL The Hippo-YAP pathway: new connections between regulation of organ size and cancer. Curr Opin Cell Biol 20, 638–646, doi: 10.1016/j.ceb.2008.10.001 (2008). [DOI] [PMC free article] [PubMed] [Google Scholar]
- 19.Pan DJ The Hippo Signaling Pathway in Development and Cancer. Dev Cell 19, 491–505, doi: 10.1016/j.devcel.2010.09.011 (2010). [DOI] [PMC free article] [PubMed] [Google Scholar]
- 20.Li W, Cooper J, Karajannis MA & Giancotti FG Merlin: a tumour suppressor with functions at the cell cortex and in the nucleus. EMBO Rep 13, 204–215, doi: 10.1038/embor.2012.11 (2012). [DOI] [PMC free article] [PubMed] [Google Scholar]
- 21.Li W et al. Merlin/NF2 loss-driven tumorigenesis linked to CRL4(DCAF1)-mediated inhibition of the hippo pathway kinases Lats1 and 2 in the nucleus. Cancer Cell 26, 48–60, doi: 10.1016/j.ccr.2014.05.001 (2014). [DOI] [PMC free article] [PubMed] [Google Scholar]
- 22.Dupont S et al. Role of YAP/TAZ in mechanotransduction. Nature 474, 179–183, doi: 10.1038/nature10137 (2011). [DOI] [PubMed] [Google Scholar]
- 23.Falk MH et al. Apoptosis in Burkitt lymphoma cells is prevented by promotion of cysteine uptake. Int J Cancer 75, 620–625 (1998). [DOI] [PubMed] [Google Scholar]
- 24.Varelas X & Wrana JL Coordinating developmental signaling: novel roles for the Hippo pathway. Trends Cell Biol 22, 88–96, doi: 10.1016/j.tcb.2011.10.002 (2012). [DOI] [PubMed] [Google Scholar]
- 25.Zhao B et al. Inactivation of YAP oncoprotein by the Hippo pathway is involved in cell contact inhibition and tissue growth control. Genes Dev 21, 2747–2761, doi: 10.1101/gad.1602907 (2007). [DOI] [PMC free article] [PubMed] [Google Scholar]
- 26.Doll S et al. ACSL4 dictates ferroptosis sensitivity by shaping cellular lipid composition. Nat Chem Biol 13, 91–98, doi: 10.1038/nchembio.2239 (2017). [DOI] [PMC free article] [PubMed] [Google Scholar]
- 27.Zhang Y et al. Imidazole Ketone Erastin Induces Ferroptosis and Slows Tumor Growth in a Mouse Lymphoma Model. Cell Chem Biol, doi: 10.1016/j.chembiol.2019.01.008 (2019). [DOI] [PMC free article] [PubMed] [Google Scholar]
- 28.Dixon SJ et al. Pharmacological inhibition of cystine-glutamate exchange induces endoplasmic reticulum stress and ferroptosis. Elife 3, e02523, doi: 10.7554/eLife.02523 (2014). [DOI] [PMC free article] [PubMed] [Google Scholar]
- 29.Dubey S et al. A phase II study of sorafenib in malignant mesothelioma: results of Cancer and Leukemia Group B 30307. J Thorac Oncol 5, 1655–1661, doi: 10.1097/JTO.0b013e3181ec18db (2010). [DOI] [PMC free article] [PubMed] [Google Scholar]
- 30.Papa S et al. Phase 2 study of sorafenib in malignant mesothelioma previously treated with platinum-containing chemotherapy. J Thorac Oncol 8, 783–787, doi: 10.1097/JTO.0b013e31828c2b26 (2013). [DOI] [PubMed] [Google Scholar]
Associated Data
This section collects any data citations, data availability statements, or supplementary materials included in this article.
Supplementary Materials
Data Availability Statement
Source data for all Western blots can be found in Supplementary Figure 1. The gating strategy used for flow cytometry experiments can be found in Supplementary Figure 2. Raw data for all experiments in this paper are available as Source Data Figures. ChIP-seq datasets analysed in this article are publicly available in the ENCODE database under the identifiers GSM1010875 and GSM1010868.


