Abstract
Objectives
This study examines the impact of the type of method used on the estimation of the burden of diseases.
Design
Comparison of methods of estimating disease burden.
Setting
Four metrics of burden of disease estimation, namely, years of potential life lost (YPLL), non-age weighted years of life lost (YLL) without discounting and YLL with uniform or non-uniform age weighting and discounting were used to calculate the burden of selected diseases in three countries: Australia, USA and South Africa.
Participants
Mortality data for all individuals from birth were obtained from the WHO database.
Outcomes
The burden of 10 common diseases with four metrices, and the relative contribution of each disease to the overall national burden when each metric is used.
Results
There were variations in the burden of disease estimates with the four methods. The standardised YPLL estimates were higher than other methods of calculation for diseases common among young adults and lower for diseases common among the elderly. In the three countries, discounting decreased the contributions of diseases common among younger adults to the total burden of disease, while the contributions of diseases of the elderly increased. After discounting with age weighting, there were no distinct patterns for diseases of the elderly and young adults in the three countries.
Conclusions
Given the variability in the estimates of the burden of disease with different approaches, there should be transparency regarding the type of metric used and a generally acceptable method that incorporates all the relevant social values should be developed.
Keywords: epidemiology, public health, health economics
Strengths and limitations of this study.
The 10 diseases we chose ensured that the large differences in estimates driven by age at death were determined.
We relied on WHO data on the burden of 10 important diseases from 3 different countries, but these data are not comprehensive.
Larger or smaller differences might be seen with other diseases or for other countries.
Introduction
The metric for estimating the health status of a population has traditionally been the mortality rate. However, in order to identify and prioritise the causes of premature death, as well as quantify the burden of such deaths on the society, the years of life lost (YLL) and the years of potential life lost (YPLL) measures were developed. Both metrics estimate the average number of years a person would have lived had they not died prematurely. Governments and institutions use these metrics to prioritise health funding and research. The YLL concept has been in existence since the 1940s.1 However, it did not gain traction as a planning tool for health promotion and disease prevention until the 1970s and 1980s.2 The use of YPLL as a measure of premature mortality was introduced by the US Centres for Disease Control (CDC) in 1982, when they started reporting potential YLL before the age of 65.3 YLL as a component of the Disability-Adjusted Life Year was introduced by the global burden of disease (GBD) study published in 1996.4
Although the two measures are somewhat similar with respect to what they measure, they differ in the calculations used. For YLL, the number of deaths at a particular age is multiplied by the standard life expectancy at the age at which death occurs. The results for the respective ages or age bands are then summed.5 YPLL is calculated as deaths of persons up to a cut-off age threshold with the assumption that deaths occurring before this time are untimely.6 However, the choice of maximum cut-off age is arbitrary and has differed between authors, with a profound impact on the resultant estimates.
Deaths beyond the cut-off age, usually the life expectancy in a specific population, are not measurable with YPLL. Social values such as time-based discounting and age weighting can be incorporated into YPLL and YLL calculations. Discount rates estimate the net present value of YLL. Some studies, for example, have used a discount rate of 3% time of life lost in the future, which implies that a year of healthy life gained next year is worth 3% less than healthy life lived now.5 Discount rates of up to 5% have been used in cost effectiveness analyses.7 Age weighting implies that the value of life depends on age, such that greater weights are assigned to deaths at younger ages and lower weights to deaths at older ages.8 Although the WHO have adopted the no-discount and no-age weighting methods,8 age weighting and time-based discounting are still commonly used by researchers.9–11
It is important that proportionate amounts of resources are allocated to disease research and prevention. How the burden of one disease is perceived relative to others depend on the metric used and whether adjustments were made to those metrics. In this report, we examine the impact of the choice of index (YLL or YPLL), age weighting and discounting on the estimation of the burden of diseases.
Methods
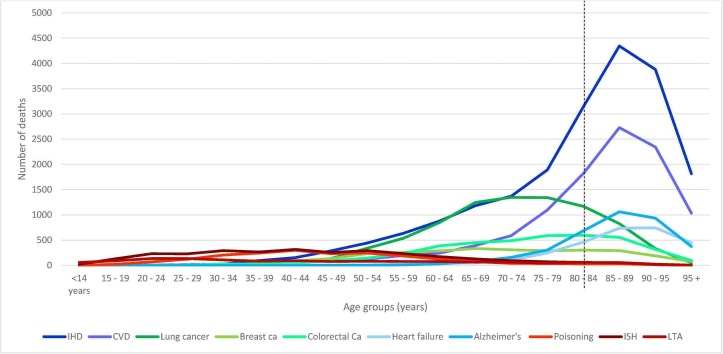
The 2014 mortality data for three countries, Australia, USA and South Africa, were obtained from the WHO database. The WHO mortality database contains mortality data by country, year, age, sex and cause of death, submitted to the WHO by its member states on an annual basis since 1950. The causes of death on the database are coded according to the International statistical Classification of Diseases and health related problems 10th revision (ICD-10).12 Ten diseases, grouped into three categories, were selected. The first group consists of ischaemic heart disease, cerebrovascular disease, Alzheimer’s disease and heart failure. These were diseases with peak mortality after life expectancy. The second group includes diseases with peak mortality in younger adults. These include poisoning, land transport accidents (LTA) and intentional self-harm. A third group consisted of diseases including lung cancer, colorectal cancer and breast cancer, with peak mortality after age 50 but before age of life expectancy at birth (figure 1 and see online supplementary files 1 and 2). The number of deaths in 5-year age intervals (except for infants and elderly over 85 years old: 0,1–4, 5–9, 10–14, …, 80–84, 85+) were extracted onto a Microsoft Excel worksheet and the standard life expectancies for the average ages of deaths (the mean of the lower and upper bound of each age group), for both males and females were obtained from the WHO standard life tables.13 YLL was calculated, using Microsoft Excel, from the sum of the number of deaths due to a disease multiplied by life expectancy for that age band
Figure 1.
Age distribution of disease mortality in Australia (dashed line: life expectancy for Australia). CVD, cerebrovascular disease; IHD, ischemic heart disease; LTA, land transport accidents.
where N=number of deaths at a particular age or age band and L is the standard life expectancy for the age or age band of death.
Four metrics were compared:
Years of potential life lost: YPLL.
YLL without age weighting (uniform weighting) or discounting: YLL [0, 0].
YLL with non-uniform age weighting and discounting: YLL [1, 0.03].
YLL with uniform age weighting and discounting: YLL [0, 0.03].
Details of the method for calculating non-uniform age weighted (K=1) and non-zero discounted as well as 3% discounted and uniform age weighted (K=0) YLL are available in the WHO practical guide for national burden of disease studies.14
From this guide, we used formula 11.2:
YLL=N/0.03(1 – e–0.03L) for 3% discounting and uniform age weights.
And, for non-zero discounting and age weighting, we used formula 11.3:
where N is number of deaths, r is the discount rate of 0.03, C is the age-weighting correction constant of 0.1658, β is the parameter from the age-weighting function value 0.04, a is the age of onset and L is the duration of disability or time lost due to premature mortality. L was derived from the 2014 WHO life tables for each of the three countries.13
To enable comparison, YPLL were calculated by multiplying the number of disease-specific deaths for a given age group by the expected life expectancy for each age group up to a cut-off age of 79 years15 by using the formula: YPLL = Σx Dx(79-Axe), where Dx=registered number of deaths at age due to a particular cause of death and Axe=adjusted age at death.
For each method, the burden of disease was standardised as a percentage of the total national burden of disease, that is,
Standardised burden of disease=(Burden of disease/total burden of diseases)×100.
The YLL for each disease was expressed as the percentage of the total YLL lost in the population due to premature mortality. The total YLL for each country was determined by calculating the sum of the YLL for all ICD-10 disease categories on the WHO mortality database.
Patients and public involvement
Patients and public were not involved in this study.
Results
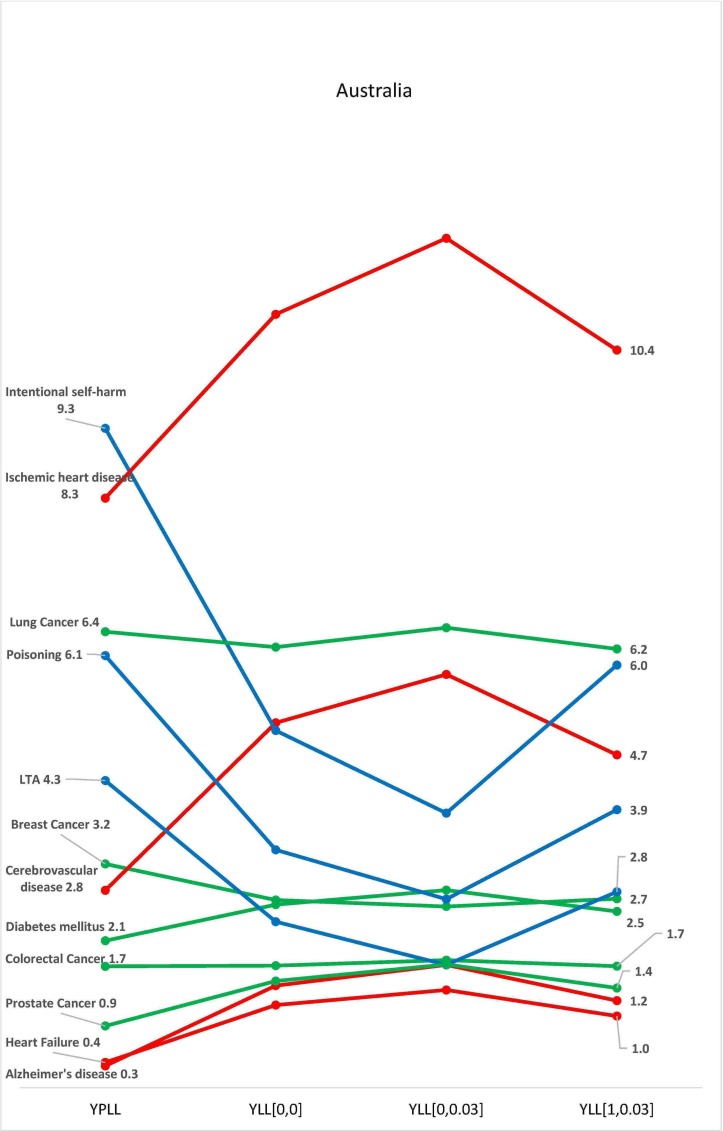
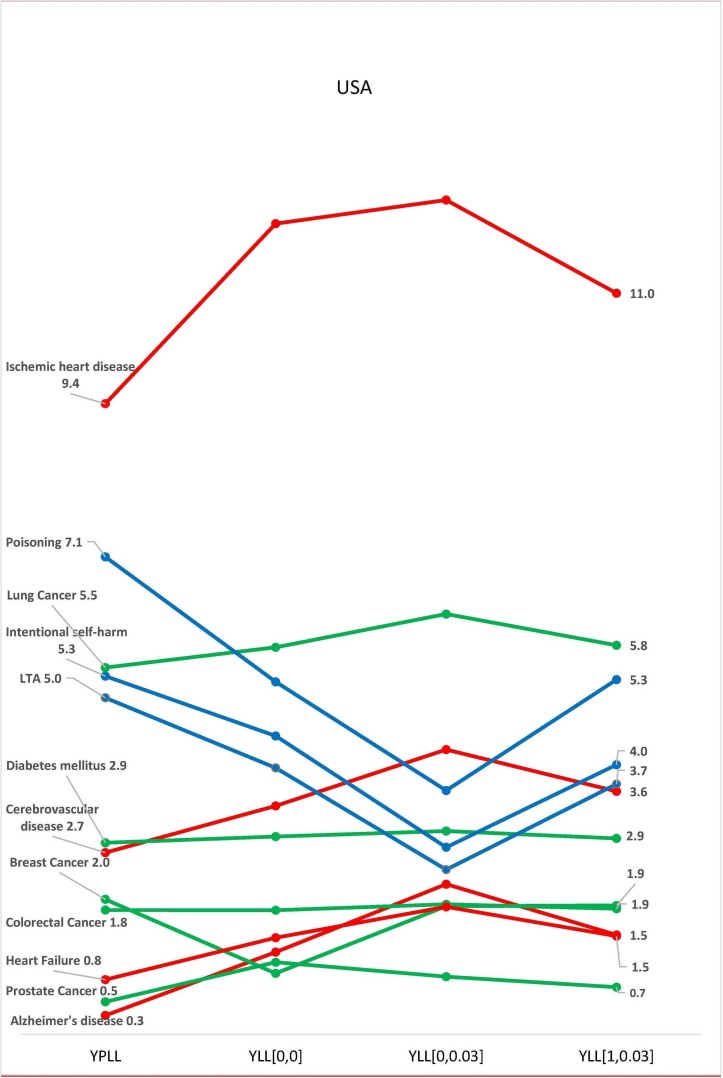
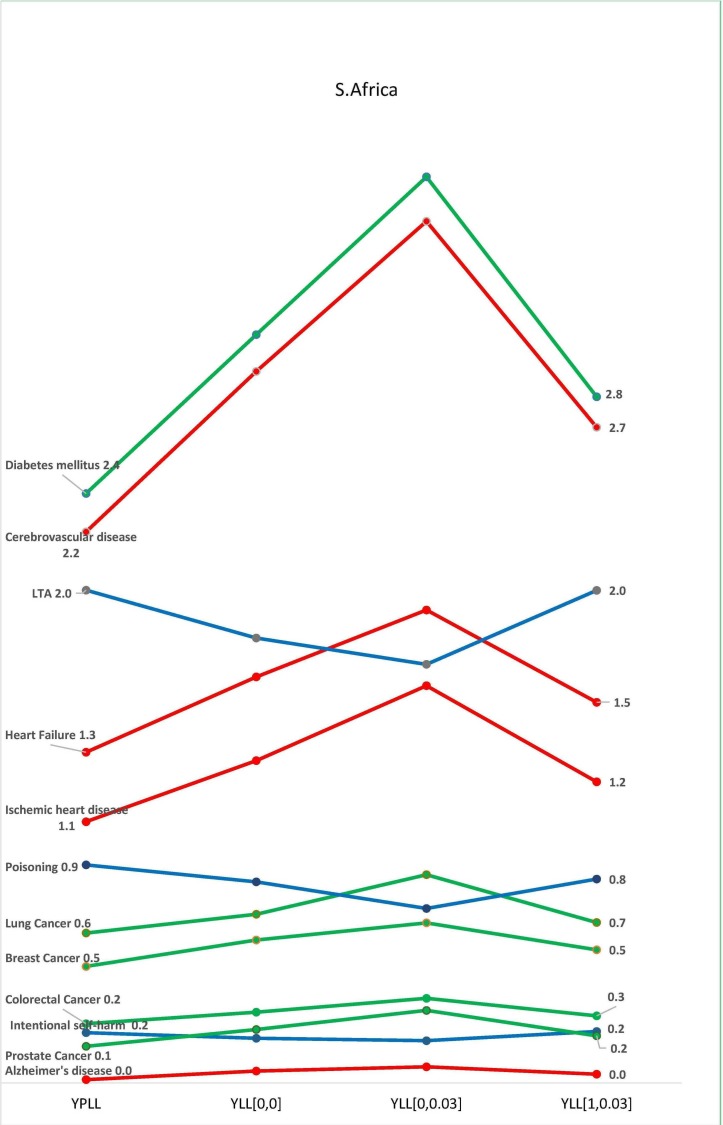
There were variations in the contributions of each disease class to the total national burden of disease in the selected countries, with the four methods of estimation. In all three countries, burden of disease estimation with YPLL yielded the highest estimates for diseases common among younger adults, resulting in a higher contribution of these diseases to the total burden of disease in the respective countries (figures 2–4). In Australia, the standardised burden of intentional self-harm was 9.3% with YPLL, compared with 5.1%, 6.0% and 3.9% with YLL [0, 0], YLL [1, 0.03] and YLL [0, 0.03], respectively. In the USA, the standardised burden of intentional self-harm was 5.3% with YPLL, compared with 4.4%, 4.0% and 2.8% with YLL [0, 0], YLL [1, 0.03] and YLL [0, 0.03], respectively. For intentional self-harm in South Africa, YPLL did not differ from other metrics (0.2%, respectively) (figure 4). Conversely, YPLL resulted in the lowest estimate of disease burden for diseases common among the elderly. In the USA, the standardised burden of ischaemic heart disease was 9.4% compared with 12.1%, 11.0% and 12.4%, with YLL [0, 0], YLL [1, 0.03] and YLL [0, 0.03], respectively (figure 3).
Figure 2.
Burden of disease estimates as a proportion of the total burden of disease in Australia. K=1 represents non-uniform age weighting, K=0 represents uniform age weighting, r is the discount rate of 3%. LTA, land transport accidents; YLL, years of life lost; YPLL, years of potential life lost.
Figure 3.
Burden of disease estimates as a proportion of the total burden of disease in USA. K=1 represents age weighting, K=0 represents no age weighting, r is the discount rate of 3%. LTA, land transport accidents; YLL, years of life lost; YPLL, years of potential life lost.
Figure 4.
Burden of disease estimates as a proportion of the total burden of disease in South Africa. K=1 represents age weighting, K=0 represents no age weighting, r is the discount rate of 3%. See online online supplementary filess. LTA, land transport accidents; YLL, years of life lost; YPLL, years of potential life lost.
In the three countries, discounting decreased the contributions of diseases common among younger adults to the total burden of disease, while the contributions of diseases of the elderly increased (figures 2–4). In Australia, the standardised burden of ischaemic heart disease, heart failure and Alzheimer’s disease increased from 10.9% to 12%, 1.2% to 1.4% and 1.4% to 1.7%, respectively, after discounting without age weighting, while the standardised burden of intentional self-harm, poisoning and LTA decreased from 5.1% to 3.9%, 3.4% to 2.7% and 2.4% to 1.7%, respectively, after discounting without age weighting (figure 2). A similar pattern was seen with estimates from USA and South Africa (figures 3 and 4). In the USA, the standardised burden of intentional self-harm, poisoning and LTA decreased from 4.4% to 2.8%, 5.2% to 3.6% and 4.0% to 2.4%, while ischaemic heart disease, heart failure and Alzheimer’s disease increased from 12.1% to 12.4%, 1.4% to 1.9% and 1.2% to 2.2%, respectively. In South Africa, Ischaemic heart disease, heart failure and Alzheimer’s disease increased from 1.3% to 1.6%, 1.6% to 1.9% and 0.05% to 0.07%, respectively, after discounting without age weighting, while minimal decreases were seen with poisoning and LTA 0.8%–0.7% and 1.8%–1.7%, respectively. There was no difference between discounted and undiscounted YLL estimates for intentional self-harm (0.2%). After discounting with age weighting, there were no distinct patterns for diseases of the old and young in the three countries (figures 2–4).
Discussion
We have shown that estimates of the relative burden of diseases are highly dependent on the methods of calculation used. This is especially so for countries with long life expectancy and for diseases that preferentially affected the young or elderly. The standardised YPLL estimates were relatively higher for diseases common among younger adults, but smaller in absolute terms in the two countries (USA and Australia) with higher life expectancies; conversely, the standardised YPLL estimates were lower for diseases of the elderly. On account of the reduction in the contribution of deaths in older age groups with YPLL estimates, the relative contribution of the causes in younger adults increased. Similarly, discounting without age weighting increased the contribution of diseases of the elderly to the total burden of disease, while the contributions of diseases of younger adults decreased.
The variations in estimates of the burden of disease can change the relative ‘importance’ of a disease such that advocates and researchers interested in promoting research on particular diseases could choose an approach that best supports their cause. In our study, intentional self-harm was the most ‘burdensome’ of all the 10 diseases in Australia using YPLL estimates, ahead of ischaemic heart disease, lung cancer and cerebrovascular disease. However, with the uniform weighted YLL with discount method, intentional self-harm decreased in relevance to the fourth most ‘burdensome’ disease. On account of this variability, transparency in the selection of appropriate methods is important given that these estimates may be important for the prioritisation of diseases for research funding. Gillum et al16 showed a positive correlation between burden of disease (measured using various indicators, including YLL) and the amount of research funding received from the US National Institutes of Health in 2006, although the degree of correlation was less than in 1996.16
The WHO recommends that individual countries should report on their national burden of disease and they have provided resources on their website for these calculations.17 The resources provided are for YLL, which indicates a tacit preference for this method. Some national agencies, including the Australian Bureau of Statistics and the US CDC, however, estimate the YPLL. Prior to the 2010 GBD study, time-based discounting with or without age weighting were used.18 In the 19904 and 200419 GBD studies, 3% discounting with age weighting was used, while in the 2001 study,20 3% discounting without age weighting was used. Several national burden-of-disease studies have continued to include time discounting with or without age weighting,9–11 while some other studies have used neither.21 Melse et al, in evaluating the burden of disease in the Netherlands, justified their non-utilisation of age weighting and time-based discounting as a practical way of maintaining transparency of figures.21 Barendregt et al22 reported that the addition of age weights to discounted estimates, resulted in ages 0–27 years becoming more important than 9–54 years. Sensitivity analyses have been recommended to determine the implications of including or excluding time-based discounting and age weighting in the burden of disease estimates.5 Although unweighted YLL without discount generally produced higher burden estimates than the three other methods for all 10 diseases (see online supplementary files 3-5), we have shown in this study that the adjusted values with this method were closer to age-weighted YLL with discount. Both methods yielded results that were consistently between the two extremes of YPLL and uniform weighted YLL with discount (figures 2–4).
Furthermore, the propriety of age weighting and discounting is a controversial subject and different authors have argued for or against them. Notably, Murray and Acharya opined that age weighting should not be a social construct that is based on our relative desire to take care of children and the elderly, but rather a system premised on how productive an age group is and the need to prioritise their well-being.23 Anand and Hanson argued that all lives are equal in importance and disagreed that people’s lives should be valued in terms of their productivity. They also suggested that discounting and weighting reduces the YLL in females relative to males.24
Age weighting attaches different values to life years lived at different ages. Lower weights are usually given to years of healthy life at very young and old ages than for other ages. Time-based discounting is useful in health economics research; it is included in YLL calculation to reflect the preference on life years closer to the present. However, there are sociocultural factors worthy of consideration. For example, the value of a year of life gained now compared with one gained in 10 years will depend on societal perceptions of life. Also, when an economic value is attached to a year of life lost, the total values can differ significantly depending on which method is used to calculate the number of years lost.
Using YPLL to rank prematurity-related mortality also has its drawbacks. It does not account for deaths beyond the life expectancy at birth for the country or beyond an arbitrarily selected cut-off age, essentially assigning no burden to death at older ages. Therefore, reporting YPLL often requires a reference to the age threshold against which the YPLL was calculated. YPLL therefore generally underestimates the years lost to disease common in old age. The gulf between YPLL and YLL estimates can be accentuated in countries with ageing populations and ranking can also be tilted in favour of diseases that are common early in life.
This study has several limitations. We have examined the diseases based on the ICD-10 broad categorisation. Therefore, our estimations have not examined the diseases at a granular level. Comparing the burden of disease estimation for the individual diseases is complex in the absence of an objective selection process; however, we have used three crude age categories to select the diseases.
In conclusion, the choice of appropriate metrics of disease burden is important for the prioritisation of research funding. Given the variability in the estimates of the burden of disease with different approaches, there should be transparency regarding the type of metric used and a generally acceptable method that incorporates all the relevant social values should be developed.
bmjopen-2018-027825supp001.pdf (30.7KB, pdf)
bmjopen-2018-027825supp002.pdf (27.4KB, pdf)
bmjopen-2018-027825supp003.pdf (28.3KB, pdf)
bmjopen-2018-027825supp004.pdf (28.8KB, pdf)
bmjopen-2018-027825supp005.pdf (28.7KB, pdf)
Supplementary Material
Footnotes
Contributors: OE and NB conceptualised and designed the study. OE and JR analysed the data. OE wrote the initial draft of the manuscript. JR and NB critically reviewed the manuscript. All authors read and approved the final manuscript.
Funding: This work was supported by the National Health and Medical Research Council (NHMRC) through the Translational Australian Clinical Toxicology Program (TACT) (grant ID1055176).
Competing interests: None declared.
Patient consent for publication: Not required.
Provenance and peer review: Not commissioned; externally peer reviewed.
Data availability statement: Data are available on reasonable request from the corresponding author.
References
- 1. Haenszel W. A standardized rate for mortality defined in units of lost years of life. Am J Public Health Nations Health 1950;40:17–26. 10.2105/AJPH.40.1.17 [DOI] [PMC free article] [PubMed] [Google Scholar]
- 2. Perloff JD, LeBailly SA, Kletke PR, et al. Premature death in the United States: years of life lost and health priorities. J Public Health Policy 1984;5:167–84. 10.2307/3342337 [DOI] [PubMed] [Google Scholar]
- 3. Centre for Disease Control Premature deaths, monthly mortality, and monthly physician contacts-United states. MMWR morbidity and mortality Weekly report 1982, 1982. Available: https://www.cdc.gov/mmwr/preview/mmwrhtml/lmrk019.htm [PubMed]
- 4. Lopez A CJ. A comprehensive assessment of mortality and disability from disease, injures and risk factors in 1990 and projected to 2020. In: The Global Burden of Disease. Geneva: World Health Organization, 1996. [Google Scholar]
- 5. Prüss-Üstün A, Mathers C, Corvalán C, et al. Introduction and methods: assessing the environmental burden of disease at national and local levels, 2003. Available: http://www.who.int/quantifying_ehimpacts/publications/en/9241546204.pdf [Accessed 14 Jun 2018].
- 6. Gardner JW, Sanborn JS. Years of potential life lost (YPLL)—what does it measure? Epidemiology 1990;1:322–9. 10.1097/00001648-199007000-00012 [DOI] [PubMed] [Google Scholar]
- 7. Sanders GD, Neumann PJ, Basu A, et al. Recommendations for conduct, methodological practices, and reporting of cost-effectiveness analyses: second panel on cost-effectiveness in health and medicine. JAMA - J Am Med Assoc 2016;316:1093–103. [DOI] [PubMed] [Google Scholar]
- 8. WHO Department of Health Statistics and Information Systems Who methods and data sources for global burden of disease estimates 2000-2011. Geneva, 2013. [Google Scholar]
- 9. Oliva-Moreno J, Peña-Longobardo L, Alonso S. Loss of labour productivity caused by disease and health problems: What is the magnitude of its effect on Spain’s Economy? Eur J Heal Econ 2012;27:631–7. [DOI] [PubMed] [Google Scholar]
- 10. Yoon J, Seo H, IH O, et al. The non-communicable disease burden in Korea: findings from the 2012 Korean burden of disease study. J Korean Med Sci : 2016. [DOI] [PMC free article] [PubMed] [Google Scholar]
- 11. Maniecka-Bryła I, Bryła M, Bryła P, et al. The burden of premature mortality in Poland analysed with the use of standard expected years of life lost. BMC Public Health 2015;15:101 10.1186/s12889-015-1487-x [DOI] [PMC free article] [PubMed] [Google Scholar]
- 12. World Health Organization Health statistics and information systems: who mortality database. Available: http://www.who.int/healthinfo/mortality_data/en/ [Accessed 21 Jul 2017].
- 13. WHO Department of Health Statistics and Information Systems Global health Observatory data Repository, 2016. Available: http://apps.who.int/gho/data/node.main.LIFECOUNTRY?lang=en [Accessed 24 Mar 2019].
- 14. Mathers C, Vos T, Lopez A, et al. National burden of disease studies: a practical guide. 2nd edn Geneva: World Health Organization, 2001. [Google Scholar]
- 15. Australian Bureau of Statistics Causes of death, Australia, 2017, 2018. Available: https://www.abs.gov.au/AUSSTATS/abs@.nsf/Lookup/3303.0Explanatory Notes12017?OpenDocument [Accessed 24 Mar 2019].
- 16. Gillum LA, Gouveia C, Dorsey ER, et al. Nih disease funding levels and burden of disease. PLoS One 2011;6:e16837 10.1371/journal.pone.0016837 [DOI] [PMC free article] [PubMed] [Google Scholar]
- 17. World Health Organization Health statistics and information systems: national tools 2017, 2017. Available: http://www.who.int/healthinfo/global_burden_disease/tools_national/en/ [Accessed 21 Jul 2017].
- 18. Devleesschauwer B, Havelaar AH, Maertens de Noordhout C, et al. Calculating disability-adjusted life years to quantify burden of disease. Int J Public Health 2014;59:565–9. 10.1007/s00038-014-0552-z [DOI] [PubMed] [Google Scholar]
- 19. World Health Organization The global burden of disease: 2004 update. Geneva: World Health Organization, 2008. [Google Scholar]
- 20. Lopez A, Mathers C, Ezzati M, et al. Global Burden of Disease and Risk Factors. New York: Oxford University Press, 2006. [Google Scholar]
- 21. Melse J, Essink-Bot M-L, Kramers P, et al. A national burden of disease calculation: Dutch disability-adjusted life-years. Am J Public Heal 2000;90. [DOI] [PMC free article] [PubMed] [Google Scholar]
- 22. Barendregt JJ, Bonneux L, Van Der Maas PJ. DALYs: the age-weights on balance. Bull World Health Organ 1996;74:439–43. [PMC free article] [PubMed] [Google Scholar]
- 23. Murray CJL, Acharya AK, DALYs U. Understanding DALYs. J Health Econ 1997;16:703–30. 10.1016/S0167-6296(97)00004-0 [DOI] [PubMed] [Google Scholar]
- 24. Anand S, Hanson K. Disability-adjusted life years: a critical review. J Health Econ 1997;16:685–702. 10.1016/S0167-6296(97)00005-2 [DOI] [PubMed] [Google Scholar]
Associated Data
This section collects any data citations, data availability statements, or supplementary materials included in this article.
Supplementary Materials
bmjopen-2018-027825supp001.pdf (30.7KB, pdf)
bmjopen-2018-027825supp002.pdf (27.4KB, pdf)
bmjopen-2018-027825supp003.pdf (28.3KB, pdf)
bmjopen-2018-027825supp004.pdf (28.8KB, pdf)
bmjopen-2018-027825supp005.pdf (28.7KB, pdf)


