

Abstract
Background
Primary healthcare (PHC) workers often work alone or in isolation. Healthcare managerial supervision is recommended to help assure quality; but this requires skilled supervisors and takes time and resources. It is therefore important to assess to what extent supervision is beneficial and the ways in which it can be implemented.
Objectives
To review the effects of managerial supervision of health workers to improve the quality of PHC (such as adherence to guidance or coverage of services) in low‐ and middle‐income countries.
Search methods
We searched The Cochrane Central Register of Controlled Trials (CENTRAL) 2011, Issue 1, part of The Cochrane Library. www.thecochranelibrary.com, including the Cochrane Effective Practice and Organisation of Care (EPOC) Group Specialised Register (searched 10 March 2011); MEDLINE, Ovid 1950 to March Week 1 2011 (searched 08 March 2011); EMBASE, Ovid 1980 to 2011 Week 12 (searched 08 March 2011); CINAHL, Ebsco 1981 – present (searched 10 March 2011); LILACS, VHL (searched 10 March 2011).
Selection criteria
Randomised controlled trials, controlled before‐and‐after studies, and interrupted time series studies, conducted in PHC in low‐ and middle‐income countries. Supervision includes site visits from a central level of the health system, plus at least one supervisory activity. We excluded studies aimed solely at improving the clinical skills of PHC workers.
Data collection and analysis
We extracted data using a predefined form and assessed for risk of bias using the EPOC risk of bias criteria. Data are presented in a narrative way without pooling the effects on the outcomes as studies and outcomes were diverse.
Main results
Nine studies met the inclusion criteria: three compared supervision with no supervision, five compared enhanced supervision with routine supervision, and one study compared less intensive supervision with routine supervision. Most outcomes were scores relating to providers’ practice, knowledge and provider or user satisfaction. The majority of the outcomes were measured within nine months after the interventions were introduced. In two studies comparing supervision with no supervision, small benefits on provider practice and knowledge were found. For methods of enhancing supervision, we identified five studies, and two studies of frequent supportive supervision demonstrated small benefits on workers performance. The one study examining the impact of less intensive supervision found no evidence that reducing the frequency of visits had any effect on the utilisation of services. The GRADE evidence quality for all comparisons and outcomes was "low" or "very low".
Authors' conclusions
It is uncertain whether supervision has a substantive, positive effect on the quality of primary health care in low‐ and middle‐income countries. The long term effectiveness of supervision is unknown.
Plain language summary
Supervision to improve the quality of primary health care in low‐ and middle‐income countries
Researchers in the Cochrane Collaboration conducted a review of the impact of supervising healthcare workers on the quality of primary health care in low‐ and middle‐income countries. After searching for all relevant studies, they found nine studies. Their findings are summarised below.
Health worker supervision
Supervision from higher levels of the health system, such as district headquarters, to the local level is widely recommended. Supervision is seen as a way of supporting often isolated primary health care workers and ensuring the quality of the health services they provide. However, supervisory visits need certain logistics including time and transport, and can be relatively costly.
The studies in this review took place in nine countries in Africa, Asia and Latin America, in both rural and urban areas. Most of the studies looked at the supervision of health care professionals (including nurses, midwives, health officers and physicians), while two studies examined the effect of supervision on community or lay health workers. The number of supervisory visits generally varied from one to six over a period of up to nine months.
What happens when health workers are supervised?
The evidence was of low to very low quality and the studies showed mixed results. Compared to no supervision, some studies showed that supervision had a small benefit on health worker practices and knowledge, while other studies showed no benefit or were inconclusive. We are therefore uncertain about the effects of supervision on the quality of primary healthcare services.
A summary of this review for policy‐makers is availablehere
Summary of findings
Summary of findings for the main comparison. Supervision versus no supervision to improve the quality of primary health care.
| Supervision versus no supervision to improve the quality of primary health care | ||||||
| Patient or population: providers Settings: low‐ and middle‐income countries Intervention: supervision Comparison: no supervision | ||||||
| Outcomes | Illustrative comparative risks* (95% CI) | Relative effect (95% CI) | No of Participants (studies) | Quality of the evidence (GRADE) | Comments | |
| Assumed risk | Corresponding risk | |||||
| No supervision | Supervision | |||||
| Providers practice | See comment | See comment | Not estimable | 134 (2 studies1) | ⊕⊕⊝⊝ low2,3,4 | 2 RCTs: both studies showed small benefits in provider practice (prescribing & family planning practices) with supervision5 |
| Providers knowledge | See comment | See comment | Not estimable | 134 (2 studies1) | ⊕⊝⊝⊝ very low2,4,6 | 2 RCTs: one showed small benefits in provider knowledge (family planning) with supervision whilst one study (prescribing knowledge) was inconclusive7 |
| Drug supply | Study population | Not estimable | 0 (1 study8,9) | ⊕⊝⊝⊝ very low10 | 1 CBA: study showed small benefit in drug stock management with supervision8 | |
| See comment | See comment | |||||
| Moderate | ||||||
| *The basis for the assumed risk (e.g. the median control group risk across studies) is provided in footnotes. The corresponding risk (and its 95% CI) is based on the assumed risk in the comparison group and the relative effect of the intervention (and its 95% CI). CI: Confidence interval; RR: Risk ratio; | ||||||
| GRADE Working Group grades of evidence High quality: Further research is very unlikely to change our confidence in the estimate of effect. Moderate quality: Further research is likely to have an important impact on our confidence in the estimate of effect and may change the estimate. Low quality: Further research is very likely to have an important impact on our confidence in the estimate of effect and is likely to change the estimate. Very low quality: We are very uncertain about the estimate. | ||||||
1Stanback 2007: A cluster randomised study of family planning services in Kenya: 6 of 13 training areas were randomly assigned to intervention (training plus supervision) or control (training alone). Within each training area family planning providers were randomly selected proportional to size of area. Data were obtained from 177 providers and 482 clients (before) and 176 providers and 451 clients (after 9 to 10 months). Kafle 1995: A cluster randomised study of primary healthcare workers in Nepal: 6 districts were randomly allocated to intervention (supervision visits by district health officers) or control (no intervention). Data was obtained from 21 intervention health facilities and 21 control facilities at baseline and after 7 months. A third study was not included in this profile because it was an observational study. 2 Serious study limitations: Both studies were cluster randomised (and took clustering into account when analysing their results). The baseline outcome measurements of intervention and control groups were similar although the studies did not report on the baseline characteristics for the comparison groups. Neither of the studies blinded the outcome assessor. 3 No serious inconsistency: Both studies found supervision produced small improvements in practice. 4 Serious imprecision: These studies contained a small number of clusters in the intervention and control groups and further used multi‐stage sampling from the cluster areas to select health facilities and posts. 5Stanback 2007 found the overall provider practice sore increased by 22.8% in the intervention group compared to 16.1% in the control group. This difference is reported as statistically significant (P = 0.004). Kafle 1995 found that 3 out of 13 indicators of good prescribing practice were higher in the intervention group following the intervention (P < 0.05) 6 Serious Inconsistency: Stanback 2007 showed a small benefit in knowledge scores in the intervention group compared with the control whereas Kafle 1995 did not demonstrate any significant differences between the intervention and control groups. 7Stanback 2007 found the overall knowledge and attitude sore increased by 19.9% in the intervention group compared with 12.6% in the control group. This difference is reported as statistically significant (P = 0.002). Kafle 1995 conducted a knowledge questionnaire following the intervention and the post intervention scores were inconclusive: knowledge scores in 3 of the 19 indicators higher in the intervention group, 13 were higher in the control group and 3 were the same. No significance values presented. 8Trap 2001 found significant difference in drug stock management score. Following the intervention, the score increased by 7% and decreased by 7% in the control group. The reasons for this decrease are not clear. 9Trap 2001 is a controlled before and after study of primary healthcare workers in Zimbabwe; 24 health facilities were included in each of the intervention and control groups respectively. The intervention group received two supervisory visits three months apart on drug stock management versus no intervention. Outcomes were assessed 6 to 8 months after the last supervisory visit. 10 No serious inconsistency: Only one study and therefore not applicable.
Summary of findings 2. 'Enhanced' versus routine supervision to improve the quality of primary health care.
| 'Enhanced' versus routine supervision to improve the quality of primary health care | ||||||
| Patient or population: providers and users Settings: low‐ and middle‐income countries Intervention: 'enhanced' supervision Comparison: routine supervision | ||||||
| Outcomes | Illustrative comparative risks* (95% CI) | Relative effect (95% CI) | No of Participants (studies) | Quality of the evidence (GRADE) | Comments | |
| Assumed risk | Corresponding risk | |||||
| Routine supervision | 'enhanced' supervision | |||||
| Functional status of community health agents (Ayele 1993) | The mean functional status of community health agents (Ayele 1993) in the control groups was ‐2.6 | The mean functional status of community health agents (Ayele 1993) in the intervention groups was 8.8 higher (0 to 0 higher) | 102 (1 study1) | ⊕⊝⊝⊝ very low2,3,4 | 1 cluster RCT: study showed improvement in performance of community health agents in the intervention group compared to the control group | |
| Overall performance score midwives (Loevinsohn 1995) Scale from: 0 to 60. | The mean overall performance score midwives (Loevinsohn 1995) in the control groups was 4.9 | The mean overall performance score midwives (Loevinsohn 1995) in the intervention groups was 6.4 higher (0 to 0 higher) | 112 (1 study5) | ⊕⊝⊝⊝ very low3,4,6 | 1 CBA: study showed improvement in overall performance score of midwives (service quality, knowledge and management) in the intervention group | |
| Children receiving recommended or adequate care (Rowe 2009) | Moderate | Not estimable | 0 (1 study8) | ⊕⊝⊝⊝ very low3,4,9 | 1 cluster RCT: study found no differences between the intervention and control group when assessing implementation of IMCI quality of care indicators | |
| 7 | ||||||
| Health worker job satisfaction (Sennun 2006) Questionnaire. Scale from: 0 to 165. | The mean health worker job satisfaction (Sennun 2006) in the control groups was 8.4 | The mean health worker job satisfaction (Sennun 2006) in the intervention groups was 25.0 higher (0 to 0 higher)10 | 6 (1 study11) | ⊕⊝⊝⊝ very low2,3,4 | 1 CBA: study found improvements in client satisfaction and perceptions of service quality in the intervention group, but no difference in provider satisfaction | |
| Clients satisfaction (Sennun 2006) Questionnaire. Scale from: 0 to 90. | The mean clients satisfaction (Sennun 2006) in the control groups was ‐2.5 | The mean clients satisfaction (Sennun 2006) in the intervention groups was 5.8 higher (0 to 0 higher) | 390 (1 study11) | ⊕⊝⊝⊝ very low2,3,4 | 1 CBA: study found improvements in client satisfaction and perceptions of service quality in the intervention group, but no difference in provider satisfaction | |
| *The basis for the assumed risk (e.g. the median control group risk across studies) is provided in footnotes. The corresponding risk (and its 95% CI) is based on the assumed risk in the comparison group and the relative effect of the intervention (and its 95% CI). CI: Confidence interval; | ||||||
| GRADE Working Group grades of evidence High quality: Further research is very unlikely to change our confidence in the estimate of effect. Moderate quality: Further research is likely to have an important impact on our confidence in the estimate of effect and may change the estimate. Low quality: Further research is very likely to have an important impact on our confidence in the estimate of effect and is likely to change the estimate. Very low quality: We are very uncertain about the estimate. | ||||||
1Ayele 1993: A cluster randomised study of community health agent (CHAs) in Ethiopia. 52 CHAs were assigned respectively to the intervention (monthly 'supportive' supervision and 5 day training of CHAs) or control (routine supervision). 2 Very serious limitations in design: the study does not meet the EPOC quality criteria of having a minimum of two clusters in each of the comparison groups 3 No serious inconsistency: Not applicable as only one study 4 Serious imprecision: The studies contain a small number of clusters within the intervention and control groups 5Loevinsohn 1995 is controlled before and after study looking at the effectiveness of using a supervisory checklist on midwife performance in the Philippines. 4 intervention and 6 control provinces were selected, and 123 health facilities selected randomly proportional to the population size. 6 Serious limitations: Risk of selection bias as intervention provinces were selected by the programme managers 7 Number of participants not reported. 8Rowe 2009: A cluster randomised study examining the effects of enhanced supervision with a package of supports (intervention) with routine supervision and supports (control) in Benin. I districts was randomly allocated to the intervention and control groups respectively. 9 Serious limitations: there was a slow implementation of IMCI training for health workers and only 29% of supervisory visits took place 10 Analysis was not reported in the study due to the small number of individuals. 11Sennun 2006 is a controlled before and after study looking at the effect of involving the community in the supervisory process (intervention group) versus not doing so (control) in Thailand. Two primary care units were allocated to each of the comparison groups.
Summary of findings 3. 'Less intense' versus routine supervision to improve the quality of primary health care.
| 'Less intense' versus routine supervision to improve the quality of primary health care | ||||||
| Patient or population: providers and users Settings: low‐ and middle‐income countries Intervention: less 'intensive' supervision Comparison: routine supervision | ||||||
| Outcomes | Illustrative comparative risks* (95% CI) | Relative effect (95% CI) | No of Participants (studies) | Quality of the evidence (GRADE) | Comments | |
| Assumed risk | Corresponding risk | |||||
| Routine supervision | Less 'intensive' supervision | |||||
| New clients gained by health facility based posts (number per quarter) Daily log completed by the supervisor reporting activities of providers | The mean new clients gained by health facility based posts (number per quarter) in the control groups was 3.5 New clients | The mean new clients gained by health facility based posts (number per quarter) in the intervention groups was 2.1 higher (0 to 0 higher) | 247 (1 study1) | ⊕⊕⊝⊝ low2,3,4 | 1 cluster RCT: study found no differences in three quality of care indicators in the intervention groups compared to the control groups | |
| New clients gained by community‐based posts (number per quarter) Daily log completed by the supervisor reporting activities of providers | The mean new clients gained by community‐based posts (number per quarter) in the control groups was 0.76 New clients | The mean new clients gained by community‐based posts (number per quarter) in the intervention groups was 3.4 higher (0 to 0 higher) | 247 (1 study1) | ⊕⊕⊝⊝ low2,3,4 | 1 cluster RCT: study found no differences in three quality of care indicators in the intervention groups compared to the control groups | |
| Average number of revisits per quarter (health‐facility‐based posts) Daily log completed by the supervisor reporting activities of providers | The mean average number of revisits per quarter (health facility based posts) in the control groups was 10.6 New clients | The mean average number of revisits per quarter (health facility based posts) in the intervention groups was 0.7 lower (0 to 0 higher) | 247 (1 study1) | ⊕⊕⊝⊝ low2,3,4 | 1 cluster RCT: study found no differences in three quality of care indicators in the intervention groups compared to the control groups | |
| Average number of revisits per quarter (community‐based posts) Daily log completed by the supervisor reporting activities of providers | The mean average number of revisits per quarter (community‐based posts) in the control groups was 1.4 New clients | The mean average number of revisits per quarter (community‐based posts) in the intervention groups was 14.9 higher (0 to 0 higher) | 247 (1 study1) | ⊕⊕⊝⊝ low2,3,4 | 1 cluster RCT: study found no differences in three quality of care indicators in the intervention groups compared to the control groups | |
| *The basis for the assumed risk (e.g. the median control group risk across studies) is provided in footnotes. The corresponding risk (and its 95% CI) is based on the assumed risk in the comparison group and the relative effect of the intervention (and its 95% CI). CI: Confidence interval; | ||||||
| GRADE Working Group grades of evidence High quality: Further research is very unlikely to change our confidence in the estimate of effect. Moderate quality: Further research is likely to have an important impact on our confidence in the estimate of effect and may change the estimate. Low quality: Further research is very likely to have an important impact on our confidence in the estimate of effect and is likely to change the estimate. Very low quality: We are very uncertain about the estimate. | ||||||
1Foreit 1984 is a cluster RCT of community‐based family planning distribution workers in Brazil. 6 regions were assigned to the intervention and control group, with 6 supervisors in each group and 140 and 138 community‐based workers respectively. The intervention group received quarterly supervision visits over 9 months whilst the control group continued to receive monthly supervisory visits 2 Serious limitations: No baseline characteristics or outcomes provided 3 No serious inconsistency: Not applicable as only one study 4 Serious imprecision: The studies contain a small number of clusters within the intervention and control groups
Background
Description of the condition
Management guidelines in primary healthcare (PHC) services and disease control programmes in low‐ and middle‐income countries often recommend supervision (Flahault 1988; McMahon 1992); that is, staff from the centre (usually the district headquarters) supporting PHC staff carrying out public health activities and providing clinical care in health units that are often isolated.
In 1978, the World Health Organization and others emphasised universal access to health services (WHO 1978a). This overloaded existing district healthcare systems, which provide a structure for healthcare delivery in a defined geographical area, and led to a rapid expansion of the healthcare network, including health posts in rural areas and shanty towns (Cueto 2004). In the district structure, basic health care is often provided by paramedical and lay health workers working alone or in small teams in remote rural areas (Greenwood 1990) suffering from communication problems and isolation (Loevinsohn 1995). Supervision helps link the peripheral health units and the district centre. Supervision was a managerial activity typically carried out by a district director (WHO 1991) or by health staff supervising lay health workers (Gill 1990). Supervision, however, became more difficult to implement due to the increasing numbers of health facilities in even increasingly remote areas (Kleczkowski 1984). Supervision is consistently focusing on line management with an emphasis on the control and support of health staff undertaking delegated functions at primary healthcare level, such as infrastructures or financial management.
In high‐income countries, rural healthcare providers working in aboriginal communities face similar problems of isolation, heavy work load, limited opportunities for professional development (Ministerial 2002) and low numbers and retention of personnel (Burns 1998). In these settings, supervision tends to be implemented with sophisticated means such as video conferencing and video recording (Lin 2006) and falls beyond the scope of this review. Studies from high income countries were excluded.
Description of the intervention
Supervision is conceptualised as the link between district and peripheral health staff, and is considered important in staff motivation and performance. Supervision often includes aspects of problem solving, reviewing records and observing clinical practice. Supervision mostly means visiting supervisees, but also includes meetings in the centre. A review conducted by two of the review authors (Bosch‐Capblanch 2008) showed a wide range of ways of defining and implementing supervision (e.g. visits to the periphery, meetings at the district capital or diverse profiles of supervisors).
How the intervention might work
In an earlier systematic review of supervision undertaken by two of the review authors (Bosch‐Capblanch 2008), it was found that supervision sometimes, but not always, demonstrated small positive effects in some of the outcomes that were assessed. However, various methodological issues were noted in these studies, including variable trial quality and limited follow‐up.
Providing supervision is not easy: supervisors need transport, time and basic supportive managerial skills (WHO 1994). Health staff may prioritise direct clinical care over managing others (Kleczkowski 1984). Supervision has also 'implicitly' been seen as a means of earning extra allowances (Aitken 1994), such as per diems or accomodation costs. Furthermore, specific programmes offer allowances and other resources, which influence the priorities of staff and of the health system as a whole (Bennet 1994; Cairncross 1997). Supervision is also costly due to the time and resources involved. For example, it has been estimated that the relative expense of frequent supervision can represent up to 40% of the total cost of a community health worker (Gill 1990).
Why it is important to do this review
Kilminster 2000 undertook a literature review of clinical supervision from a medical education perspective, including clinical care, nursing, social work, teaching, psychology and counselling. Supervision was defined as the "provision of monitoring, guidance and feedback on matters of personal, professional and educational development in the context of the doctor's care of patients". O'Brien 2008, in a systematic literature review, looked at educational outreach visits: "use of a trained person who meets with providers in their practice settings to provide information with the intent of changing the provider's performance". Both reviews focus on clinical practice from an educational perspective. Although this aspect may be included in managerial supervision of PHC in low‐ and middle‐income countries, educational or clinical supervision in those reviews differs from managerial supervision in that supervisors are not necessarily staff from a more central level; supervision is not the main link between health system tiers; supervision has a clinical and educational focus; it is not part of the regular district management procedures; and such supervision does not include predominantly administrative or managerial activities.
Objectives
To review the effects of managerial supervision of health workers on the quality of PHC (such as adherence to guidance or coverage) in low‐ and middle‐income countries.
Methods
Criteria for considering studies for this review
Types of studies
Randomised controlled trials (RCT), non‐randomised controlled trials (NRCT), controlled before‐and‐after studies (CBA) and interrupted time series studies (ITS).
Types of participants
Healthcare units (health centres or posts) or providers (including lay health workers) at PHC level in low‐ and middle‐income countries (countries with a Gross National Income per capita of 3,465 USD or less (World Bank).
Primary healthcare is defined as the first level of contact of individuals, the family and community with the health system (WHO 1978b). The review includes low‐ and middle‐income countries because managerial supervision has historically been linked to the expansion and then to the reform of health systems in those countries.
Types of interventions
Routine supervision visits by health staff from a centre (such as a district office) to PHC staff in both urban and rural areas. Interventions had to include at least one supervisory activity (such as checking supplies or providing feedback on activity reports). Supervision had to be provided alone or as part of a broader health service strengthening package.
We excluded studies reporting visits of health staff aiming solely at improving the clinical skills of PHC providers (i.e. clinical care or procedures) as these have already been covered in another review (O'Brien 2008).
Comparison: no supervision visits; or standard supervision when comparing with enhanced (measures to strengthen standard supervision) or less intensive forms of supervision.
Types of outcome measures
Primary outcomes
Service quality measures, including changes in provider practice, adherence to guidelines or service coverage.
Secondary outcomes
Population‐ or patient‐based surveys of satisfaction or service acceptability.
Change in provider knowledge.
Providers' satisfaction with supervision.
Service utilisation of healthcare services.
Costs of supervision.
Search methods for identification of studies
We attempted to identify studies in any language regardless of their publication status (published, unpublished, in press and in progress). We ran several incremental searches as the review advanced; the last one was conducted in March 2011.
We searched the following electronic bibliographic databases:
The Cochrane Central Register of Controlled Trials (CENTRAL) 2011, Issue 1, part of the The Cochrane Library.www.thecochranelibrary.com, including the Cochrane Effective Practice and Organisation of Care (EPOC) Group Specialised Register (searched 10 March 2011)
MEDLINE, Ovid 1950 to March Week 1 2011 (searched 08 March 2011)
EMBASE, Ovid 1980 to 2011 Week 12 (searched 08 March 2011)
CINAHL, Ebcsco 1981 – present (searched 10 March 2011)
LILACS, VHL (searched 10 March 2011).
The search strategy for electronic databases was developed using the methodological components of the EPOC search strategy combined with selected MeSH terms and free text terms relating to supervision in low‐ and middle‐income countries. The MEDLINE strategy was translated into the other databases vocabulary as applicable.
Full search strategies for all databases are included in Appendix 1.
In addition, we scrutinised the reference lists of the included studies. We asked projects or agencies mentioned in the included studies as financing or implementing projects in low‐ and middle‐income countries to provide further references of similar studies.
Data collection and analysis
Selection of studies
From the search results, we retrieved potentially relevant studies and identified duplicate publications. We scrutinised abstracts and full papers to identify potentially relevant studies. These were independently assessed for inclusion by two review authors (XBC and SL) using a standard form. We resolved disagreements by discussion or by consulting PG or a member of the EPOC group. We attempted to contact the authors of the studies for further information where necessary. Excluded studies and the reasons for their exclusion are detailed in Characteristics of excluded studies.
Data extraction and management
One review author (SL) extracted data using a predefined form and a second review author (XBC) checked the data, using variables identified in a preliminary analysis (Bosch‐Capblanch 2008), which included: country, geographical area, year of the study, healthcare setting, explicit definition of supervision, supervisors' and supervisees' profiles, type, frequency and duration of encounters, content of supervision and outcomes.
Assessment of risk of bias in included studies
Two review authors (XBC and SL) assessed the risk of bias of the studies using a form with the standard criteria described in EPOC 2002. When information in the studies was not sufficient, we attempted to contact the study authors to provide further details. 'Risk of bias' assessments are displayed in the table Characteristics of included studies.
We did not exclude studies on the grounds of risk of bias but sources of bias are reported explicitly when presenting the results of the studies.
Measures of treatment effect
There was a great variety of healthcare settings, modalities of supervision and outcomes, making it very difficult to quantitatively combine the results. Instead, results are presented in tables showing the main characteristics of the studies and the effects on the outcomes. For binary outcomes, the number of participants experiencing the event in each group and percentages or odds ratios (ORs) are presented. For continuous outcomes means and standard deviations (SDs) or medians and interquartile ranges, as appropriate, are presented.
Unit of analysis issues
Some of the included studies were based on cluster or multi‐stage random sampling techniques. We have reported potential errors in the unit of analyses when sampling designs had not been taken into account in the analyses of data. We did not attempt to re‐analyse data.
Dealing with missing data
We did not attempt to impute or model missing data. Missing data on outcomes are explicitly indicated in the tables and text.
Data synthesis
We compiled the results from the included studies into tables (Additional tables), grouping them by comparisons based on the nature of the control groups.
Within each comparison, we further grouped studies by the type of outcome. A narrative of the results is presented based on these tables.
Due to the very varied studies, it was not possible in this review to combine the results for a statistical analysis. In future updates, if possible, for binary outcomes we will record the number of participants experiencing the event in each group and calculate the ORs. For continuous outcomes, we will extract the arithmetic means and SDs or medians and interquartile ranges, as appropriate. We will calculate percentages of change (in CBA studies) and measures of trend (ITS studies), immediate and long term. Where possible, we will perform subgroup analyses considering risk of bias, modalities or tools used for implementing supervision, healthcare organisational arrangements or types of problems addressed by supervision. We will use standard meta‐analytic techniques of presenting and combining binary and continuous outcomes using a random‐effects model, if the data become available and such analyses are appropriate. Where relevant, we will perform other data analysis methods such as assessment of heterogeneity, assessment of reporting biases and sensitivity analysis in accordance with the latest EPOC guidelines.
Results
Description of studies
Results of the search
We included nine studies. The searches up to March 2011 identified 2,290 articles: 770 were duplicates and we excluded 1,445 based on the title or abstract. We examined the full text of the remaining 75 potentially relevant studies of which, we excluded 66 (see Characteristics of excluded studies).
Included studies
Of the nine included studies (see Characteristics of included studies), there were five cluster RCTs (Ayele 1993; Foreit 1984; Kafle 1995; Rowe 2009; Stanback 2007) and four CBAs (Loevinsohn 1995; Sennun 2006; Trap 2001; Uys 2005). Included studies were conducted in Africa (Benin, Ethiopia, Kenya, South Africa, Zimbabwe), Asia (Nepal, Philippines, Thailand) and Latin America (Brazil). The primary healthcare setting was located in rural areas in five studies (the study conducted in the Philippines (Loevinsohn 1995) did not specify), and in three other studies, the healthcare setting was both rural and urban (Brazil, Benin, and Thailand).
Four of the studies examined supervision in the context of general PHC (Ayele 1993; Loevinsohn 1995; Sennun 2006; Uys 2005), whilst two studies focused on family planning (Foreit 1984; Stanback 2007), two on drug management (Kafle 1995; Trap 2001) and one on child health (Rowe 2009). Most of the studies looked at the supervision of professional healthcare staff (including nurses, midwives, health officers and physicians), with the exception of Ayele 1993 and Foreit 1984 which examined the effect of supervision on community or lay health workers.
Characteristics of supervision
The number of supervisory visits undertaken in the studies varied between one and six over a period up to nine months. Uys 2005 and Sennun 2006 did not specify the number of supervisory visits. Rowe 2009 was a long‐term study over five years, with two recommended supervisory visits every three months.
The studies were group based on three comparisons:
three studies compared supervision with no supervision,
five studies compared enhanced supervision versus routine supervision, and
one study compared less intensive supervision with routine supervision.
Outcomes
All outcomes assessed related to service quality, user satisfaction, providers’ knowledge and satisfaction. Other outcomes included cost of supervision and service utilisation. All outcomes assessed are listed in the Characteristics of included studies table.
Excluded studies
The Characteristics of excluded studies table describes the reasons for exclusion of studies considered in the final assessment.
Risk of bias in included studies
All studies
The risk if bias in studies was variable (Figure 1 and Figure 2).Three of the studies met six of the nine EPOC 'Risk of bias' criteria (Ayele 1993; Rowe 2009; Stanback 2007). However, Ayele 1993 and Rowe 2009 had less than two clusters in the comparison group and we classified them as being of low quality. We also considered another five studies to be of low quality; they met between two and five of the EPOC risk of bias criteria (Foreit 1984; Kafle 1995; Loevinsohn 1995; Sennun 2006; Trap 2001), while one study failed to meet any of the criteria (Uys 2005).
1.
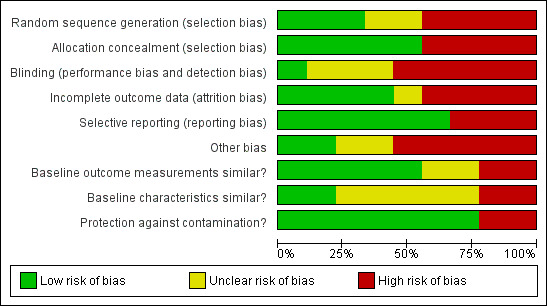
Risk of bias graph: review authors' judgements about each risk of bias item presented as percentages across all included studies.
2.
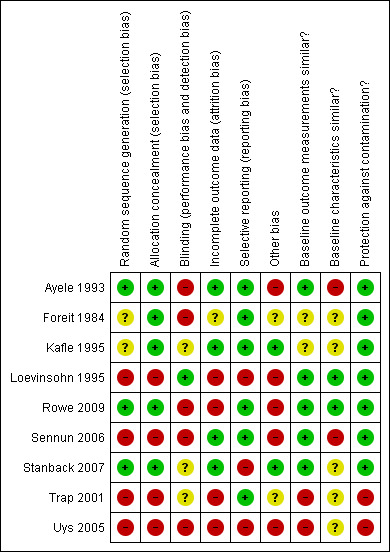
Methodological quality summary: review authors' judgements about each methodological quality item for each included study.
Four studies (Ayele 1993; Rowe 2009; Sennun 2006; Uys 2005) had less than two clusters in the comparison groups. Although this met the inclusion criteria as specified in our protocol, it is below the standard EPOC guidelines for the inclusion of studies.
Cluster randomised controlled trials
Inadequate blinding in the assessment of outcomes was an issue in all five of the cluster RCTs, with studies either failing to blind assessors or not making this clear. Four of the studies failed to demonstrate that the baseline characteristics of the comparison groups were similar (Ayele 1993; Foreit 1984; Kafle 1995; Stanback 2007). Two of the studies did not have adequate follow‐up (Foreit 1984; Rowe 2009); two did not specify sources of funding (Ayele 1993; Foreit 1984); or failed to demonstrate adequate randomisation and similar baseline outcome measurements between the comparison groups (Foreit 1984; Kafle 1995). Only one study (Stanback 2007) had evidence of selective reporting. All of the studies were adequately protected against contamination and had adequate allocation concealment.
Controlled before and after studies
Selection bias was an issue for all four of the CBA studies. Three of the studies did not ensure adequate follow‐up (Loevinsohn 1995; Trap 2001; Uys 2005); or failed to demonstrate the adequate blinding of assessors of outcomes and that the baseline characteristics of the comparison groups were similar (Sennun 2006; Trap 2001; Uys 2005). Two of the studies had evidence of selective reporting: Loevinsohn 1995 reported data on six of the 20 indicators studies and Uys 2005 provided data for the control group only for the outcome of satisfaction with supervision; or failed to demonstrate that they were adequately protected from contamination and did not have similar baseline outcome measurements (Trap 2001; Uys 2005). Other risks of bias included statistical analysis not taking into account clustering (Loevinsohn 1995; Rowe 2009) or multi‐stage sampling (Trap 2001).
Effects of interventions
See: Table 1; Table 2; Table 3
1: Supervision versus no supervision
See Table 4. Three studies compared supervision with no supervision. Two of these related to drug stock management and drug prescribing (Kafle 1995; Trap 2001) and one related to family planning (Stanback 2007). Two studies (Kafle 1995; Stanback 2007) reported that supervision, compared with no supervision, produced small positive effects in provider practice. However, Trap 2001 did not show any improvement in provider practice, although it did find that supervision compared with the control group had a small positive effect in drug stock management . Supervision was also found to have a small positive effect on provider knowledge in Stanback 2007 although not in Kafle 1995.
1. Outcomes for the comparison between supervision and no supervision.
| Outcomes | Outcome measurement | Arms | N | Pre | Change | P‐values | Review Authors' Interpretation | Comments |
| Providers practice | ||||||||
| Kafle 1995 ‐ I: supervision and monitoring with feedback. C: no supervision. | ||||||||
| Prescribing practice (13 indicators) Scores in % | Patient and facility records | I | 21(clinics) | 26.9% | +13.6% | 3 of 13 indicators showed significant improvements (P > 0.05, I vs C) | Some evidence that supervision improves prescribing practices | Indicator shown corresponds to "% prescriptions according to guidelines", as an example. |
| C | 21 (clinics) | 29.9% | ‐6.8% | |||||
| Stanback 2007 ‐ I: training of providers + cascade training package + 1 supervisory visit. C: same without supervisory visit. | ||||||||
| Provider practice in 34 items relating to family planning practices. Overall score in % | Provider questionnaire | I | 48 (clinics) | 48.8% | +22.8% | 0.004 (multivariate analysis) | Some evidence supervision improves provider practice | Addition of supervision significantly improved provider xºpractice scores at P < 0.05. |
| C | 44 (clinics) | 47.5% | +16.1% | |||||
| Trap 2001 ‐ I: two supervisory visits on adherence to guidelines and stock management. C: no supervision. | ||||||||
| Adherence to standard treatment guidelines (drug use). Overall score in %. | Patient records | I | 23 (health facilities) | 54% | +19% | 0.34 (I vs C) | Some evidence that supervision improves adherence to treatment guidelines | Overall score not significantly different at P > 0.05 but 3 out of 4 conditions showed significant improvements at P <0.05 |
| C | 18 (health facilities) | 73% | ‐10% | |||||
| Provider knowledge | ||||||||
| Kafle 1995 ‐ I: supervision and monitoring with feedback. C: no supervision. | ||||||||
| Prescriber knowledge about 8 diseases (19 indicators). Scores in % | Questionnaire | I | 21 (clinics) | NA | NA | Not shown. | No evidence that supervision improves provider knowledge | Only post intervention data gathered showing scores in 3 of the 19 indicators higher in the intervention group, 13 were higher in the control group and 3 were the same. |
| C | 21 (clinics) | NA | NA | |||||
| Stanback 2007 ‐ I: training of providers + cascade training package + 1 supervisory visit. C: same without supervisory visit. | ||||||||
| Provider knowledge on 19 items about family planning. Overall score in % | Provider questionnaire | I | 48 (clinics) | 59.7% | +19.9% | 0.02 (multivariate analysis) | Some evidence that supervision improves provider knowledge and behaviour | Addition of supervision significantly improved overall provider knowledge scores at P < 0.05. Scores for 10 out of 19 individual indicators provided, only one shows a significant improvement at P < 0.05. |
| C | 44 (clinics) | 59.9% | +12.6% | |||||
| Other | ||||||||
| Trap 2001 ‐ I: two supervisory visits on adherence to guidelines and stock management. C: no supervision. | ||||||||
| Performance on drug and medical supplies stock management (9 indicators). Overall score in %. | Health facility records | I | 21 (health facilities) | 56% | +7% | <0.001 (I vs C) | Some evidence that supervision improves stock management of drugs | Significant improvement in performance on drug stock management compared to the control (P < 0.05). 6 out of 9 individual indicators showed significant improvements when compared to the control (P < 0.05) |
C: Control; I: Intervention.
The detailed results for each study are as follows.
Kafle 1995 is a cluster RCT in which health workers in the intervention group received two supervisory visits by district medical officers trained in the use of supervision tools and providing feedback.
In the intervention group, three out of 13 indicators of good prescribing practice, measured using patient and health facility records, were significantly higher compared with the control group (P < 0.05). These were an increase in mean consultation time (from two minutes one second to two minutes and 21 seconds), percentage of cases with prescriptions in accordance with guidelines (from 26.9% to 40.5%) and a reduction in the percentage of injection encounters (from 20.0% to 4.7%). The other ten indicators did not show statistically significant changes.
Some provider knowledge items were also tested, where supervision produced greater post‐interventions scores in only three of the 19 items (no statistical significance reported).
Stanback 2007 is a cluster RCT in which selected nurses and midwifes in the control group received a two‐day training course on family planning together with a cascade training package. The intervention group received the same as the control, with the addition of a single supervisory visit. The authors measured provider practice and provider knowledge using provider questionnaires.
The score in the intervention group increased by 22.8 points from the baseline, compared with an increase of 16.1 points in the control group (maximum score 100), with both groups having similar baseline scores (P = 0.004). The authors reported that the incremental cost‐effectiveness ratio of supervision was 67.86 USD per one‐point increase in the scores, which could be reduced to 20.81 USD if supervision was implemented at scale.
The intervention group increased providers' outcomes (aggregated knowledge and attitude and practices items) by 19.9 points from the baseline (maximum score 100), compared with 12.6 points in the control group (similar baseline scores; P = 0.002). The paper presented the results of the 10 knowledge indicators used in the global score and only one of these showed a statistically significant improvement in the intervention group compared with the control ('knowledge that the intrauterine device effectiveness lasts at least 10 years', from 52% to 76%, P < 0.05).
In Trap 2001, a CBA, the health workers in the two intervention groups received two supervisory visits by pharmacists or pharmacy technicians trained in drug stock management and standard treatment guidelines. It measured a score of adherence to standard treatment guidelines for drug use based on patient records and drugs management using health facility records.
In the intervention group, the score increased by 19 points whereas in the control group it reduced by 10 points (maximum score 100). However, there was an imbalance in the baseline outcome measurements, with a baseline difference of 19 points between the two groups. The overall score change was reported not to be statistically significant (P = 0.3). The paper presents the results of four indicator conditions used in the composition of the overall score and three of these showed statistically significant improvements in the intervention group compared with the control (P < 0.05). Baseline measures showed differences, although these were not statistically tested.
In the intervention group, the summary score for drugs management (e.g. drug availability, use of stock cards) increased by seven points (maximum score 100) whereas in the control group it reduced by seven points (similar baselines, P < 0.001). In the intervention group, compared with the control group, six out of nine of the individual indicators showed statistically significant improvements with P < 0.05.
In summary, supervision compared with no supervision may improve provider practices and knowledge (two studies of low quality evidence).
2: Enhanced versus routine supervision
See Table 5. Five studies examined the impact of enhancing supervision in the intervention group compared with a control group receiving standard supervision: for example, regular, monthly, supportive supervision (Ayele 1993), use of checklists (Loevinsohn 1995), providing a package of support (Rowe 2009), community involvement in supervision (Sennun 2006) and the use of different models of supervisory training (Uys 2005). Three of these studies showed no significant benefit of implementing these enhancements on a range of outcomes and Ayele 1993 and Loevinsohn 1995 found improvements in the performance of health workers in the intervention group compared with the control.
2. Outcomes for the comparison between supervision and enhanced supervision.
| Outcomes | Outcome measurement | Arms | N | Pre | Change | P‐values | Review Authors’ Interpretation | Comments |
| Providers practice | ||||||||
| Rowe 2009 – I: training on IMCI for health workers + enhanced supervision + enhanced package of support. C: training on IMCI for health workers + routine supervision + usual support package | ||||||||
| % of children receiving recommended care | Observation of consultations, exit interviews, clinical re‐examination, health facility assessment and health worker interviews | I | Not stated | 16% | +24% | > 0.05 (I vs C) | No evidence that enhanced supervision with a package of support improves outcomes |
|
| C | Not stated | 22% | +13% | |||||
| % of children receiving recommended or adequate care | I | Not stated | 24% | +19% | > 0.05 (I vs C) | |||
| C | Not stated | 27% | +19% | |||||
| Mean % of needed IMCI tasks that were performed per child | I | Not stated | 24% | +30% | > 0.05 (I vs C) | |||
| C | Not stated | 24% | +31% | |||||
| Uys 2005 – I1: training of supervisors using Modified Matrix (MM) model. I2: training of supervisors using CHESS model. C: routine training of supervisors. | ||||||||
| Quality of care in clinics for diabetes and hypertension management. Overall score, maximum 15. | Checklist based on standard treatment guidelines and essential drugs list | I1 | B: 59; A: 48 (clinics) | 11 | +1 | P > 0.05 (BA change in groups) | No evidence that CHESS or MM training of supervisors improves quality of care in clinics | Data for control group not stated. No significant differences in quality of care in clinics between MM and CHESS models of supervisor training (P > 0.05) |
| I2 | B: 22; A: 47 (clinics) | 10 | +1 | |||||
| C | Not assessed | ‐ | ‐ | |||||
| Provider satisfaction | ||||||||
| Sennun 2006 – I: community leaders involvement in supervision. C: routine supervision. | ||||||||
| Health officer job satisfaction. Overall score, maximum 165 | 33 item questionnaire. | I | 3 (providers) | 109.7 | +16.6 | P > 0.05 (Sample size too small) | No evidence that involving community leaders in supervision improves provider job satisfaction | Greater improvement in job satisfaction in intervention arm, although not significant at P < 0.05 due to small numbers of health officers surveyed |
| C | 3 (providers) | 105.3 | +8.4 | |||||
| Uys 2005 – I1: training of supervisors using Modified Matrix (MM) model. I2: training of supervisors using Centre for Health and Social Studies (CHESS) model. C: routine training of supervisors. | ||||||||
| Nurse perceptions on supervision. Overall score, maximum 60. | 12 items supervision rating scale | I1 | B: 70; A: 45 (providers) | 33 | ‐1 | P > 0.05 (BA change in groups) | No evidence that CHESS training of supervisors improves provider perception of supervision | No before data for the MM model. |
| I2 | B: 0; A: 11 (providers) | ‐ | ‐ | |||||
| C | B: 12; A: 31 (providers) | 20 | +16 | |||||
| Nurse job satisfaction. Overall score, maximum 190 | Based on Traynor and Wade 1993 with Likert scale | I1 | Not stated | 122 | ‐47 | ‐ | No evidence that CHESS training of supervisors improves provider job satisfaction |
No data for control group. No before data for MM model. |
| I2 | Not stated | ‐ | 75.5 (end score) | |||||
| C | Not stated | ‐ | ‐ | |||||
| User satisfaction | ||||||||
| Sennun 2006 – I: community leaders involvement in supervision. C: routine supervision. | ||||||||
| Client’s perception of service quality. Overall score, maximum 95 | 19 items questionnaire | I | 195 (clients) | 80.8 | +0.1 | P = 0.001 (after scores in both groups) | No evidence that community involvement in supervision improves clients perception of service quality | No improvement in the intervention group demonstrated |
| C | 195 (clients) | 80.5 | ‐2.7 | |||||
| Clients care satisfaction (maximum score 90) | 18 items questionnaire | I | 195 (clients) | 72.7 | +3.3 | P = 0.001 (after scores in both groups) | Some evidence that community involvement in supervision improves clients care satisfaction | Small improvement in clients care satisfaction in the intervention arm compared to control with similar baselines (P = 0.001) |
| C | 195 (clients) | 74 | ‐2.5 | |||||
| Uys 2005 – I1: training of supervisors using Modified Matrix (MM) model. I2: training of supervisors using CHESS model. C: routine training of supervisors. | ||||||||
| Patient satisfaction. Overall score, maximum 28. | 36 items questionnaire | I1 | B: 123; A: 20 (patients) | 11 | +4 | P > 0.05 (BA change in groups) | No evidence that CHESS or MM training of supervisors improves patient satisfaction | Data for control group not stated. No significant differences in patient satisfaction between MM and CHESS models of supervisor training (P > 0.05) |
| I2 | B: 52; A: 30 (patients) | 14 | 0 | |||||
| C | Not stated | ‐ | ‐ | |||||
| Other | ||||||||
| Ayele 1993 – I: intensive monthly supervision. C: routine supervision. | ||||||||
| Mean functional status of community health agents (CHAs): 13 indicators (10 quality of care, 3 management activities). Overall score, maximum not stated | Checklist completed by CHAs and supervisors. | I | 50 (providers) | 13.1 | +6.2 | < 0.001 (between groups) | Some evidence that increasing intensity of supervision to monthly improves performance of community health workers. | Significant improvement in overall functional status score in intervention group compared to the control group at six months following baseline (P < 0.05). 10 of the 13 indicators were significantly higher in the intervention group compared to the control group at 6 months (P < 0.05). |
| C | 52 (providers) | 12.1 | ‐2.6 | |||||
| Loevinsohn 1995 – I: supervision with training of supervisors and use of checklist. C: routine supervision with no training or checklists. | ||||||||
| Overall performance score of midwives. Overall score, maximum 60 | 20 indicators from checklist used by supervisors. | I | 49 (health facility) | 26 | +11.3 | P = 0.003 (I vs C) | Some evidence that checklists with training improves performance. The intervention increased frequency of supervision. | Greater improvement in 16 of the 20 individual indicators in the intervention group compared to the control group (data presented for only 6 indicators); statistical significance not available. |
| C | 63 (health facility) | 27 | +4.9 | |||||
| Uys 2005 – I1: training of supervisors using Modified Matrix (MM) model. I2: training of supervisors using CHESS model. C: routine training of supervisors. | ||||||||
| Quality of patient documentation in hospitals – score (%) | Patient records (82 criteria on Nursing Records Standard sheets) | I1 | B: 45; A: 46 (records) | 15 | ‐3.9 | P > 0.05 (BA change in groups) | No evidence that CHESS or MM training of supervisors improves quality of patient documentation | No statistically significant difference between comparison groups (P > 0.05) |
| I2 | B: 45; A: 45 (records) | 16.5 | ‐5.5 | |||||
| C | B: 44; A: 45 (records) | 13 | ‐2 | |||||
A: after; B: before; C: Control; I: Intervention.
2.1 Regular, monthly, “supportive” supervision: effect on workforce performance
In Ayele 1993, a cluster RCT, Community Health Agents (CHAs) in the intervention group received five‐day refresher training plus monthly supervision by the health station supervisors (qualified as ‘supportive’). The control group received non‐systematic and irregular supervision, which on average occurred approximately every two months.
In the intervention group, compared with the control group, the performance of CHA at six months (“Functional Status” score defined with 13 criteria, such as number of outreach visits, home visits, MCH activities) significantly improved (increase of six points at six months in the interventions group and decrease of three points in the control group, P < 0.001). The score in the intervention group increased by 6.2 points (maximum score not stated) whereas in the control group it decreased by 2.6 points (similar baseline scores). Ten of the 13 criteria were significantly higher in the intervention group compared with the control (P < 0.05).
2.2 Supervisory checklists and supervisors training: effect on workforce performance
In Loevinsohn 1995, a CBA, the intervention group received supervisory visits by public health nurses, municipal health officers or district/provincial supervisors who had received two‐day training in the use of an Integrated Supervisory Checklist, on the theory of supervision and how to give effective feedback. The control group received routine supervision, i.e. no training of supervisors or checklists. Both comparison groups received an average of 4.5 supervisory visits over six months.
The overall performance of midwives was measured by supervisors using 20 indicators relating to service quality, knowledge of midwives and management (maximum score 60). The overall score in the intervention group increased by 11.3 points from the baseline, compared with an increase of 4.9 points in the control group (both groups had similar baseline scores; P = 0.003). The paper states that there was a greater improvement in other indicators without showing the data.
The study reported that the additional cost of training supervisors and printed materials for the checklist was 19.92 USD per health facility, with an annual recurrent cost estimated to be 1.85 USD per health facility.
2.3 Multi‐faceted “package of support": effect on quality of care
Rowe 2009, a cluster RCT, assessed the impact of multi‐faceted interventions to support the implementation of Integrated Management of Childhood Illnesses (IMCI) after training health workers on IMCI guidelines. In the intervention group, the health workers (nurse, nurse aids and physicians) were given an enhanced package of support (see Characteristics of included studies for full details) which included a five‐day workshop for supervising physicians, a supervisory checklist, supervision of supervisors by a senior paediatrician, training for health workers on the supervision checklist and quarterly workshops for supervisors to present supervision results. Two supervisory visits every three months were recommended in the intervention group, although in practice, only 29% of these supervisory visits actually took place. In the control group, routine training of supervisors and supervision visits were undertaken. The frequency of supervisory visits in the control group was not specified.
Three outcomes were measured: 1) the percentage of children receiving recommended care, 2) the percentage of children receiving recommended or adequate care (defined by the authors as 100% minus the percentage receiving inadequate treatment) and 3) the mean percentage of IMCI tasks that were performed. The outcomes were measured using a mixture of observations of consultations, interviews with caretakers and health workers, assessment of health records and clinical re‐examinations. The study found no significant differences in the intervention group compared with the control in all three of the outcome measures (P > 0.05) using an intention‐to‐treat (ITT) analysis.
The authors state that the intervention effect was diluted due to the slow implementation of IMCI training. A per protocol analysis using a pre‐post study design with a non‐randomised control showed that the intervention group with only IMCI trained workers included had significant improvements in the proportion of children receiving recommended and in the number of IMCI tasks performed (from 21.3% to 50% in the intervention group and from 17.0% to 23.5% in the control group, P < 0.05), although no differences were found for those receiving recommended or adequate care (P > 0.05).
A cost‐effectiveness analysis reported that compared with a routine package of support, an enhanced package of support cost 0.58 USD (95% CI 0.03 USD, 1.46 USD) per additional child receiving the recommended treatment.
2.4 Community participation in supervision: effect on patients and providers
In Sennun 2006, a CBA, both the intervention and control group district supervisors (graduate nurses, technical officers) were provided with participatory training to enhance their supervisory knowledge and ability. In the intervention group, the supervisory process included the involvement of community leaders. The frequency of the supervisory visits was not specified.
The study reported on clients and providers outcomes. Clients outcomes included (1) perception of service quality (maximum score 95) and (2) satisfaction (maximum score 90). The study found statistically significant differences between the intervention and control groups (P = 0.001) for both outcomes, although the effect sizes were small and differences were mainly due to reductions in scores in the control group: quality perception scores decreased in the control group from 80.5 to 77.8 and increased in the intervention group from 80.8 to 80.9; as did clients' satisfaction score (from 74.0 to 71.5 and from 72.7 to 75.0, respectively). Both groups had similar baseline scores for each of the outcome measures.
The outcome related to healthcare providers was health officer job satisfaction measured using questionnaires (maximum score 165). Scores improved by 16.6 points in the intervention group compared to 8.4 points in the control group (both groups had similar baseline data; statistical significance was not reported and sample size was very small, i.e. three health officers in each comparison group).
2.5 Comparison of different ways to enhance supervision: effect on quality of care, patients and providers
One study (Uys 2005), a CBA, compared two ways to enhance supervision. It assessed the impact of different models of supervisory training on nurses. Supervisors (head nurses, primary healthcare co‐ordinators, zone matrons and programme managers) in the two intervention groups were trained and implemented either the Modified‐Matrix (MM) or Centre for Health and Social Studies (CHESS) models of supervision. The control group received routine training of supervisors. The frequency of the supervisory visits was not specified.
Between the two intervention groups, no significant differences in scores for (1) quality of diabetes and hypertension care (measured using checklists) or (2) patient satisfaction scores (questionnaires) were found. Results of the control group were not presented.
Scores for nurse perceptions on supervision (rating scale with 12 items) showed no statistically significant differences between the intervention group receiving MM training and the control group. Statistical significance was not tested for the CHESS group.
The quality of patient documentation in hospitals showed no differences.
In summary, enhanced supervision was only superior to routine supervision in two low quality studies which examined the effect of regular, supportive supervision (Ayele 1993) and the use of checklists on workforce performance (Loevinsohn 1995).
3: Less intensive supervision versus routine supervision: effects on quality of care
See Table 6.
3. Outcomes for the comparison between supervision and less intensive supervision.
| Outcomes | Outcome measurement | Arms | N | Pre | Change | P‐values | Review Authors' Interpretation | Comments |
| Quality of care | ||||||||
| Foreit 1984 ‐ I: monthly supervision. C: quarterly supervision. | ||||||||
| New clients per quarter (health‐facility‐based posts) | Daily log completed by the supervisor reporting activities of providers | I | 124 posts in intervention group and 123 in control group. Numbers in health‐facility or community‐based posts not stated. | NA | +5.6 | All differences P > 0.05 (I vs C) | No evidence that reducing the frequency of supervision from quarterly to monthly affects the number of new clients or the number of visits | No statistically significant differences in recruitment of new clients or number of visits undertaken between the comparison groups (P > 0.05). Study also compares new clients and number of visits for sub‐set of new providers recruited for the study (n = 31) and found no significant differences (P > 0.05). |
| C | NA | +3.5 | ||||||
| New clients per quarter (community‐based posts) | I | NA | +4.16 | |||||
| C | NA | +0.76 | ||||||
| Average number of revisits per quarter (health‐facility‐based posts) | I | NA | +9.9 | |||||
| C | NA | +10.6 | ||||||
| Average number of revisits per quarter (community‐based posts | I | NA | +16.3 | |||||
| C | NA | +1.4 | ||||||
| Other | ||||||||
| Foreit 1984 ‐ I: monthly supervision. C: quarterly supervision. | ||||||||
| Health worker attrition in health‐facility‐based posts (% drop out at 9 months) | (see above) | I | (see above) | 7 | Not reported | No evidence that reducing the frequency of supervision affects worker attrition. | ||
| C | 8 | |||||||
| Health worker attrition in community‐based posts (% drop out at 9 months) | I | 3 | ||||||
C: Control; I: Intervention.
Only one cluster RCT (Foreit 1984) assessed the impact of reducing the frequency of supervisory visits from monthly to quarterly on the performance of family planning community‐based distributors (CBD). The intervention group received quarterly supervisory visits over a nine‐month period (details of supervisors were not specified) plus supplementary visits to deal with emergencies or improve staff performance. The control group received the standard monthly supervisory visits.
Three outcomes were reported relating to service quality: the number of new acceptors (community members enrolling into community‐based distribution of family planning goods), revisits undertaken by supervisors and staff turnover. No significant differences were found in any of these outcomes between the intervention and control group. The study did not show any significant impact on the attrition of CBD in the intervention group compared with the control.
An analysis of the cost of supervision concluded that reducing the frequency of supervision from monthly to quarterly could save costs on supervisor salaries and travel costs with no detrimental affect on the performance of community‐based family planning distributors.
In summary, less intensive supervision in one study of low quality did not show any adverse effect on the quality of care or health workers attrition.
Discussion
Summary of main results
A small positive effect on provider practice was found in two out of three studies which compared supervision versus no supervision (Kafle 1995; Stanback 2007); whilst only one of these studies (Stanback 2007) demonstrated a small positive effect on provider knowledge. Of the five studies examining various methods of enhancing supervision, only two of the studies demonstrated small positive effects on worker performance. These included when supervision was more frequent and supportive (Ayele 1993) and when a checklist was introduced (Loevinsohn 1995). Interestingly, Foreit 1984 found no evidence that reducing the frequency of visits from quarterly to monthly had an impact on the utilisation of services.
Overall completeness and applicability of evidence
Studies described interventions that could be typically implemented in low‐ and middle‐income countries, including a range of primary health workers and services, receiving between one and six visits over a period of up to nine months. Studies were undertaken in Africa, Asia and Latin America. All of the studies except one (Rowe 2009) were short‐term studies lasting less than one year and therefore the effectiveness of supervision in the longer term is unknown.
Supervision was often accompanied by training or other supportive interventions, which makes it difficult to attribute the findings to supervision itself or to the other additional interventions. The different methods to enhance supervision were only examined by single studies, thereby limiting their generalisability. Most of the outcomes measurements consisted of multiple scores developed for the purpose of the studies without having being validated as appropriate measures of performance. Where evidence favouring supervision exists, the likelihood of finding positive effects may be partially due to the high number of outcomes measured using multiple scores (e.g. 34 items measured in Stanback 2007).
Quality of the evidence
The quality of the evidence was judged to be very low for all of the outcomes assessed with the GRADE tool. This limits the degree of confidence that can be placed on these findings. Two of the cluster RCTs (Kafle 1995, Stanback 2007), which reported on provider practice, were found to be of moderate quality when assessing risk of bias, although these too were reported to be of "very low" quality when using GRADE. The review authors agree with the GRADE assessment primarily because of the poor generalisability of these studies due to the small number of studies undertaken and their short‐term nature and the imprecision arising from the use of multi‐stage sampling and the small number of clusters in the intervention and control arms. Two studies failed to report on the funding sources: one showing positive results of supervision (Ayele 1993) and another one showing no negative impact of less intense supervision (Foreit 1984).
Potential biases in the review process
The search strategy was planned to be sensitive enough to capture a wide range of interventions that could comply with the definition of supervision in this review, leaving aside supervision applied to other fields (such as clinical supervision or supervision of patients' treatments).
Agreements and disagreements with other studies or reviews
Kilminster 2000 looked at clinical supervision from a medical education perspective, which is a different type of supervision to the one examined in this review. Studies suggesting benefits of clinical supervision (e.g. of junior doctors) are described qualitatively. O'Brien 2008 also has a clinical focus and looked at educational outreach visits. Interventions addressed specific technical skills of recipients and were not necessarily part of the routine management of the health system. They included 69 studies and concluded that educational outreach visits had a consistent positive effect on prescribing practices.
The MAQ 2002 document is based on reports from several programmes, a survey conducted among MAQ partners and some additional articles on supervision, focusing on reproductive health. It provides arguments to shift from a punitive or controlling function of supervision towards 'supportive supervision'. The document describes the components of supportive supervision and highlighting the effectiveness of supervision concludes that more evidence is needed to assess the costs of supervision and the effects on health services performance. The MAQ document is not a systematic review.
Authors' conclusions
Implications for practice.
There is insufficient high quality evidence to advocate for any particular form of implementing supervision. Interestingly, evidence suggests that more intensive supervision (for example, with more frequent visits) is not necessarily more beneficial. Policy makers and managers may consider a wider range of options to ensure the link between the periphery of the health services and the central unit balancing costs and feasibility (such as meetings at the district centre, integration with managerial activities of other sectors at district level or peer‐to‐peer support). Due to the lack of evidence, supervision should be implemented together with activities to evaluate its effects, including costs.
Implications for research.
Better quality research should be undertaken to compare different strategies to link peripheral health services with a more central managerial unit. Research should be guided by a framework that would allow identification of the key components of supervision that are linked with positive outcomes and the resources needed to implement these. Studies should assess user‐related outcomes as well as the performance of the providers. Given that the link between the peripheral and central parts of the system is a standard management practice, research should compare different types of supervision looking at quality of care outcomes, including providers' practices and users and community outcomes, such as uptake of public health interventions.
What's new
| Date | Event | Description |
|---|---|---|
| 21 August 2019 | Amended | A link to a summary for policy‐makers was added to the plain language summary |
History
Protocol first published: Issue 1, 2007 Review first published: Issue 9, 2011
| Date | Event | Description |
|---|---|---|
| 2 September 2008 | Amended | Converted to new review format. |
Acknowledgements
Thanks to Christianne Esparza, Rebekka Hirsbrunner and Marit Johansen for the search and retrieval of studies. Thanks to Alain Mayhew, Susan Munabi Babigumira and Andy Oxman for support and advice.
This review is an output from a programme funded by the UK Department for International Development (DFID) for the benefit of developing countries
Appendices
Appendix 1. Search strategies
EPOC Register and CENTRAL
#1 (supervis*):ti or (supervis*):ab
#2 MeSH descriptor Developing Countries, this term only
#3 (less next developed next countr*) or (third next world next countr*) or (under next developed next countr*) or (underdeveloped next countr*) or (developing next nation*) or (less next developed next nation*) or (third next world next nation*) or (under next developed next nation*) or (underdeveloped next nation*) or (developing next countr*):ti or (less next developed next countr*) or (third next world next countr*) or (under next developed next countr*) or (underdeveloped next countr*) or (developing next nation*) or (less next developed next nation*) or (third next world next nation*) or (under next developed next nation*) or (underdeveloped next nation*) or (developing next countr*):ab
#4 (low next income next count*) or (low next income next nation*) or (middle next income next count*) or (middle next income next nation*) or ("low and middle income") or lmic or lmics:ti or (low next income next count*) or (low next income next nation*) or (middle next income next count*) or (middle next income next nation*) or ("low and middle income") or lmic or lmics:ab
#5 MeSH descriptor Africa South of the Sahara explode all trees
#6 MeSH descriptor Asia, Western explode all trees
#7 MeSH descriptor Asia, Southeastern explode all trees
#8 MeSH descriptor Asia, Central explode all trees
#9 MeSH descriptor Mexico, this term only
#10 MeSH descriptor South America explode all trees
#11 MeSH descriptor Patient Care Management explode all trees
#12 MeSH descriptor Health Services explode all trees
#13 MeSH descriptor Community Health Aides, this term only
#14 MeSH descriptor Allied Health Personnel, this term only
#15 MeSH descriptor Midwifery, this term only
#16 MeSH descriptor Voluntary Workers, this term only
#17 (primary next care) or (primary next health next care) or (primary next healthcare) or (primary next medical next care):ti or (primary next care) or (primary next health next care) or (primary next healthcare) or (primary next medical next care):ab
#18 (community next health next aide*) or (community next health next worker*) or (barefoot next doctor*) or (village next health next worker*):ti or (community next health next aide*) or (community next health next worker*) or (barefoot next doctor*) or (village next health next worker*):ab
#19 (allied next health next personnel) or (allied next health next worker*) or (paramedical next personnel) or (paramedics):ti or (allied next health next personnel) or (allied next health next worker*) or (paramedical next personnel) or (paramedics):ab
#20 (birth next attendant*) or (midwife*) or (mid next wif*) or (midwiv*) or (mid next wiv*) or (traditional next birth) or (doula*):ti or (birth next attendant*) or (midwife*) or (mid next wif*) or (midwiv*) or (mid next wiv*) or (traditional next birth) or (doula*):ab
#21 (voluntary next worker*) or (volunteer next worker*):ti or (voluntary next worker*) or (volunteer next worker*):ab
#22 (lay next health next work*) or (lay next health next personnel):ti or (lay next health next work*) or (lay next health next personnel):ab
#23 (#2 OR #3 OR #4 OR #5 OR #6 OR #7 OR #8 OR #9 OR #10)
#24 (#11 OR #12 OR #13 OR #14 OR #15 OR #16 OR #17 OR #18 OR #19 OR #20 OR #21 OR #22)
#25 (#1 AND #23 AND #24)
#26 (supervis*):ti,ab,kw and (sr‐epoc)
#27 (#25 OR #26)
MEDLINE
1. supervis$.tw.
2. Developing Countries/
3. (less‐developed countr$ or third world countr$ or under developed countr$ or underdeveloped countr$ or developing nation? or less developed nation? or third world nation? or under developed nation? or underdeveloped nation? or developing countr$).tw.
4. (low income count$ or low income nation? or middle income count$ or middle income nation? or "low and middle income" or lmic or lmics).tw.
5. exp "Africa South of the Sahara"/
6. exp Asia, Western/
7. exp Asia, Southeastern/
8. exp Asia, Central/
9. Mexico/
10. exp South America/
11. or/2‐10
12. 1 and 11
13. exp Patient Care Management/
14. exp Health Services/
15. Community Health Aides/
16. Allied Health Personnel/
17. Midwifery/
18. Voluntary Workers/
19. (primary care or primary health care or primary healthcare or primary medical care).tw.
20. (community health aide? or community health worker$ or barefoot doctor? or village health worker$).tw.
21. (allied health personnel or allied health worker? or paramedical personnel or paramedics).tw.
22. (birth attendant$ or midwif$ or mid‐wif$ or midwiv$ or mid‐wiv$ or traditional birth or doula$).tw.
23. (voluntary worker? or volunteer worker?).tw.
24. (lay adj (health work$ or health personnel)).tw.
25. or/13‐24
26. 12 and 25
27. randomized controlled trial.pt.
28. random$.tw.
29. intervention$.tw.
30. control$.tw.
31. evaluat$.tw.
32. or/27‐31
33. Animals/
34. Humans/
35. 33 not (33 and 34)
36. 32 not 35
37. 26 and 36
EMBASE
1. supervis$.tw.
2. Developing Country/
3. (less‐developed countr$ or third world countr$ or under developed countr$ or underdeveloped countr$ or developing nations or less developed nations or third world nations or under developed nations or underdeveloped nations or developing countr$).tw.
4. (low income count$ or low income nation$ or middle income count$ or middle income nation$ or "low and middle income" or lmic or lmics).tw.
5. exp "Africa South of the Sahara"/
6. exp Asia/
7. Mexico/
8. exp South America/
9. or/2‐8
10. 1 and 9
11. exp Health Service/
12. Health Auxiliary/
13. Midwife/
14. Nurse Midwife/
15. Voluntary Worker/
16. Paramedical Personnel/
17. (primary care or primary health care or primary healthcare or primary medical care).tw.
18. (community health aide? or community health worker$ or barefoot doctor? or village health worker$).tw.
19. (allied health personnel or allied health worker? or paramedical personnel or paramedics).tw.
20. (birth attendant$ or midwif$ or mid‐wif$ or midwiv$ or mid‐wiv$ or traditional birth or doula$).tw.
21. (voluntary worker? or volunteer worker?).tw.
22. (lay adj (health work$ or health personnel)).tw.
23. or/11‐22
24. 10 and 23
25. randomized controlled trial/
26. (randomised or randomized).tw.
27. experiment$.tw.
28. Time Series Analysis/
29. (time adj series).tw.
30. (pre test or pretest or post test or posttest).tw.
31. impact.tw.
32. intervention?.tw.
33. chang$.tw.
34. evaluat$.tw.
35. effect?.tw.
36. compar$.tw.
37. or/25‐36
38. nonhuman/
39. 37 not 38
40. 24 and 39
CINAHL
S35 S3 and S13 and S28 and S34
S34 S29 or S30 or S31 or S32 or S33
S33 TI ( randomised or randomized or random*W1 allocat* or random* W1 assign* or "controlled study" or "controlled trial" or "time series" or experiment* or impact or intervention* or evaluat* or effect* ) or AB ( randomised or randomized or random*W1 allocat* or random* W1 assign* or "controlled study" or "controlled trial" or "time series" or experiment* or impact or intervention* or evaluat* or effect* )
S32 (MH "Comparative Studies")
S31 (MH "Quasi‐Experimental Studies+")
S30 (MH "Pretest‐Posttest Design+")
S29 (MH "Clinical Trials")
S28 S14 or S15 or S16 or S17 or S18 or S19 or S20 or S21 or S22 or S23 or S24 or S25 or S26 or S27
S27 TI ( "lay health worker" or "lay health workers" or "health personnel" ) or AB ( "lay health worker" or "lay health workers" or "health personnel" )
S26 TI ( "voluntary worker" or "voluntary workers" or "volunteer worker" or "volunteer workers" ) or AB ( "voluntary worker" or "voluntary workers" or "volunteer worker" or "volunteer workers" )
S25 TI ( "birth attendant" or "birth attendants" or midwife* or mid W1 wif* or midwiv* or mid W1 wiv* or "traditional birth" or doula* ) or AB ( "birth attendant" or "birth attendants" or midwife* or mid W1 wif* or midwiv* or mid W1 wiv* or "traditional birth" or doula* )
S24 TI ( "allied health personnel" or "allied health worker" or "allied health workers" or "paramedical personnel" or paramedics ) or AB ( "allied health personnel" or "allied health worker" or "allied health workers" or "paramedical personnel" or paramedics )
S23 TI ( "community health aide" or "community health aides" or "community health worker" or "community health workers" or "barefoot doctor" or "barefoot doctors" or "village health worker" or "village health workers" ) or AB ( "community health aide" or "community health aides" or "community health worker" or "community health workers" or "barefoot doctor" or "barefoot doctors" or "village health worker" or "village health workers" )
S22 TI ( "primary care" or "primary health care" or "primary healthcare" or "primary medical care" ) or AB ( "primary care" or "primary health care" or "primary healthcare" or "primary medical care" )
S21 (MH "Volunteer Workers")
S20 (MH "Doulas")
S19 (MH "Nurse Midwives")
S18 (MH "Lay Midwives")
S17 (MH "Midwives")
S16 (MH "Community Health Workers")
S15 (MH "Health Services+")
S14 (MH "Primary Health Care")
S13 S4 or S5 or S6 or S7 or S8 or S9 or S10 or S11 or S12
S12 (MH "Mexico")
S11 (MH "South America+")
S10 (MH "Asia, Western+")
S9 (MH "Asia, Southeastern+")
S8 (MH "Asia, Central+")
S7 (MH "Africa South of the Sahara+")
S6 TI ( "low income country" or "low income countries" or "low income nation" or "low income nations" or "middle income country" or "middle income countries" or "middle income nation" or "middle income nations" or low N1 middle N1 income or lmic or lmics ) or AB ( "low income country" or "low income countries" or "low income nation" or "low income nations" or "middle income country" or "middle income countries" or "middle income nation" or "middle income nations" or low N1 middle N1 income or lmic or lmics )
S5 TI ( "less developed country" or "less developed countries" or "third world country" or "third world countries" or "under developed country" or "under developed countries" or "underdeveloped country" or "underdeveloped countries" or "developing nations" or "less developed nations" or "third world nations" or "under developed nations" or "underdeveloped nations" or "developing country" or "developing countries" ) or AB ( "less developed country" or "less developed countries" or "third world country" or "third world countries" or "under developed country" or "under developed countries" or "underdeveloped country" or "underdeveloped countries" or "developing nations" or "less developed nations" or "third world nations" or "under developed nations" or "underdeveloped nations" or "developing country" or "developing countries" )
S4 (MH "Developing Countries")
S3 S1 or S2
S2 TI supervis* or AB supervis*
S1 (MH "Supervisors and Supervision")
LILACS
supervis$ [Words]
AND
(patient and care and management) or (manejo and atencion and paciente) or (gestion and atencion and paciente) or (administracao and cuidados and paciente) or (gestao and cuidados and paciente) or (health and service$) or (servicio$ and salud) or (service$ and saude) or (primary and care) or (primary and healthcare) or (primary and medical and care) or (atencion and primaria and salud) or (atencao and primaria and saude) or (community and health and aide$) or (community and health and worker$) or (auxiliare$ and salud and comunitaria$) or (trabajador$ and saude and comunitaria$) or (trabalhador$ and saude and comunitaria$) or (auxiliare$ and saude and comunitaria$) or (allied and health and personnel) or (allied and health and worker$) or (tecnicos and medios and salud) or (pessoal and tecnico and saude) or (village and health and worker$) or (barefoot and doctor$) or (midwife) or (mid and wife) or midwives or (mid and wives) or (matrona$) or (partera$) or (obstetriz) or (parteira$) or (traditional and birth) or (birth and attendant$) or (doula$) or (voluntary and worker$) or (volunteer and worker$) or (trabajador$ and voluntario$) or (trabalhador$ and voluntario$) or (lay and health and work$) or (lay and health and personnel) or (paramedical and personnel) or (paramedics) [Words]
AND
((Pt RANDOMIZED CONTROLLED TRIAL OR Pt CONTROLLED CLINICAL TRIAL OR Mh RANDOMIZED CONTROLLED TRIALS OR Mh RANDOM ALLOCATION OR Mh DOUBLE‐BLIND METHOD OR Mh SINGLE‐BLIND METHOD OR Pt MULTICENTER STUDY) OR ((tw ensaio or tw ensayo or tw trial) and (tw azar or tw acaso or tw placebo or tw control$ or tw aleat$ or tw random$ or (tw duplo and tw cego) or (tw doble and tw ciego) or (tw double and tw blind)) and tw clinic$)) AND NOT ((CT ANIMALS OR MH ANIMALS OR CT RABBITS OR CT MICE OR MH RATS OR MH PRIMATES OR MH DOGS OR MH RABBITS OR MH SWINE) AND NOT (CT HUMAN AND CT ANIMALS)) or (control or intervention$ or intervencion$ or intervencao or intervencoes or evaluate or evaluar or avaliar or effect$ or efecto$ or efeito$ or impact or impacto) [Words]
Characteristics of studies
Characteristics of included studies [ordered by study ID]
Ayele 1993.
| Methods |
Study design: Cluster RCT Duration of study: June to December 1990 Unit of allocation: District (1 intervention, 1 control) Method of allocation: Random Unit of analysis: Community health agents (52 intervention, 52 control) Sampling: All community health agents performing at least one duty |
|
| Participants |
Country: Ethiopia Income classification: Low‐income Geographical scope: Two districts in south‐western Ethiopia Rural/urban: Rural Setting: Community Supervisees: CHAs (all male farmers, 98% married) Supervisors: Health station supervisors Patients/clients: General population |
|
| Interventions |
Stated purpose: Examine the effect of refresher training and monthly supervision on functional status of CHAs. Description intervention: 5‐day refresher training for CHAs and monthly supervision. Supervision was "supportive" and matched the contents of the refresher training (ascertained from personal communication with author, Charles Larson). Control: Routine supervision and no refresher training for CHAs. Supervision was more one‐sided, the supervisor's primary aim was to review clinic records and collect statistics (ascertained from personal communication with author, Charles Larson). Training: As described above Frequency of supervisory visits: Monthly supervision for intervention group. Non‐systematic and irregular supervision for control group, which on average occurred every two months (ascertained from personal communication with author, Charles Larson). Co‐interventions: All CHAs (intervention and control) provided with registration books, monthly reporting forms and stationary. Meeting held with community and community leaders to improve support of CHAs. |
|
| Outcomes |
Primary outcomes: Functional status score summarising 13 criteria Secondary outcomes: Individual functional status scores including outreach, health education, environmental health, Maternal and Child Health, Expanede Programme of Immunisation, school health, registering births and deaths, home visits, referrals and epidemic control Time points when outcomes measured: 3 months and 6 months from implementation |
|
| Notes | Funding: Not stated | |
| Risk of bias | ||
| Bias | Authors' judgement | Support for judgement |
| Random sequence generation (selection bias) | Low risk | "....the two districts were randomly assigned as intervention or control districts based upon a coin flip." |
| Allocation concealment (selection bias) | Low risk | Allocation performed at start of study |
| Blinding (performance bias and detection bias) All outcomes | High risk | "CHA activities were assessed monthly using a checklist completed by the CHA and his health station supervisor. These supervisors were aware of the study but not the district comparison or the study hypothesis" |
| Incomplete outcome data (attrition bias) All outcomes | Low risk | Number of CHAs: Baseline (102), 3 months (102), 6 months (102) |
| Selective reporting (reporting bias) | Low risk | All outcome variables reported |
| Other bias | High risk | Does not meet EPOC inclusion criteria of minimum of 2 intervention and 2 control sites Funding source not stated “The health sector support may have enhanced CHA activity for a number of reasons. One is that the community was motivated to support the CHA when they perceived support from the health sector, and this in turn enhanced community utilization of the CHA’s services. This explanation is consistent with the finding that the intervention group received more supervision from community leaders than did the control group. The peasant association executives were more involved in the administrative supervision of their respective CHAs during this follow‐up period”. |
| Baseline outcome measurements similar? | Low risk | "At the onset of the study there were no significant group differences in the composite or individual functional status scores." |
| Baseline characteristics similar? | High risk | "As can be seen from table 1, the two groups were similar with the exception of intervention CHAs being older and having served longer (P < 0.01)". |
| Protection against contamination? | Low risk | Control group unlikely to have received intervention |
Foreit 1984.
| Methods |
Study design: Cluster RCT Duration of study: April to December 1981, with observation until April 1982 Unit of allocation: Region (6 intervention, 6 control) Method of allocation: Random allocation of matched pairs of regions to the intervention and control groups based on the health characteristics of health posts Unit of analysis: Supervisees (140 intervention, 138 control). Supervisors (6 intervention, 6 control) Sampling: Not stated |
|
| Participants |
Country: Brazil Income classification: Upper‐middle income Geographical scope: State in north east Brazil Rural/urban: Urban and rural Setting: Health facility (hospitals, clinics) and community (private homes, schools, community centres, town halls and rural villages) Supervisees: Non‐professional community‐based distribution workers Supervisors: Not stated Patients/clients: Recipients of family planning commodities |
|
| Interventions |
Stated purpose: Deliver supplies, collect data, problem solving, visiting physicians and political leaders, giving family planning talks, home visits Description intervention: Quarterly supervisory visits plus supplementary visits to deal with emergencies and improve staff performance Control: Routine supervision (monthly supervisory visits) Training: None Frequency of supervisory visits: Quarterly (intervention group), monthly (control group) Co‐interventions: Feedback forms and daily logs introduced in both intervention and control groups |
|
| Outcomes |
Primary outcomes: Supervisor performance: days worked per month, days in the field, total visits made, lectures given, home visits made and contact with local leaders Secondary outcomes: Staff performance: new clients, revisits and staff turnover Time points when outcomes measured: 9 month period up to December 1981 and 10 month period up to April 1982 |
|
| Notes | Funding: Not stated | |
| Risk of bias | ||
| Bias | Authors' judgement | Support for judgement |
| Random sequence generation (selection bias) | Unclear risk | Method of randomisation not stated."One member of each pair was randomly assigned to the experimental group and the other to the control" |
| Allocation concealment (selection bias) | Low risk | Allocation performed at the start of the study |
| Blinding (performance bias and detection bias) All outcomes | High risk | Primary outcomes are not objective. Outcome measures based on daily logs by participants. |
| Incomplete outcome data (attrition bias) All outcomes | Unclear risk | Data not available to assess follow‐up |
| Selective reporting (reporting bias) | Low risk | All outcome variables reported on |
| Other bias | Unclear risk | Funding of study not stated |
| Baseline outcome measurements similar? | Unclear risk | No baseline outcome measurements provided |
| Baseline characteristics similar? | Unclear risk | No details of supervisor or supervisee characteristics provided, only details of the areas: "The regions were also geographically equivalent as possible, so the results of the experiment would not be influenced by such factors as migration or physical conditions encountered by the supervisors. The experiment area was some what larger, more populous, and less urban than the control area. There were, however, no systematic differences within pairs on these variables." |
| Protection against contamination? | Low risk | “....the results of the experiment would not be influenced by such factors as migration or physical conditions encountered by the supervisors” |
Kafle 1995.
| Methods |
Study design: Cluster RCT Duration of study: October 1994 to May 1995 Unit of allocation: District (3 intervention, 3 control) Method of allocation: Random Unit of analysis: Health facilities (21 intervention, 21 control) Sampling: Multi‐stage: 3 out of 5 districts where UNICEF training was proposed were randomly selected for Intevention Group 1. 3 districts for Intervention Group 2 and 3 districts for the Control Group were randomly selected from 17 other districts. Random selection of four health facilities per district plus selection of three neighbouring sub‐health posts. |
|
| Participants |
Country: Nepal Income classification: Low income Geographical scope: Terai, Nepal Rural/urban: Not explicitly specified, but probably rural (Terai) Setting: Health facilities Supervisees: Drug prescribers in health facilities Supervisors: DHOs and DPHOs Patients/clients: Not specified |
|
| Interventions |
Stated purpose: To evaluate the impact of regular supervision/monitoring using a Standard Drug Treatment Schedule on prescribing patterns Description intervention 1: No intervention (assigned training for prescribers bud did not take place) Description intervention 2: Supervision visits from DHO/DPHO trained in the use of supervision tools and providing feedback. Control: No intervention Training: Supervision oriented to supervision tools and provided with guidelines on their use and giving feedback Frequency of supervisory visits: 2 supervisor visits (the first one month after the baseline and the second two months later) Co‐interventions: None |
|
| Outcomes |
Primary outcomes: Prescribing practices Secondary outcomes: Prescribing knowledge Time points when outcomes measured: 7 months after baseline |
|
| Notes | Funding: USAID/JSI | |
| Risk of bias | ||
| Bias | Authors' judgement | Support for judgement |
| Random sequence generation (selection bias) | Unclear risk | States allocation was random with no further details |
| Allocation concealment (selection bias) | Low risk | Allocation performed at start of study |
| Blinding (performance bias and detection bias) All outcomes | Unclear risk | Not stated if outcome variables were assessed blindly |
| Incomplete outcome data (attrition bias) All outcomes | Low risk | Complete follow‐up |
| Selective reporting (reporting bias) | Low risk | Authors have not reported on all three dimensions (history taking, examination, drug use) for all 8 diseases (Annex 10, page 30) |
| Other bias | Low risk | |
| Baseline outcome measurements similar? | Unclear risk | Baseline outcomes for prescribing indicators similar. No baseline for prescribing knowledge. |
| Baseline characteristics similar? | Unclear risk | No characteristics stated |
| Protection against contamination? | Low risk | Control group unlikely to have received the intervention |
Loevinsohn 1995.
| Methods |
Study design: CBA study Duration of study: June 1991 to January 1992 Unit of allocation: Province (4 intervention, 6 control) Method of allocation: Non‐random; allocation by judgement of programme managers Unit of analysis: Health facilities BHS and RHU (54 intervention, 70 control) Sampling: Intervention and control provinces purposively selected from the same regions. 123 BHS and RHU selected randomly proportional to the population size. 5 mothers selected in each catchment area using WHO cluster sampling. |
|
| Participants |
Country: Philippines Income classification: Low‐income Geographical Scope: Four remote provinces with poor health status purposively selected in the north, central and south Philippines Rural/urban: Not stated Setting: Health facilities Supervisees: Midwives educated to high school plus two‐year course and training seminars Supervisors: Public health nurses, municipal health officers, district and provincial supervisors Patients/clients: Pregnant women and general population |
|
| Interventions |
Stated purpose: Improve health worker performance using trained supervisors and systematic checklist Description intervention: Supervisory visits using an ISC. Supervisors all received structured standard training on supervision. ISC contained scores based on percentage of assistance activity correctly performed. 20 items x 3 maximum points = 60. Control: Routine supervision Training: Training in intervention group: 2 days on the use of ISC and theory of supervision and how to give effective feedback Frequency of supervisory visits: Average of 4.5 supervisory visits over 6 months in intervention and control groups Co‐interventions: None |
|
| Outcomes |
Primary outcomes: Health worker performance at facility‐level, as measured by combined scores on 20 indicators Secondary outcomes: Individual indicators, e.g. prenatal visits, record keeping, drugs supply, immunisation coverage, new acceptors for family planning and health worker knowledge Time points when outcomes measured: 6 months after implementation |
|
| Notes | Funding: Philippine Department of Health and USAID. | |
| Risk of bias | ||
| Bias | Authors' judgement | Support for judgement |
| Random sequence generation (selection bias) | High risk | "Four remote provinces with poor health were chosen by the public health programme managers in the DOH [not spelled out in the text] central office to serve as the experimental area" |
| Allocation concealment (selection bias) | High risk | This is a CBA study |
| Blinding (performance bias and detection bias) All outcomes | Low risk | “In June 1991, a baseline evaluation was conducted by central office staff in the selected facilities. The assessors were blind as to whether the province they visited would be in the control or experimental group” |
| Incomplete outcome data (attrition bias) All outcomes | High risk | “Of the 124 health facilities that were evaluated during the baseline survey, 12 (7 experimental and 5 control) facilities could not be followed up 6 months later, due to peace and order problems. The 12 facilities had an average baseline performance of 23.2 points (95% CI = 15.8 to 30.6) which was slightly lower than the facilities where follow‐up was possible (average. = 26.7, 95% CI = 25.2 to 28.0)”. |
| Selective reporting (reporting bias) | High risk | Only 6 out of 20 specific indicator scores reported |
| Other bias | High risk | Clustering not taken into account in the analysis. |
| Baseline outcome measurements similar? | Low risk | "At baseline the control and experimental health facilities were similar...including their total scores on 20 indicators contained in the supervisory checklist" |
| Baseline characteristics similar? | Low risk | "At baseline the control and experimental health facilities were similar in all measured characteristics...." |
| Protection against contamination? | Low risk | “Supervisors of the 4 experimental provinces were given two days of training on the use of the ISC...” “These 4 provinces then implemented the ISC in all their health facilities’. “In the control provinces, no training or copies of the supervisory checklist were provided” |
Rowe 2009.
| Methods |
Study design: Cluster RCT Duration of study: July‐October 1999 to July‐October 2004 Unit of allocation: Geographical area (1 intervention, 1 control) Method of allocation: Random Unit of analysis: Ill‐child consultation (288 at baseline; numbers in intervention and control group not specified) Sampling: Public and private licensed health facilities providing IMCI ‐level outpatient services to children |
|
| Participants |
Country: Benin Income classification: Low‐income Geographical scope: South‐eastern Benin Rural/urban: Mixed ‐ rural and urban Setting: Health facilities Supervisees: Nurses, nurse aides and physicians Supervisors: 8 Physicians Patients/clients: Children up to 5 years |
|
| Interventions |
Stated purpose: Improve adherence to IMCI guidelines Description intervention: Multi‐faceted intervention: Training of health workers in IMCI plus an enhanced package of follow‐up support, including: 1) 5‐day workshop for the protocol (training of supervisors, supervisory visits, checklist and supervision of supervisors. 2) Printed job aides: patients registers and counselling guide. 3) Half‐day training for health workers on use of job aides and supervision checklist. 4) Non‐financial incentives (framed certificates, publicity for best performing health worker). 5) When realised that very little supervision was occurring, 1‐ to 3‐day workshops every 3 months to present supervision results. Control: Training of health workers in IMCI plus usual package of support 1) Supervision (training of supervisors, supervisory visits) 2) Printed job aides (IMCI recording forms) Training: Training on IMCI for health workers. Courses of 24 to 25 participants: participant‐to‐trainer ratio 4:1. Course held in 2001, 2002, 2004 and 2004. 5‐day training of supervisors Frequency of supervisory visits: Recommended 2 supervisory visits every 3 months, but only 29% of scheduled visits occurred Co‐interventions: 5 vehicles for supervision, process of decentralisation where supervisors given some control over budgets and sharing of results of surveys at least annually |
|
| Outcomes |
Primary outcomes: 1) % of children receiving recommended care. 2) % of children receiving recommended or adequate care. 3) % of needed IMCI tasks that were performed Secondary outcomes: None Time points when outcomes measured: Baseline ‐ 1999. Follow‐up 2001, 2002 and 2004 |
|
| Notes |
Funding: USAID's Africa Integrated Malaria Initiative Problems noted in the study: Only 29% of supervisory visits actually took place and there was a slow implementation of IMCI training of health workers Supervision protocol:
|
|
| Risk of bias | ||
| Bias | Authors' judgement | Support for judgement |
| Random sequence generation (selection bias) | Low risk | "We randomly chose a slip of paper from a bag to assign [each area to the study arms]" |
| Allocation concealment (selection bias) | Low risk | Allocation performed at start of the study |
| Blinding (performance bias and detection bias) All outcomes | High risk | “The study was unblinded because it was impossible to conceal the study supports from health workers and surveyors” |
| Incomplete outcome data (attrition bias) All outcomes | High risk | Greater loss to follow‐up in intervention area (Table 2): only 54/72 health facilities surveyed in intervention area in 2004 compared to 46/58 in control area. |
| Selective reporting (reporting bias) | Low risk | All outcomes stated in methods section reported on |
| Other bias | High risk | Does not meet EPOC inclusion criteria of minimum of 2 intervention and 2 control sites “Our study had other potential limitations. First, observation of consultations could have influenced health worker practices, perhaps overestimating quality somewhat; this influence would likely have affected all study groups similarly. Second, prescriptions were sometimes incomplete, which probably led to the underestimation of quality for some consultations. Our sensitivity analysis suggested some bias effect sizes, but overall conclusions were not affected” |
| Baseline outcome measurements similar? | Low risk | On ITT analysis (Figure 2), the control area had 6 percentage points more children receiving recommended care. All other outcomes similar. |
| Baseline characteristics similar? | Low risk | "Characteristics of the study groups were similar, except that children in control areas were more significantly more often seen by a IMCI trained health worker in the follow‐up period (P = 0.003)" |
| Protection against contamination? | Low risk | Control group unlikely to have received the intervention |
Sennun 2006.
| Methods |
Study design: CBA study Duration of study: September 2003 to February 2004 Unit of allocation: PCU (1 intervention, 1 control) Method of allocation: Not specified Unit of analysis: PCU Sampling: Two PCUs selected from a semi‐district, based on a set of inclusion criteria. 195 patients aged 15 to 60 selected from each PCU. Three health officers selected from each PCU based on their work performance and meeting minimum target indicators. |
|
| Participants |
Country: Thailand Income classification: Low‐income Geographical scope: Semi‐district in Thailand Rural/urban: Rural/urban Setting: PCUs (upgraded health centres at sub‐district level providing frontline services by health officers) Supervisees: 3 health officers from each PCU Supervisors: 5 supervisors (4 graduate nurses and 1 technical officer) Patients/clients: Patients aged 15 to 60 at each PCU |
|
| Interventions |
Stated purpose: Assess the effect of two models of supervision on the health promotion capacity of PCU health officers and the community Description intervention: Same as control plus addition of involvement of community leaders in the supervisory process (e.g. teacher, village leader and representatives from community groups and organisations) Control: PCU health officers' full participation in supervision with the district level supervisors and had "equal voices" to their supervisors Training: District supervisors in both groups received participatory training to enhance their supervisory knowledge and ability (length of duration not specified) Frequency of supervisory visits: Not specified Co‐interventions: None |
|
| Outcomes |
Primary outcomes: Indicators relating to health officer job satisfaction, client perception of service quality and clients care satisfaction Secondary outcomes: None Time points when outcomes measured: 6 months after baseline |
|
| Notes | Funding: Partially funded by the Faculty of Graduate Studies, Mahidol University and Payap University. | |
| Risk of bias | ||
| Bias | Authors' judgement | Support for judgement |
| Random sequence generation (selection bias) | High risk | CBA study |
| Allocation concealment (selection bias) | High risk | CBA study |
| Blinding (performance bias and detection bias) All outcomes | High risk | Outcome measures were not objective or assessed blindly |
| Incomplete outcome data (attrition bias) All outcomes | Low risk | All health officers followed up and same number of patients before and after the study |
| Selective reporting (reporting bias) | Low risk | All outcomes were reported on |
| Other bias | High risk | Does not meet EPOC inclusion criteria of minimum of 2 intervention and 2 control sites The cluster design was not taken into account in the statistical analyses. “One potential source of bias in this study was selection bias, because we only included supervisors with a good knowledge of, and enthusiasm for, supervision, and only health officers whose work performance achieved the minimum requirements of the PCU target indicators in the study. This was likely to partially affect the positive outcomes of the participatory supervisory model” “..the client sample groups before and after implementing supervision were different, which may have affected measurements of client’s perceived service quality and care satisfaction.” “?during the study period, some influential incidents occurred that affected the study results and the performance of the officers. There were many distracting events, such as the SARS epidemics, a new policy on narcotics suppression, a call for public health officers to set up camp to treat drug addicts, the ‘avian flu’ epidemics, and a Tambon Administrative Organisation (TAO) committee election” |
| Baseline outcome measurements similar? | Low risk | No significant differences between intervention 1 and 2 at baseline for client perception of service quality and care satisfaction. Job satisfaction of health workers similar at baseline. |
| Baseline characteristics similar? | High risk | “PCU was a smaller size and had pre‐existing health promotion in the form of a quality of life development club”. |
| Protection against contamination? | Low risk | Control group unlikely to have received the intervention |
Stanback 2007.
| Methods |
Study design: Cluster RCT Duration of study: September 1999 to July 2000 Unit of allocation: Training area (6 out of 13 training areas selected; not specified how many in intervention or control groups) Method of allocation: Random Unit of analysis: Providers (177 at baseline; not specified how many in intervention or control groups) Sampling: Mulit‐stage. 1st stage: 6 of 13 training areas selected and randomly assigned to intervention or control. 2nd stage: all 25 hospitals and 37 out of 166 clinics selected proportional to number of centres in each district. Data obtained from 177 providers and 482 clients (before) and 176 providers and 451 clients (after). |
|
| Participants |
Country: Kenya Income classification: Low‐income Geographical scope: Not specified Rural/urban: Rural Setting: Health facilities (hospitals and clinics) Supervisees: Nurses, midwives and nursing auxiliaries Supervisors: Not specified Patients/clients: Not specified |
|
| Interventions |
Stated purpose: To improve family planning services through assessing provider knowledge and skills, provide feedback and help solve problems. Description intervention 1: Training of providers plus cascade training package Description intervention 2: Training of providers plus cascade training package plus supervision Control: Training of providers Training: No training of supervisors specified. One provider from each health facility received 2‐day training on family planning. Other providers received cascade training. Frequency of supervisory visits: Single supervisory visit in the intervention group one to three months after the training session Co‐interventions: Training of providers and cascade training package |
|
| Outcomes |
Primary outcomes: Provider knowledge, attitudes and reported practices Secondary outcomes: None Time points when outcomes measured: 9 to 10 months after baseline |
|
| Notes | Funding: USAID, Population Council | |
| Risk of bias | ||
| Bias | Authors' judgement | Support for judgement |
| Random sequence generation (selection bias) | Low risk | Used random number generator in Epi Info software |
| Allocation concealment (selection bias) | Low risk | Allocation performed at the start of the study |
| Blinding (performance bias and detection bias) All outcomes | Unclear risk | Not stated if outcome measures were assessed blindly |
| Incomplete outcome data (attrition bias) All outcomes | Low risk | Almost complete follow‐up in each of the trial arms |
| Selective reporting (reporting bias) | High risk | Methods specify that a 34‐element score was used to measure provider practices and a 19‐element score was used to assess provider knowledge and attitudes. Results only show two overall summary indicators for provider practices and knowledge/attitudes, and 10 selected individual indicators. |
| Other bias | Low risk | Cluster design taken into account. |
| Baseline outcome measurements similar? | Low risk | Tables 1 and 2 show similar baseline outcome measures in the trial arms |
| Baseline characteristics similar? | Unclear risk | No baseline characteristics provided |
| Protection against contamination? | Low risk | Supervision allocated to only selected health facilities |
Trap 2001.
| Methods |
Study design: CBA study (if comparing intervention groups 1 or 2 with the non‐random control group); Cluster RCT (if comparing intervention groups 1 and 2 with each other). Duration of study: July 1996 to August 1997 Unit of allocation: Province (4 intervention, 3 control) Method of allocation: Random allocation using balanced block design Unit of analysis: Health facilities (48 intervention, 18 control) Sampling: Multi‐stage: 8 districts randomly selected from intervention provinces and 48 intervention facilities randomly selected from these. From the 3 control provinces, 24 health facilities were selected from 6 districts. Intervention facilities were paired according to 'performance' at baseline and each facility in the pair randomly allocated to either Intervention 1 or Intervention 2. Also, 30 patients register from each clinic. |
|
| Participants |
Country: Zimbabwe Income classification: Low‐income Geographical scope: 7 provinces out of 8 provinces in the country Rural/urban: Not stated Setting: Health facilities Supervisees: Health facility workers Supervisors: Trained pharmacy technicians (n = 8) and pharmacists (n = 2) Patients/clients: Patient records for each condition (acute respiratory infection, diarrhoea without blood, male urethral discharge, genital ulcer) |
|
| Interventions |
Stated purpose: Test the impact of supervision by specially trained pharmacy staff on stock management and adherence to standard treatment guidelines in health facilities Description intervention 1: Supervisory visits by trained supervisors on stock management Description intervention 2: Supervisory visits by trained supervisors on adherence to treatment guidelines Control: No supervision Training: National drug management supervisory programme (2‐week national training course for supervisors, followed by field work and 2‐day follow‐up course). Also national training programme on sexually transmitted infections being undertaken at same time. Frequency of supervisory visits: Two supervisory visits, approximately 6 to 9 months after the baseline assessment in the intervention group Co‐interventions: None |
|
| Outcomes |
Primary outcomes: Performance indicators on drug stock management and scores for adherence to standard treatment guidelines Secondary outcomes: None Time points when outcomes measured: 6 to 8 months after last supervision |
|
| Notes | Funding: WHO Drug Action Programme, the International Network for Rational Drug Use and DANIDA. | |
| Risk of bias | ||
| Bias | Authors' judgement | Support for judgement |
| Random sequence generation (selection bias) | High risk | No if comparing intervention groups 1 or 2 with the non‐random control group. Yes if comparing intervention groups 1 and 2. “randomisation of health facilities using a balanced block design” |
| Allocation concealment (selection bias) | High risk | No if comparing intervention groups 1 and 2 with non‐random control ‐ as study design is CBA |
| Blinding (performance bias and detection bias) All outcomes | Unclear risk | No details provided |
| Incomplete outcome data (attrition bias) All outcomes | High risk | Baseline: n = 24 for each study arm. Follow‐up: n = 23 (standard treatment guidelines), n = 21 (stock management), n = 18 (control) |
| Selective reporting (reporting bias) | Low risk | All outcome measures reported on |
| Other bias | Unclear risk | No mention on taking into account the multi‐stage sampling technique in the statistical analysis. |
| Baseline outcome measurements similar? | High risk | “When the pre‐intervention scores on both stock management and adherence to Standard Treatment Guidelines (STG) for the intervention, control and comparison facilities were compared there were no significant differences”. However, the baseline scores between the intervention group 2 (adherence to treatment guidelines) and the control are large: 19 point difference where the maximum scores are 100. |
| Baseline characteristics similar? | Unclear risk | Baseline characteristics not stated |
| Protection against contamination? | High risk | “Supervisors were asked not to discuss issues concerning the converse area of interest [i.e. stock management if supervising only adherence to treatment guidelines, and vice versa]. “At the same time as this supervisory activity was being undertaken, a national training programme on sexually transmitted infections (STI) was being undertaken, funded by the World Bank. As will be seen, this has a confounding effect on the results of the supervisory intervention.” “In addition, the effect of extraneous factors could not be taken into account. The stock management system was originally implemented with the primary aim of improving drug availability, but drug availability is strongly influenced by the supply performance of the central procurement office, which is the only supplier of drugs to the primary healthcare level. The possibility of private sector procurement did not exist. Overall drug availability from the central procurement office remained almost constant during the intervention and significant changes in this indicator did not occur”. “Improved adherence to STG for genital ulcer disease was seen in all three groups. This may have been achieved by other activities undertaken nationwide by the World Bank supported STI project and related to the new ZEDAP STD‐modules”. |
Uys 2005.
| Methods |
Study design: CBA study Duration of study: Not stated Unit of allocation: District (2 intervention, 1 control) Method of allocation: Not stated Unit of analysis: District Sampling: 3 hospitals and six clinics from each district (3 clinics randomly selected plus 3 neighbouring clinics) |
|
| Participants |
Country: South Africa Income classification: Upper‐middle income Geographical scope: Three districts Rural/urban: Rural Setting: Hospital and clinics (each district with rural and district hospital) Supervisees: All category of nurses Supervisors: Head nurses, primary healthcare co‐ordinators, zone matrons and programme managers Patients/clients: General population |
|
| Interventions |
Stated purpose: Assess whether supervision effects the quality of care and job satisfaction Description intervention 1: Modified matrix model and training: supervisors (from hospitals and clinics): 5 days over a 3‐month period; on 6 functions of supervision: relate, develop, evaluate, monitor, counsel and administer. Description intervention 2: CHESS model and training: supervisors (only from clinics): PHC Alma‐Ata principles and continuous quality improvement cycle (with clients and community representatives). Control: Training of supervisors Training: As described above Frequency of supervisory visits: Not stated Co‐interventions: None |
|
| Outcomes |
Primary outcomes: Indicators relating to satisfaction with supervision, job satisfaction, quality of care and patient Satifisfaction Secondary outcomes: None Time points when outcomes measured: Not stated |
|
| Notes |
Funding: Health Systems Trust, Durban, South Africa This is a study on the effects of different training approaches in supervision. |
|
| Risk of bias | ||
| Bias | Authors' judgement | Support for judgement |
| Random sequence generation (selection bias) | High risk | CBA study |
| Allocation concealment (selection bias) | High risk | CBA study |
| Blinding (performance bias and detection bias) All outcomes | High risk | |
| Incomplete outcome data (attrition bias) All outcomes | High risk | Varying loss to follow‐up shown in tables reporting on satisfaction with supervision, quality of care in clinics and patient satisfaction outcome measures. |
| Selective reporting (reporting bias) | High risk | Only 2 out of 5 results table show the results for the control group. "PHC data from the two areas were compared, and if a difference was found, District C was included as a control" |
| Other bias | High risk | Does not meet EPOC inclusion criteria of minimum of 2 intervention and 2 control sites |
| Baseline outcome measurements similar? | High risk | For satisfaction with supervision and job satisfaction outcomes measures, no baselines provided for Intervention Group 2 |
| Baseline characteristics similar? | Unclear risk | No data presented. "All three of these districts are typically rural and share many similarities in population and services." |
| Protection against contamination? | High risk | “...the provincial authority launched a project to train all supervisors using a handbook from the Eastern Cape Department of Health (2000); thus District C was involved in this training” “Another problem may have been staff turnover and movement of supervisors”. |
BHS: Barangay health stations CBA: controlled before and after study CHA: community health agent CHESS: Centre for Health and Social Studies DANIDA: Danish International Development Agency DHO: district health officer DHPO: district public health officer IMCI: Intergrated Management of Childhood Illness ISC: Integrated Supervisory Checklist ITT: intention‐to‐treat PCU: primary care unit PHC: primary health care RCT: randomised controlled trial RHU: rural health units USAID: United States Agency for International Development WHO: World Health Organization
Characteristics of excluded studies [ordered by study ID]
| Study | Reason for exclusion |
|---|---|
| Agampodi 2008 | Before and after study ‐ no control |
| Armstrong 2004 | Multiple interventions, unable to disentangle the effects of supervision |
| Ashworth 2005 | Systematic review. Not a supervision study ‐ physical activity programmes for older people |
| Bang 1994 | Multiple interventions, unable to disentangle the effects of supervision |
| Bang 1999 | Not a supervision study ‐ examines the effect of female health workers |
| Bradley 2005 | Not a supervision study ‐ examines the effect of COPE, a problem‐solving approach for health staff |
| Brewster 1997 | Multiple interventions, unable to disentangle the effects of supervision |
| Chalker 2001 | Study methods: longitudinal study ‐ no control |
| Chinbuah 2006 | Before and after study ‐ no control |
| Chopra 2005 | Before and after study ‐ no control. Not a supervision study ‐ examines the effect on IMCI |
| Chukwujekwu 2010 | Before and after study ‐ no control |
| Comolet 1997 | Before and after study ‐ no control |
| Conteh 2010 | Supervision of treatments in the context of a RCT |
| Curtale 1995 | Study type: survey. Multiple interventions, unable to disentangle the effects of supervision |
| De Jong 1996 | Descriptive/qualitative study. Multiple interventions, unable to disentangle the effects of supervision |
| Dehne 1995 | Study type: survey |
| Delacollette 1996 | Not a supervision study ‐ examines the effect of lay health workers |
| Delgado 1983 | Not a supervision study ‐ examines the effect of clinical follow‐up of children |
| Di Sorbo 2010 | Observational study |
| Dolo 2010 | Supervision of laboratory diagnostic procedures |
| Dumont 2005 | Before and after study ‐ no control |
| Edginton 1999 | Multiple interventions, unable to disentangle the effects of supervision |
| Fauveau 1991 | Not a supervision study ‐ examines the effect of midwives |
| Floyd 2003 | Before and after study without control. Not a supervision study ‐ supervision relates to DOTS treatment of patients, not PHC staff |
| Frazao 2009 | Not an intervention study |
| Ghoneim 2004 | Before and after study ‐ no control. Not a supervision study ‐ refers to nursery staff as "supervisors" |
| Giugliani 2010 | One rural health facility receiving the intervention without control |
| Grosskurth 1995 | Multiple interventions, unable to disentangle the effects of supervision |
| Grosskurth 2000 | Multiple interventions, unable to disentangle the effects of supervision |
| Hayes 2005 | Multiple interventions, unable to disentangle the effects of supervision |
| Hidalgo 1997 | Not a supervision study ‐ looking at the effect of organisational environment |
| Hill 2000 | Not a supervision study ‐ examines the effect of primary health care |
| Htay 2003 | Study type: survey |
| Irawati 2007 | Multiple interventions, unable to disentangle the effects of supervision |
| Jacquier 2000 | Before and after study ‐ no control |
| Janowitz 2000 | Descriptive study |
| Jaramillo 2001 | Before and after study ‐ no control |
| Jin 1993 | North Korea ‐ high income country |
| Kafle 2009 | Visits to district capital. No supervision intervention |
| Katabarwa 2005 | Study type: survey |
| Kelly 2001 | Before and after study ‐ no control |
| Kim 2002 | Technical supervision to improve communication skills. Supervision does not include management activity and not from a higher tier of health services. |
| Kirkwood 2010 | No supervision intervention |
| Lamboray 1979 | Study method: case study, narrative with no data |
| Libamba 2006 | Study method: audit ‐ no control |
| Libamba 2007 | Descriptive study |
| Lofmark 2010 | Context of nursing education |
| Lynch 1994 | Study type: survey |
| Maung 2006 | Not a supervision study ‐ examines the effect of training general practitioners and improving laboratory testing for TB |
| Mogassale 2010 | Time series without pre‐intervention data |
| Osterholt 2006 | Study type: survey |
| PAHO 1999 | Not an intervention study |
| PAHO 1999a | Not an intervention study |
| PAHO 2005 | Not an intervention study |
| Powell 1989 | Not a supervision study ‐ looking at effect of home visits |
| Rao 1998 | Not a supervision study ‐ examines the effect different drug delivery systems |
| Reynolds 2008 | Study related to on‐site supervision, not outreach supervisory visits |
| Ronsmans 2001 | Multiple interventions, unable to disentangle the effects of supervision |
| Roos 1995 | Study method: survey |
| Ross 2007 | Multiple interventions, unable to disentangle the effects of supervision |
| Sujpluem 1981 | Not an intervention study |
| Thiam 2007 | Multiple interventions, unable to disentangle the effects of supervision |
| Tirado 1990 | Study method: survey |
| Wasunna 2010 | Training intervention |
| Wesson 2008 | 'Detailing' intervention |
| Zenni 1996 | American study ‐ high income country. Not primary health care ‐ hospital based. |
DOTS: Directly Observed Treatment, Short course IMCI: Integrated Management of Childhood Illnesses PHC: primary health care RCT: randomised controlled trial TB: tuberculosis
Differences between protocol and review
Outcomes relating to morbidity and mortality were not reported as the studies did not report on these outcomes and it would seem too ambitious to ever attempt to do so.
Due to the limited data available in the studies and the diversity of outcomes, it was not possible to undertake subgroup analysis.
Contributions of authors
Xavier Bosch‐Capblanch (XBC) and Paul Garner (PG) wrote the protocol.
XBC and Sajil Liaqat (SL) applied the inclusion criteria and SL carried out the data extraction, checked by XBC and supervised by PG. All authors contributed to the final document.
Sources of support
Internal sources
No sources of support supplied
External sources
-
Sajil Liaqat, UK.
Employed by Mersey Deanery Public Health Training Scheme
-
Paul Garner, UK.
Paul Garner is part of the Effective Health Care Research Programme Consortium, supported by a grant from the Department for International Development (DFID), UK for the benefit of developing countries.
Declarations of interest
None declared.
Edited (no change to conclusions)
References
References to studies included in this review
Ayele 1993 {published data only}
- Ayele F, Desta A, Larson C. The functional status of community health agents: a trial of refresher courses and regular supervision. Health Policy and Planning 1993;8(4):379‐84. [Google Scholar]
Foreit 1984 {published data only}
- Foreit JR, Foreit KG. Quarterly versus monthly supervision of CBD family planning programs: an experimental study in northeast Brazil. Studies in Family Planning May/June 1984;15(3):112‐20. [PubMed] [Google Scholar]
Kafle 1995 {published data only}
- Kafle KK. Intervention test of training supervision and supervision on prescribing. Unpublished. Tribhuvan University: Tribhuvan University,, August 1995.
Loevinsohn 1995 {published data only}
- Loevinsohn BP, Erlinda TG, Susan PG. Improving primary health care through systematic supervision: a controlled field trial. Health Policy and Planning 1995;10(2):144‐53. [DOI] [PubMed] [Google Scholar]
Rowe 2009 {published data only}
- Rowe AK, Onikpo F, Lama M, Osterholt DM, Rowe SY, Deming MS. A multifaceted intervention to improve health worker adherence to integrated management of childhood illness guidelines in Benin. American Journal of Public Health 2009;99(5):837‐46. [DOI] [PMC free article] [PubMed] [Google Scholar]
Sennun 2006 {published data only}
- Sennun P, Suwannapong N, Howteerakul N, Pacheun O. Participatory supervision model: building health promotion capacity among health officers and the community. Rural and Remote Health. 2006;6(2):1‐12. [PubMed] [Google Scholar]
Stanback 2007 {published data only}
- Stanback J, Griffey S, Lynam P, Ruto C, Cummings S. Improving adherence to family planning guidelines in Kenya: an experiment. International Journal for Quality in Health Care 2007;19(2):68‐73. [DOI] [PubMed] [Google Scholar]
Trap 2001 {published data only}
- Trap B, Todd CH, Moore H, Laing R. The impact of supervision on stock management and adherence to treatment guidelines: a randomized controlled trial. Health Policy and Planning 2001;16(3):273‐80. [DOI] [PubMed] [Google Scholar]
Uys 2005 {published data only}
- Uys LR, Minnaar A, Simpson B, Reid S. The effect of two models of supervision on selected outcomes. Journal of Nursing Scholarship 2005;37(3):282‐8. [DOI] [PubMed] [Google Scholar]
References to studies excluded from this review
Agampodi 2008 {published data only}
- Agampodi SB, Agampodi TC. Effect of low cost public health staff training on exclusive breastfeeding. Indian Journal of Pediatrics 2008;75(11):1115‐9. [DOI] [PubMed] [Google Scholar]
Armstrong 2004 {published data only}
- Armstrong Schellenberg JR, Adam T, Mshinda H, Masanja H, Kabadi G, Mukasa O, et al. Effectiveness and cost of facility‐based Integrated Management of Childhood Illness (IMCI) in Tanzania. Lancet 2004;364(9445):1583‐94. [DOI] [PubMed] [Google Scholar]
Ashworth 2005 {published data only}
- Ashworth NL, Chad KE, Harrison EL, Reeder BA, Marshall SC. Home versus centre based physical activity programs in older adults. Cochrane Database of Systematic Reviews 2005, Issue 1. [DOI: 10.1002/14651858.CD000409.pub2] [DOI] [PMC free article] [PubMed] [Google Scholar]
Bang 1994 {published data only}
- Bang AT, Bang RA, Sontakke PG. Management of childhood pneumonia by traditional birth attendants. Bulletin of the World Health Organization 1994;72(6):897‐905. [PMC free article] [PubMed] [Google Scholar]
Bang 1999 {published data only}
- Bang AT, Bang RA, Baitule SB, Reddy MH, Deshmukh MD. Effect of home‐based neonatal care and management of sepsis on neonatal mortality: field trial in rural India. Lancet 1999;354(9194):1955‐61. [DOI] [PubMed] [Google Scholar]
Bradley 2005 {published data only}
- Bradley J, Igras S. Improving the quality of child health services: Participatory action by providers. International Journal for Quality in Health Care 2005;17(5):391‐9. [DOI] [PubMed] [Google Scholar]
Brewster 1997 {published data only}
- Brewster DR, Manary MJ, Graham SM. Case management of kwashiorkor: An intervention project at seven nutrition rehabilitation centres in Malawi. European Journal of Clinical Nutrition 1997;51(3):139‐47. [DOI] [PubMed] [Google Scholar]
Chalker 2001 {published data only}
- Chalker J. Improving antibiotic prescribing in Hai Phong Province, Viet Nam: the "antibiotic‐dose" indicator. Bulletin of the World Health Organization 2001;79(4):313‐20. [PMC free article] [PubMed] [Google Scholar]
Chinbuah 2006 {published data only}
- Chinbuah A M, Gyapong J O, Pagnoni F, Wellington E K, Gyapong M. Feasibility and acceptability of the use of artemether‐lumefantrine in the home management of uncomplicated malaria in children 6‐59 months old in Ghana. Tropical Medicine & International Health 2006;11(7):1003‐16. [DOI] [PubMed] [Google Scholar]
Chopra 2005 {published data only}
- Chopra M, Patel S, Cloete K, Sanders D, Peterson S. Effect of an IMCI intervention on quality of care across four districts in Cape Town, South Africa. Archives of Disease in Childhood 2005;90(4):397‐401. [DOI] [PMC free article] [PubMed] [Google Scholar]
Chukwujekwu 2010 {published data only}
- Chukwujekwu O, Chabikuli NO, Merrigan M, Awi D, Hamelmann C. Integrating reproductive health and HIV indicators into the Nigerian health system‐‐building an evidence base for action. African Journal of Reproductive Health 2010;14(1):109‐16. [PubMed] [Google Scholar]
Comolet 1997 {published data only}
- Comolet TM, Rakotomalala RA, Rasolomahefa D. An evaluation of a district level supervision program. [French]. Cahiers Sante 1997;7(2):103‐8. [PubMed] [Google Scholar]
Conteh 2010 {published data only}
- Conteh L, Patouillard E, Kweku M, Legood R, Greenwood B, Chandramohan D. Cost effectiveness of seasonal intermittent preventive treatment using amodiaquine & artesunate or sulphadoxine‐pyrimethamine in Ghanaian children. PLoS ONE 2010;5(8):1‐11. [DOI] [PMC free article] [PubMed] [Google Scholar]
Curtale 1995 {published data only}
- Curtale F, Siwakoti B, Lagrosa C, LaRaja M, Guerra R. Improving skills and utilization of community health volunteers in Nepal. Social Science & Medicine 1995;40(8):1117‐25. [DOI] [PubMed] [Google Scholar]
Dehne 1995 {published data only}
- Dehne KL, Wacker J, Cowley J. Training birth attendants in the Sahel. World Health Forum 1995;16(4):415‐9. [PubMed] [Google Scholar]
De Jong 1996 {published data only}
- Jong JTVM. A comprehensive public mental health programme in Guinea‐Bissau: A useful model for African, Asian and Latin‐American countries. Psychological Medicine 1996;26(1):97‐108. [DOI] [PubMed] [Google Scholar]
Delacollette 1996 {published data only}
- Delacollette C, Stuyft P, Molima K. Using community health workers for malaria control: Experience in Zaire. Bulletin of the World Health Organization 1996;74(4):423‐30. [PMC free article] [PubMed] [Google Scholar]
Delgado 1983 {published data only}
- Delgado Fernandez JG, Villarreal Gonzalez J, Lopez Uresti S. La clinica del niño sano. Boletín médico del Hospital Infantil de México 1983;40(2):89‐94. [PubMed] [Google Scholar]
Di Sorbo 2010 {published data only}
- Sorbo PG, Chifamba DD, Mastrojohn III J, Sisimayi CN, Williams SH. The Zimbabwe rural palliative care initiative: PCI‐Z. J Pain Symptom Manage 2010;40(1):19‐22. [DOI] [PubMed] [Google Scholar]
Dolo 2010 {published data only}
- Dolo A, Diallo M, Saye R, Konaré A, Ouattara A, Poudiougo B, et al. Obstacles to laboratory diagnosis of malaria in Mali‐‐perspectives. Medecine Tropicale : Revue Du Corps De Sante Colonial 2010;70(2):158‐62. [PubMed] [Google Scholar]
Dumont 2005 {published data only}
- Dumont A, Gaye A, Mahe P, Bouvier‐Colle MH. Emergency obstetric care in developing countries: impact of guidelines implementation in a community hospital in Senegal. BJOG: An International Journal of Obstetrics & Gynaecology 2005;112(9):1264‐9. [DOI] [PubMed] [Google Scholar]
Edginton 1999 {published data only}
- Edginton ME. Tuberculosis patient care decentralised to district clinics with community‐based directly observed treatment in a rural district of South Africa. International Journal of Tuberculosis & Lung Disease 1999;3(5):445‐50. [PubMed] [Google Scholar]
Fauveau 1991 {published data only}
- Fauveau V, Stewart K, Khan SA, Chakraborty J. Effect on mortality of community‐based maternity‐care programme in rural Bangladesh. Lancet 1991;338(8776):1183‐6. [DOI] [PubMed] [Google Scholar]
Floyd 2003 {published data only}
- Floyd K, Skeva J, Nyirenda T, Gausi F, Salaniponi F. Cost and cost‐effectiveness of increased community and primary care facility involvement in tuberculosis care in Lilongwe District, Malawi. International Journal of Tuberculosis & Lung Disease 2003;7(9 SUPPL 1):S29‐37. [PubMed] [Google Scholar]
Frazao 2009 {published data only}
- Frazao P, Marques D. Effectiveness of a community health worker program on oral health promotion. Revista de Saúde Pública 2009;43(3):463‐71. [DOI] [PubMed] [Google Scholar]
Ghoneim 2004 {published data only}
- Ghoneim EH, Hassan MH, Amine EK. An intervention programme for improving the nutritional status of children. Eastern Mediterranean Health Journal November 2004; Vol. 10, issue 6:828‐43. [PubMed]
Giugliani 2010 {published data only}
- Giugliani C, Duncan BB, Harzheim E, Breysse S, Jarrige L. The impact of a short‐term intervention using the WHO guidelines for the management of severe malnutrition at a rural facility in Angola. Archives of Disease in Childhood 2010;95(3):198. [DOI] [PubMed] [Google Scholar]
Grosskurth 1995 {published data only}
- Grosskurth H, Mosha F, Todd J, Mwijarubi E, Klokke A, Senkoro K, et al. Impact of improved treatment of sexually transmitted diseases on HIV infection in rural Tanzania: randomised controlled trial. Lancet 1995;346(8974):530‐6. [DOI] [PubMed] [Google Scholar]
Grosskurth 2000 {published data only}
- Grosskurth H, Mwijarubi E, Todd J, Rwakatare M, Orroth K, Mayaud P, et al. Operational performance of an STD control programme in Mwanza Region, Tanzania. Sexually Transmitted Infections. 2000;76(6):426‐36, 2000 Dec.. [DOI] [PMC free article] [PubMed] [Google Scholar]
Hayes 2005 {published data only}
- Hayes RJ, Changalucha J, Ross DA, Gavyole A, Todd J, Obasi AI, et al. The MEMA kwa Vijana project: design of a community randomised trial of an innovative adolescent sexual health intervention in rural Tanzania. Contemporary Clinical Trials 2005;26(4):430‐42. [DOI] [PubMed] [Google Scholar]
Hidalgo 1997 {published data only}
- Hidalgo CG, Cabezas AM, Collados M. Clima organizacional en un centro de salud de atención primaria: evaluación e intervención para mejorar la satisfacción laboral del equipo de salud. Cuadernos medico socials 1997;38(3):3‐12. [Google Scholar]
Hill 2000 {published data only}
- Hill AG, MacLeod WB, Joof D, Gomez P, Ratcliffe AA, Walraven G. Decline of mortality in children in rural Gambia: The influence of village‐level Primary Health Care. Tropical Medicine & International Health 2000;5(2):107‐18. [DOI] [PubMed] [Google Scholar]
Htay 2003 {published data only}
- Htay TT, Sauvarin J, Khan S. Integration of post‐abortion care: The role of township medical officers and midwives in Myanmar. Reproductive Health Matters 2003;11(21):27‐36. [DOI] [PubMed] [Google Scholar]
Irawati 2007 {published data only}
- Irawati SR, Basri C, Arias MS, Prihatini S, Rintiswati N, Voskens J, et al. Hospital DOTS linkage in Indonesia: A model for DOTS expansion into government and private hospitals. International Journal of Tuberculosis & Lung Disease 2007;11(1):33‐9. [PubMed] [Google Scholar]
Jacquier 2000 {published data only}
- Jacquier NM, Dos Santos L. Evaluacion operativa de la cadena de frío de las vacunas. Desafios 2000;1(5):62‐5. [Google Scholar]
Janowitz 2000 {published data only}
- Janowitz B, Chege J, Thompson A, Rutenberg N, Homan R. Community‐based distribution in Tanzania: costs and impacts of alternative strategies to improve worker performance. International Family Planning Perspectives 2000;26(4):158‐60 & 193‐5. [Google Scholar]
Jaramillo 2001 {published data only}
- Arias IJ, Palomino AI, Pasmio de Osorio S, Pinzon BF. Mejoramiento continuo de la atencion prenatal y su impacto en la mortalidad perinatal en dos instituciones de salud de Popayan. Revista Colombiana De Obstetricia Y Ginecologia 2001;52(1):33‐42. [Google Scholar]
Jin 1993 {published data only}
- Jin BW, Kim SC, Mori T, Shimao T. The impact of intensified supervisory activities on tuberculosis treatment. Tubercle & Lung Disease 1993;74(4):267‐72. [DOI] [PubMed] [Google Scholar]
Kafle 2009 {published data only}
- Kafle KK, Bhuju GB, Karkee SB, Prasad RR, Shrestha N, Shrestha AD, et al. An intervention improving prescribing practices and monitoring drugs availability in a district.. Nepal Medical College Journal 2009;11(4):217‐21. [PubMed] [Google Scholar]
Katabarwa 2005 {published data only}
- Katabarwa MN, Habomugisha P, Richards Jr FO, Hopkins D. Community‐directed interventions strategy enhances efficient and effective integration of health care delivery and development activities in rural disadvantaged communities of Uganda. Tropical Medicine & International Health 2005;10(4):312‐21. [DOI] [PubMed] [Google Scholar]
Kelly 2001 {published data only}
- Kelly PM. Local problems, local solutions: Improving tuberculosis control at the district level in Malawi. Bulletin of the World Health Organization 2001;79(2):111‐7. [PMC free article] [PubMed] [Google Scholar]
Kim 2002 {published data only}
- Kim Y‐M, Figueroa ME, Martin A, Silva R, Acosta SF, Hurtado M, et al. Impact of supervision and self‐assessment on doctor‐patient communication in rural Mexico. International Journal for Quality in Health Care 2002;14(5):359‐67. [DOI] [PubMed] [Google Scholar]
Kirkwood 2010 {published data only}
- Kirkwood BR, Manu A, Tawiah‐Agyemang C, Asbroek G, Gyan T, Weobong B, et al. NEWHINTS cluster randomised trial to evaluate the impact on neonatal mortality in rural Ghana of routine home visits to provide a package of essential newborn care interventions in the third trimester of pregnancy and the first week of life: Trial protocol. Trials 2010;11:58. [DOI] [PMC free article] [PubMed] [Google Scholar]
Lamboray 1979 {published data only}
- Lamboray JL. The rural health area of Kisantu, Zaire: Rationalisation of the primary consultation; supervision and evaluation; integration of the services. [French]. Annales de la Société Belge de Médecine Tropicale 1979;59 Suppl:15‐32. [Google Scholar]
Libamba 2006 {published data only}
- Libamba E, Makombe S, Mhango E, Teck ODA, Limbambala E, Schouten E, et al. Supervision, monitoring and evaluation of nationwide scale‐up of antiretroviral therapy in Malawi. Bulletin of the World Health Organization 2006;84(4):320‐6. [DOI] [PMC free article] [PubMed] [Google Scholar]
Libamba 2007 {published data only}
- Libamba E, Makombe SD, Harries AD, Schouten EJ, Yu JK‐L, Pasulani O, et al. Malawi's contribution to '3 by 5': Achievements and challenges. Bulletin of the World Health Organization 2007;85(2):156‐60. [DOI] [PMC free article] [PubMed] [Google Scholar]
Lofmark 2010 {published data only}
- Lofmark A, Thorell‐Ekstrand I. Strengthening and updating supervising staff nurses in educational workshops ‐ An international partnership project. Nurse Education in Practice 2010;10(5):262‐7. [DOI] [PubMed] [Google Scholar]
Lynch 1994 {published data only}
- Lynch O, Derveeuw M. The impact of training and supervision on traditional birth attendants. Tropical Doctor 1994;24(3):103‐7. [DOI] [PubMed] [Google Scholar]
Maung 2006 {published data only}
- Maung M, Kluge H, Aye T, Maung W, Noe P, Zaw M, et al. Private GPs contribute to TB control in Myanmar: Evaluation of a PPM initiative in Mandalay Division. International Journal of Tuberculosis & Lung Disease 2006;10(9):982‐7. [PubMed] [Google Scholar]
Mogassale 2010 {published data only}
- Mogasale V, Wi TC, Das A, Kane S, Singh AK, George B, et al. Quality assurance and quality improvement using supportive supervision in a large‐scale STI intervention with sex workers, men who have sex with men/transgenders and injecting‐drug users in India. Sexually Transmitted Infections 2010;86:i83‐8. [DOI] [PMC free article] [PubMed] [Google Scholar]
Osterholt 2006 {published data only}
- Osterholt DM, Rowe AK, Hamel MJ, Flanders WD, Mkandala C, Marum LH, et al. Predictors of treatment error for children with uncomplicated malaria seen as outpatients in Blantyre district, Malawi. Tropical Medicine & International Health 2006;11(8):1147‐56. [DOI] [PubMed] [Google Scholar]
PAHO 1999 {published data only}
- Pan American Health Organisation. Nursing and Midwifery Making a Difference PANMCC Meeting, 7‐8 October 1998. The Pan American Network of Nursing and Midwifery Collaborating Centers. Organization and Management of Health Systems and Services. 1999, issue 18.
PAHO 1999a {published data only}
- Pan American Health Organisation. Nursing in the Regions of the Americas. Series Organization and Management of Health Systems and Services 1999; Vol. 16.
PAHO 2005 {published data only}
- Pan American Health Organisation. Report on the activities of the internal oversight services. 136th Session of the Executive Committee, Buenos Aires, Argentina, 20‐24 June 2005. Provisional Agenda Item 5.4 19 May 2005, issue CE136/21.
Powell 1989 {published data only}
- Powell C, Grantham‐McGregor S. Home visiting of varying frequency and child development. Pediatrics 1989;84(1):157‐64. [PubMed] [Google Scholar]
Rao 1998 {published data only}
- Rao BR, Krishnamurthy P. A comparative study of the cost and effectiveness of a modified system of MDT drug delivery system in a high endemic district (Nalagonda) of South India. Indian Journal of Leprosy 1998;70(SUPPL.):63S‐71S. [PubMed] [Google Scholar]
Reynolds 2008 {published data only}
- Reynolds HW, Toroitich‐Ruto C, Nasution M, Beaston‐Blaakman A, Janowitz B. Effectiveness of training supervisors to improve reproductive health quality of care: a cluster‐randomized trial in Kenya. Health Policy & Planning 2008;23(1):56‐66. [DOI] [PubMed] [Google Scholar]
Ronsmans 2001 {published data only}
- Ronsmans C, Endang A, Gunawan S, Zazri A, McDermott J, Koblinsky M, et al. Evaluation of a comprehensive home‐based midwifery programme in South Kalimantan, Indonesia. Tropical Medicine & International Health 2001;6(10):799‐810. [DOI] [PubMed] [Google Scholar]
Roos 1995 {published data only}
- Roos BR, Brakel WH, Chaurasia AK. Integration of leprosy control into basic health services; An example from Nepal. International Journal of Leprosy 1995;63(3):422‐9. [PubMed] [Google Scholar]
Ross 2007 {published data only}
- Ross DA, Changalucha J, Obasi AI, Todd J, Plummer ML, Cleophas‐Mazige B, et al. Biological and behavioural impact of an adolescent sexual health intervention in Tanzania: a community‐randomized trial. AIDS 2007;21(14):1943‐55. [DOI] [PubMed] [Google Scholar]
Sujpluem 1981 {published data only}
- Sujpluem C, Kanchanasinith K, Narkavonakit T. Thailand: Utilization of TBAs in family planning and maternal and child care. Public Health Papers 1981;75:167‐204. [PubMed] [Google Scholar]
Thiam 2007 {published data only}
- Thiam S, LeFevre AM, Hane F, Ndiaye A, Ba F, Fielding KL, et al. Effectiveness of a strategy to improve adherence to tuberculosis treatment in a resource‐poor setting: a cluster randomized controlled trial. JAMA 2007;297(4):380‐6. [DOI] [PubMed] [Google Scholar]
Tirado 1990 {published data only}
- Tirado NC, Guzman M, Burgos FL. Workload contribution of a physician assistant in an ambulatory care setting. Puerto Rico Health Sciences Journal 1990;9(2):165‐7. [PubMed] [Google Scholar]
Wasunna 2010 {published data only}
- Wasunna B, Zurovac D, Bruce J, Jones C, Webster J, Snow RW. Health worker performance in the management of paediatric fevers following in‐service training and exposure to job aids in Kenya. Malaria Journal 2010;9(1):231. [DOI] [PMC free article] [PubMed] [Google Scholar]
Wesson 2008 {published data only}
- Wesson J, Olawo A, Bukusi V, Solomon M, Pierre‐Louis B, Stanback J, et al. Reaching providers is not enough to increase iud use: A factorial experiment of 'academic detailing' in Kenya. Journal of Biosocial Science 2008;40(1):69‐82. [DOI] [PubMed] [Google Scholar]
Zenni 1996 {published data only}
- Zenni E A, Robinson T N. Effects of structured encounter forms on paediatric house staff knowledge. Archives of Pediatrics & Adolescent Medicine 1996;150(9):975‐80. [DOI] [PubMed] [Google Scholar]
Additional references
Aitken 1994
- Aitken JM. Voices from the inside: managing district health services in Nepal. International Journal of Health Planning and Management 1994;9(4):309‐40. [DOI] [PubMed] [Google Scholar]
Bennet 1994
- Bennet S, Dakpalla G, Garner P, Gilson L, Nittayaramphong S, Zurita B, et al. Carrot and stick: state mechanisms to influence private behaviour. Health Policy and Planning 1994;9(1):1‐13. [PubMed] [Google Scholar]
Bosch‐Capblanch 2008
- Bosch‐Capblanch X, Garner P. Primary health care supervision in developing countries. Tropical Medicine and International Health 2008;13(3):369‐83. [DOI] [PubMed] [Google Scholar]
Burns 1998
- Burns CB, Clough AR, Currie BJ, Thomsen P, Wirudjal R. Resource requirements to develop a large, remote Aboriginal health service: Whose responsibility?. Australian and New Zealand Journal of Public Health 1998;22(1):133‐9. [DOI] [PubMed] [Google Scholar]
Cairncross 1997
- Cairncross S, Periès H, Cutts F. Vertical health programmes. Lancet 1997;349(supl III):20‐2. [Google Scholar]
Cueto 2004
- Cueto M. The origins of primary health care and selective primary health care. American Journal of Public Health 2004;94(11):1864‐74. [DOI] [PMC free article] [PubMed] [Google Scholar]
EPOC 2002
- EPOC. The data collection checklist. 2002.
Flahault 1988
- Flahault D, Piot M, Franklin A. The supervision of health personnel at district level. Geneva: World Health Organization, 1988. [Google Scholar]
Gill 1990
- Gill W (ed). Community Health Workers in national programmes. Just another pair of hands?. Philadelphia: Open University Press, 1990. [Google Scholar]
Greenwood 1990
- Greenwood BM, Bradley AK, Byass P, Greenwod AM, Menon A, Snow RW, et al. Evaluation of a primary health care programme in The Gambia. II Its impact on mortality and morbidity in young children. Journal of Tropical Medicine and Hygiene 1990;93:87‐97. [PubMed] [Google Scholar]
Kilminster 2000
- Kilminster SM, Jolly BC. Effective supervision in clinical practice settings: a literature review. Medical Education 2000;34(10):827‐40. [DOI] [PubMed] [Google Scholar]
Kleczkowski 1984
- Kleczkowski BM, Elling RH, Smith DL. Health system support for primary health care. A study based on the technical discussions held during the thirty‐fourth World Health Assembly, 1981. Public Health Papers 1984;80:1–104. [PubMed] [Google Scholar]
Lin 2006
- Lin IB, Goodale BJ. Improving the supervision of therapy assistants in Western Australia: the Therapy Assistant Project (TAP). Rural and Remote Health 2006; Vol. 1. [PubMed]
MAQ 2002
- MAQ. Making Supervisions Supporting and Sustainable: A new Approach to old Problems. Maximising Access and Quality. MAQ Paper No. 4.
McMahon 1992
- McMahon R, Barton E, Piot M. On being in charge. A guide to management in primary health care. 2nd Edition. Geneva: WHO, 1992. [Google Scholar]
Ministerial 2002
- Rural health in rural hands. Strategic directions for rural, remote, northern, aboriginal communities. Ministerial Advisory Council on Rural Health 2002.
O'Brien 2008
- O'Brien MA, Rogers S, Jamtvedt G, Oxman AD, Odgaard‐Jensen J, Kristoffersen DT, et al. Educational outreach visits: effects on professional practice and health care outcomes. Cochrane Database of Systematic Reviews 2008, Issue 4. [DOI: 10.1002/14651858.CD000409.pub2] [DOI] [PMC free article] [PubMed] [Google Scholar]
WHO 1978a
- WHO. Joint report of the Director‐General of the World Health Organization and the Executive Director of the United Nations Children's Fund. Primary Health Care. Report of the International Conference on Primary Health Care. Alma‐Ata (USSR). Geneva: WHO, 1978:Primary Health Care. Report of the International Conference on Primary Health Care. Alma‐Ata (USSR). WHO. Geneva 1978. [Google Scholar]
WHO 1978b
- WHO. Declaration of Alma‐Ata. International Conference on Primary Health Care, Alma‐Ata, USSR, 6‐12 September 1978. 1978. [PubMed]
WHO 1991
- WHO. Community involvement in health development: challenging health services. WHO Technical Report Series. Geneva, 1991; Vol. 809. [PubMed]
WHO 1994
- WHO. Ninth General Programme of Work covering the period 1996‐2001. Health for All series. Geneva: WHO, 1994; Vol. 11.
World Bank
- World Bank. Data and Statistics. Country Classification. http://web.worldbank.org/WBSITE/EXTERNAL/DATASTATISTICS/0,,contentMDK:20420458˜menuPK:64133156˜pagePK:64133150˜piPK:64133175˜theSitePK:239419,00.html Accessed 19/09/06.