

Abstract
Inner hair cells (IHCs) of the cochlea use ribbon synapses to transmit auditory information faithfully to spiral ganglion neurons (SGNs). In the present study, we used genetic disruption of the presynaptic scaffold protein bassoon in mice to manipulate the morphology and function of the IHC synapse. Although partial-deletion mutants lacking functional bassoon (BsnΔEx4/5) had a near-complete loss of ribbons from the synapses (up to 88% ribbonless synapses), gene-trap mutants (Bsngt) showed weak residual expression of bassoon and 56% ribbonless synapses, whereas the remaining 44% had a loosely anchored ribbon. Patch-clamp recordings and synaptic CaV1.3 immunolabeling indicated a larger number of Ca2+ channels for Bsngt IHCs compared with BsnΔEx4/5 IHCs and for Bsngt ribbon-occupied versus Bsngt ribbonless synapses. An intermediate phenotype of Bsngt IHCs was also found by membrane capacitance measurements for sustained exocytosis, but not for the size of the readily releasable vesicle pool. The frequency and amplitude of EPSCs were reduced in BsnΔEx4/5 mouse SGNs, whereas their postsynaptic AMPA receptor clusters were largely unaltered. Sound coding in SGN, assessed by recordings of single auditory nerve fibers and their population responses in vivo, was similarly affected in Bsngt and BsnΔEx4/5 mice. Both genotypes showed impaired sound onset coding and reduced evoked and spontaneous spike rates. In summary, reduced bassoon expression or complete lack of full-length bassoon impaired sound encoding to a similar extent, which is consistent with the comparable reduction of the readily releasable vesicle pool. This suggests that the remaining loosely anchored ribbons in Bsngt IHCs were functionally inadequate or that ribbon independent mechanisms dominated the coding deficit.
Introduction
Sensory hair cells, electroreceptors, retinal photoreceptors, and bipolar cells use a specialized synaptic machinery for fast and indefatigable sustained neurotransmitter release to encode transient and prolonged sensory stimuli precisely. Their morphological hallmark is the synaptic ribbon, an electron-dense structure tethering a halo of synaptic vesicles (tom Dieck and Brandstätter, 2006; for review, see Nouvian et al., 2006; Schmitz, 2009; Matthews and Fuchs, 2010; Rutherford and Pangršič, 2012). Several experimental approaches have indicated the functional importance of the ribbon, including biochemical studies of its major component, RIBEYE (Schwarz et al., 2011), genetic manipulation (Dick et al., 2003; Khimich et al., 2005; Sheets et al., 2011), studies of physiological ribbon dynamics (Remé and Young, 1977; Spiwoks-Becker et al., 2004; Hull et al., 2006; Emran et al., 2010), and acute photodamage (Snellman et al., 2011). Based on such data, two major functions of the ribbon can be hypothesized: (1) establishing and stabilizing a large number of vesicular release sites and Ca2+ channels at the active zone, i.e., a large readily releasable vesicle pool (RRP; Khimich et al., 2005; Hull et al., 2006; Frank et al., 2010) and (2) rapid refilling of the RRP of synaptic vesicles (von Gersdorff et al., 1996; LoGiudice et al., 2008; Frank et al., 2010; Snellman et al., 2011). A third emerging hypothesis suggests a role of the ribbon in synchronous multiquantal release (MQR; (Heidelberger et al., 1994; Parsons and Sterling, 2003; Edmonds, 2004; Fuchs, 2005; Matthews and Sterling, 2008; Graydon et al., 2011). MQR has been reported for inner ear and retinal ribbon synapses (Glowatzki and Fuchs, 2002; Singer et al., 2004; Neef et al., 2007; Li et al., 2009).
The large 420 kDa scaffold protein bassoon interacts with RIBEYE (tom Dieck et al., 2005) and thereby contributes to the anchorage of the ribbon to the active zone of photoreceptors (Dick et al., 2003) and inner hair cells (IHCs) (Khimich et al., 2005). By promoting a high abundance of Ca2+ channels and release sites for readily releasable vesicles (Khimich et al., 2005; Frank et al., 2010), bassoon and/or the ribbon enable high rates of spiral ganglion neuron (SGN) firing (Buran et al., 2010; Frank et al., 2010). In the present study, we show that a higher fraction of preserved synaptic ribbons in bassoon gene-trap IHCs (Frank et al., 2010; Hallermann et al., 2010; Bsngt) is associated with a weaker IHC phenotype compared with mostly ribbonless BsnΔEx4/5 IHCs (mice with deletion of exons 4 and 5 of the bassoon gene (Altrock et al., 2003; Khimich et al., 2005) in terms of Ca2+ currents, and sustained exocytosis, whereas RRP size in Bsngt IHCs and sound encoding in Bsngt SGNs are not improved. Using immunofluorescence microscopy, we found a greater distance of the ribbon from the active zone in Bsngt IHCs and propose that those loosely anchored ribbons are not fully functional. Finally, using patch-clamp recordings from postsynaptic SGN boutons of BsnΔEx4/5 mice, we found a normal range of EPSC amplitudes but lower mean amplitudes and rates, suggesting that the ribbon is not essential but is supportive for MQR.
Materials and Methods
Animals.
Mice of either sex with a targeted deletion of exons 4 and 5 of the bassoon gene (BsnΔEx4/5; Altrock et al., 2003) or bassoon gene-trap mutants (Frank et al., 2010; Hallermann et al., 2010; Bsngt; derived from Omnibank ES cell line OST486029; Lexicon Pharmaceuticals) and their respective heterozygous (HzΔEx4/5) and wild-type littermates (WTΔEx4/5 and WTgt) were used for experiments. The genetic background for the BsnΔEx4/5 animals is characterized as C57BL/6 × 129Sv. For Bsngt mice, it is an uncharacterized background derived from the same strains. All experiments complied with national animal care guidelines and were approved by the University of Göttingen Board for animal welfare and the animal welfare office of the state of Lower Saxony.
Immunohistochemistry and confocal microscopy.
The cochlea was opened near the apex and fixed in 99% methanol for 20 min at −20°C. Apical half-turns of organs of Corti were carefully explanted and immunostaining of the whole mounts was performed as described previously (Khimich et al., 2005, Meyer et al., 2009; Frank et al., 2010), but using donkey serum (Genetex) instead of goat serum buffer for blocking and dilution of antibodies. The following antibodies were used: goat anti-CtBP2 (1:150; Santa Cruz Biotechnology), mouse anti-GluA2 (1:75; Millipore), rabbit anti-CaV1.3 (1:75; Alomone Labs), mouse anti-bassoon SAP7F407 (Abcam), and secondary Alexa Fluor 488-conjugated anti-mouse, Alexa Fluor 596-conjugated anti-goat, and Alexa Fluor 647-conjugated anti-rabbit IgG antibodies (1:200, Invitrogen). Confocal morphological images were acquired using a laser scanning confocal microscope (SP5; Leica) with 100× oil-immersion objectives, avoiding the extreme apical regions. In each experiment, organs of Corti of mutant and WT animals 29–75 d of age were processed in parallel using identical staining, mounting, laser excitation power, and microscope emission and detection settings. Experiments were repeated until successful; preparations were judged successful if all antigens were labeled with relative uniformity in both genotypes on the same experiment. Each preparation yielded several images, each containing a row of 6 IHCs. Image stacks of synaptic regions selected for semiquantitative analysis were acquired at similar depths in the z-axis to control for attenuation. Preparations were discarded if bleaching was rapid or nonuniform across channels. The following numbers of pairs of successful preparations of both ears from pairs of mutant/WT mice were included in the analysis: 3 GluA2/CtBP2/Cav1.3, 2 CtBP2/Cav1.3/bassoon, 1 Cav1.3/bassoon, and 2 GluA2/CtBP2. Stimulated emission depletion microscopy was performed with a custom microscope as in Frank et al. (2010).
The locations of synapses in confocal image stacks were defined as the centers of mass of fluorescent spots after thresholding by a subjective intensity criterion for each channel. The background (defined as the average voxel intensity in the entire synaptic region excluding voxels that exceeded the threshold value) was subtracted. Gaussian functions were fitted in all three dimensions to determine the center of mass of each cluster and the distance to the centers of mass of the nearest neighboring clusters in the other two channels within a 500 nm range. Immunofluorescence intensity was measured as the integral of the voxel values within a defined region of interest (9 × 9 × 7 voxels in the X, Y, and Z direction, which has the volume of ∼0.5 × 0.5 × 3.0 μm) centered on the voxel where the center of mass of each GluA2-positive cluster located.
Real-time PCR.
Total RNA was isolated from preparations of the organ of Corti of 5-week-old mice using TRIzol reagent (Invitrogen). After reverse transcription with random hexamers, cDNA was subjected to real-time PCR using an ABI Prism 7900 Sequence Detection System (Applied Biosystems). cDNAs for Bsn, otoferlin, and TBP (TATA-binding protein as a housekeeping gene) were selectively amplified using the commercially available TaqMan Gene Expression Assays Mm01330351_mH, Mm00453306_m1, and Mm00446973_m1, respectively (Applied Biosystems) in separate reactions (20 μl volume) according to the manufacturer's protocol. Relative amounts of bassoon mRNAs, normalized to that of otoferlin, were calculated using the comparative 2−ΔΔCt method (Applied Biosystems).
Patch-clamp of IHCs and postsynaptic boutons of SGNs.
EPC-9 or EPC-10 amplifiers controlled by Patchmaster (HEKA Elektronik) were used for measurements. All voltages were corrected for liquid-junction potentials. IHCs from apical coils of freshly dissected organs of Corti (postnatal d 22–32) were patch-clamped as described previously (Moser and Beutner, 2000). The pipette solution for perforated-patch recordings contained the following (in mm): 120 Cs-glutamate (CsGlu), 13 tetraethylammonium (TEA)-Cl, 8 CsCl, 20 CsOH-HEPES, 1 MgCl2, and 250 μg/ml amphotericin B (Calbiochem), pH 7.2. The pipette solution for whole-cell recordings contained the following (in mm): 100 CsGlu, 13 TEA-Cl, 8 CsCl, 20 CsOH-HEPES, 1 MgCl2, 2 Mg-ATP, 0.3 Na-GTP, 5 EGTA, 1.5 CaCl2, and 10 phosphocreatine disodium salt, pH 7.2. The extracellular solution contained the following (in mm): 95 NaCl, 35 TEA-Cl, 2.8 KCl, 10 CaCl2, 1 MgCl2, 1 CsCl, 10 NaOH-HEPES, and 10 d-glucose, pH 7.3. Currents were low-pass filtered at 5 kHz and sampled at 40 kHz. IHCs that showed a holding current exceeding −50 pA were discarded from analysis. Ca2+ currents were further isolated using a P/n protocol. For perforated-patch experiments, series resistance was required to be <30 MΩ. Membrane capacitance increments (ΔCm) were measured as described previously (Moser and Beutner, 2000), averaging 100 ms before and 200 ms after (skipping the first 30 ms) the depolarization. We used 20 or 100 ms depolarizations and three interpulse intervals (98, 198, 398 ms) for dual-pulse experiments. For estimation of ΔCm1, we averaged the membrane capacitance during the interpulse interval (Cm1) starting 30 ms after the end of the depolarization, and subtracted the baseline capacitance (averaged >100 ms before depolarization onset). Therefore, depending on the interpulse interval, the averaging window was 68, 168, and 368 ms long, respectively. For estimation of ΔCm2, we averaged the membrane capacitance >200 ms (starting 30 ms after the second depolarization) and subtracted Cm1.
For display, ΔCm traces (recorded at 1 kHz) were low-pass filtered at 50 Hz. Interstimulus periods were 2–3 s between Ca2+ current sweeps and 30–70 s for exocytosis measurements. Whole-cell recordings from postsynaptic boutons of 9- to 11-d-old SGNs were performed essentially as described previously (Glowatzki and Fuchs, 2002) using pipettes with small tip openings and resistance of 8–15 MΩ after pressure polishing (Goodman and Lockery, 2000). The pipette solution contained the following (in mm): 150 CsCl, 3.5 MgCl2, 0.1 CaCl2, 5 EGTA, 5 HEPES, and 2.5 Na2ATP, pH 7.2. The extracellular solution contained the following (in mm): 5.8 KCl, 155 NaCl, 0.9 MgCl2, 1.3 CaCl2, 0.7 NaH2PO4, 5.6 d-glucose, and 10 HEPES, pH 7.4. In most recordings, tetrodotoxin (1–2 μm) was added to block voltage-gated Na+ channels. To depolarize presynaptic IHCs, 40 mm NaCl in the extracellular solution was replaced with equimolar KCl. Recordings were done at room temperature (21–23°C). After low-pass filtering at 10 kHz, EPSCs were detected and analyzed using Mini Analysis software (Synaptosoft). To classify the mode of EPSCs (i.e., monophasic or multiphasic), we followed the method standardized in a previous study (Grant et al., 2010).
Extracellular recordings from single SGN.
For evaluation of the impact of bassoon disruption on sound encoding, we performed extracellular recordings from SGN as described previously (Taberner and Liberman, 2005; Strenzke et al., 2009). In brief, mice 5–11 weeks of age (n = 12 for Bsngt, n = 10 for WTgt, n = 11 for BsnΔEx4/5, n = 2 for HzΔEx4/5, and n = 13 for WTΔEx4/5) were anesthetized by intraperitoneal injection of urethane (1.32 mg/kg), xylazine (5 mg/kg), and buprenorphine (0.1 mg/kg). An occipital approach with partial removal of the cerebellum was taken to advance a glass microelectrode during noise burst stimulation, aiming at identifying SGNs near the auditory nerve's entry zone into the cochlear nucleus and avoiding the posterior region of the anteroventral cochlear nucleus, where mainly spherical bushy cells are located. SGNs were distinguished from primary cochlear nucleus units based on the electrode position (electrode aiming at interior auditory canal, > 1 mm below the surface of cochlear nucleus) and their primary-like response characteristics to 200 suprathreshold 50 ms tone bursts presented at the characteristic frequency of the SGN, 30 dB above threshold. A coefficient of variation of interspike intervals of adapted responses > 0.5 confirmed the irregular firing pattern observed in SGNs. The mean first spike latency did not allow for a clear separation between SGNs and anteroventral cochlear nucleus units firing at low rates. Erroneous unit type classification was more likely when spike rates were low, yielding less clear response patterns.
For each sound responsive unit, we first determined the spontaneous rate in a 10 s interval and if it was <10 or 2 Hz, an additional 10 or 20 s recording interval was added, respectively. We also determined the tuning curve by varying the frequency and intensity of 15 ms tone bursts using an automatically adapting procedure. For each frequency/intensity combination, we used a sequential probability test (Wald, 1947) with p = 0.03 to determine whether the resulting spike rate was equal to the spontaneous rate or to the threshold rate (the criterion being SR + 20 Hz) or if the measurement had to be repeated to reach statistical significance. The initial intensity step size of 16 dB was halved each time the threshold was crossed until a precision of 1 dB was reached. Similarly, we started with 1 octave frequency steps and halved the frequency steps for frequencies near the best frequency to determine the thresholds near the characteristic frequency (CF) with 1/32 octave precision. For tuning curves, spike detection was performed online based on a manually set trigger, whereas all other data were analyzed offline using a spike detection routine modified from the Wave_Clus routines (Quiroga et al., 2004). Compared with the method used by Buran et al. (2010) (described by Liberman, 1978), which compared spike rates directly during a 50 ms tone burst as being either higher or the same as those in the following 50 ms silent period, our tuning curve detection method yielded shorter recording times and better reproducibility of the data, albeit with a systematic slight threshold elevation for units with a large dynamic range.
Recording of auditory brainstem response and distortion product otoacoustic emissions.
Animals were anesthetized intraperitoneally with a combination of ketamine (125 mg/kg) and xylazine (2.5 mg/kg) and the heart rate was monitored constantly to control the depth of anesthesia. The core temperature was maintained constant at 37°C using a rectal temperature-controlled heating blanket (Hugo Sachs Elektronik; Harvard Apparatus). For stimulus generation, presentation, and data acquisition we used the TDT System II (Tucker-Davis Technologies) run by BioSig32 software (TDT). Sound pressure levels are provided in dB SPL RMS (tonal stimuli) or dB SPL peak equivalent (PE, clicks) and were calibrated using a ¼″ microphone (D 4039, Brüel and Kjaer GmbH). Tone bursts (12 kHz, 10 ms plateau, 1 ms cos2 rise/fall) or clicks of 0.03 ms were presented at 20 Hz or 100 Hz in the free field ipsilaterally using a JBL 2402 speaker (JBL GmbH & Co.). The difference potential between vertex and mastoid subdermal needles was amplified (50,000 times), filtered (low pass: 4 kHz, high pass: 400 Hz) and sampled at a rate of 50 kHz for 20 ms, 2 × 2000 times to obtain two mean auditory brainstem responses (ABRs) for each sound intensity. Hearing threshold was determined with 10 dB precision as the lowest stimulus intensity that evoked a reproducible response waveform in both traces by visual inspection. For distortion product otoacoustic emissions, the ED1/EC1 speaker system (Tucker-Davis) was used to generate two primary tones (frequency ratio f2/f1: 1.2, intensity f2 = intensity f1 + 10 dB). Primary tones were coupled into the ear canal by a custom-made probe containing an MKE-2 microphone (Sennheiser) and adjusted to the desired sound intensities at the position of the ear drum as mimicked in a mouse ear coupler. The microphone signal was amplified and digitalized (DMX 6 Fire; Terratec) and analyzed by fast Fourier transformation (MATLAB; MathWorks).
Data analysis.
Data analysis was performed using MATLAB, Igor Pro (Wavemetrics), and ImageJ software (http://rsb.info.nih.gov/ij/). For high magnification of individual synapses, the ImageJ plugin “deconvolution lab” was used, applying 10 iterations of the Richardson-Lucy algorithm. Figures were assembled for display in Adobe Photoshop and Adobe Illustrator software. Mean ΔCm and Ca2+ current estimates are grand averages calculated from the mean estimates of individual IHCs. Means are expressed ± SEM. If applicable (i.e., normality of Jarque-Bera test and equal variances between [F test] the two samples), unpaired, two-tailed t tests were used for statistical comparisons between two sample groups. In all other cases, a Mann–Whitney–Wilcoxon test was used. Significance is shown as follows: *p < 0.05, **p < 0.01, ***p < 0.001, and n.s. (not significant).
Results
Defective ribbon anchorage in Bsngt IHCs
For an assessment of the morphology of IHC afferent synapses in Bsngt mutant mice, we used immunohistochemical colabeling of whole-mount preparations of the organ of Corti for the postsynaptic AMPA receptors GluA2, CtBP2/ribeye (labeling synaptic ribbons and sometimes nuclei), and presynaptic Cav1.3 Ca2+ channels (Fig. 1). Pairs of Bsngt and WTgt samples were processed in parallel with identical immunolabeling and imaging protocols. Bsngt (n = 2264 synapses in 199 IHCs) and WTgt (n = 1682 synapses in 148 IHCs) both had an average number of 11.4 GluA2-immunofluorescent spots per IHC in the tonotopic range of ∼5–8 kHz, indicating preserved synaptic connectivity of IHCs with a normal number of afferent synapses. However, whereas in WTgt virtually all GluA2 spots (97.2%) had a juxtaposed synaptic ribbon (Fig. 1A, left), the majority of the mutant synapses were ribbonless (Fig. 1A, right), suggesting a defect of ribbon anchorage to the presynaptic membrane. On average, we found 43.6% ribbon-occupied synapses in Bsngt IHCs (4–11 weeks of age with no clear age dependency), indicating a milder ribbon anchorage defect compared with BsnΔEx4/5, in which an age-dependent decrease from ∼47% at p11 (Fig. 5A,B) to 22% at p21 and 12% at p70 was observed (Khimich et al., 2005). Ca2+ channels were clustered at WTgt and Bsngt mutant synapses regardless of whether the ribbon was present.
Figure 1.

Bassoon contributes to anchoring the ribbon at the presynaptic membrane. A, Rows of IHCs from a WTgt (left) and a Bsngt mutant (right) mouse immunostained with antibodies against CtBP2 (red, labeling synaptic ribbons and nuclei), Cav1.3 (green, labeling presynaptic calcium channels), and GluA2 (blue, labeling postsynaptic glutamate receptors, illustrating a normal number of synapses but reduced ribbon occupancy in Bsngt IHCs. B, Distances between the centers of mass of CtBP2- and Cav1.3-immunoreactive clusters (top) at Bsngt IHC synapses (red) were never as short as the closest ones in WTgt (black), suggesting disturbed ribbon anchorage to the presynaptic membrane. In contrast, the distance between Cav1.3 and GluA2-positive clusters (bottom) was comparable (from one representative pair of preparations). C, Schematic illustrations of individual ribbon synapses (sizes and numbers not to scale). In the normal IHC synapse (left), the AZ is occupied by a synaptic ribbon (red) tethered to the presynaptic membrane by Bassoon (dark blue) accompanied by ribbon-associated and cytosolic synaptic vesicles (light green). Presynaptic Ca2+ channels (dark green) are clustered in a row underneath the ribbon (Frank et al., 2010), and glutamate receptor clusters (blue) on the postsynaptic SGN boutons assume a ring-like shape (Meyer et al., 2009; Fig. 3D). Bassoon has an unknown tertiary structure with a central RIBEYE-binding site (tom Dieck et al., 2005) and two double zinc finger domains in the n-terminal region that target synaptic membranes (Dresbach et al., 2003). In Bsn mutant synapses, the ribbon can be present (middle) or absent (right), Ca2+ channels are reduced in number, and the clusters are disorganized, whereas glutamate receptor rings and SGN boutons appear to be mostly preserved. The separation between remaining Bsngt ribbons and the presynaptic membrane is increased. Insets, deconvolved higher-magnification images of representative synapses from A.
Figure 5.
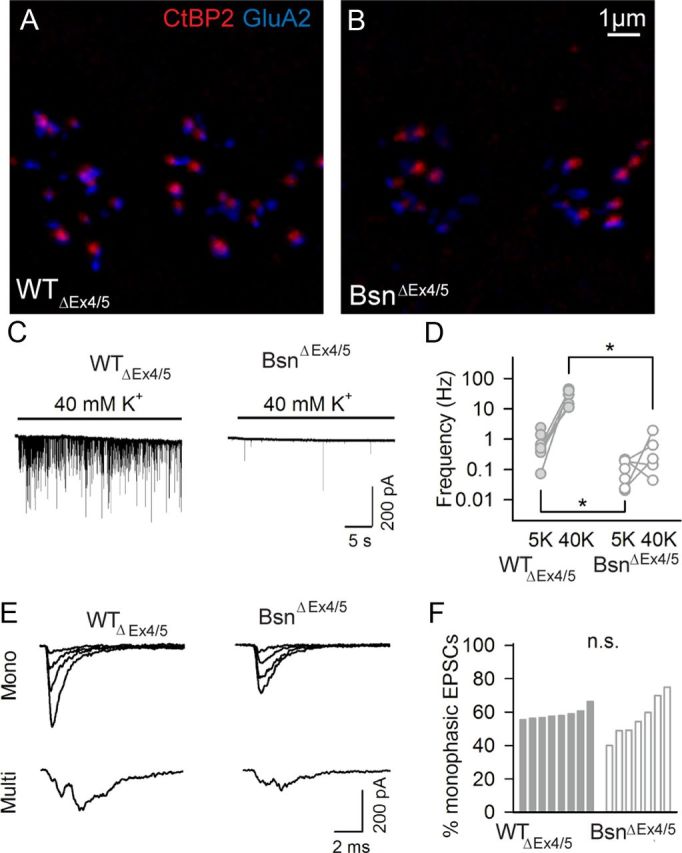
Patch-clamp recordings from postsynaptic SGN boutons of BsnΔEx4/5 mutants. A, B, Synaptic regions of IHCs of p11 WTΔEx4/5 (A) and BsnΔEx4/5 (B) mice, double-stained for GluA2 (blue) and CtBP2 (red), illustrating a relatively high ribbon occupancy in immature mutant IHC. C, Sample recordings of EPSCs from postsynaptic boutons of type I SGNs in WTΔEx4/5(left) and BsnΔEx4/5 (right). D, Frequency of EPSCs at rest (in artificial perilymph containing 5 mm K+) and during IHC stimulation by application of artificial perilymph containing 40 mm K+ for WTΔEx4/5 (filled circles) and BsnΔEx4/5 (open circles). E, Sample traces of EPSCs in a millisecond scale to demonstrate their kinetics. Both monophasic and multiphasic EPSCs from WTΔEx4/5 and BsnΔEx4/5 boutons are shown. F, Percentage of monophasic EPSCs derived from individual afferents of WTΔEx4/5 and BsnΔEx4/5 SGN, respectively.
We also analyzed Bsngt mutant and WTgt ribbon-occupied synapses for the relative spatial organization of their presynaptic and postsynaptic densities and synaptic ribbons with nanometer precision. We measured the 3-dimensional center of mass distances between the CtBP2-, CaV1.3-, and GluA2-immunofluorescent spots in stacks of confocal images (Fig. 1B, n = 99 synapses for Cav1.3-CtBP2 distance in Bsngt and n = 250 synapses for WTgt, p < 0.0001; n = 227 synapses for GluA2-Cav1.3 distance in Bsngt and n = 263 synapses in WTgt, p = 0.06). The distance of CtBP2 spots to CaV1.3 and GluA2 spots in Bsngt synapses was larger than at WT synapses, suggesting a looser ribbon anchorage to the presynaptic active zones, for which we had observed a trend based on a small sample of electron tomograms (Frank et al., 2010). In contrast, the distance between Cav1.3 and GluA2 spots was not significantly different between Bsngt synapses and WTgt synapses, arguing for a predominantly presynaptic effect and against a more generalized disruption of the synaptic ultrastructure. Figure 1C schematically summarizes the anatomy of WT (left), mutant ribbon-occupied (middle), and ribbonless synapses (right).
Leaky expression of bassoon in Bsngt IHCs may explain better ribbon anchorage than in BsnΔEx4/5
The gene-trap strategy used to generate Bsngt mice interferes with transcription of the bassoon gene by insertion of a termination sequence between exons 1 and 2. Although there have been no reports of residual bassoon expression in Western blots or immunohistochemistry of brain tissue (Hallermann et al., 2010), a “leaky” transcription producing a small amount of whole-length mRNA could not be excluded. To understand the less severe defect of ribbon anchorage in IHCs of Bsngt compared with BsnΔEx4/5, we studied the expression of bassoon on the mRNA and protein level in Bsngt organs of Corti. Using real-time PCR on cDNA, we found residual bassoon mRNA expression in Bsngt organs of Corti that amounted to 3% of WT levels (data not shown, n = 6 ears each). The expression level of mRNA coding for the 180 kDa protein fragment that remains expressed in BsnΔEx4/5 mice was unchanged compared with the level of full-length mRNA in littermate controls (WTΔEx4/5, data not shown, n = 2 ears each). This fragment does not appear to be localized to synapses in immunohistochemistry of the brain (Altrock et al., 2003) and hair cells (Frank et al., 2010).
Consistent with its suspected role in ribbon anchorage, bassoon immunolabeling was detected at virtually all afferent WT IHC synapses that were colabeled by CtBP2 and Cav1.3 (Fig. 2A). Additional bassoon immunoreactivity was observed in the regions where synaptic terminals of lateral olivocochlear efferent fibers contacted the postsynaptic boutons of SGNs. In Bsngt, a preparation double labeled for Cav1.3 and bassoon had indicated weak bassoon immunoreactivity overlapping with Cav1.3 clusters at < 5% of synapses (Frank et al., 2010). In additional triple-labeled preparations with inclusion of CtBP2 colabeling, bassoon was barely detectable. In that case, a visually detectable bassoon labeling was found at a single synapse (Fig. 2B, left) in a total of 72 IHCs.
Figure 2.
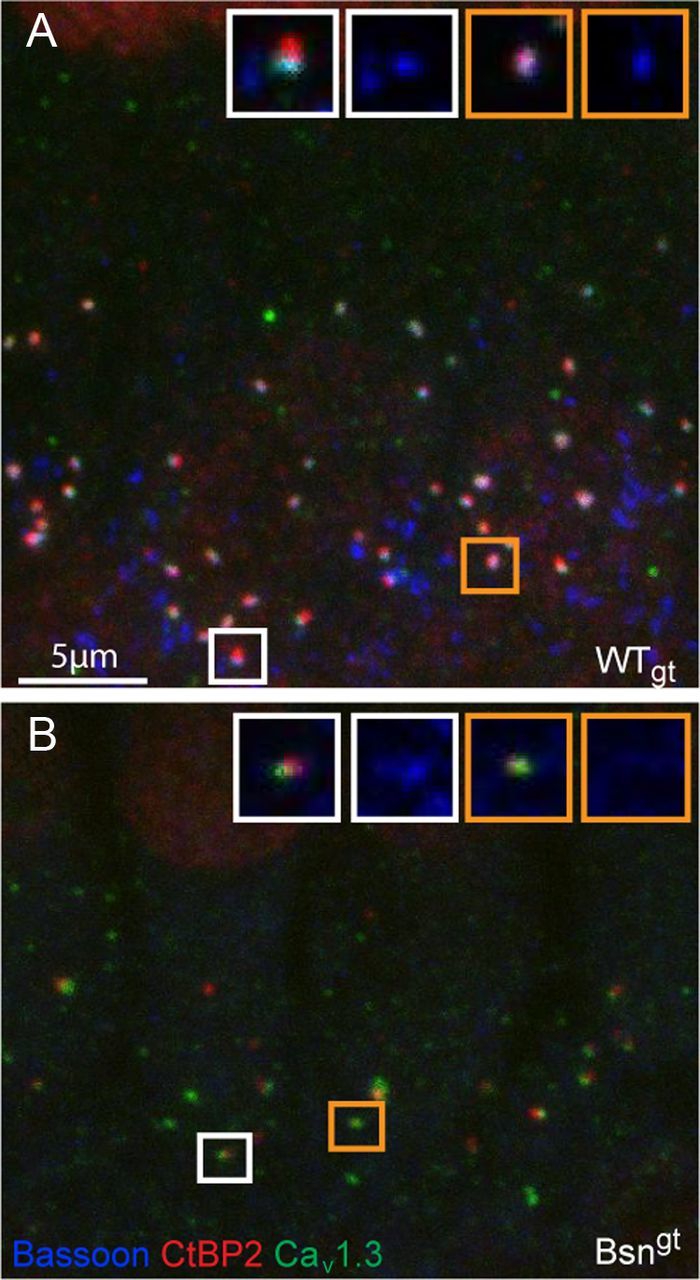
Residual expression of bassoon detected at a small subset of Bsngt synapses. A, At synapses of WTgt, IHCs immunolabeling of voltage-gated calcium channels (CaV1.3, green), synaptic ribbons (CtBP2, red), and bassoon (blue) resulted in a “sandwich-like” juxtaposition of fluorescent spots. Additional bassoon-positive, but CtBP2- and CaV1.3-negative, spots represent efferent synapses contacting SGN. Insets show two representative examples (white and golden frames, respectively) at higher magnification with all three channels (left) and bassoon channel only (right). Bassoon was clearly detectable at both synapses. B, At Bsngt synapses, colocalization of bassoon with other synaptic markers rarely detectable by eye. Labeling is as in A. Insets demonstrate a weakly bassoon-positive synapse (white frames) and another synapse in which bassoon immunofluorescence did not exceed background (golden frames).
In conclusion, the results of our RT-PCR experiments suggested that there was a small amount of leaky expression of bassoon in Bsngt IHCs that was, however, rarely detectable with immunohistochemistry. The presence of a few molecules of bassoon protein may support ribbon anchorage, albeit with looser coupling than at normal IHC ribbon synapses. This could explain the less severe ribbon anchorage phenotype in Bsngt compared with BsnΔEx4/5 mutants.
CaV1.3 Ca2+ channels and AMPA receptors at ribbon-occupied and ribbonless synapses
We also investigated the effects of bassoon disruption on the presynaptic Cav1.3 Ca2+ channels and postsynaptic AMPA receptor clusters in Bsngt IHCs. We used immunohistochemistry for ribbons (CtBP2), Cav1.3 Ca2+ channels, and GluA2 (Fig. 1) for unequivocal definition of synaptic labeling and demonstrated a reduction of CaV1.3 immunofluorescence compared with WTgt that was more pronounced at ribbonless synapses based on a large number of ribbon-occupied and ribbonless Bsngt synapses (quantified in Fig. 3A). In another high-quality set of confocal images of IHCs from adult mice (p85) double stained for Cav1.3 and GluA2 (Fig. 3B), we analyzed WTgt (n = 253) and Bsngt (n = 245) synapses. We used GluA2 colabeling to differentiate synaptic Cav1.3 clusters from extrasynaptic immunoreactivity and measured the extracellular background Cav1.3 immunofluorescence to subtract the nonspecific signal within each image. We found a tendency for a greater proportion of extrasynaptic Cav1.3 immunofluorescence in IHCs lacking bassoon, estimated on average to be 33.8 ± 8% in WTgt and 38.5 ± 15% in Bsngt; however, this did not reach significance. This is consistent with our previous conclusions from functional analysis in BsnΔEx4/5 IHCs (Frank et al., 2010).
Figure 3.

Altered presynaptic Ca2+ channel clusters and near normal postsynaptic AMPA receptor clusters at IHC synapses of Bsn mutants. A, Cav1.3 immunofluorescence in Bsngt IHCs (violet, n = 108 Bsngt ribbonless synapses; red, n = 108 Bsngt ribbon-occupied synapses) had reduced intensity compared with WTgt (black, n = 105 synapses). The analysis shown is derived from one representative pair of triple-stained samples as shown in Figure 1. Ribbon-occupied BSNgt synapses harbor more Cav1.3 immunofluorescence than ribbonless synapses but less than WTgt. B, Pair of double-stained preparations demonstrating the reduction in synaptic Cav1.3 (green), but not GluA2 receptor (blue), immunofluorescence. C, Distributions of GluA2 cluster immunofluorescence intensities of Bsngt and WTgt synapses overlapped (same preparation and color-codes as in A. D, Stimulated emission depletion microscopy demonstrating that ribbon-occupied and ribbonless synapses retained the ring-like morphology of GluA2/3 clusters (blue) in BsnΔEx4/5 synapses, albeit with a slightly smaller diameter in the absence of a presynaptic ribbon (CtBP2, red, confocal mode).
Whereas the Cav1.3 immunofluorescence spots were significantly less intense in Bsngt compared with those of WTgt, the mean intensities of GluA2 spots were not significantly different between genotypes and the distributions were nearly indistinguishable regardless of the presence of a ribbon (Fig. 3B,C). In agreement with previous work (Meyer et al., 2009), we observed a ring-like GluA2 immunofluorescence in stimulated emission depletion images of WT synapses (Fig. 3D, upper left), which was in principle maintained at both ribbon-occupied and ribbonless synapses of BsnΔEx4/5 mutant mice (Fig. 3D, lower left). However, quantitative analysis indicated a slightly smaller ring diameter of ribbonless mutant synapses compared with ribbon-occupied mutant synapses (Fig. 3D, right; distance between peaks of average line profiles 528 ± 31 nm vs 691 ± 60 nm; p < 0.05; n = 10, 9, and 27 for WTΔEx4/5, BsnΔEx4/5 ribbon-occupied, and ribbonless mutant synapses, respectively). In summary, IHCs of Bsn mutants contained as many afferent synapses as their WT littermates and appeared to exhibit a normal number of postsynaptic AMPA receptors, whereas a subtle change in the shape of the AMPA receptor cluster was found in ribbonless BsnΔEx4/5 synapses. Synapses from both mutants held fewer Ca2+ channels than WT and BSNgt ribbonless synapses had a lower Ca2+ channel complement than BSNgt ribbon-occupied synapses.
Effects of bassoon disruption on synaptic function: in vitro analysis
We also compared Ca2+ currents and exocytosis in Bsngt and BsnΔEx4/5 IHCs of 3- to 4-week-old mice (p22–p32) in perforated patch recordings to assess whether the larger fraction of ribbon-occupied synapses in Bsngt IHCs was associated with better presynaptic function than in BsnΔEx4/5 IHCs. Indeed, we found the Ca2+ currents of Bsngt IHCs to be intermediate between WT and BsnΔEx4/5 IHCs (Fig. 4A; p < 0.01 for comparison of Bsngt vs BsnΔEx4/5, both p < 0.01 vs WT) without any obvious difference in voltage dependence. In both mutants, exocytosis, measured as membrane capacitance increments in response to 20 ms (primarily recruiting the RRP) or 100 ms long depolarizations (to assess sustained exocytosis), was significantly reduced (p < 0.01; Fig. 4B–D). There was no significant difference between the responses of the Bsngt and BsnΔEx4/5 IHCs to 20 ms depolarizations, suggesting a similar reduction of RRP exocytosis despite the different fraction of ribbon-occupied synapses (Fig. 4C). However, sustained exocytosis (approximated as the difference between ΔCm100 and ΔCm20) was less affected in Bsngt IHCs (Fig. 4D, 67% of WTgt) than in BsnΔEx4/5 IHCs (56% of WTΔEx4/5). Direct comparison revealed significantly more sustained exocytosis in Bsngt than in BsnΔEx4/5 IHCs (p < 0.01 for comparison of ΔCm100-ΔCm20 between Bsngt and BsnΔEx4/5, p < 0.05 for comparing just ΔCm100).
Figure 4.

Patch-clamp analysis of IHC presynaptic function. A, Ca2+current–voltage relationships from WTgt (black closed circles, n = 24 IHCs), Bsngt (black open circles, n = 26), WTΔEx4/5 (gray closed circles, n = 43), and BsnΔEx4/5 IHCs (gray open circles, n = 46). Peak Ca2+ currents were reduced to 71% of the value in WT littermates in BsnΔEx4/5 (p < 0.001) and to 80% in Bsngt (p < 0.01), respectively. B, representative original capacitance recordings (bottom) from IHCs illustrating a comparable reduction in capacitance jumps after 20 ms depolarizations in Bsn mutants compared with WT IHC (mean reduction of 40% in BsnΔEx4/5 and 44% in Bsngt). IHCs were depolarized to the membrane potential eliciting the maximum Ca2+ current (top). Replacing endogenous intracellular buffers (“endo” line) by 5 mm [EGTA]i (dashed lines) resulted in a comparable relative amount of suppression of exocytosis in all genotypes. C, RRP exocytosis (20 ms depolarizations) was reduced to a similar extent in both mutants (endogenous buffer, 3 wk; WTgt: n = 24 IHCs, Bsngt: n = 24 IHCs, WTΔEx4/5: n = 38 IHCs, BsnΔEx4/5 IHCs: n = 37 IHCs). Unaffected RRP exocytosis in heterozygous BsnΔEx4/5 IHCs argues against a dominant-negative effect of the 180 kDa bassoon protein fragment on vesicle fusion (see text; endogenous buffer, 8 wk; WTΔEx4/5: n = 7 IHCs, HzΔEx4/5: n = 10 IHCs, BsnΔEx4/5 IHCs: n = 9 IHCs). Similar relative reduction of exocytosis across genotypes in the presence of 5 mm [EGTA]i suggests comparable coupling of vesicle fusion to presynaptic Ca2+ influx in both mutants (EGTA 3 wk; WTgt: n = 10 IHCs, Bsngt: n = 9 IHCs, WTΔEx4/5: n = 17 IHCs, BsnΔEx4/5 IHCs: n = 16 IHCs). D, Sustained exocytosis was more severely affected in BsnΔEx4/5 than in Bsngt IHCs. Sustained exocytosis was assessed by (cell-wise) subtraction of capacitance jumps after 20 ms depolarizations from corresponding 100 ms counterparts (endogenous buffer, 3 wk; WTgt: n = 24 IHCs, Bsngt: n = 25 IHCs, WTΔEx4/5: n = 38 IHCs, BsnΔEx4/5 IHCs: n = 36 IHCs). [EGTA]i (5 mm) had comparable effects on both mutants (p > 0.05, EGTA 3 wk; WTgt: n = 8 IHCs, Bsngt: n = 9 IHCs, WTΔEx4/5: n = 11 IHCs, BsnΔEx4/5 IHCs: n = 11 IHCs). E, Paired pulse measurements showing that recovery from RRP depletion was slowed in both mutants, but to a lesser extent in Bsngt IHCs. Graph shows the grand average ratio of two capacitance jumps in response to two depolarization pulses of 20 ms duration at varying interpulse intervals (WTgt: n ≥ 20 IHCs, Bsngt: n ≥ 13 IHCs WTΔEx4/5: n ≥ 23 IHCs, BsnΔEx4/5 IHCs: n ≥ 20 IHCs, number provides minimum available for all intervals).
We also compared IHCs of heterozygote mice (HZΔEx4/5) with those of WTΔEx4/5 mice for their response to 20 ms depolarization and found no significant differences (Fig. 4C), suggesting that the BsnΔEx4/5 allele does not cause a dominant-negative phenotype. Intracellular application of 5 mm EGTA in whole-cell recordings did not cause a stronger relative suppression of exocytosis in either Bsn mutant compared with perforated patch, suggesting an unaltered tight coupling between synaptic Ca2+ channels and release ready vesicles (Fig. 4B–D). Finally, we found by paired pulse stimulation (20 ms pulses separated by different intervals) in perforated patch experiments that recovery of exocytosis after RRP depletion in Bsngt IHCs was slower than in WTgt IHCs (p < 0.01 for 100 ms interval), but faster than in BsnΔEx4/5 IHCs (p < 0.05, Fig. 4E). Recovery of exocytosis after 100 ms depolarization of Bsngt IHCs was not significantly different from WTgt, although a trend toward slower recovery was apparent (data not shown). We conclude that bassoon disruption leads to reduced Ca2+ influx and hair cell exocytosis, which, except for RRP exocytosis, is less pronounced in Bsngt mice than in BsnΔEx4/5 mice.
We also performed whole-cell recordings from postsynaptic afferent boutons of type I SGNs at postnatal days 9–11 (Figs. 5, 6). We chose the BsnΔEx4/5 strain for these challenging experiments because of their stronger phenotype compared with BSNgt. At this age, BsnΔEx4/5 IHCs still have almost half as many synaptic ribbons associated with GluA2-positive clusters compared with WTΔEx4/5 (on average, 5.1 in BsnΔEx4/5, n = 53 IHCs, 4 ears; 10.7 in WTΔEx4/5, n = 44 IHCs, 3 ears). In agreement with the impaired exocytosis and vesicle replenishment in IHCs of Bsn mutants, we found a reduced rate of EPSCs at rest (0.11 ± 0.03 Hz in BsnΔEx4/5, n = 7 boutons; 0.79 ± 0.26 Hz in WTΔEx4/5, n = 8 boutons, p < 0.05) and during application of 40 mm K+ (0.59 ± 0.34 Hz in BsnΔEx4/5, n = 5 boutons; 10.9 ± 3.70 Hz in WTΔEx4/5, n = 5 boutons, p < 0.05, Fig. 5C,D). EPSCs of WTΔEx4/5 and BsnΔEx4/5 SGNs were variable in size and shape (Fig. 5C,E), as described previously in the rat and interpreted as MQR (Glowatzki and Fuchs, 2002). Every bouton of BsnΔEx4/5 SGNs, like those of WTΔEx4/5, showed both small EPSCs with smooth rise and fall (monophasic) as well as larger EPSCs with more complex waveform (Fig. 5F, multiphasic). No segregation into different groups of SGNs (e.g., ribbon-occupied vs ribbonless) was observed, but this analysis was hindered by the paucity of events. The amplitudes of both monophasic EPSCs (81 ± 10 pA in BsnΔEx4/5, n = 7 SGN; 142 ± 22 pA in WTΔEx4/5, n = 8 SGN, p < 0.05, Fig. 6A1,B) and multiphasic EPSCs (66 ± 11 pA in BsnΔEx4/5; 105 ± 14 pA in WTΔEx4/5, p < 0.05, Fig. 6A2,B), as well as the synaptic charge transfer of the entire EPSC population (117 ± 8 fC in BsnΔEx4/5; 191 ± 27 fC in WTΔEx4/5, p < 0.05, Fig. 6C,D), were on average nearly twofold smaller in BsnΔEx4/5 SGNs. The kinetics of monophasic and multiphasic EPSCs was unaltered (Fig. 6E–H). Together with the barely changed postsynaptic GluA2 immunofluorescence, these results are compatible with a role of bassoon and/or the synaptic ribbon in promoting MQR.
Figure 6.

Analysis of EPSC size, kinetics, and waveforms. A, Pooled amplitude distribution of monophasic (A1) and multiphasic (A2) EPSCs and their grand averages (B). The distribution from BsnΔEx4/5 (open bars) SGNs are shifted to smaller amplitudes compared with WTΔEx4/5 (gray bars), producing a significantly smaller mean amplitude, but the range of observed amplitudes was unchanged. C, D, Pooled charge transfer distributions (C) and their grand averages (D) of monophasic and multiphasic EPSCs derived from BsnΔEx4/5 (gray) SGNs are reduced compared with WTΔEx4/5; however, the range was unchanged. E–H, The rise and decay times of monophasic EPSCs (E,F) and the time to peak and half-width of multiphasic EPSCs (G,H) from BsnΔEx4/5 boutons were not significantly different from those of WTΔEx4/5 SGNs.
Impaired sound coding in SGNs of Bassoon mice: in vivo analysis
To determine the functional consequences of the observed alterations in synaptic morphology and in vitro function, we analyzed in vivo sound encoding in SGNs in Bsngt and BsnΔEx4/5 mice and their respective WT littermates. Previously, we observed in BsnΔEx4/5 mice that firing rates were reduced in proportion with the reduction of presynaptic rate of exocytosis and RRP size (Buran et al., 2010; Frank et al., 2010). In the present study, we sought to test for better sound coding in a population of Bsngt SGNs that could reflect encoding at ribbon-occupied synapses, which are more abundant in these mice. For a most reliable comparison, we studied the responses of SGNs from Bsngt, BsnΔEx4/5, HZΔEx4/5, WTΔEx4/5, and WTgt to sound stimulation under identical experimental conditions. After isolating noise-stimulated single neuron firing activity near the internal auditory canal, we first characterized each unit by assessing their spontaneous rates (firing rates in the absence of sound stimuli), tuning curves, and responses to suprathreshold tone bursts at the CF of each unit and thereby identified SGNs. The hearing frequency range differed for the two mouse strains, presumably due to differences in the genetic background (Fig. 7A). No significant differences were observed for hearing thresholds (Fig. 7A), quality of tuning, or distortion product otoacoustic emissions (data not shown), arguing against a defect of cochlear amplification. Both mutants mostly lacked SGNs with high spontaneous rates (Fig. 7B). In response to 50 ms tone burst stimulation at 30 dB above threshold at CF, SGNs showed a high instantaneous firing rate at stimulus onset that was followed by adaption (Fig. 7C), probably reflecting partial depletion of the RRP (Moser and Beutner, 2000; Goutman and Glowatzki, 2007; Buran et al., 2010) to a steady firing rate sustained throughout the stimulus duration. After the end of the stimulus, the firing rate dropped to almost zero, followed by a recovery of spontaneous activity if present. Bsngt and BsnΔEx4/5 SGNs showed virtually identical response patterns with similar adaptation time constants (Fig. 7D). We did not observe any segregation of groups of Bsngt SGNs that would possibly indicate a difference between ribbon-occupied and ribbonless synapses. On average, evoked firing rates were significantly reduced by factors of 1.5 and 1.6, respectively, for Bsngt and BsnΔEx4/5 (Fig. 7D), and no significant differences between Bsngt and BsnΔEx4/5 SGNs were observed.
Figure 7.

Basic characterizations of SGN responses in vivo. A, Best thresholds of individual SGNs of Bsngt (red, n = 45 SGNs), BsnΔEx4/5 (purple, n = 31), and WT animals (black, n = 29 for WTgt and gray, n = 23 for WTΔEx4/5) as determined from the tuning curves tended to be elevated in both mutants compared with their respective WT controls (p > 0.05). B, Spontaneous spike rates are significantly reduced in SGNs from both mutant strains. C, Illustration of the firing pattern of representative WTgt (black, top), Bsngt (red, middle), and BsnΔEx4/5 (violet, bottom) SGNs in response to 200 repetitions of a 50 ms tone burst presented at CF, 30 dB above thresholds. Each dot indicates a single action potential. D, Averaged poststimulus time histograms of SGN responses show a preserved activation pattern but reduced action potential firing rates in both mutants. Rapid and short-term adaptation time constants (double exponential fit for individual SGNs) were not significantly different. Inset: Onset and adapted rates (averaged in the 10 ms windows indicated by green bars) in all mutant SGNs were in the lower normal range. Responses from HzΔEx4/5 SGNs (light gray line/gray open circles, n = 16) were indistinguishable from WT.
The spike rate reduction in both mutants was also obvious when examining average rates in responses to tone bursts of varying sound pressure levels at CF (Fig. 8A). These rate level functions had a shallower slope in both mutants and the dynamic range, the range of sound intensities over which 80% of the difference in rate between spontaneous and maximum occurs (Sachs et al., 1989), tended to be broader in the individual SGNs of both mutants (Fig. 8A–C). The increase in dynamic range was more pronounced in Bsngt mice, but a tendency was also found in BsnΔEx4/5 mice.
Figure 8.

SGN responses in vivo: dynamic range and recovery from forward masking. A1, A2, Quantification of the overall spike rate in response to tone bursts presented at CF at varying sound intensities again demonstrate reduced spontaneous and sound-evoked spiking activity in Bsngt (red, n = 32) SGNs compared with WTgt (black, n = 20) and in BsnΔEx4/5 (violet, n = 27) compared with WTΔEx4/5 (gray, n = 20). Thresholds were not significantly different. Inset: Dynamic range is defined as the range of sound pressure levels in which the rate–intensity function exhibits a rate increase between 10% and 90% of the difference between spontaneous and maximal rate. B, Dynamic ranges of Bsn mutant SGNs were broader compared with WT (significant for Bsngt). C, Top, illustration of the stimulus paradigm for forward masking experiment: 100 ms masker tone burst and a 15 ms probe tone burst are separated by a silent interval of varying duration. Both tone bursts are presented at CF, 30 dB above threshold. The duration of a complete cycle is 500 ms. Bottom, firing rates in response to the 15 ms probe stimulus presented as the fraction firing rate in the first 15 ms of the masker response indicate that the time course of recovery from forward masking was similar in all genotypes (n = 29 for Bsngt, n = 16 for WTgt, n = 17 for BsnΔEx4/5, n = 12 for WTΔEx4/5).
Finally, we studied recovery from forward masking by 100 ms tone bursts (Harris and Dallos, 1979; Fig. 8C). The masker elicits rapid adaptation that we attribute to depletion of the presynaptic RRP of vesicles and recovery, as revealed by the probe stimulus of identical intensity, that most likely reflects the replenishment of the RRP after the tone has ceased. According to the postulated roles of bassoon and/or the synaptic ribbon in vesicle replenishment (Frank et al., 2010; Hallermann et al., 2010) that was also indicated by our capacitance recordings (Fig. 4), we expected a slower recovery from masking that might be less pronounced in Bsngt mice. However, we found similar time courses of recovery in Bsngt, BsnΔEx4/5, and WT littermate controls, which might indicate that vesicle replenishment of the smaller RRP at physiological temperature in vivo was sufficient.
Effect of bassoon disruption on auditory systems population responses
To assess the impact of spike rate reduction and spike asynchrony at the population level, we next analyzed ABR, of which wave I reflects the compound action potential of the SGNs (Melcher and Kiang, 1996; Melcher et al., 1996a, 1996b). Spike rate and spike synchrony of activated SGN determine the latency, width, and amplitude of the compound action potential. The sound pressure levels evoking a reproducible threshold response were significantly elevated by approximately the same degree in Bsngt and BsnΔEx4/5 mutants compared with the respective WT littermates (Fig. 9A). ABR thresholds of Bsngt mice were slightly elevated compared with those of BsnΔEx4/5 mice, but because a similar increase was also found for WTgt mice compared with WTΔEx4/5 mice, this may have resulted from the different genetic backgrounds. The ABR waveforms evoked by suprathreshold click stimulation (80 dB peak equivalent) were comparable in Bsngt and BsnΔEx4/5 mutants (Fig. 9B) and showed a massive reduction of wave I indicating a major reduction of synchronized activation of the SGNs, which is consistent with our results from single SGN recordings. A small potential preceding ABR wave I (probably representing the summating potential that primarily reflects the hair cell receptor potential) was unaffected in both mutants. We observed reduced amplitudes and a slight delay in latencies of all waves at all stimulus intensities. However, the amplitudes of central auditory responses (II and higher) were better preserved, possibly reflecting some degree of compensation by convergence of SGNs onto the neurons of the cochlear nucleus and/or homeostatic plasticity in the auditory brainstem nuclei. ABRs from all genotypes showed a comparable amplitude reduction when the click stimulus rate was increased from 20 to 100 Hz (data not shown). In summary, no significant differences were detected between Bsngt and BsnΔEx4/5 mutants despite an approximate twofold difference in the number of anchored ribbons per IHC.
Figure 9.

Auditory brainstem responses. A, ABR thresholds for click and 12 kHz tone burst stimuli are shifted to a comparable degree in Bsngt and BsnΔEx4/5 animals compared with their respective littermates, the latter displaying strain-dependent differences. B, Grand averages of ABR waves in response to 100 dB (mutants) or 80 dB (WT) click stimuli from Bsngt (red, n = 7) and BsnΔEx4/5 (purple, n = 6) mutants and WTgt (black, n = 9) and WTΔEx4/5 (gray, n = 6) controls, illustrating a pronounced reduction in amplitudes and minimal delay of all ABR peaks. ABR waveforms in BsnΔEx4/5 heterozygous animals were equivalent to WTΔEx4/5 (data not shown).
Discussion
Each individual IHC ribbon synapse can drive spiking of a SGN at an instantaneous rate of up to 1 kHz at sound onset and up to a few hundred Hertz during sustained sound stimulation. Moreover, spike timing displays submillisecond precision (Kiang et al., 1965; Geisler, 1998). The molecular mechanisms underlying such vivid, sustained, and precise transmitter release are not well understood. Here, we took advantage of two genetic manipulations that disrupt bassoon, a key scaffold protein at the IHC active zone, to different extents. We propose that weak residual presence of bassoon at active zones of IHCs in Bsngt mice enabled better, but still disturbed, ribbon anchorage and maintained some aspects of synapse function beyond what we found in BsnΔEx4/5 mice, which express only a nonfunctional bassoon fragment. However, other measures of synaptic function, in particular synaptic sound encoding in SGNs, were affected to the same extent. We did not observe a subpopulation of SGNs with WT-like firing rates, which would be expected if the ribbon-occupied synapses of mature Bsngt (44%) or BsnΔEx4/5 (12%) mice were fully functional. Possible explanations include an impaired function of these synaptic ribbons due to looser anchorage or a ribbon-independent effect of the bassoon disruption on synaptic function.
Does the altered EPSC size distribution indicate a role of the ribbon in synchronizing MQR?
A role of the ribbon to promote the synchronous release of multiple vesicles (MQR) has been suggested since 1994, when Heidelberger et al. implied compound fusion to explain the instantaneous exocytosis of a retinal bipolar ribbon's complement of synaptic vesicles upon flash photolysis of caged Ca2+. Nevertheless, proving this concept has remained challenging. For example, electron microscopical reports of large membranous organelles at the ribbon synapse (Lenzi et al., 2002; Matthews and Sterling, 2008) could either reflect compound exocytosis or bulk endocytosis. The loss of synaptic ribbons from IHC synapses in BsnΔEx4/5 mice (47% of WTΔEx4/5 at p11) offered direct access to address the role of the ribbon in MQR. Just as originally described for prehearing rats (Glowatzki and Fuchs, 2002), we found broad and positively skewed EPSC amplitude distributions in prehearing WT mice (Fig. 6; Pangršič et al., 2010). The EPSC amplitude distribution of BsnΔEx4/5 boutons covered the normal range, but the mean amplitude was lower and fewer EPSCs exceeded 100 pA. The kinetics of monophasic and multiphasic EPSCs were unchanged. Therefore, the ribbon and/or functional bassoon seem to be supportive of, but not indispensable for, MQR. The smaller RRP in BsnΔEx4/5 IHCs results in a longer and more variable first exocytosis latency (Khimich et al., 2005; Wittig and Parsons, 2008; Buran et al., 2010) and a smaller EPSC size, which is expected to further slow and time vary postsynaptic spike generation (Rutherford et al., 2012). Both mechanisms explain the longer and more variable SGN first spike latency in vivo in BsnΔEx4/5 mice (Buran et al., 2010). Therefore, by promoting MQR, bassoon and/or the synaptic ribbon could contribute to fast and precise sound encoding at the first afferent synapse in the auditory pathway.
Bassoon is critical for anchoring synaptic ribbons in IHCs and auditory coding
The most prominent morphological change of photoreceptor and hair cell ribbon synapses in BsnΔEx4/5 mutants is the loss of synaptic ribbons. Dick et al. (2003) argued that in photoreceptors, ribbons are absent from the start, because during synapse formation, the number of ribbon-occupied synapses is already low. In contrast, in IHCs, we found a gradual decrease of ribbon-occupied synapses from ∼47% at the onset of hearing (Fig. 5) to 22% at 3 weeks of age (Frank et al., 2010) to 12% at 10 weeks of age (Khimich et al., 2005). Therefore, we consider it more likely that in BsnΔEx4/5 IHCs, ribbons are initially present at most active zones, but cannot be stabilized there in the absence of functional bassoon.
Bsngt IHCs maintained a higher fraction of ribbons (44%) throughout their development. In these mutants, a transcription termination sequence (gene trap) was inserted between exons 1 and 2, strongly reducing bassoon expression such that no protein was detected in Western blots from the brain (Hallermann et al., 2010). The observation of weak bassoon immunofluorescence at few Bsngt IHC synapses (Fig. 2) and the finding of bassoon mRNA in real-time PCR reflect leaky expression of a small amount of bassoon that supports the long-term anchorage of a fraction of ribbons. Alternatively, the remaining 180 kDa protein fragments composed of the fused N- and C-terminal domains may exert a dominant-negative effect in BsnΔEx4/5 mice, in which only the central exons 4 and 5 of the bassoon gene in (including the RIBEYE-binding site; tom Dieck et al., 2005) are deleted. However, this fragment does not seem to localize to synapses (Altrock et al., 2003; Frank et al., 2010), such that it presumably cannot assume an aberrant scaffolding function even if it was capable of interaction. Normal hair cell exocytosis (Fig. 4) and spontaneous and evoked SGN spike rates (Fig. 7) and near-normal ABRs (Fig. 9) in heterozygous animals further argue against a dominant-negative effect of the truncated protein in BsnΔEx4/5.
Because ribbon-occupied synapses showed abnormal but stronger CaV1.3 immunofluorescence than ribbonless synapses in Bsngt (Fig. 3) and BsnΔEx4/5 mice (Frank et al., 2010), the lesser reduction of whole-cell Ca2+current than in BsnΔEx4/5 IHCs is consistent with the higher fraction of ribbon-occupied synapses and/or residual bassoon expression. In both Bsn mutants, rapid exocytosis and evoked spike rates were approximately halved, with no relative changes in adaptation or recovery from adaptation. Computational modeling suggested that the prevailing change of IHC synapses in BsnΔEx4/5 mice was a reduction in the number of functional release sites (Frank et al., 2010). The same appears to be true for the Bsngt mutant. In addition, we have now also observed broadened rate-intensity functions of SGNs in both Bsn mutants. This effect was more prominent for the Bsngt mutant and extended beyond the broadening expected from the lower spontaneous rate of the mutant SGNs. Possible mechanisms explaining this difference include disproportionate changes in the numbers of Ca2+ channels and vesicular docking sites and the mild impairment of vesicle recruitment. In both cases, the release rate may vary over a broader range of stimulation intensities.
Ribbon or no ribbon: is that the question?
Although the IHCs of both Bsn mutants differed in the fraction of ribbon-occupied synapses, Ca2+ current, sustained exocytosis, and vesicle replenishment in vitro, sound coding in vivo was equally impaired. It is unclear at present why vesicle replenishment in Bsngt IHCs was better preserved only in vitro. This may be partly explained by differences in the experimental conditions, which may have favored the detection of subtle differences in the in vitro experiments. Indeed, the recovery time constant that we observed in vitro (140 ms for the fast and largest component of recovery, Moser and Beutner, 2000) was much longer than in vivo (47 ms; Fig. 8). Preliminary forward-masking experiments at different body temperatures suggest a major contribution of the temperature difference between the in vitro (room temperature) and in vivo (35°C) experiments, whereas we have no indication of age-dependent changes in RRP recovery. In addition, spontaneous synaptic calcium influx is mostly abolished at a holding potential of −87 mV in vitro, but may occur at the higher resting potential in vivo and may enable calcium-dependent enhancement of vesicle replenishment to the synapse.
Because an explanation of why the larger fraction of ribbon-occupied synapses in Bsngt IHCs did not translate into a better preservation of all aspects of synaptic function, we favor the hypothesis that those remaining ribbons were not fully functional. Alternatively, the sound-coding phenotype of Bsn mutants could be due to a direct effect of bassoon disruption and may be unrelated to the presence or absence of the ribbon. The lack of binding of bassoon to CaV1.3 Ca2+ channels (Frank et al., 2010) and the mild (Hallermann et al., 2010) or absent (Mukherjee et al., 2010) alteration of presynaptic function by bassoon disruption at nonribbon type active zones make this scenario less likely. In contrast, our result of a larger center of mass distance between ribbons and CaV1.3 or AMPA receptor clusters at ribbon-occupied synapses supports the notion of a looser anchorage at ribbon-occupied synapses in Bsngt IHCs. Such an increased distance to the active zone could impair a putative function of the ribbon in promoting a large number of synaptic Ca2+ channels and docking sites and in facilitating vesicle replenishment. This could come about by the reduced effect of ribbon-associated proteins with functions in scaffolding or regulation of docking and priming. Future experiments using photoablation of the remaining ribbons in Bsngt IHCs could help to distinguish these possible scenarios. However, the low number of ribbon-occupied synapses (on average, 4.6), the low RRP size (∼7.6 fF), and the requirement for a ruptured patch configuration (where rundown of presynaptic function is more prominent (Parsons et al., 1994; Moser and Beutner, 2000; Nouvian et al., 2011) make these experiments very challenging. Nevertheless, the advent of combinatorial approaches offers a fair chance to eventually clarify the roles of this enigmatic synaptic nanomachine.
Footnotes
Funding support was from the Deutsche Forschungsgemeinschaft through the Collaborative Research Center 889 “Cellular Mechanisms of Sensory Processing” (Project A6 to N.S. and Project A2 to T.M.) and the Center for Nanoscopy and Molecular Physiology of the Brain (to T.M.), the Alexander von Humboldt Foundation (fellowship to M.A.R.), the Federal Ministry of Education and Research through the Bernstein Center for Computational Neuroscience Göttingen (Grant 01GQ1005A to T.M.), and MED-EL (fellowship to H.T.). We thank G. Hoch for programming of MATLAB-based image analysis routines, K. Reuter for help with real-time PCR, L.-T. Hsu for schematic illustrations, S. Thom for expert technical assistance, E. D. Gundelfinger and B. Kracht for providing Bsn mutant mice, B. Harke, A. Egner, and S. Hell for contributions to the acquisition and analysis of stimulated emission depletion images, and E. D. Gundelfinger and members of the InnerEarLab for discussions.
The authors declare no competing financial interests.
References
- Altrock WD, tom Dieck S, Sokolov M, Meyer AC, Sigler A, Brakebusch C, Fässler R, Richter K, Boeckers TM, Potschka H, Brandt C, Löscher W, Grimberg D, Dresbach T, Hempelmann A, Hassan H, Balschun D, Frey JU, Brandstätter JH, Garner CC, et al. Functional inactivation of a fraction of excitatory synapses in mice deficient for the active zone protein bassoon. Neuron. 2003;37:787–800. doi: 10.1016/s0896-6273(03)00088-6. [DOI] [PubMed] [Google Scholar]
- Buran BN, Strenzke N, Neef A, Gundelfinger ED, Moser T, Liberman MC. Onset coding is degraded in auditory nerve fibers from mutant mice lacking synaptic ribbons. J Neurosci. 2010;30:7587–7597. doi: 10.1523/JNEUROSCI.0389-10.2010. [DOI] [PMC free article] [PubMed] [Google Scholar]
- Dick O, tom Dieck S, Altrock WD, Ammermüller J, Weiler R, Garner CC, Gundelfinger ED, Brandstätter JH. The presynaptic active zone protein bassoon is essential for photoreceptor ribbon synapse formation in the retina. Neuron. 2003;37:775–786. doi: 10.1016/s0896-6273(03)00086-2. [DOI] [PubMed] [Google Scholar]
- tom Dieck S, Brandstätter JH. Ribbon synapses of the retina. Cell Tissue Res. 2006;326:339–346. doi: 10.1007/s00441-006-0234-0. [DOI] [PubMed] [Google Scholar]
- Dresbach T, Hempelmann A, Spilker C, tom Dieck S, Altrock WD, Zuschratter W, Garner CC, Gundelfinger ED. Functional regions of the presynaptic cytomatrix protein bassoon: significance for synaptic targeting and cytomatrix anchoring. Mol Cell Neurosci. 2003;23:279–291. doi: 10.1016/s1044-7431(03)00015-0. [DOI] [PubMed] [Google Scholar]
- Edmonds BW, Gregory FD, Schweizer FE. Evidence that fast exocytosis can be predominantly mediated by vesicles not docked at active zones in frog saccular hair cells. J Physiol. 2004;560:439–450. doi: 10.1113/jphysiol.2004.066035. [DOI] [PMC free article] [PubMed] [Google Scholar]
- Emran F, Rihel J, Adolph AR, Dowling JE. Zebrafish larvae lose vision at night. Proc Natl Acad Sci U S A. 2010;107:6034–6039. doi: 10.1073/pnas.0914718107. [DOI] [PMC free article] [PubMed] [Google Scholar]
- Frank T, Rutherford MA, Strenzke N, Neef A, Pangršič T, Khimich D, Fejtova A, Gundelfinger ED, Liberman MC, Harke B, Bryan KE, Lee A, Egner A, Riedel D, Moser T. Bassoon and the synaptic ribbon organize Ca2+ channels and vesicles to add release sites and promote refilling. Neuron. 2010;68:724–738. doi: 10.1016/j.neuron.2010.10.027. [DOI] [PMC free article] [PubMed] [Google Scholar]
- Fuchs PA. Time and intensity coding at the hair cell's ribbon synapse. J Physiol. 2005;566:7–12. doi: 10.1113/jphysiol.2004.082214. [DOI] [PMC free article] [PubMed] [Google Scholar]
- Geisler CD. From sound to synapse. New York: Oxford UP; 1998. [Google Scholar]
- Glowatzki E, Fuchs PA. Transmitter release at the hair cell ribbon synapse. Nat Neurosci. 2002;5:147–154. doi: 10.1038/nn796. [DOI] [PubMed] [Google Scholar]
- Goodman MB, Lockery SR. Pressure polishing: a method for re-shaping patch pipettes during fire polishing. J Neurosci Methods. 2000;100:13–15. doi: 10.1016/s0165-0270(00)00224-7. [DOI] [PubMed] [Google Scholar]
- Goutman JD, Glowatzki E. Time course and calcium dependence of transmitter release at a single ribbon synapse. Proc Natl Acad Sci U S A. 2007;104:16341–16346. doi: 10.1073/pnas.0705756104. [DOI] [PMC free article] [PubMed] [Google Scholar]
- Grant L, Yi E, Glowatzki Two modes of release shape the postsynaptic response at the inner hair cell ribbon synapse. J Neurosci. 2010;30:4210–4220. doi: 10.1523/JNEUROSCI.4439-09.2010. [DOI] [PMC free article] [PubMed] [Google Scholar]
- Graydon CW, Cho S, Li GL, Kachar B, von Gersdorff H. Sharp Ca2+ Nanodomains beneath the ribbon promote highly synchronous multivesicular release at hair cell synapses. J Neurosci. 2011;31:16637–16650. doi: 10.1523/JNEUROSCI.1866-11.2011. [DOI] [PMC free article] [PubMed] [Google Scholar]
- Hallermann S, Fejtova A, Schmidt H, Weyhersmüller A, Silver RA, Gundelfinger ED, Eilers J. Bassoon speeds vesicle reloading at a central excitatory synapse. Neuron. 2010;68:710–723. doi: 10.1016/j.neuron.2010.10.026. [DOI] [PMC free article] [PubMed] [Google Scholar]
- Harris DM, Dallos P. Forward masking of auditory nerve fiber responses. J Neurophysiol. 1979;42:1083–1107. doi: 10.1152/jn.1979.42.4.1083. [DOI] [PubMed] [Google Scholar]
- Heidelberger R, Heinemann C, Neher E, Matthews G. Calcium dependence of the rate of exocytosis in a synaptic terminal. Nature. 1994;371:513–515. doi: 10.1038/371513a0. [DOI] [PubMed] [Google Scholar]
- Hull C, Studholme K, Yazulla S, von Gersdorff H. Diurnal changes in exocytosis and the number of synaptic ribbons at active zones of an ON-type bipolar cell terminal. J Neurophysiol. 2006;96:2025–2033. doi: 10.1152/jn.00364.2006. [DOI] [PMC free article] [PubMed] [Google Scholar]
- Khimich D, Nouvian R, Pujol R, tom Dieck S, Egner A, Gundelfinger ED, Moser T. Hair cell synaptic ribbons are essential for synchronous auditory signalling. Nature. 2005;434:889–894. doi: 10.1038/nature03418. [DOI] [PubMed] [Google Scholar]
- Kiang NYS, Watanabe T, Thomas EC, Clark LF. Discharge patterns of single fibers in the cat's auditory nerve. Cambridge, MA: MIT; 1965. [Google Scholar]
- Lenzi D, Crum J, Ellisman MH, Roberts WM. Depolarization redistributes synaptic membrane and creates a gradient of vesicles on the synaptic body at a ribbon synapse. Neuron. 2002;36:649–659. doi: 10.1016/s0896-6273(02)01025-5. [DOI] [PubMed] [Google Scholar]
- Li GL, Keen E, Andor-Ardó D, Hudspeth AJ, von Gersdorff H. The unitary event underlying multiquantal EPSCs at a hair cell's ribbon synapse. J Neurosci. 2009;29:7558–7668. doi: 10.1523/JNEUROSCI.0514-09.2009. [DOI] [PMC free article] [PubMed] [Google Scholar]
- Liberman MC. Auditory-nerve response from cats raised in a low-noise chamber. J Acoust Soc Am. 1978;63:442–455. doi: 10.1121/1.381736. [DOI] [PubMed] [Google Scholar]
- LoGiudice L, Sterling P, Matthews G. Mobility and turnover of vesicles at the synaptic ribbon. J Neurosci. 2008;28:3150–3158. doi: 10.1523/JNEUROSCI.5753-07.2008. [DOI] [PMC free article] [PubMed] [Google Scholar]
- Matthews G, Fuchs P. The diverse roles of ribbon synapses in sensory neurotransmission. Nat Rev Neurosci. 2010;11:812–822. doi: 10.1038/nrn2924. [DOI] [PMC free article] [PubMed] [Google Scholar]
- Matthews G, Sterling P. Evidence that vesicles undergo compound fusion on the synaptic ribbon. J Neurosci. 2008;28:5403–5411. doi: 10.1523/JNEUROSCI.0935-08.2008. [DOI] [PMC free article] [PubMed] [Google Scholar]
- Melcher JR, Kiang NY. Generators of the brainstem auditory evoked potential in cat III: identified cell populations. Hear Res. 1996;93:52–71. doi: 10.1016/0378-5955(95)00200-6. [DOI] [PubMed] [Google Scholar]
- Melcher JR, Guinan JJ, Jr, Knudson IM, Kiang NY. Generators of the brainstem auditory evoked potential in cat II. Correlating lesion sites with waveform changes. Hear Res. 1996a;93:28–51. doi: 10.1016/0378-5955(95)00179-4. [DOI] [PubMed] [Google Scholar]
- Melcher JR, Knudson IM, Fullerton BC, Guinan JJ, Jr, Norris BE, Kiang NY. Generators of the brainstem auditory evoked potential in cat. I. An experimental approach to their identification. Hear Res. 1996b;93:1–27. doi: 10.1016/0378-5955(95)00178-6. [DOI] [PubMed] [Google Scholar]
- Meyer AC, Frank T, Khimich D, Hoch G, Riedel D, Chapochnikov NM, Yarin YM, Harke B, Hell SW, Egner A, Moser T. Tuning of synapse number, structure and function in the cochlea. Nat Neurosci. 2009;12:444–453. doi: 10.1038/nn.2293. [DOI] [PubMed] [Google Scholar]
- Moser T, Beutner D. Kinetics of exocytosis and endocytosis at the cochlear inner hair cell afferent synapse of the mouse. Proc Natl Acad Sci U S A. 2000;97:883–888. doi: 10.1073/pnas.97.2.883. [DOI] [PMC free article] [PubMed] [Google Scholar]
- Mukherjee K, Yang X, Gerber SH, Kwon HB, Ho A, Castillo PE, Liu X, Südhof TC. Piccolo and bassoon maintain synaptic vesicle clustering without directly participating in vesicle exocytosis. Proc Natl Acad Sci U S A. 2010;107:6504–6509. doi: 10.1073/pnas.1002307107. [DOI] [PMC free article] [PubMed] [Google Scholar]
- Neef A, Khimich D, Pirih P, Riedel D, Wolf F, Moser T. Probing the mechanism of exocytosis at the hair cell ribbon synapse. J Neurosci. 2007;27:12933–12944. doi: 10.1523/JNEUROSCI.1996-07.2007. [DOI] [PMC free article] [PubMed] [Google Scholar]
- Nouvian R, Beutner D, Parsons TD, Moser T. Structure and function of the hair cell ribbon synapse. J Membr Biol. 2006;209:153–165. doi: 10.1007/s00232-005-0854-4. [DOI] [PMC free article] [PubMed] [Google Scholar]
- Nouvian R, Neef J, Bulankina AV, Reisinger E, Pangršič T, Frank T, Sikorra S, Brose N, Binz T, Moser T. Exocytosis at the hair cell ribbon synapse apparently operates without neuronal SNARE proteins. Nat Neurosci. 2011;14:411–413. doi: 10.1038/nn.2774. [DOI] [PubMed] [Google Scholar]
- Pangrsic T, Lasarow L, Reuter K, Takago H, Schwander M, Riedel D, Frank T, Tarantino LM, Bailey JS, Strenzke N, Brose N, Müller U, Reisinger E, Moser T. Hearing requires otoferlin-dependent efficient replenishment of synaptic vesicles in hair cells. Nat Neurosci. 2010;13:869–876. doi: 10.1038/nn.2578. [DOI] [PubMed] [Google Scholar]
- Parsons TD, Sterling P. Synaptic ribbon. Conveyor belt or safety belt? Neuron. 2003;37:379–382. doi: 10.1016/s0896-6273(03)00062-x. [DOI] [PubMed] [Google Scholar]
- Parsons TD, Lenzi D, Almers W, Roberts WM. Calcium-triggered exocytosis and endocytosis in an isolated presynaptic cell: capacitance measurements in saccular hair cells. Neuron. 1994;13:875–883. doi: 10.1016/0896-6273(94)90253-4. [DOI] [PubMed] [Google Scholar]
- Quiroga RQ, Nadasdy Z, Ben-Shaul Y. Unsupervised spike detection and sorting with wavelets and superparamagnetic clustering. Neural Comput. 2004;16:1661–1687. doi: 10.1162/089976604774201631. [DOI] [PubMed] [Google Scholar]
- Remé CE, Young RW. The effects of hibernation on cone visual cells in the ground squirrel. Invest Ophthalmol Vis Sci. 1977;16:815–840. [PubMed] [Google Scholar]
- Rutherford MA, Pangršič T. Molecular anatomy and physiology of exocytosis in sensory hair cells. Cell Calcium. 2012;52:327–337. doi: 10.1016/j.ceca.2012.05.008. [DOI] [PubMed] [Google Scholar]
- Rutherford MA, Chapochnikov NM, Moser T. Spike encoding of neurotransmitter release timing by spiral ganglion neurons of the cochlea. J Neurosci. 2012;32:4773–4789. doi: 10.1523/JNEUROSCI.4511-11.2012. [DOI] [PMC free article] [PubMed] [Google Scholar]
- Sachs MB, Winslow RL, Sokolowski BH. A computational model for rate-level functions from cat auditory-nerve fibers. Hear Res. 1989;41:61–69. doi: 10.1016/0378-5955(89)90179-2. [DOI] [PubMed] [Google Scholar]
- Schmitz F. The making of synaptic ribbons: how they are built and what they do. Neuroscientist. 2009;15:611–624. doi: 10.1177/1073858409340253. [DOI] [PubMed] [Google Scholar]
- Schwarz K, Natarajan S, Kassas N, Vitale N, Schmitz F. The synaptic ribbon is a site of phosphatidic acid generation in ribbon synapses. J Neurosci. 2011;31:15996–16011. doi: 10.1523/JNEUROSCI.2965-11.2011. [DOI] [PMC free article] [PubMed] [Google Scholar]
- Sheets L, Trapani JG, Mo W, Obholzer N, Nicolson T. Ribeye is required for presynaptic CaV1.3a channel localization and afferent innervation of sensory hair cells. Development. 2011;138:1309–1319. doi: 10.1242/dev.059451. [DOI] [PMC free article] [PubMed] [Google Scholar]
- Singer JH, Lassová L, Vardi N, Diamond JS. Coordinated multivesicular release at a mammalian ribbon synapse. Nat Neurosci. 2004;7:826–833. doi: 10.1038/nn1280. [DOI] [PubMed] [Google Scholar]
- Snellman J, Mehta B, Babai N, Bartoletti TM, Akmentin W, Francis A, Matthews G, Thoreson W, Zenisek D. Acute destruction of the synaptic ribbon reveals a role for the ribbon in vesicle priming. Nat Neurosci. 2011;14:1135–1141. doi: 10.1038/nn.2870. [DOI] [PMC free article] [PubMed] [Google Scholar]
- Spiwoks-Becker I, Glas M, Lasarzik I, Vollrath L. Mouse photoreceptor synaptic ribbons lose and regain material in response to illumination changes. Eur J Neurosci. 2004;19:1559–1571. doi: 10.1111/j.1460-9568.2004.03198.x. [DOI] [PubMed] [Google Scholar]
- Strenzke N, Chanda S, Kopp-Scheinpflug C, Khimich D, Reim K, Bulankina AV, Neef A, Wolf F, Brose N, Xu-Friedman MA, Moser T. Complexin-I is required for high-fidelity transmission at the endbulb of Held auditory synapse. J Neurosci. 2009;29:7991–8004. doi: 10.1523/JNEUROSCI.0632-09.2009. [DOI] [PMC free article] [PubMed] [Google Scholar]
- Taberner AM, Liberman MC. Response properties of single auditory nerve fibers in the mouse. J Neurophysiol. 2005;93:557–569. doi: 10.1152/jn.00574.2004. [DOI] [PubMed] [Google Scholar]
- tom Dieck S, Altrock WD, Kessels MM, Qualmann B, Regus H, Brauner D, Fejtová A, Bracko O, Gundelfinger ED, Brandstätter JH. Molecular dissection of the photoreceptor ribbon synapse: physical interaction of Bassoon and RIBEYE is essential for the assembly of the ribbon complex. J Cell Biol. 2005;168:825–836. doi: 10.1083/jcb.200408157. [DOI] [PMC free article] [PubMed] [Google Scholar]
- von Gersdorff H, Vardi E, Matthews G, Sterling P. Evidence that vesicles on the synaptic ribbon of retinal bipolar neurons can be rapidly released. Neuron. 1996;16:1221–1227. doi: 10.1016/s0896-6273(00)80148-8. [DOI] [PubMed] [Google Scholar]
- Wald A. Sequential analysis. New York: Wiley; 1947. [Google Scholar]
- Wittig JH, Jr, Parsons TD. Synaptic ribbon enables temporal precision of hair cell afferent synapse by increasing the number of readily releasable vesicles: a modeling study. J Neurophysiol. 2008;100:1724–1739. doi: 10.1152/jn.90322.2008. [DOI] [PMC free article] [PubMed] [Google Scholar]